22institutetext: Astron, 7990AA Dwingeloo, The Netherlands
33institutetext: Onsala Space Observatory, Chalmers University of Technology, SE-439 92 Onsala, Sweden
The molecular gas content of the advanced S+E merger NGC 4441
Abstract
Context. Mergers between a spiral and an elliptical (S+E mergers) are poorly studied so far despite the importance for galaxy evolution. NGC 4441 is a nearby candidate for an advanced remnant of such a merger, showing typical tidal structures like an optical tail and two shells as well as two H i tails.
Aims. The study of the molecular gas content gives clues on the impact of the recent merger event on the star formation. Simulations of S+E mergers predict contradictory scenarios concerning the strength and the extent of an induced starburst. Thus, observations of the amount and the distribution of the molecular gas, the raw material of star formation, are needed to understand the influence of the merger on the star formation history.
Methods. 12CO and 13CO (1-0) and (2-1) observations were obtained using the Onsala Space Observatory 20 m and IRAM 30 m telescope as well as the Plateau de Bure interferometer. These data allow us to carry out a basic analysis of the molecular gas properties such as estimates of the molecular gas mass, its temperature and density and the star formation efficiency.
Results. The CO observations reveal an extended molecular gas reservoir out to 4 kpc, with a total molecular gas mass of . Furthermore, high resolution imaging shows a central molecular gas feature, most likely a rotating disc hosting most of the molecular gas (). This nuclear disc shows a different sense of rotation than the large-scale H i structure, indicating a kinematically decoupled core. We modeled the state of the interstellar medium with the radiative transfer code RADEX, using the ratios of the 12CO and 13CO lines. The results are consistent with a diffuse (cm-3) molecular medium with no significant indications for cold and dense cores of ongoing star formation. This is in agreement with the moderate star formation rate of found in NGC 4441. Under the assumption of a constant star formation rate, the gas depletion time is yr. NGC 4441 might be a nearby candidate for an early-type galaxy with a dominating A star population, a so-called E+A galaxy, being in a poststarburst phase several yr after a merger event.
Key Words.:
galaxies: interactions – galaxies: starburst – galaxies: individual: NGC 4441 – radio lines: galaxies – radio lines: ISM1 Introduction
Following the CDM models for galaxy evolution, mergers between
galaxies occur frequently and are essential to form the large galaxies
we see today
(e.g., Steinmetz 2003).
While most observational studies concentrate on mergers between two spiral
galaxies, simulations by Naab & Burkert (2000), Naab & Burkert (2001),
Khochfar & Burkert (2003) and Naab et al. (2006) revealed the
importance of mergers between a spiral and an elliptical (so-called S+E mergers)
for the formation of bright ellipticals. Observations of this class of mergers
are needed to investigate their relevance and influence on galaxy evolution.
The well studied major mergers of two gas-rich disc galaxies can lead to
ultraluminous
infrared galaxies (ULIRGs, ,
Sanders & Mirabel (1996)) because of
a merger-induced extreme starburst.
S+E mergers are
however poorly studied so far and thus, it is unclear
if starbursts generally occur in these mergers and how they evolve.
Besides the lack of observations,
models of S+E mergers are in strong disagreement concerning the prediction
of interaction-triggered enhanced star formation.
Weil & Hernquist (1993) predict a congregation of the gas in
the center of the
remnant galaxy, leading to a strong gas concentration and thus resulting in a
starburst, similar to ULIRGs but less intense.
Simulations by Kojima & Noguchi (1997) however predict a dispersion of gas
clouds which might
not lead to a starburst at all, because the density of the gas is too low for it
to
collapse and form new stars.
For the understanding of galaxy evolution it is necessary to know which
scenario is more realistic and in particular how S+E mergers influence the
stellar population content in the remnant. Observations of the molecular
gas can show the amount and extent of raw material for star formation. Investigations of the molecular gas content in interacting galaxies showed a concentration of the gas towards the centre and an increase of the gas mass compared to non-interacting galaxies (e.g., Braine & Combes 1992, 1993; Horellou & Booth 1997). In ULIRGs, the molecular gas forms compact nuclear rotating rings and discs, fueling the central starburst (e.g., Bryant & Scoville 1996; Downes & Solomon 1998; Bryant & Scoville 1999; Greve et al. 2006). It is not known so far whether this is also the case in S+E mergers.
One ’prototypical’ S+E merger candidate is NGC 4194, the Medusa. In the
optical we see a diffuse tail going to the north and on the opposite side two
stellar shells are visible, consistent with predictions. Molecular
gas is found out to 4.7 kpc away from the center,
i.e much more spread out than
in the case of a ULIRG
(Aalto & Hüttemeister 2000; Aalto et al. 2001). However, this galaxy is
clearly undergoing an intense
starburst phase, albeit not as intense as in ULIRGs
(Weistrop et al. 2004).
Here we present CO maps of another
S+E merger candidate, NGC 4441 (see Table 1) (see discussion of merger history in Manthey et al. 2008a).
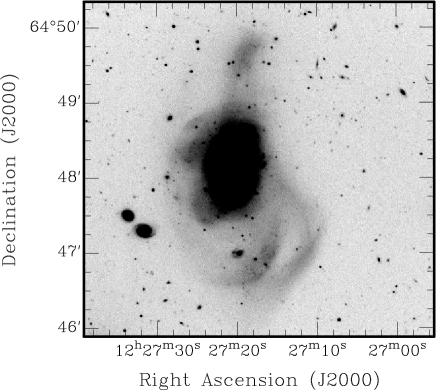
The optical morphology of this galaxy is very similar to the Medusa. It possesses one
tidal tail and two bright shells on the opposite side which is typical for S+E merger remnants (e.g., Quinn 1984; Dupraz & Combes 1985; Kojima & Noguchi 1997). The main body has an
elliptical shape (Bergvall 1981) with a small dust lane through
the center along the minor axis. In contrast to the strong similarities in
the optical morphology compared with the Medusa, the atomic gas distribution
is significantly different, since the H i forms two symmetric tidal tails
(compared to only one tail in the Medusa (Manthey et al. 2008b)).
In NGC 4441, the total H i mass is (Manthey et al. 2008a).
The ongoing star formation rate is rather low (), because the merger is in such
an advanced phase that most
of the gas has been already used for star formation (Manthey et al. 2005, 2008a).
Using optical spectra Bergvall (1981) found indications for
a period of enhanced star
formation in the past,
since the stellar population is younger than that of a normal
elliptical galaxy. Our own optical spectra confirm this and
we estimate that a moderate starburst occured 1 Gyr ago
(Manthey et al. 2005).
b The Hubble type is taken from de Vaucouleurs et al. (1995)
b taken from Manthey et al. (2008a).
| property | |
|---|---|
| RA (2000) | 12:27:20.3 |
| DEC (2000) | +64:48:05 |
| (km s-1) | 2722 |
| (Mpc) | 36 |
| typea | SAB0+ pec |
| 10.1 | |
| 5.4 | |
| SFRFIR () | 1.0 |
| SFR () | 2.4 |
| 1′ | 10.5 kpc |
2 Observations & data reduction
2.1 Onsala Space Observatory 20 m
First 12CO(1-0) observations were carried out in March 2003 using the 20 m telescope of the Onsala Space Observatory (OSO), Sweden. CO observations were done with a SIS–mixer and a correlator with a total bandwidth of 512 MHz. The main beam efficiency at 115 GHz is . To account for the highly variable sky background, the observations were done in the beam switching mode. The switching frequency was 1.8 Hz and the beam throw 11′. We observed the center position as given in Table 1 under good weather conditions, i.e. 30% humidity and clear, stable sky. The pointing and focus was regularly checked during the observations with the calibration sources R Leo and R Cas. Table 2 summarises the observations.
2.2 IRAM 30 m
Follow-up CO observations of NGC 4441 were done with the IRAM
30 m telescope on
Pico Veleta, Spain in July 2004. The weather conditions were good.
We mapped an extended CO distribution both in the 12CO(1-0) and (2-1)
line.
We used the A 100 and B 100 as well as the A 230 and B 230 receivers to
observe the 12CO(1-0) and (2-1) lines
simultaneously. The 1 MHz filterbank with
channels was chosen as a backend. The observations were done in
beam
switching mode. Pointing
and
focus calibration were regularly checked by observing Saturn. As a second
pointing source near NGC 4441, we observed the calibration source
0954+658. To get a proper spatial
coverage (a fully
sampled map) even in the
12CO(2-1) line, we mapped the center using a grid with a
spacing of
6″,
i.e. half the width of the 12CO(2-1) beam. For the outer positions, we
used
steps of 22″(full 12CO(1-0) beamwidth) to cover a
larger area, since we wanted to track the extent of the molecular gas.
In total, we observed 17 positions out to 44″. In the most distant
pointings we do not find emission any more, thus, we covered the
central molecular gas extent completely and are able to estimate source
size and total mass.
The central position was also observed in
13CO with the (1-0) and (2-1) transitions being measured simultaneously.
| obs. parameters | IRAM 30 m | OSO 20 m | PdB |
|---|---|---|---|
| (K) | 200-340 (12CO) | 350 | 180 |
| 145 (13CO) | – | – | |
| CO(1-0) | 22″ | 33″ | 3.25″ |
| CO(2-1) | 11″ | – | – |
| CO(1-0) | 21.0 km s-1 | 33.8 km s-1 | 6.6 |
| CO(2-1) | 21.0 km s-1 | – | – |
| 0.75 (1-0) / 0.52 (2-1) | 0.43 | 0.6-0.9 |
2.3 Plateau de Bure
To map the CO distribution at higher spatial resolution we obtained interferometric observations in December 2005, May and July 2007 using the Plateau de Bure interferometer (PdBI). The observations were done with a dual polarization receiver covering a bandwidth of 4 GHz with 240 channels and centered at the redshifted CO(1-0) line at 114.252 GHz. This leads to a resolution of 6.56 km s-1. The beamsize was 3.25″ 2.65″, the position angle 122∘. The primary beam at 115GHz is 45″. In total, we had an integration time of 16 hours on source The observations were done with the 6Cq–E10, 5Dq–W05 and 5Dq configurations. Flux, phase, and bandpass calibrators were 1044+719, 0418+380, 3C 273, and 3C 454.
2.4 Data reduction
The CLASS111Continuum and Line Analysis Single-dish Software,
http://www.iram.fr/IRAMFR/GILDAS/ package was used for the data reduction
at Onsala;
the IRAM CO data were reduced using
XS222ftp://yggdrasil.oso.chalmers.se/pub/xs/, a graphical reduction
and analysis software for mm spectral line data written by P.
Bergman. After checking the quality of each single
spectrum, the data were averaged with a
weighting based on
the
system temperature and integration time. A first-order baseline was fitted to
the resulting spectrum and subtracted. The data were converted to main beam
brightness temperature ()
using the beam efficiencies given in Table 2.
Finally, we smoothed
the spectra
to a velocity resolution of 21 km s-1 (IRAM) and 34 km s-1 (OSO),
respectively,
to achieve a better signal-to-noise
ratio in individual channels. For the different positions in the map we reached a noise
level of 1.6–5.3 mK, in the map the noise level lies
between 2.1 and 9.6 mK . For ,
noise levels are 0.7 mK (1-0) and 1.3 mK (2-1).
The Plateau de Bure data were reduced using the GILDAS task CLIC. After flagging and phase and flux calibration using the observed calibrator sources, a uv-table of the science data was created. The uv-table was then transformed into a map using a natural weighting scheme. This dirty map was CLEANed to correct for sidelobes. After CLEANing, the rms noise level in the cube is 2.9 mJy beam-1. Finally, moment maps were created from the CLEANed cubes using a clip value of = 0.012 Jy beam-1 .
3 Results
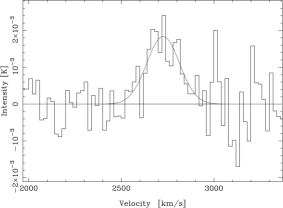
3.1 CO distribution and molecular mass
First OSO observations revealed a molecular gas content in the inner 33″of . The mass was derived by calculating the column density
| (1) |
and thus
| (2) |
with the CO- conversion factor,
the intensity of the CO line in Kelvin,
the mass of an molecule in kg and the
area covered by the beam in linear scales (cm2).
We used a ’standard’
conversion
factor of
,
referring to Strong et al. (1988).
Fig. 2 shows the observed CO spectrum.

Mapping NGC 4441 in CO with the IRAM 30 m telescope, we found a molecular
gas distribution extended in particular to the
south-east. Table 3 gives the pointings relative to
the center
position, the noise levels, the widths determined from Gaussians of both the 12CO(1-0) and CO(2-1)
lines and the integrated
intensities. In Fig. 3 and
Fig. 4 we
present the spectra of the mapped positions for both the 12CO(1-0) and
CO(2-1) lines.
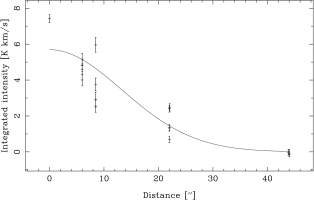
Under the assumption of a Gaussian distribution of the intensity, we plotted
the intensity
versus radial distance from
the center and
fitted a Gaussian to derive the source size (see Fig. 5 for
12CO(1-0)).
The real source size can be
estimated from the observed source size and the known beam size as
.
We derive a deconvolved source size of FWHM333full width of half maximum=22″ 1″(3.9 kpc) for 12CO(1-0).
The estimated
source
size for 12CO(2-1) is slightly larger (30″ 3″), but this is
probably an
artefact due to undersampling of the source coverage and lower
signal-to-noise ratios in this
transition. In our further discussion,
we assume an
identical extent of 12CO(2-1) and (1-0).
We determined a central column density of
and calculated a total molecular gas
mass
of , according to equations (1) and (2).
Since we found extended gas to the south and east (see
Fig. 3 and Fig. 4) but only
tentative detections to the north and west, the source seems to be asymmetric.
However, the estimated mass is in good agreement with the total mass derived from the OSO observations, which due to the larger beam cover the whole area of CO emission.
| RA | DEC | ||||||
| (′′) | (′′) | (mK) | (km s-1) | (K km s-1) | (mK) | (km s-1) | (K km s-1) |
| 0 | 0 | 2.50 | 292 | 7.52 | 7.67 | 324 | 6.10 |
| 6 | 6 | 4.62 | 283 | 2.34 | 6.72 | 240 | 1.84 |
| 0 | 6 | 3.43 | 328 | 4.80 | 6.34 | 270 | 3.51 |
| -6 | 6 | 5.33 | 209 | 2.68 | 5.95 | 252 | 2.69 |
| 6 | 0 | 3.78 | 267 | 4.24 | 7.67 | 302 | 3.64 |
| -6 | 0 | 3.86 | 336 | 1.69 | 7.67 | 247 | 2.50 |
| 6 | -6 | 5.28 | 344 | 6.65 | 7.87 | 220 | 6.34 |
| 0 | -6 | 3.75 | 320 | 4.60 | 9.6 | 285 | 6.14 |
| -6 | -6 | 4.42 | 259 | 3.70 | 9.6 | 308 | 3.97 |
| 0 | 22 | 2.19 | 220 | 0.92 | 3.62 | – | – |
| -22 | 0 | 2.06 | – | 1.67 | 2.88 | – | – |
| 0 | -22 | 1.64 | 262 | 1.44 | 3.07 | – | – |
| 22 | 0 | 2.33 | 316 | 2.47 | 2.30 | 275 | 0.88 |
| 15.6 | -15.6 | 2.39 | 310 | 2.53 | 2.11 | 318 | 2.23 |
| 44 | 0 | 1.77 | – | – | 3.07 | – | – |
| 0 | -44 | 2.18 | – | – | 2.11 | – | – |
| 31 | -31 | 2.00 | – | – | 2.88 | – | – |


3.2 Molecular gas kinematics


The spectra in both maps (Fig. 7,
3, 4) clearly show two
components, a fainter one (measured at the
center)
at 15 km s-1 (2660 18 km s-1 in 12CO(2-1)) and the dominant one at
10 km s-1.
Comparing the spectra at individual positions, the relative intensities of
both line components change, in particular in the SE direction. In
the
12CO(2-1) map, the more blueshifted line is the brighter one at the
offset
position (+15.6″, -15.6″) (see Fig. 4).
This component is centered at 2660 km s-1 in
12CO(2-1) in each position, whereas in 12CO(1-0) there seems
to be a
slight
shift from 2690 km s-1 in the center to 2660 km s-1 in the outer
region.
Generally, the single dish molecular gas kinematics agrees with the overall
central
kinematics of the H i presented in Manthey et al. (2008a) in terms of the
covered velocity range.
3.3 The nuclear region
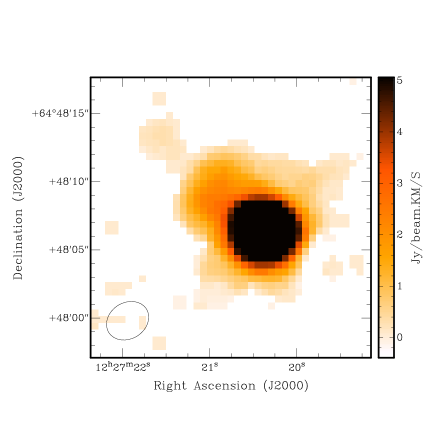
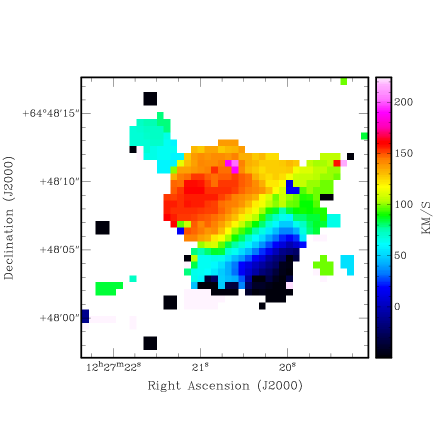
In Fig. 8 the integrated interferometer CO(1-0) intensity and
velocity field maps of
NGC 4441
are shown. Since interferometers filter out emission from extended diffuse
gas, the maps show the distribution of fairly dense CO. We found what
appears to be a small, inclined,
nuclear disc aligned with the dust lane seen in the optical. The position angle of both the dust lane and the disc are identical. The orientation
of the disc is northeast–southwest. Thus, it is inclined compared with the optical
major axis. Most of the gas is concentrated around the optical nucleus. A
second, fainter component with a small velocity dispersion is found north-east
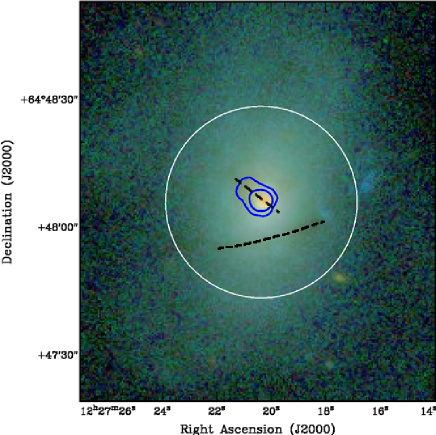
of the centre seen in Figs. 8,6 (’hook’ in Fig. 9). This second peak
is aligned with a broadened dust feature seen in the optical image
(Fig. 10).
It is worth to note here that besides the central dust lane associated with
the bulk of molecular gas, there are several faint off-centered dust lanes
visible in optical images (e.g., south of the centre, Fig. 10).
These lanes lie within the primary beam of the PdBI. Thus, if there was
significant molecular gas also associated with these dust lanes, we would have
detected it.
The total gas mass of the disc was calculated as , with denoting the distance in Mpc, being the
integrated CO flux in Jy km s-1. Thus, with the interferometric observations we detected of the molecular gas mass seen in single-dish observations.
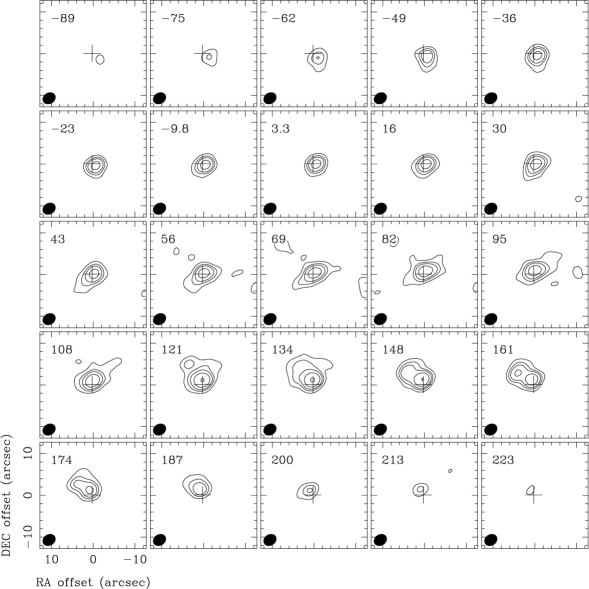
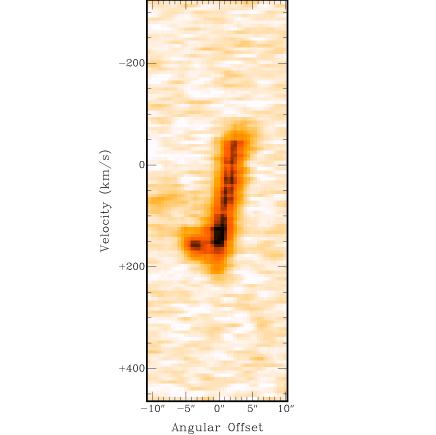
If we interpret the central feature as an inclined disc, its position-velocity
diagram can be interpreted as the regular rotation pattern of a solid body
(Figs. 8,9).
The main parameters of this feature are given in Table 4.
We calculated the dynamical mass of the nuclear disc with at a radius of kpc. The disc
appears
to be close to edge-on, so we assume an inclination of . An error
of in inclination does not affect the result significantly. Thus,
we calculate the dynamical mass as .
| property | value |
|---|---|
| size (″/kpc) | 10.36.4/1.81.1 |
| PA (∘) | 222 |
| () | 295 |
| (Jy km s-1) | 29.1 |
| () | 4.1 |
| () | 2.1 |
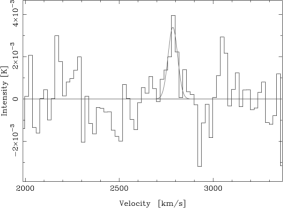
3.4 13CO(1-0) and 13CO(2-1)
We also observed NGC 4441 in 13CO(1-0) and
13CO(2-1) at the center position. The 13CO(1-0) line is
clearly detected, the
13CO(2-1) is only tentatively detected at a 3 level, but
a feature at the expected velocity
of 2790 km s-1 is found (see
Fig. 11). Table 5 gives the
linewidths and integrated intensities
of all four lines at the center position. We
fitted only one single Gaussian to the 13CO lines. The fitted center
velocity of 13CO(1-0)
(Table 5) lies between the derived
values for the
blue- and redshifted line using the 12CO transitions.
In contrast, in 13CO(2-1) we
see (if at all) the component with the higher velocity, which is also the
stronger one in 12CO at the center.
However, the signal-to-noise ratio of 13CO(2-1) is too low to
draw firm conclusions.
In Table 6 the derived molecular gas mass and
the molecular line intensity ratios based on the integrated
intensities given in Table 5 are listed.
| line | center velocity (lsr) | linewidth | Peak | int. Intensity | |||
|---|---|---|---|---|---|---|---|
| (km s-1) | (km s-1) | (K) | (K km s-1) | ||||
| 12CO(1-0) | 2698 | 2796 | 125 | 147 | 0.02 | 0.036 | 7.52 0.22 |
| 12CO(2-1) | 2655 | 2802 | 93 | 114 | 0.016, | 0.039 | 6.10 0.73 |
| 13CO(1-0) | 2725 | 208 | 0.0018 | 0.37 0.06 | |||
| 13CO(2-1) | 2785 | 61 | 0.0033 | 0.25 0.09 | |||
| property | result |
|---|---|
| ( ) | 4.6 |
| 12CO(2-1)/12CO(1-0) | 0.5 (0.06) |
| 13CO(2-1)/13CO(1-0) | 0.42 (0.17) |
| 12CO(1-0)/13CO(1-0) | 21 (3.5) |
| 12CO(2-1)/13CO(2-1) | 25 (7.6) |
4 Radiative transfer calculations
To investigate the physical conditions of the ISM, we used RADEX444http://www.strw.leidenuniv.nl/moldata/radex.html which is a one-dimensional spherically symmetric non-LTE radiative transfer code available on-line (van Langevelde & van der Tak 2004; Schöier et al. 2005; van der Tak et al. 2007). In this code, the mean escape probability method for an isothermal and homogeneous medium is used for the calculations.


We assume that the 12CO lines are optically thick (), so
that
the CO is selfshielded from the UV radiation field.
The high 12CO/13CO line ratio limits the optical
depths to
, unless the 13CO abundances are extraordinary low.
Furthermore, we assume
”standard” abundances of 12CO and 13CO of and (e.g., Blake et al. 1987; Mao et al. 2000).
The line ratios fitted by the radiative transfer model constrain the
average properties of an ensemble of clouds that are not filling the beam.
We are assuming that the emission is emerging from a single cloud type - which
in reality is very unlikely to be true, but provides us with a first
handle on the
main properties of the 12CO/13CO emitting gas.
We explore a range of column densities and temperatures of
and
10–50 K.
In Fig. 12 the results for
column
densities of and are displayed.
The levels decrease
from high temperatures at low densities to low temperatures at high
densities. The measured line ratios 12CO(2-1)/12CO(1-0) and
13CO(2-1)/13CO(1-0) both indicate subthermally excited
emission, i.e.,
either low temperatures and/or low density.
The best
agreement of the 12CO(2–1)/12CO(1–0) and
13CO(2–1)/13CO(1–0)
lines ratios is found for a column density per cloud of .
From the 12CO and 13CO ratios alone it is not
possible
to determine the temperature in a more specific way, but as seen in
Fig. 12, for higher temperatures ()
the
density is well below 1000 .
There are no signs of warm, dense (cm-3) cores. For
the gas to be dense
and still fit the observed line ratios, temperatures of 5 K are
required, which is
significantly lower than the dust temperature. This is of course
technically possible, but
such a cold dense component would quickly collapse and form stars. We
find it more
likely
that the observed line ratios indicate a low
density ( cm-3)
molecular ISM where the clouds are diffuse — i.e. not entirely
self-gravitating — or consisting
of extended outskirts of much smaller, bound clouds. This would be in agreement with the moderate to low star formation
rate derived for NGC 4441 (Manthey et al. 2008a).
Interestingly, the 12CO/13CO line ratio in NGC 4441 is unusually high for
a galaxy with a moderate to low star formation rate. Values found
here are more reminiscent of starburst nuclei (15–20) (Aalto et al. 1995).
It is possible that the ISM in NGC 4441 is the left-over from a burst of star
formation that consumed the denser fraction of the gas. Diffuse gas may also
be the result of dynamical impact on the gas properties: tidal forces,
bar-induced shocks or the merger event.
5 Discussion
5.1 A counter-rotating nuclear molecular disc?
Nuclear rotating discs are often found in interacting galaxies
(e.g., Bryant & Scoville 1996; Downes & Solomon 1998; Bryant & Scoville 1999; Yun & Hibbard 2001). Even though these studies
concentrate on ULIRGs, some of the observed features are similar to
the disc found in NGC 4441. The discs
found in mergers of spirals are very compact, with typical radii of 300–800 pc.
Furthermore, the molecular gas fraction traced by CO tends to have a rather low density () (Downes & Solomon 1998).
Therefore, the CO lines are subthermally excited (Downes & Solomon 1998), as
we also assume for NGC 4441. However, in ULIRGs
turbulence is rather high (up to 100 , (e.g., Downes & Solomon 1998)) which explains
why gravitational instabilities occur leading to the observed high star
formation rate. The ISM in the nuclear disc of NGC 4441 might be less
turbulent due to a different merger history. If NGC 4441 is a S+E merger,
only one partner brings in a significant amount of molecular gas, which might
form an interaction-triggered disc more smoothly. Therefore, the disc might be
more stable and thus only moderate ongoing star formation is observed.
Besides the diffuse component generally found in ULIRGs, the bulk of
the molecular gas is in a dense phase (),
supporting the extreme star formation (e.g., Solomon et al. 1992; Greve et al. 2006). Based on our radiative transfer modelling we find no hints of such a dominant dense gas phase in NGC 4441, in accordance to the moderate star formation rate.
Compared with the rotation of the large-scale HI disc (Manthey et al. 2008a), the
nuclear molecular disc is kinematically decoupled. Its rotation axis is shifted
by .
Kinematically decoupled cores (KDCs) are found in various galaxies, in spirals
as well as in S0 and ellipticals (e.g., Krajnović et al. 2008; Haynes et al. 2000; Kuijken et al. 1996).
First simulations of Hernquist & Barnes (1991) showed that
counter-rotating nuclear discs can occur in an equal-mass disc-disc merger
in which the two progenitors have anti-parallel spins (i.e., a retrograde
merger). In this scenario, the nuclear disc contains gas from the
centres of the original gas discs which was exposed to strong gravitational
torques and thus losing most of the angular momentum. Because of that, no
information about the original sense of rotation is preserved and thus the
rotation axis of the new disc is not related to the original ones. In contrast,
the gas in the outer parts can retain its angular momentum and thus conserves
the original motion. In this scenario, the merger remnants evolve into elliptical
galaxies which are often found to host a KDC.
Further theoretical studies showed that KDCs in S0 and spirals can occur due
to minor mergers with gas rich companions, and even mergers with at least one
elliptical can lead to (stellar) KDCs (e.g., Bertola & Corsini 1999; Thakar & Ryden 1998; Haynes et al. 2000; di Matteo et al. 2008).
Besides the variety of merging partners leading to a
KDC, all simulations have in common that the merger geometry has to be
retrograde.
5.1.1 Is the minor axis dust lane really an inclined disc?
The interpretation of the crossing central dust lane of NGC 4441 as an
inclined disc seems likely due to the large velocity shift along
the lane as well as the regular-looking shape of the associated pv
diagram. The disc appears stable against star formation and may be
filled with diffuse, unbound molecular gas. However, one problem
is the apparent counter-rotation of the inclined disc. In our
previous paper on H i (Manthey et al. 2008a) we suggested that the interaction
between the
two galaxies was pro-grade, because of a large amount of angular
momentum still remaining in the gas of the tidal tails. However, retrograde
mergers appear to
be a requirement to produce counter-rotating cores. If the pro-grade
scenario were correct, there
is a problem with the interpretation of the dust lane as an inclined disc.
A final answer cannot be given by these
observations alone but is only possible
by obtaining numerical simulations.
Minor axis dust lanes in other E+S mergers (such as Cen-A, Fornax-A,
NGC 4194 (the Medusa)) present a variety of dynamical behaviour. In
the Medusa the dust lane is morphologically similar to the one in NGC 4441,
but has a much smaller velocity gradient and is not interpreted as a disc,
but rather as a lane along which gas is fed to the nucleus (Aalto & Hüttemeister 2000). In
NGC 4441, however, we do not find such a central starburst.
5.2 Present state and expected future evolution of NGC 4441
The presence of an extended molecular gas reservoir in NGC 4441 is comparable
to what is found in NGC 4194, the prototypical S+E merger candidate
(Aalto & Hüttemeister 2000).
However, the geometry compared to the optical appearance is
different. In the Medusa the CO follows roughly the direction
of the optical tidal tail, whereas in NGC 4441 the molecular gas seems to be
more
extended to
the opposite side of the optical tail. This is probably a result of a different merger geometry of these two galaxies.
In any case, extended molecular gas indicates a different merger history compared
to ULIRGs in which molecular gas is concentrated in the central kpc. Based on
the similar optical morphology, in particular the strength of the features,
it seems likely that NGC 4441 and NGC 4194 are in a similar merger state.
Interestingly, the molecular gas mass of NGC 4441 is only a quarter
of the Medusa ( for NGC 4441),
whereas the amount of atomic hydrogen
is comparable
( in NGC 4441 versus in the
Medusa) (Manthey et al. 2008a, b). The question arises, why the starburst
in NGC 4441 has already
faded, while the Medusa is still intensely forming
stars.
The relation between the ongoing star formation and the
available resource for
star formation (i.e., dense gas) can be expressed by the star formation
efficiency: SFE() = .
Thus, for NGC 4441 we derive a star formation efficiency of . The equivalent gas depletion time is .
If we assume a conversion factor to be similar as in
the Medusa, we can directly compare the SFE with that in NGC 4194,
because their metalicities are similar (Jütte et al. 2009; Arimoto et al. 1996).
Comparing NGC 4441 with the very effective star burst in the Medusa (up to an
efficiency of (Aalto & Hüttemeister 2000)),
NGC 4441 has
a moderate star formation efficiency: .
Since the -to-CO conversion factor might be different for starbursting and ’quiescent’ galaxies, we may
overestimate the mass, and therefore underestimate the SFE in comparison with the Medusa. But these dependencies are not well understood so far and can’t be taken into account here.
From the radiative transfer models, we find that the
molecular gas is rather thin and cold in NGC 4441, which
makes it difficult to form new stars, whereas in the Medusa
the CO lines are thermalised, indicating higher average gas densities and/or
temperatures. It is, however, unclear, whether the
differences are due to ageing effects, e.g., NGC 4441 might
have transformed all dense gas into stars, whereas in the Medusa this
process is still ongoing. Furthermore, differences in the gas
densities can be explained by different gas reservoirs provided by the progenitors
and/or different merger geometry.
Thus, if this galaxy is already in a
post-starburst phase, it still manages to retain a large amount of gas
in principle available for
star formation.
This is in agreement with observations of so-called
’E+A’ galaxies, i.e. post-starburst with an optical spectrum
reflecting a strong A star population
superimposed on an old elliptical-like population.
A small but significant fraction of E+A galaxies have optical tidal
features, suggesting a
merger event only 0.5–1 Gyr ago (e.g., Zabludoff et al. 1996; Blake et al. 2004). Furthermore, Buyle et al. (2006)
obtained HI
observations of a sample of E+A
galaxies and show that the total atomic gas content may not be consumed
until a galaxy reaches that post-starburst phase.
Furthermore, a large amount of diffuse molecular gas can survive a
starburst phase (Kohno et al. 2002), when the gas in the
dense cores is consumed during the star formation process. It is
argued by Kohno et al. (2002) that the remaining molecular gas
can be stable against gravitational instabilities. Such instabilities could
lead to
a condensation and thus trigger star formation. In particular in
early-type galaxies such as NGC 4441, the mass density increases steeply towards
the center, which leads to a rise of the rotation velocity. Therefore,
the epicyclic frequency, which is proportional to the critical mass
density, also rises and hence also the critical mass density, which
is the lower threshold density for possible star formation. In other
words, the star formation is suppressed, although raw material is
still present in the galaxy.
Indeed, the small regularly rotating central molecular gas feature which
is likely a disc, seems to be stable, i.e., not star forming and
thus is similar to what is found in NGC 5195 by Kohno et al. (2002).
6 Summary
-
1.
We observed the advanced merger remnant NGC4441 in 12CO(1–0) using the Onsala 20 m telescope. We determined a total molecular gas mass of .
-
2.
The star formation efficiency is and the gas depletion time yr.
-
3.
Following up, we mapped NGC 4441 with the single-dish IRAM 30 m telescope in 12CO(1–0) and 12CO(2–1). We found extended molecular gas out to 22″(3.9 kpc).
-
4.
Two distinct velocity components with a velocity difference of were detected. The relative intensities of both components vary with distance from the center and with transition.
-
5.
High resolution imaging using Plateau de Bure revealed a small central rotating molecular gas disc hosting most of the molecular gas in NGC 4441. In contrast to ULIRGs, which also have compact molecular gas disc fueling the central superstarburst, the disc in NGC 4441 seems to be stable and thus does not support star formation.
-
6.
The central molecular gas disc has a different sense of rotation than the large-scale H i distribution. This is a strong indicator of a kinematically decoupled core.
-
7.
Furthermore, we observed the 13CO(1–0) and 13CO(2–1) line with the IRAM 30 m telescope to estimate the molecular gas properties using the radiative transfer model RADEX. We derived 12CO(2–1)/12CO(1–0) and 13CO(2–1)/13CO(1–0) line ratios which are consistent with a diffuse () molecular medium. However, the 12CO(1–0)/13CO(1–0) ratio is unusually high (12CO(1–0)/13CO(1–0) = 21), which is typical for the inner centers of luminous starbursts (Aalto et al. 1995).
-
8.
The moderate star formation rate of 1–2 is in good agreement with the results from the molecular gas analysis. Because not much dense ( cm-3) gas is present, no enhanced ongoing star formation can happen. The strength of a past starburst remains unclear, however.
-
9.
NGC 4441 may be a local candidate for an E+A galaxy, still hosting a significant amount of gas but the starbust has been faded away already.
Acknowledgements.
We thank Evert Olsson for his assistance of the IRAM observations. We thank the Onsala Space Observatory, and IRAM staff for their support during the observations. This research has made use of the NASA/IPAC Extragalactic Database (NED) which is operated by the Jet Propulsion Laboratory, California Institute of Technology, under contract with the National Aeronautics and Space Administration. The research was partially supported by the German Science Organisation (DFG) through the Graduiertenkolleg 787.References
- Aalto et al. (1995) Aalto, S., Booth, R. S., Black, J. H., & Johansson, L. E. B. 1995, A&A, 300, 369
- Aalto & Hüttemeister (2000) Aalto, S. & Hüttemeister, S. 2000, A&A, 362, 42
- Aalto et al. (2001) Aalto, S., Hüttemeister, S., & Polatidis, A. G. 2001, A&A, 372, L29
- Arimoto et al. (1996) Arimoto, N., Sofue, Y., & Tsujimoto, T. 1996, PASJ, 48, 275
- Bergvall (1981) Bergvall, N. 1981, A&A, 97, 302
- Bertola & Corsini (1999) Bertola, F. & Corsini, E. M. 1999, in IAU Symposium, Vol. 186, Galaxy Interactions at Low and High Redshift, ed. J. E. Barnes & D. B. Sanders, 149–+
- Blake et al. (2004) Blake, C., Pracy, M. B., Couch, W. J., et al. 2004, MNRAS, 355, 713
- Blake et al. (1987) Blake, G. A., Sutton, E. C., Masson, C. R., & Phillips, T. G. 1987, ApJ, 315, 621
- Braine & Combes (1992) Braine, J. & Combes, F. 1992, A&A, 264, 433
- Braine & Combes (1993) Braine, J. & Combes, F. 1993, A&A, 269, 7
- Bryant & Scoville (1996) Bryant, P. M. & Scoville, N. Z. 1996, ApJ, 457, 678
- Bryant & Scoville (1999) Bryant, P. M. & Scoville, N. Z. 1999, AJ, 117, 2632
- Buyle et al. (2006) Buyle, P., Michielsen, D., De Rijcke, S., et al. 2006, ApJ, 649, 163
- de Vaucouleurs et al. (1995) de Vaucouleurs, G., de Vaucouleurs, A., Corwin, H. G., et al. 1995, VizieR Online Data Catalog, 7155, 0
- di Matteo et al. (2008) di Matteo, P., Combes, F., Melchior, A.-L., & Semelin, B. 2008, A&A, 477, 437
- Downes & Solomon (1998) Downes, D. & Solomon, P. M. 1998, ApJ, 507, 615
- Dupraz & Combes (1985) Dupraz, C. & Combes, F. 1985, Lecture Notes in Physics, Berlin Springer Verlag, 232, 151
- Greve et al. (2006) Greve, T. R., Papadopoulos, P. P., Gao, Y., & Radford, S. J. E. 2006, ArXiv Astrophysics e-prints
- Haynes et al. (2000) Haynes, M. P., Jore, K. P., Barrett, E. A., Broeils, A. H., & Murray, B. M. 2000, AJ, 120, 703
- Hernquist & Barnes (1991) Hernquist, L. & Barnes, J. E. 1991, Nature, 354, 210
- Horellou & Booth (1997) Horellou, C. & Booth, R. 1997, A&AS, 126, 3
- Jütte et al. (2009) Jütte, E., Jütte, M., Hüttemeister, S., & Aalto, S. 2009, in prep.
- Khochfar & Burkert (2003) Khochfar, S. & Burkert, A. 2003, ApJ, 597, L117
- Kohno et al. (2002) Kohno, K., Tosaki, T., Matsushita, S., et al. 2002, PASJ, 54, 541
- Kojima & Noguchi (1997) Kojima, M. & Noguchi, M. 1997, ApJ, 481, 132
- Krajnović et al. (2008) Krajnović, D., Bacon, R., Cappellari, M., et al. 2008, MNRAS, 390, 93
- Kuijken et al. (1996) Kuijken, K., Fisher, D., & Merrifield, M. R. 1996, MNRAS, 283, 543
- Manthey et al. (2008a) Manthey, E., Aalto, S., Hüttemeister, S., & Oosterloo, T. A. 2008a, A&A, 484, 693
- Manthey et al. (2008b) Manthey, E., Hüttemeister, S., Aalto, S., Horellou, C., & Bjerkeli, P. 2008b, A&A, 490, 975
- Manthey et al. (2005) Manthey, E., Hüttemeister, S., Haberzettl, L., & Aalto, S. 2005, in AIP Conf. Proc. 783: The Evolution of Starbursts, ed. S. Hüttmeister, E. Manthey, D. Bomans, & K. Weis, 343–348
- Mao et al. (2000) Mao, R. Q., Henkel, C., Schulz, A., et al. 2000, A&A, 358, 433
- Naab & Burkert (2000) Naab, T. & Burkert, A. 2000, in ASP Conf. Ser. 197: Dynamics of Galaxies: from the Early Universe to the Present, ed. F. Combes, G. A. Mamon, & V. Charmandaris, 267
- Naab & Burkert (2001) Naab, T. & Burkert, A. 2001, in ASP Conf. Ser. 230: Galaxy Disks and Disk Galaxies, ed. J. G. Funes & E. M. Corsini, 453–454
- Naab et al. (2006) Naab, T., Jesseit, R., & Burkert, A. 2006, MNRAS, 372, 839
- Quinn (1984) Quinn, P. J. 1984, ApJ, 279, 596
- Sanders & Mirabel (1996) Sanders, D. B. & Mirabel, I. F. 1996, ARA&A, 34, 749
- Schöier et al. (2005) Schöier, F. L., van der Tak, F. F. S., van Dishoeck, E. F., & Black, J. H. 2005, A&A, 432, 369
- Solomon et al. (1992) Solomon, P. M., Downes, D., & Radford, S. J. E. 1992, ApJ, 387, L55
- Steinmetz (2003) Steinmetz, M. 2003, Ap&SS, 284, 325
- Strong et al. (1988) Strong, A. W., Bloemen, J. B. G. M., Dame, T. M., et al. 1988, A&A, 207, 1
- Thakar & Ryden (1998) Thakar, A. R. & Ryden, B. S. 1998, ApJ, 506, 93
- van der Tak et al. (2007) van der Tak, F. F. S., Black, J. H., Schöier, F. L., Jansen, D. J., & van Dishoeck, E. F. 2007, A&A, 468, 627
- van Langevelde & van der Tak (2004) van Langevelde, H. J. & van der Tak, F. 2004, http://www.strw.leidenuniv.nl/ moldata/radex.html
- Weil & Hernquist (1993) Weil, M. L. & Hernquist, L. 1993, ApJ, 405, 142
- Weistrop et al. (2004) Weistrop, D., Eggers, D., Hancock, M., et al. 2004, AJ, 127, 1360
- Yun & Hibbard (2001) Yun, M. S. & Hibbard, J. E. 2001, ApJ, 550, 104
- Zabludoff et al. (1996) Zabludoff, A. I., Zaritsky, D., Lin, H., et al. 1996, ApJ, 466, 104