Upflows in funnel-like legs of coronal magnetic loops
Abstract
The prominent blue shifts of Ne viii associated with the junctions of the magnetic network in the quiet Sun are still not well understood. By comparing the coronal magnetic-field structures as obtained by a potential-field reconstruction with the conspicuous blue-shift patches on the dopplergram of Ne viii as observed in an equatorial quiet-Sun region, we find that most of the regions with significant upflow are associated with the funnel-like legs of magnetic loops and co-spatial with increments of the line width. These quasi-steady upflows can be regarded as the signatures of mass supply to coronal loops. By using the square-root of the line intensity as a proxy for the plasma density, the mass flux of the upflow in each funnel can be estimated. We find that the mass flux is anti-correlated with the funnel’s expansion factor as determined from the extrapolated magnetic field. One of the loop systems is associated with a coronal bright point, which was observed by several instruments and exhibited various morphologies in different wavelengths and viewing directions. A remarkable agreement between its magnetic structure and the associated EUV emission pattern was found, suggesting an almost potential-field nature of the coronal magnetic field. We also report the direct detection of a small-scale siphon flow by both STEREO satellites. However, this transient siphon flow occurred in a weak mixed-polarity-field region, which was outside the adjacent magnetic funnel, and thus it is perhaps not related to plasma upflow in the funnel. Based on these observations, we suggest that at upper-TR (transition region) temperatures the dominant flows in quiet-Sun coronal loops are long-lasting upflows rather than siphon flows. We also discuss the implications of our results for coronal heating and unresolved magnetic structures.
1 Introduction
Quasi-steady flows have been frequently observed everywhere in the upper solar atmosphere, and the apparent steadiness of the global flow pattern seems to indicate a systematic large-scale plasma circulation in the solar corona and transition region (TR) (Foukal, 1978; Marsch et al., 2004, 2008; Dammasch et al., 2008). It is well known, but not yet fully understood, that in the network of the quiet Sun the ultraviolet emission lines formed in the TR are redshifted by a few km/s (e.g., Doschek et al., 1976; Brekke et al., 1997; Chae et al., 1998a; Curdt et al., 2008). As the temperature increases, the observed average Doppler shift turns from a red into a blue shift in the upper TR (Peter & Judge, 1999; Xia et al., 2004). Recently, EIS (EUV Imaging Spectrometer, Culhane et al., 2007) observations showed that coronal lines revealed high outflow velocities on the order of 100 km/s in a compact region (network boundary) of the quiet Sun (Dere et al., 2007).
The Ne viii (770.4 Å) line is formed in the upper TR and lower corona and is on average blue shifted in coronal holes and the quiet Sun (e.g., Dammasch et al., 1999). In coronal-hole dopplergrams, sizable patches of blue shift were frequently reported and usually interpreted as indicators of solar wind outflow (Hassler et al., 1999; Stucki et al., 2000; Wilhelm et al., 2000; Xia et al., 2003; Aiouaz et al., 2005; Tu et al., 2005a). In the quiet Sun, significant blue shifts of Ne viii were also found at the network junctions and considered to be possible sources of the solar wind (Hassler et al., 1999). However, through a combined analysis of and comparison between 3-dimensional (3-D) magnetic-field structures and EUV observations, He et al. (2007) and Tian et al. (2008a) found that most of the sites with Ne viii blue shift were not located in open-field regions. Consequently, they argued that these sites might not be sources of the solar wind. Furthermore, Tian et al. (2008a) also noticed that there were some loops revealing upflows in both legs, and some other loops with upflow in one and downflow in the other leg.
Although the smaller coronal structures are not well resolved, many attempts have already been made to understand these magnetic-field structures above the photosphere. Gabriel (1976) suggested the first magnetic-network model, in which the TR emission originates from magnetic funnels diverging with height and originating from the underlying supergranular boundaries. This picture was modified by Dowdy et al. (1986) who suggested that only a fraction of the network flux shaped as a funnel opens into the corona, while the majority of the network is occupied by a population of low-lying loops. Peter (2001) suggested that there may be two types of funnels, namely the ones connected to the solar wind and those forming the feet of large loops. Recently, based on the observed vector magnetic field, Tsuneta et al. (2008) proposed that the height where the funnel expands dramatically is higher in the quiet Sun than in coronal holes. On the other hand, magnetic-field extrapolation is a common method for the solar community to construct the coronal field and study the magnetic coupling of different solar processes (Wiegelmann & Neukirch, 2002). The linear force-free model as proposed by Seehafer (1978) has been successfully applied before to study coronal holes and quiet-Sun regions (Wiegelmann et al., 2005; Tu et al., 2005a, b; Marsch et al., 2006; He et al., 2007; Tian et al., 2007, 2008a).
In this paper, we present new observational results and further investigate the magnetic coupling and guidance of the plasma flows in corona and TR. The results are discussed and interpreted in the context of coronal circulation.
2 Ultraviolet observations and magnetic field extrapolation
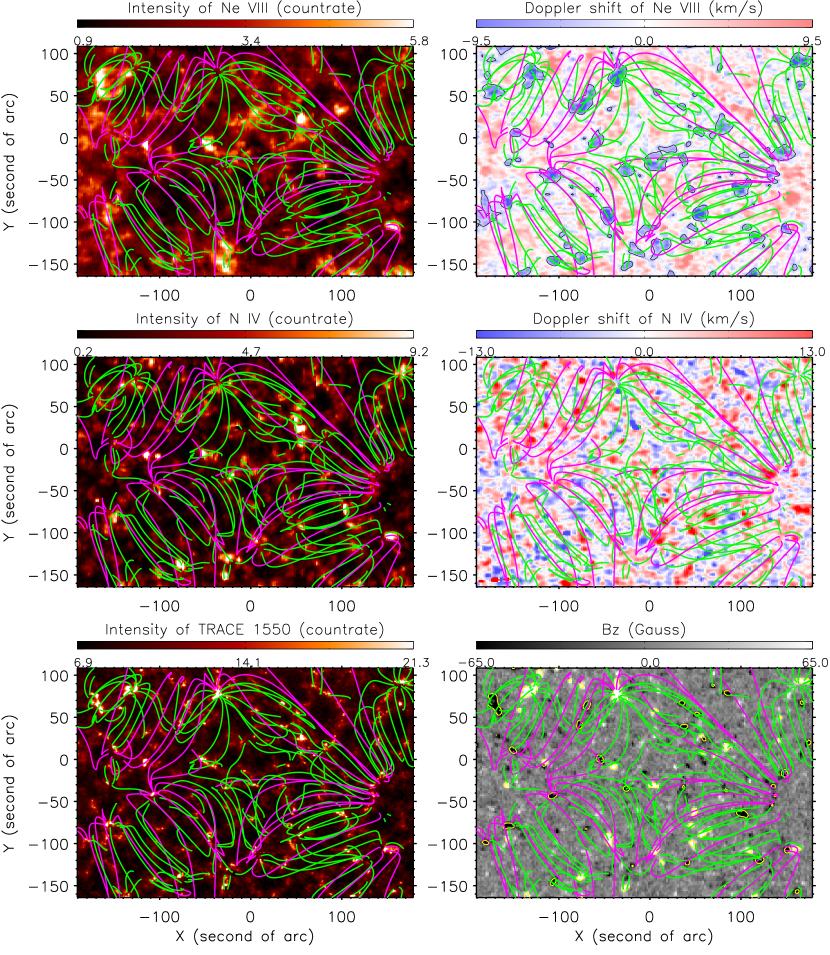
The SUMER (Solar Ultraviolet Measurements of Emitted Radiation) (Wilhelm et al., 1995; Lemaire et al., 1997) data analyzed here were acquired at disk center from 13:24 to 16:00 UT on July 3, 2008. The slit 2 () was used to scan an area with a size of about in this observation sequence. Spectra of Ne viii ( 770.4 Å) and several other TR lines including N iv ( 765.1 Å) were recorded on detector B with an exposure time of 60 s. The standard SUMER procedures for correcting and calibrating the data were applied. They include decompression, flat-field correction, and corrections for geometrical distortion, local gain and dead time. By applying a single-Gaussian fit to each spectrum, the intensity map and dopplergram of Ne viii were obtained and presented in Fig. 1.
During the SUMER observation, full-disk magnetograms with a 1-minute cadence and 2″ pixel size were obtained by MDI (Michelson Doppler Imager) (Scherrer et al., 1995) onboard SOHO. We found that the magnetogram was quite stable and showed almost no change during the period of the SUMER observation. In order to increase the signal-to-noise ratio, seven magnetograms observed from 15:00 to 15:06 UT were averaged. The coalignment between SUMER and MDI images was achieved through a cross correlation between the radiance map of N iv and the averaged magnetogram. The coaligned magnetogram can be found in Fig. 1. A subregion with a size of , being larger than the SUMER observation region, was extracted from the averaged magnetogram and then used to build a 3-D potential magnetic field, which is based on the model proposed by Seehafer (1978). In Fig. 1, the projections of the extrapolated magnetic loops onto the x-y-plane have been plotted on the different images. In order to obtain a better view of the complicated magnetic field structure, the field lines reaching higher and lower than 40 Mm are plotted in purple and green, respectively.
In Fig. 1, a TRACE (Transition Region and Coronal Explorer) image (Handy et al., 1999) was also shown to reveal the chromospheric network pattern. It is an average of 100 frames observed from 14:00 to 15:09 UT in the 1550 Å passband. The images have a pixel size of 0.5′′. Before averaging, the standard software for reducing TRACE data was applied to the images, and the satellite jitter was subsequently removed by applying the cross-correlation technique. The coalignment between TRACE and MDI images was done through cross correlation (note that the SOHO spacecraft was rotated at this time).
STEREO data were also available during this period. The separation angle between the two spacecraft was 59∘ and thus allowed for a stereoscopic study of some of the events and structures in the quiet Sun. The data obtained from 12:00 to 17:00 UT by the two almost identical SECCHI/EUVI telescopes (Wuelser et al., 2004) in all the four passbands were reduced by using the procedure SECCHI_prep.pro available in SSW (SolarSoft).
3 Results and Discussion
3.1 Continuous mass supply to magnetic funnels
The prominent blue shifts of Ne viii associated with network junctions in the quiet Sun were first reported by Hassler et al. (1999). However, so far the meaning of this blue shift and its relationship with the persistent red shift in lines at lower temperatures have not been understood. Tian et al. (2008a) revisited the middle-latitude quiet-Sun data analyzed before by Hassler et al. (1999). With the help of magnetic-field extrapolation, they found that most of the blue shifts seem to be associated with the legs of magnetic loops, and most likely indicate plasma outflow into and mass supply to coronal loops.
From our Fig. 1 we find that almost all of the patches that have a significant blue shift on the dopplergram of Ne viii coincide with legs of loops located at network junctions. Thus, we confirm the previous finding in Tian et al. (2008a), who also noticed that there are loops revealing large blue shifts in both legs, and some loops with upflow in one and downflow in the other leg. However, from Fig. 1 we can see now that most of the blue-shift patches coincide with both legs of magnetic loops, and some patches are associated with the common leg of several joint loops. Loop legs may generally be shaped in the form of funnels. Peter (2001) proposed a TR structure, in which magnetic funnels can either be connected to the solar wind, or form the legs of large coronal loops. In this picture, one funnel just corresponds to one leg of a single loop. However, in Fig. 1 we find that a single funnel can in fact be a common leg of several joint loops with different spatial scales and orientations. Thus, the mass and energy flowing into a single funnel can then be spread and supplied to multiple loops. In some cases the flows in different loops may have different velocities and thus reveal several sub-patches of blue shift within one blue-shift patch on the dopplergram of Ne viii.
Marsch et al. (2008) proposed the concept of coronal circulation, or convection to use a more apt term first coined by Foukal (1978), to emphasize that the plasma in the corona is nowhere static but everywhere flowing, being thereby guided by various magnetic channels. Many kinds of flow appear to be long-lasting on large scales, and thus may indicate quasi-steady plasma convection encompassing and affecting the entire corona and TR. In particular, the blue shifts of Ne viii at the network junctions are observed to be long lasting, and thus should play a permanent role in the process of coronal mass circulation. It is interesting to note that in the network of the quiet Sun the ultraviolet emission lines formed in the TR are usually redshifted by a few km/s (e.g., Doschek et al., 1976; Brekke et al., 1997; Chae et al., 1998a; Curdt et al., 2008). This phenomenon can be seen in the dopplergram of N iv as presented in Fig. 1. Here the Doppler shift was determined by assuming a net average shift of zero in the entire region. The origin of this red shift is still under debate (see reviews in Mariska, 1992; Brekke et al., 1997). From Fig. 1 it is clear that most loop legs are associated with patches of strong N iv red shift. However, the strongest red shifts of N iv do not fully coincide with but slightly deviate from the strongest blue shifts of Ne viii, which was found previously by Aiouaz (2008) and Tian et al. (2008c).
Also, the relationship between the red shift of cool lines and blue shift found at higher temperatures is not well understood. In coronal holes, the contemporaneous and adjacent red and blue shifts were explained as indicating downflow and upflow after magnetic reconnection between open field lines in coronal funnels and their side loops (Axford et al., 1999; Tu et al., 2005a; He et al., 2008). In the quiet Sun, the scenario of continuous reconnection might also apply, if the magnetic polarities of side loops are opposite to those of funnel-like loop legs (McIntosh et al., 2007; Tian et al., 2008a; Aiouaz, 2008), thus enabling reconnection.
There might be another possibility: Cool plasma (in photosphere and chromosphere) might continuously enter any loop leg through a certain process (e.g., diffusion) from outside, but then flow up and speed up after heating occurred. At the height of the upper TR, this flow becomes significant and may lead to a strong blue shift of the emission lines formed there. Due to the onset of possible (radiative) cooling effects (e.g., Kamio et al., 2009), the flow might again decelerate above a certain height (perhaps in the lower corona) and finally turn downwards and accelerate under gravity, which may lead to emission by the dense plasma at lower temperatures and then cause the red shift of TR lines. The steadiness of the observed shifts suggests that all these processes should occur continuously and persistently. However, since the density decreases with height, the contribution of the cooling plasma to the observed red shift at TR temperatures might be minor, as compared to that of the downward plasma resulting from reconnection.
3.2 Relationship between mass flux and expansion factor
As mentioned in Tian et al. (2008a), we can estimate the rate of mass supply to a coronal loop if we accept the Doppler shift of Ne viii as a proxy for the plasma bulk flow (i.e., of the proton flow). The mass flux can be calculated as , where , and represent electron density, outflow velocity and the area of an observed blue-shift patch. Here we selected 21 patches with significant blue shifts, which are clearly associated with funnel-like loop legs, as inferred from Fig. 1. For each case, we selected the region where the blue shift is larger than 3 km/s, by plotting contours on the dopplergram, and then calculated and the average . For our studied region, we could not make a direct density measurement by using the available data. However, under the assumption of the same thermal structure, we can evaluate the electron density by using the square root of Ne viii line intensity (Xia, 2003; Marsch et al., 2004). Since the Mg vii and Ne viii lines have a similar formation temperature, we adopted a value of cm-3, from the density measurement by using Mg vii in Landi & Landini (1998).
By assuming this value for the average density of our studied region, we got a scaling factor between the electron density and the square root of the intensity. We then superposed contours of the Doppler shift on the intensity image and thus obtained the average intensity within each contour. By use of the scaling relation, we got the values of the electron density. The values of , , , and the approximate coordinates of all cases analysed are listed in Table 1. We have to mention that the Doppler shift was determined by assuming a net average shift of zero in the entire region. Since the average Doppler shift of Ne viii is about 2 km/s (blue shift) in the quiet Sun (Peter & Judge, 1999; Xia et al., 2004), we simply added 2 km/s to before we calculated the mass flux for each case.
The information on the 3-D coronal magnetic field, as obtained by an extrapolation of the measured photospheric magnetic field, allows one to study the geometry of magnetic flux tubes in the corona. Since plasma flows are guided by magnetic flux tubes, the expansion of a tube might play an important role in the process of coronal mass supply. Since the magnetic flux is conserved along a flux tube, we can calculate the expansion factor of the tube (see, e.g., Marsch et al. (2004)) if the values of magnetic field strength at different heights in the tube are known. Here we aimed at a calculation of the expansion factor of each funnel-like loop leg below 4 Mm. The selection of 4 Mm is based on the estimation of Ne viii emission height in the quiet Sun (Tu et al., 2005b).
On the magnetogram shown in Fig. 1, strong-field regions (larger than 40 gauss in magnitude) in the photosphere are outlined in yellow. For each selected patch of blue shift on the dopplergram, it is easy to find the associated flux tube (strong-field region) on the magnetogram. These contours were then superposed on the extrapolated magnetogram at 4 Mm. We calculated the average values of the longitudinal magnetic field strength () in all contours which are associated with the selected funnels. Table 1 lists the results. The ratio of at 0 Mm and 4 Mm is a measure of the area ratio between these two heights, the requested expansion factor.
Fig. 2 presents a scatter plot of the mass flux versus expansion factor for different magnetic funnels. The dashed line is a linear fit to the scattered data points. We can conclude that there is a declining trend of the mass flux with increasing expansion factor. It is known that the source regions of fast solar wind, the polar coronal holes, are characterized by a relatively slow flux-tube expansion. Typical sources of the slow solar wind are the many small holes located adjacent to active regions and the boundaries of polar holes, where rapidly diverging fields are known to be dominant (see a review in Wang, 2009). The relationship between mass flux and expansion factor here is similar to the well known relationship between wind speed and expansion factor. Thus a similar explanation might apply to both cases, although the spatial scales are different. In a rapidly diverging magnetic funnel, most of the energy that is brought in by the cool plasma and produced in heating processes may be deposited in a lower layer of the funnel (below the formation height of Ne viii), and therefore the energy used to drive the upflow will be reduced. In contrast, if the expansion of the funnel is not significant, more energy will become available to accelerate the upflow, and thus the upward mass flux will be increased.
| Position (x′′, y′′) | V (km/s) | A (Mm2) | I (count rate) | at 0 Mm (gauss) | at 4 Mm (gauss) |
|---|---|---|---|---|---|
| -175,55 | 5.11 | 165.57 | 3.80 | 83.70 | 32.3 |
| -130,75 | 5.80 | 237.46 | 3.06 | 123.7 | 50.1 |
| -80,35 | 6.01 | 141.60 | 2.73 | 74.90 | 22.0 |
| -35,75 | 7.13 | 196.07 | 2.40 | 118.9 | 45.8 |
| -145,5 | 4.95 | 54.464 | 3.31 | 66.60 | 18.5 |
| -110,-50 | 5.39 | 156.85 | 2.26 | 91.20 | 24.3 |
| -160,-75 | 5.62 | 76.250 | 3.40 | 73.60 | 20.8 |
| -75,-145 | 4.79 | 78.428 | 3.35 | 68.60 | 18.7 |
| -45,-95 | 7.50 | 128.53 | 2.14 | 67.20 | 23.5 |
| -25,-40 | 5.05 | 115.46 | 2.58 | 64.70 | 16.4 |
| -60,-10 | 4.67 | 119.82 | 2.62 | 83.70 | 20.4 |
| 55,-90 | 7.04 | 143.78 | 2.61 | 69.60 | 23.5 |
| 100,-60 | 5.68 | 152.50 | 2.18 | 92.60 | 27.1 |
| 115,-120 | 4.51 | 108.92 | 3.00 | 97.00 | 24.7 |
| 150,-110 | 4.84 | 56.643 | 3.08 | 83.30 | 19.4 |
| 145,-20 | 4.55 | 215.67 | 2.22 | 81.30 | 24.5 |
| 165,90 | 6.92 | 150.32 | 2.97 | 89.30 | 26.4 |
| 80,10 | 4.55 | 189.53 | 2.86 | 69.20 | 20.0 |
| 135,-40 | 4.24 | 95.857 | 2.87 | 72.70 | 21.5 |
| -5,-110 | 4.03 | 91.500 | 2.30 | 58.50 | 17.0 |
| 10,-130 | 4.38 | 174.28 | 1.91 | 52.20 | 14.6 |

3.3 Upflows in coronal bright point
Coronal bright points (BPs) are characterized by locally enhanced emission in X-ray, EUV and radio wavelengths and related to bipolar magnetic fields at network boundaries (Habbal et al., 1990; Webb et al., 1993; Falconer et al., 1998; Brown et al., 2001; Madjarska et al., 2003). It is believed that BPs are associated with small-scale (typically in size) loop structures (Sheeley and Golub, 1979; Tian et al., 2007; Péter-Suárez, 2008).
In our field of view we found a typical BP, located and visible in the upper left corner of all panels of Fig. 1, where we can see a magnetic loop system with both legs being anchored in the magnetic network. The BP shows enhanced emission in the intensity map of Ne viii. The most interesting feature here is that upflows are seen in both legs of the loop system (upper right panel). Recently, Brosius et al. (2007) reported upflow and downflow on opposite sides of a BP, which was explained as the result of magnetic reconnection. Tian et al. (2008b) found a BP which revealed a totally different upflow/downflow boundary at lower and higher temperatures, suggesting a twist of the associated magnetic loop system. According to our knowledge, this is the first time that upflows are found in both legs of a BP loop system. This Doppler-shift pattern is not strange, since the BP is associated with a magnetic loop, which should not be too different from other loop structures, although this BP-loop is of smaller size. Thus we may conclude that the blue shift of Ne viii seen in both legs of the BP loop system is more likely a signature of mass supply to these loop, rather than a signature of solar wind origin. Our conclusion is consistent with the one made earlier by Wilhelm et al. (2000) and Xia et al. (2003), who concluded that BPs do not directly contribute to solar wind outflow. However, other authors suggested that BPs could be associated with jets (e.g., Shibata, 1996; Yokoyama and Shibata, 1996) and might contribute to the high-speed solar wind in coronal holes (Cirtain et al., 2007). In the quiet Sun, if magnetic field lines are transiently open, then their interactions with emerging flux can produce BPs and jets, releasing plasma into the outer corona and solar wind. More studies are needed to investigate the role of BPs in solar wind origin.
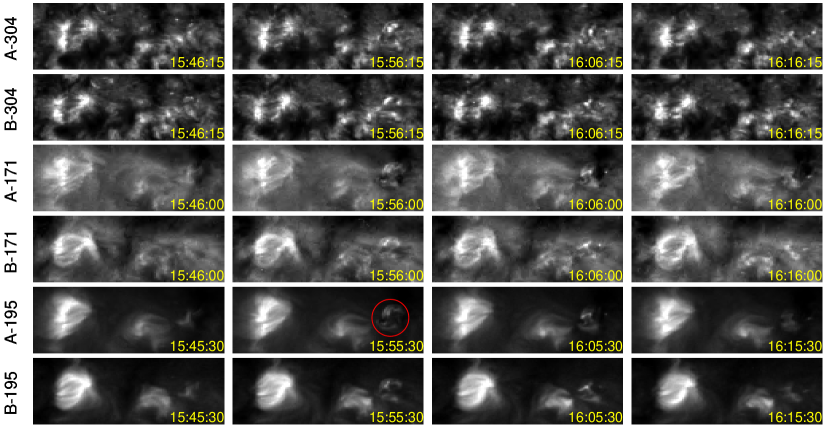
The EUVI/SECCHI images presented in Fig. 3 reveal the varying morphology of the BP when seen from two different viewing angles. The general emission patterns of the BP in the three passbands did not change during the period of SUMER observation, although the fine structures were rather dynamic. A comparison between the extrapolated magnetic structure and the BP emissions as seen by EUVI, TRACE, and SUMER suggests a remarkable agreement and thus indicates an almost steady, potential-like nature of the magnetic field. Our finding confirms the result of Péter-Suárez (2008), who found an agreement between the extrapolated magnetic field configuration and some of the loops composing the BP as seen in the X-ray images and suggested that a large fraction of the magnetic field in the BP is close to being a potential field. The remarkable agreement here also suggests the suitability of the potential-field model for our study.
It is also clear that the emission pattern of the BP is different at different temperatures. At chromospheric temperatures, bright emission can be found only at the very bottom of loop legs, as seen in the TRACE 1550 Å image. With increasing temperature, from EUVI 304 Å, SUMER N iv, SUMER Ne viii, EUVI 171 Å, to EUVI 195 Å, more and more parts of the upper sections of the loop system are revealed. So it is difficult to identify the full loop structure from only one image. By inspection of Fig. 3, we can also find that this BP is differently resolved in the various EUVI images onboard the two STEREO spacecraft, suggesting the importance of stereoscopic observations. As pointed out by Peter (2007), 3-D models are important to account properly for the plasma and the magnetic field structure as well as their interaction. Our results indicate, from an observational point of view, the importance of carrying out combined studies that use 3-D observations at different temperatures and magnetic field extrapolation for loop-like structures. The 3-D reconstruction of active-region loops has been successfully done in the recent past (Feng, 2007). In principle, it should also be possible to reconstruct the 3-D structure of a small-scale loop system that, e.g., is associated with a BP.
3.4 A transient siphon flow outside magnetic funnels
It is well known that the corona is rather dynamic, not only in active regions but also in the quiet Sun. Small-scale transient events have been reported frequently for the quiet Sun. In our data set we also found one case of a dynamic event, a transient siphon flow.
This siphon flow occurred approximately from 15:50 to 16:10 UT on the right side of a blue-shift patch (the one with a coordinate of (-35,75) in Table 1). It was recorded in all of the four passbands of EUVI on both spacecraft. Movies showing the evolution of the emissions in the four passbands can be found online (note the different cadences in different passbands). We did not de-rotate the images since an interpolation might have smoothed out the small-scale event. Fig. 3 only shows several snapshots. From the movie we can see bright emission features moving along two small parallel loops from one end to the other. The two loops were located in a weak mixed-polarity region on the magnetogram shown in Fig. 1. They were rather small and cold before the occurring of the event, and thus were not properly resolved by EUVI. Due to the elevated temperature and enhanced coronal emission resulting from an unknown heating process, the two cold loops were clearly seen during the period of the siphon flow, especially at around 15:55:30 in the 195 Å passband of EUVI onboard STEREO-A. Under the assumption of a semi-circular shape, the loop length can be estimated as 40′′. Then the speed of the flow can be calculated as 24 km/s.
Siphon flows are believed to be driven by asymmetric heating or pressure gradients between two legs of the loop (e.g., Robb & Cally, 1992; Orlando et al., 1995). They have been frequently found in large active-region loops, but rarely been observed in the quiet Sun. Teriaca et al. (2004) identified a supersonic siphon-like flow in a quiet-Sun loop, by analyzing spectral profiles of O vi. Siphon flows in small loops in active regions were also detected by Uitenbroek (2006) and Doyle et al. (2006). Here we reported a direct observation of a small-scale siphon flow in the quiet Sun by both STEREO satellites. However, since this transient siphon flow occurred in a weak mixed-polarity field region and was outside the adjacent magnetic funnel, it should not be related to the long-lasting upflow in the funnel.
3.5 Flows in the magnetic structures of the quiet Sun
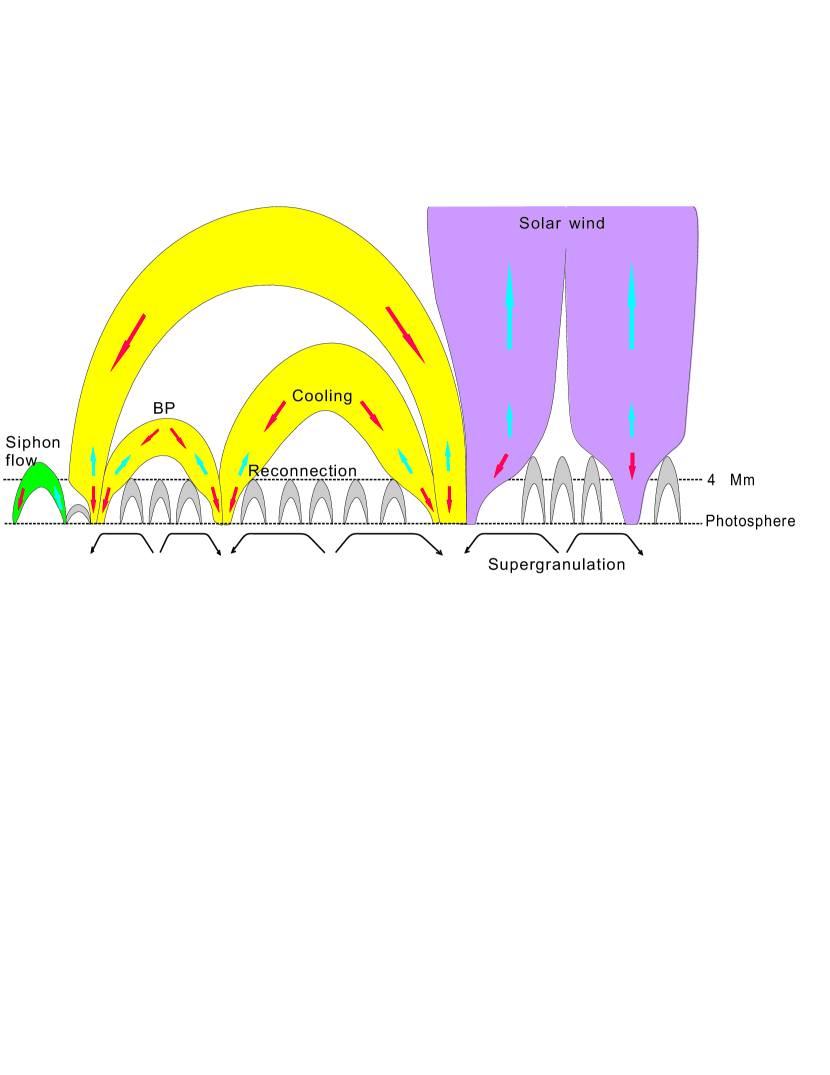
Based on the above observations, we suggest a quiet-Sun magnetic structure which is presented in Fig. 4. The cool loops, coronal loops, and open-field structures are marked in grey, yellow, and purple, respectively. Downflows and upflows guided by these structures are indicated by the red and blue arrows, respectively.
Cool loops with different spatial scales can be found in both network and internetwork regions. Legs of one or several large-scale magnetic structures (coronal loops or open-field structures) may be anchored in and crowd a network junction, forming a magnetic funnel. The internetwork loops are continuously swept through the supergranular convection to the network boundaries, where they may interact with the preexisting funnels. These funnels can either be connected to the solar wind, or form the legs of large coronal loops.
As mentioned previously, two mechanisms might be responsible for the systematic flows in coronal loops. Continuous reconnection between field lines in magnetic funnels and side loops is expected to produce upflows in the upper TR and downflows in the lower TR. The outflows produced by reconnections around a funnel tend to converge towards the center of the funnel. In contrast, the hot plasma trapped in low-lying loops are pulled down when they cool, and the downflows are stronger at the boundary of the network where side loops are accumulated. Thus, the bi-directional flows are likely to be detected as the not-fully-cospatial blue shift of Ne viii and red shift of N iv. On the other hand, heating and cooling processes might also take place in quiet-Sun coronal loops. In most cases, upflows which are possibly caused by heating can not reach the apices of the loops. When cooling is switched on, the flows turn downwards and lead to emission at lower temperatures. This scenario will naturally explain the observational fact that most of the strongest red shifts of N iv do not fully coincide with the strongest blue shifts of Ne viii, since the turning points are located in the curved segments of loop legs.
In classical pictures (e.g., Peter, 2001), the dominant type of flow in coronal loops is siphon flow. However, our observation seems to indicate that siphon flow rarely exists in quiet-Sun coronal loops with a size comparable to or larger than a supergranule. In these large-scale loops, the upflowing plasma will get cooled and turn downwards before reaching the apices. However, transient heating in one leg of a small loop may launch an upflow that can reach the apex and subsequently flow downwards along the other leg of the loop. For BPs which are associated with magnetic loops of intermediate scales these two types of flows may both exist.
The mass supplied into the coronal loops might also be released into the ambient corona or even into the solar wind. As claimed by He et al. (2007) and Tian et al. (2008a), sometimes quiet-Sun coronal loops might transiently open due to magnetic reconnection so that open field lines forming magnetic funnels might also be present in the quiet Sun. These funnels originating from different network regions expand with height and finally merge into a single wide open-field region. The nascent solar wind is likely to be produced in these funnels, but at locations higher than the source of the Ne viii emission. Recent EIS observations showed that coronal lines revealed high outflow velocities on the order of 100 km/s in a compact region (network boundary) of the quiet Sun (Dere et al., 2007). Future combined studies between magnetic field extrapolation and spectroscopic observations including SUMER and EIS are needed to investigate whether this high-speed coronal outflow corresponds to the quiet-Sun solar wind or not.
3.6 Implications for coronal heating and unresolved magnetic structures
EIS observations reveal hot plasma upflows of several tens km/s and enhanced nonthermal velocities near the footpoints of active region loops (Hara et al., 2008). The authors claimed that this result supports the nanoflare heating model of Patsourakos & Klimchuk (2006) that treats a coronal loop as a collection of unresolved small-scale bundles. While based on a more recent finding that SUMER and EIS observations seem to show faint upflows at 50-100 km/s for temperatures from 100,000 to several million degrees, De Pontieu et al. (2009) suggested that the dominant part of coronal heating is provided by the chromospheric jets or type II spicules.
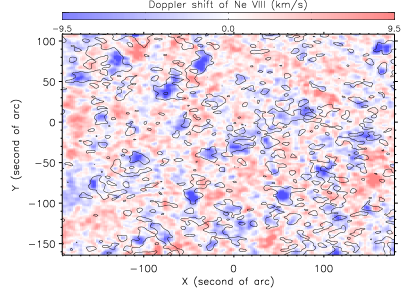
A heating process is usually associated with high-speed laminar flows, waves, or turbulent flows which all contribute to the nonthermal motion and tend to broaden the width of spectral lines (e.g., Hollweg et al., 1984; Chae et al., 1998b; Tu et al., 1998). Thus, an investigation of the line width may provide some implications for coronal heating. The correlation between the line radiance and non-thermal width for a certain TR line was investigated by Chae et al. (1998b). Here we found a similar result: the correlation coefficient is much higher for the typical TR line N iv (0.33) than for the upper TR line Ne viii (0.13). Our most interesting result is that there is a high correlation between the line width and the Doppler shift of Ne viii (correlation coefficient: -0.37, note that the blue and red shifts have negative and positive values, respectively). Contours of line width (top 20%) are superposed on the dopplergram of Ne viii in Fig. 5. It is very clear that most of the significant blue shifts are associated with an enhancement of the line width.
Chae et al. (1998b) claimed that the superposition of different laminar flows in various unresolved loops can not explain some observational characteristics of nonthermal motions. However, some model calculations led to a different conclusion. Multi-thread loop models suggested that plasma from a single thread (strand) can have a very high speed, but since the initial rise of each thread is masked by threads that were heated previously and are emitting strongly, the composite emission from many strands in various stages of heating and cooling is dominated by the stationary emission (Warren & Doschek, 2005; Patsourakos & Klimchuk, 2006). According to this scenario, the plasma with a long-lasting blue shift of the order of 6 km/s in our observations should correspond to the stationary thermal emission in the upper TR of network junctions, while emission from some individual unresolved threads with high-speed motions corresponds to heating beams which yield increments of the line width but no detectable upflows at upper-TR temperatures. These high-speed upward plasma may be associated with the chromospheric jets or type II spicules, which were suggested to be crucial for coronal heating in the mechanism proposed by De Pontieu et al. (2009). In our observation, most Ne viii profiles are well approximated by a single Gaussian function and do not show visible asymmetries, which is consistent with previous observations and the nanoflare heating model of Patsourakos & Klimchuk (2006).
However, we have to keep in mind that the enhancement of the line width in network junctions may also be related with waves or turbulence, which are associated with the process producing the significant Ne viii blue shift.
4 Summary
Through a potential-field extrapolation, we have further investigated the coupling between solar magnetic structures and the prominent blue shifts of Ne viii at the network junctions in the quiet Sun. An exceptionally clear and close relationship between the significant upflows and the funnel-like loop legs has been established. Moreover, we have made a first attempt to study the influence of the expansion factor of magnetic loops on the mass flux as inferred from spectroscopic observation and found an anti-correlation.
For the small-scale loop structure identified as coronal bright point, we have made the first combined study between the extrapolated magnetic field and 3-D multi-temperature EUV observations. We find upflows in both legs of the loop system associated with the BP.
We also reported a direct detection of a transient siphon flow in the quiet Sun by both STEREO satellites. This siphon flow along two parallel small-scale loops occurred in a mixed-polarity-field region, which was located outside the adjacent magnetic funnel.
Based on these observations, we present in Fig. 4 a new scenario of the flows guided by the quiet-Sun magnetic structures. In this scenario, the dominant flows at upper-TR temperatures in quiet-Sun coronal loops are long-lasting upflows rather than siphon flows. The mass supplied into and flows upwards along coronal loops may fall downwards again when cooling is switched on. Sometimes the coronal loops might transiently open due to magnetic reconnection and thus can release mass into the ambient corona or even into the solar wind.
Finally, we have recalled some recent results on the upflows in the TR and corona, and discussed the implications of our results for coronal heating. The significant correlation between the line width and Doppler shift of Ne viii seems to favor a scenario of magnetic funnel consisting of unresolved strands.
References
- Aiouaz et al. (2005) Aiouaz, T., Peter, H., & Lemaire, P. 2005, A&A, 435, 713
- Aiouaz (2008) Aiouaz, T., 2008, ApJ, 674, 1144
- Axford et al. (1999) Axford, W. I., Mckenzie, J. F., & Sukhorukova, G. V. 1999, Space Science Reviews, 87, 25
- Brekke et al. (1997) Brekke, P., Hassler, D. M., & Wilhelm, K. 1997, Sol. Phys., 175, 347
- Brosius et al. (2007) Brosius, J. W., Rabin, D. M., & Thomas, R. J. 2007, ApJ, 656, L41
- Brown et al. (2001) Brown, D. S., Parnell, C. E., DeLuca, E. E., et al. 2001, Sol. Phys., 201, 305
- Chae et al. (1998a) Chae, J., Yun, H. S., & Poland, A. I. 1998a, ApJS, 114, 151
- Chae et al. (1998b) Chae, J., Schühle, U., & Lemaire, P. 1998b, ApJ, 505, 957
- Cirtain et al. (2007) Cirtain, J. W., Golub, L., Lundquist, L., et al. 2007, Science, 318, 1580
- Culhane et al. (2007) Culhane, J.L. et al. 2007, Solar Phys., 243, 19
- Curdt et al. (2008) Curdt, W., Tian, H., Dwivedi, B. N., & Marsch, E. 2008, A&A, 491, L13
- Dammasch et al. (1999) Dammasch, I. E., Wilhelm, K., Curdt, W., & Hassler, D. M. 1999, A&A, 346, 285
- Dammasch et al. (2008) Dammasch, I.E., Curdt, W., Dwivedi, B. N., & Parenti S. 2008, Ann. Geophysicae, 26, 2955
- De Pontieu et al. (2009) De Pontieu, B., McIntosh, S. W., Hansteen, V. H., & Schrijver, C. J. 2009, ApJ, 701, L1
- Dere et al. (2007) Dere, K. P., Doschek, G. A., & Mariska, J. T., et al. 2007, PASJ, 59, S721
- Doschek et al. (1976) Doschek, G. A., Bohlin, J. D., & Feldman, U. 1976, ApJ, 205, L177
- Doyle et al. (2006) Doyle, J. G., Taroyan, Y., Ishak, B., et al. 2006, A&A, 452, 1075
- Dowdy et al. (1986) Dowdy, J. F. Jr., Rabin, D., & Moore, R. L. 1986, Sol. Phys., 105, 35
- Falconer et al. (1998) Falconer, D. A., Moore, R. L., Porter, J. G., & Hathaway, D. H. 1998, ApJ, 501, 386
- Feng (2007) Feng, L., Inhester, B., Solanki, S. K., et al. 2007, ApJ, 671, L205
- Foukal (1978) Foukal, P., 1978, ApJ, 223, 1046
- Gabriel (1976) Gabriel, A. H. 1976, Philos. Trans. R. Soc. London A, 281, 575
- Habbal et al. (1990) Habbal. S. R., Dowdy, J. F. Jr., &Withbroe, G. L. 1990, ApJ, 352,333
- Handy et al. (1999) Handy, B. N., Acton, L. W., Kankelborg, C. C., et al. 1999, Sol. Phys., 187, 229
- Hara et al. (2008) Hara, H., Watanabe, T., Harra, L. K., et al. 2008, ApJ, 678, L67
- Hassler et al. (1999) Hassler, D. M., Dammasch, I. E., Lemaire, P., et al. 1999, Science, 283, 810
- He et al. (2007) He, J.-S., Tu, C.-Y., & Marsch, E. 2007, A&A, 468, 307
- He et al. (2008) He, J.-S., Tu, C.-Y., & Marsch, E. 2008, Sol. Phys., 250, 147
- Hollweg et al. (1984) Hollweg, J. V. 1984, ApJ, 277, 392
- Kamio et al. (2009) Kamio, S., Hara, H., Watanabe, T., & Curdt, W. 2009, A&A, 502, 345
- Landi & Landini (1998) Landi, E., & Landini, M. 1998, A&A, 340, 265
- Lemaire et al. (1997) Lemaire, P.,Wilhelm, K., Curdt, W., et al. 1997, Sol. Phys., 170, 105
- McIntosh et al. (2007) McIntosh, S. W., Davey, A. R., Hassler, D. M., et al. 2007, ApJ, 654, 650
- Madjarska et al. (2003) Madjarska, M. S., Doyle, J. G., Teriaca, L., & Banerjee, D. 2003, A&A, 398, 775
- Mariska (1992) Mariska, J. T. 1992, The Solar Transition Region (Cambridge: Cambridge Univ. Press)
- Marsch et al. (2004) Marsch, E., Wiegelmann, T., & Xia L.-D. 2004, A&A, 428, 629
- Marsch et al. (2006) Marsch, E., Zhou, G.-Q., He, J.-S., & Tu, C.-Y. 2006, A&A, 457, 699
- Marsch et al. (2008) Marsch, E., Tian, H., Sun, J., Curdt, W., & Wiegelmann, T. 2008, ApJ, 684, 1262
- Orlando et al. (1995) Orlando, S., Peres, G., & Serio, S. 1995, A&A, 294, 861
- Péter-Suárez (2008) Péter-Suárez, D., Maclean, R. C., Doyle, J. G., & Madjarska, M. S. 2008, A&A, 492, 575
- Peter & Judge (1999) Peter, H., & Judge, P. G. 1999, ApJ, 522, 1148
- Peter (2001) Peter, H. 2001, A&A, 374,1108
- Peter (2007) Peter, H. 2007, Adv. Space Res., 39, 1814
- Patsourakos & Klimchuk (2006) Patsourakos, S., & Klimchuk, J. A. 2006, ApJ, 647, 1452
- Robb & Cally (1992) Robb, T. D., & Cally, P. S. 1992, ApJ, 397, 329
- Seehafer (1978) Seehafer, N. 1978, Sol. Phys., 58, 215
- Scherrer et al. (1995) Scherrer, P. H., Bogart, R. S., Bush, R. I., et al. 1995, Solar Phys., 162,129
- Sheeley and Golub (1979) Sheeley, N. R. Jr., & Golub, L. 1979, Sol. Phys., 63, 119
- Shibata (1996) Shibata, K., Yokoyama, T., & Shimojo, M. 1996, Adv. Space Res., 17, 197
- Stucki et al. (2000) Stucki, K., Solanki, S. K., Schühle, U., et al. 2000, A&A, 363, 1145
- Teriaca et al. (2004) Teriaca, L., Banerjee, D., Falchi, A., Doyle, J. G., & Madjarska, M. S. 2004, A&A, 427, 1065
- Tu et al. (1998) Tu, C.-Y., Marsch, E., Wilhelm, K.,& Curdt, W. 1998, ApJ, 503, 475
- Tu et al. (2005a) Tu, C.-Y., Zhou, C., Marsch, E., et al. 2005a, Science, 308, 519
- Tu et al. (2005b) Tu, C.-Y., Zhou, C., Marsch, E., et al. 2005b, ApJ, 624, L133
- Tian et al. (2007) Tian, H., Tu, C.-Y., He, J.-S., & Marsch, E. 2007, Adv. Space Res., 39, 1853
- Tian et al. (2008a) Tian, H., Tu, C.-Y., Marsch, E., et al. 2008a, A&A, 478, 915
- Tian et al. (2008b) Tian, H., Curdt, W., Marsch, E., & He J.-S. 2008b, ApJ, 681, L121
- Tian et al. (2008c) Tian, H., Tu, C.-Y., Xia, L.-D., et al. 2008c, A&A, 489, 1297
- Tsuneta et al. (2008) Tsuneta, S., Ichimoto, K., Katsukawa, Y., et al. 2008, ApJ, 688, 1374
- Uitenbroek (2006) Uitenbroek, H., Balasubramaniam, K. S., & Tritschler, A. 2006, ApJ, 645, 776
- Wang (2009) Wang, Y.-M. 2009, Space Sci. Rev., 144, 383
- Warren & Doschek (2005) Warren, H. P., & Doschek, G. A. 2005, ApJ, 618, L157
- Webb et al. (1993) Webb, D. F., Martin, S. F., Moses, D., & Harvey, J. W. 1993, Sol. Phys., 144, 15
- Wiegelmann & Neukirch (2002) Wiegelmann, T., & Neukirch, T. 2002, Sol. Phys., 208, 233
- Wiegelmann et al. (2005) Wiegelmann, T., Xia, L. D., & Marsch, E. 2005, A&A, 432, L1
- Wilhelm et al. (1995) Wilhelm, K., Curdt, W., Marsch, E., et al. 1995, Sol. Phys., 162, 189
- Wilhelm et al. (2000) Wilhelm, K., Dammasch, I. E., Marsch, E., & Hassler D. M. 2000, A&A, 353, 749
- Wuelser et al. (2004) Wuelser, J.-P., et al. 2004, Proc. SPIE, 5171, 111
- Xia et al. (2003) Xia, L. D., Marsch, E., & Curdt, W. 2003, A&A, 399, L5
- Xia (2003) Xia, L.-D. 2003, Ph.D. Thesis (Göttingen: Georg-August-Univ.)
- Xia et al. (2004) Xia L.-D., Marsch E., Wilhelm K. 2004, A&A, 424, 1025
- Yokoyama and Shibata (1996) Yokoyama, T., & Shibata, K. 1996, PASJ, 48, 353