Far-Ultraviolet H2 Emission from Circumstellar Disks
Abstract
We analyze the far-ultraviolet (FUV) spectra of 33 classical T Tauri stars (CTTS), including 20 new spectra obtained with the Advanced Camera for Surveys Solar Blind Channel (ACS/SBC) on the Hubble Space Telescope. Of the sources, 28 are in the 1 Myr old Taurus-Auriga complex or Orion Molecular Cloud, 4 in the 8-10 Myr old Orion OB1a complex and one, TW Hya, in the 10 Myr old TW Hydrae Association. We also obtained FUV ACS/SBC spectra of 10 non-accreting sources surrounded by debris disks with ages between 10 and 125 Myr. We use a feature in the FUV spectra due mostly to electron impact excitation of H2 to study the evolution of the gas in the inner disk. We find that the H2 feature is absent in non-accreting sources, but is detected in the spectra of CTTS and correlates with accretion luminosity. Since all young stars have active chromospheres which produce strong X-ray and UV emission capable of exciting H2 in the disk, the fact that the non-accreting sources show no H2 emission implies that the H2 gas in the inner disk has dissipated in the non-accreting sources, although dust (and possibly gas) remains at larger radii. Using the flux at 1600 Å, we estimate that the column density of H2 left in the inner regions of the debris disks in our sample is less than , nine orders of magnitude below the surface density of the minimum mass solar nebula at 1 AU.
1 Introduction
Gas comprises 99% of the mass of primordial disks. As time increases, it is accreted onto the star, formed into planets, and lost by photoevaporation, leaving behind a debris disk, in which most of the mass is locked into planets and other solid bodies traced by secondary dust arising from collisions. Although the general outline of this process is agreed upon, many specific questions remain unanswered, mainly because the gas is difficult to observe. As a result, only 1% of the disk mass, the dust, has been used as a probe of the disk evolution. However, although interconnected, the evolution of gas and dust may take different paths (Pascucci et al., 2009), making observations of the gas itself necessary to understand these processes. Of particular importance are observations of the gas in the inner disk, because it sets the chemical and physical conditions for planet formation. The bulk of the gas in these cold disks is in H2, which lacks a permanent dipole component, so the pure rotational and rovibrational lines are weak. Nonetheless, extensive surveys of these lines in primordial disks have been carried out (Bary et al. 2008; Bitner et al. 2008, and references therein), and they have been detected in a handful of objects. Searches using less abundant molecules have also succeeded and provided information on the gas in the inner region of gas-rich disks (Carr & Najita, 2008; Salyk et al., 2008; Pascucci et al., 2009; Najita et al., 2008). Gas has also been searched for in disks of more evolved sources which are no longer accreting, within the age range when the transition from primordial to debris is supposed to happen, 5 - 20 Myr. In particular, Pascucci et al. (2006) looked for H2 in the disks of several non-accreting sources and found that the amount of gas still present at 5 - 20 Myr is not large enough to form the gas giant planets at that time. This observation agrees with results indicating that the amount of hot gas in disks of non-accreting sources is decreased when compared to accreting sources (Carmona et al., 2007).
UV observations are very promising for detecting the gas. The strong stellar Ly radiation bathes the UV thin regions of the circumstellar material and, as long as the H2 has a temperature of a few thousand degrees, the line excites electrons to upper electronic states, which produces a plethora of emission lines in the UV when they de-excite (Herczeg et al., 2006, H06, and references therein). At the same time, the stellar high energy radiation fields eject electrons from heavy metals, and the resulting free electrons produce additional electrons by ionizing H and He atoms; these secondary electrons then excite H2 to upper levels, resulting in a characteristic spectrum of lines and continuum in the UV (Spitzer & Tomasko, 1968; Bergin et al., 2004, B0). For electron excitation to work efficiently, temperatures need to be high enough for neutral H to be present. The relatively high temperature requirements mean that the H2 detected by these means must either to be close to the star or to be excited by shocks. UV H2 emission has been found to be extended in objects surrounded by substantial natal material, in the regions where the stellar outflow shocks this material, or in fast accretors, where the H2 may arise in the high density outflow itself (H06). However, without remnant envelopes such as the objects in this study, the only known exception being T Tau, the most likely place to find the required high temperatures is in the inner disk. This makes the UV H2 emission ideal for probing the H2 gas in the innermost regions of disks, regions which are difficult to access by other means.
We obtained ACS/SBC prism spectra of a fair number of accreting Classical T Tauri stars (CTTS), non-accreting weak T Tauri stars (WTTS), and more evolved disks (DD), covering the interesting age range, 1 - 100 Myr. Our goal was to search for UV H2 emission and study its evolution. The poor spectral resolution of the ACS spectra made the identification of Ly fluorescent lines impossible. However, we were able to identify a feature around Å, first proposed by B04 as due mostly to electron impact excitation of H2. In this letter we present and analyze these spectra. We show that the H2 feature is absent in all non-accreting and evolved stars while present in all accreting stars, and use UV fluxes to give very rough estimates of upper limits for the remaining surface density of H2 in the latter.
2 Observations
We obtained observations of 20 CTTS and 10 non-accreting and evolved targets using the Advanced Camera for Surveys Solar Blind Channel (ACS/SBC) on the Hubble Space Telescope in 2007. The observations were obtained in GO programs 10810 (PI: Bergin), 10840 (PI: Calvet) and 11199 (PI: Hartmann). Each ACS observation consists of a brief image in the F165LP filter and a longer image obtained with the PR130L prism. Images appear unresolved. Offsets between the target location in the filter and prism image, including the wavelength solution, were obtained from Larsen (2006). The target spectrum was then extracted from a 41-pixel (1.3”) wide extraction window. Background count rates of 0.05 - 0.1 counts s-1 were calculated from offset windows and subtracted from the extracted spectrum. The absolute wavelength solution was then determined by fitting the bright C IV Å doublet. Fluxes were calibrated from the sensitivity function obtained from white dwarf standard stars by Bohlin (2007). The spectra range from 1230–1900 Å with a 2-pixel resolution of at 1230 Å and at 1600 Å.
Table 1 lists the ACS targets used in this analysis and the properties of these objects. The CTTS sources include 16 objects in the Taurus-Auriga molecular cloud and four sources in the 25 Ori aggregate in the Orion OB1a subassociation. Spectral types for the CTTS in Taurus are from Furlan et al. (2006), and ages from Hartmann (2003). To correct for reddening we used the law towards the star HD 29647 (Whittet et al., 2004) and estimated by de-reddening the median photometry of Herbst et al. (1994) to fit the fluxes of a standard star in the region of the spectrum (V to J bands) where the emission is mostly photospheric111Targets with high mass accretion rate, as DL Tau and DR Tau show significant veiling at J (Edwards et al., 2006), so the estimated extinction may be in error, although it is consistent with values from Taurus.. We obtained accretion luminosities for the Taurus sources using the U band excesses following Gullbring et al. (1998), and the median U from photometry in Herbst et al. (1994). The ages, spectral types, luminosities, ’s, and for the sources in 25 Ori were taken from Briceño et al. (2007); Hernández et al. (2007) and Calvet et al. (2005).
The non-accreting sources (WTTS/DD) were selected to have no evidence of accretion and to have excesses in either Spitzer Space Telescope Infrared Spectrograph (IRS) spectra or 24 and 70 m Multiband Imaging Photometer (MIPS) photometry, indicating the presence of debris disks. The sources in the TW Hydrae Association have been identified as WTTS by spectral observations which showed H in emission (Webb et al., 1999) and strong Li 6707 in absorption (Kastner et al., 1997). The WTTS/DD and their properties were discussed in Carpenter et al. (2009, 2008), Hillenbrand et al. (2008), Verrier & Evans (2008), Chen et al. (2005) and Low et al. (2005). Examples of the ACS target spectra are shown in Figure 1.
We supplemented the ACS data with previously published medium and high resolution STIS data of CTTS (Calvet et al., 2004; Herczeg et al., 2002, 2004, B04). The source properties, listed in Table 1, were taken from Calvet et al. (2004) for the Orion Molecular Cloud sources, and derived as described for the ACS Taurus sources for the STIS Taurus sources. We adopt the spectral type and age from Webb et al. (1999) and from Herczeg et al. (2004) for TW Hya. Accretion luminosities for the STIS sample were taken from Calvet et al. (2004) and Ingleby et al. (2009).
3 Results
Following B04, we identified a feature in the STIS spectra at 1600 Å which is due mostly to electron impact H2 emission. Due to the low resolution of the ACS spectra, we used the high resolution spectrum of TW Hya (Herczeg et al., 2004) to identify this feature in the ACS spectra; in Figure 2 we compare the feature in the observed STIS spectrum of TW Hya and in the STIS spectrum smoothed to the resolution of the ACS spectra. While the H2 lines are no longer observable in the smoothed spectrum, the feature at 1600 Å is.
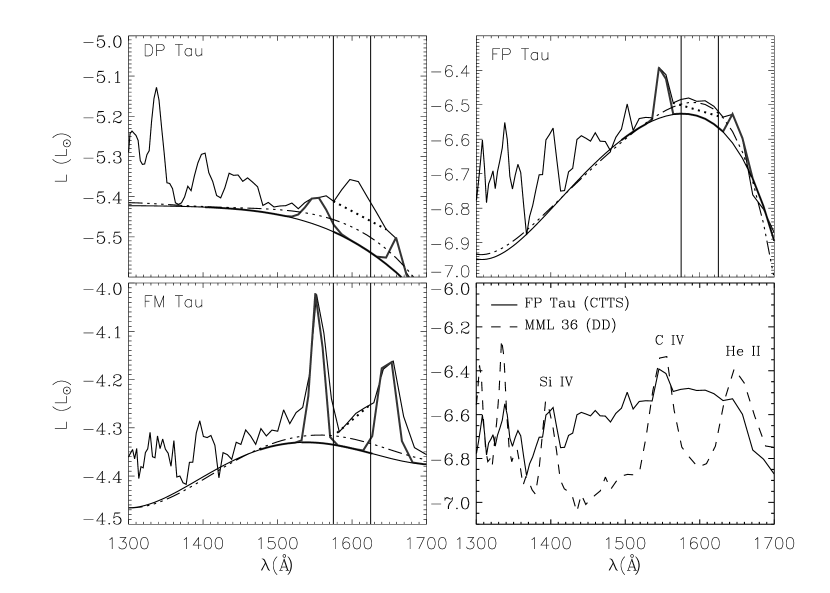
In addition to electron impact H2 emission, the flux at 1600 Å has contributions from accretion shock emission and Ly fluorescent lines (Ingleby et al. 2009). Attempting to isolate an indicator that is due to electron impact H2 emission, we measured the flux between 1575 and 1625 Å and subtracted from it the continuum and the contribution from nearby strong lines (He II 1640 Å and C IV 1550 Å). Since it is unclear how strong the emission from additional sources is at 1600 Å, we calculated the continuum in three ways. First, by joining the troughs in the spectrum on either side of the 1600 Å feature; second, by fitting a 5th order polynomial to the entire FUV spectrum; third, by adopting a continuum which assumes that the rise in the spectrum at 1600 Å is due entirely to electron impact H2 emission. Figure 2 shows the location of the subtracted continuum for each method in TW Hya, and Figure 3 shows examples of the measurements for three ACS targets. These three methods for measuring the H2 feature luminosity were used to estimate the errors. Comparing the TW Hya spectra at both resolutions indicates that the feature luminosity decreases by 2 in the low resolution spectrum because some of the flux is blended into the continuum. This error is small compared to the uncertainty in the continuum location.
Using these procedures, we measured the luminosity of the 1600 Å feature in both the ACS spectra and the STIS spectra smoothed to the resolution of ACS; the feature luminosities are given in Table 1. For the WTTS/DD, we find that the H2 feature is not observable and the values presented in Table 1 are upper limits based on the rms fluctuations from 1575 to 1625 Å. We thus find that the H2 feature shows only in the accreting sources. This is not an age effect; our sample includes CTTS and WTTS of similar age at 10 Myr (left panel of Figure 4) but only the accreting sources show the H2 feature. Moreover, we find a clear correlation of the strength of the feature with in the CTTS (right panel of Figure 4), with a Pearson correlation coefficient of 0.68, indicating that the H2 emission depends on the accretion properties of the source and not on the age. A similar result was found in Carmona et al. (2007), where the probability of detecting near-IR H2 lines was greater in sources with higher accretion rates.
4 Discussion
Free electrons are required for the process of electron excitation to be effective (§1). Since, in turn, high energy radiation fields are necessary to produce fast electrons, the absence of H2 emission in the WTTS/DD could in principle be due to a low level of X-ray or EUV emission in these objects relative to the CTTS. However, Telleschi et al. (2007) found that there is little difference between the X-ray luminosities of CTTS and WTTS in their X-ray survey of pre-main sequence objects in Taurus. Even though there is a soft X-ray excess created in the accretion shock region of CTTS (Günther et al. 2007, and references therein), it does not significantly increase the X-ray production in most young stars (Telleschi et al., 2007). Similarly, Kastner et al. (1997) showed that CTTS and WTTS in the 10 Myr TW Hya Association have similar X-ray luminosities. Moreover, the X-ray luminosity does not decrease significantly over the first 100 Myr of low mass stars (Briceno et al., 1997; Kastner et al., 1997), so the CTTS and WTTS/DD in our sample should have comparable X-ray luminosities.
The EUV radiation field, including emission from approximately 100 to 1000 Å, is also responsible for the ionization of heavy atoms, contributing to the population of free electrons available to excite an H2 molecule. The EUV is difficult to investigate because the radiation is extremely extincted by interstellar hydrogen. Alexander et al. (2005) find that the EUV flux level does not change in the first 10 Myr, from studies of the ratio He II 1640/CIV 1550 Å. If we assume that the FUV level is an indicator of the strength of the EUV emission, we come to similar conclusions. Figure 3 shows one CTTS and one DD that have the same FUV luminosity, so one would expect a strong enough EUV radiation field in both sources to create the free electrons needed to excite H2 if it were present. However, the excess emission at 1600 Å is clearly seen in the CTTS (FP Tau) and absent in the DD (MML 36).
Since the high energy radiation fields in both CTTS and WTTS/DD are comparable in strength, the most likely explanation for the lack of H2 emission in WTTS/DD is that there is essentially no gas in their inner disks. Given the close relationship between the H2 feature strength and shown in Figure 4, our results suggest that H2 gas dissipates in timescales consistent with the cessation of accretion; when the gas is dissipated in the inner disk, there is no material left to accrete.
We use the observations to make a rough estimate of the column density of H2 being collisionally excited. We assume that the H2 is emitted in an optically thin region of the disk with area and thickness . The emitted luminosity per unit volume is , where is the energy of the emitted photon, the H2 cross section, the impacting electron velocity, the electron number density, the electron fraction, and the number density of H2. The expected flux at 1600 Å due to electron impact excitation is then
| (1) |
where is the surface density of H2 excited by electron impacts, the mass of hydrogen, the radius of the emitting region, and is the distance. In Ingleby et al. (2009) we find that the electron excitation model that provides the best fit to the 1600 Å feature of our sample of CTTS with STIS spectra is characterized by a temperature 5000 K and an electron energy of 12 eV. For these values, (Abgrall et al., 1997). According to the thermal models of (Meijerink et al., 2008, M08), gas reaches K within 1 AU of the star, which is consistent with the upper limit to the extension of the H2 emitting region set by the STIS resolution in the case of TW Hya (Herczeg et al., 2002). We further assume that most electrons are capable of exciting H2 and adopt , as well as 1 AU and 0.1 AU (M08). Using these numbers, and assuming that all the flux at 1600 Å is due to electron impact excitation, we get the estimates of in Table 1, which for CTTS are consistent with predicted formation in the uppermost levels of the disk (M08).
A similar estimate can be made for the column density of electron excited H2 in the WTTS/DD in our sample, which have some dust remaining at larger radii but no detected IR H2 lines (Carpenter et al., 2009, 2008; Hillenbrand et al., 2008; Verrier & Evans, 2008; Chen et al., 2005; Low et al., 2005). These estimates are given in Table 1. We used the flux of MML 36, which is the WTTS/DD with the highest flux at 1600 Å in our sample, to estimate the mass of H2 inside 1 AU; we found that there must be less than earth masses, % of the MMSN, lower than the 0.01% of the MMSN estimated by Pascucci et al. (2006). This has important implications for the formation of terrestrial planets, especially if gas is needed to circularize orbits (Agnor & Ward, 2002). Kominami & Ida (2002) theorize that at least 0.01% of the MMSN must be present during the formation of proto-planets, which form around 10 Myr according to simulations by Kenyon & Bromley (2006). Our column density estimates indicate that the amount of H2 gas present in WTTS/DD with ages of 10-100 Myr is too small to circularize the orbits of the terrestrial planets being formed at that time. Our results support the conclusion by Pascucci et al. (2006) that there must be an additional source responsible for damping eccentricities, one possibility being dynamical friction with remaining planetesimals. Another possibility is that other species of gas exist after the H2 has been depleted, for example, C and O have been detected around the 10 Myr debris disk Pic (Fernández et al., 2006; Roberge et al., 2006). C and O do not feel strong radiation pressure due to the low FUV flux in WTTS and therefore may remain after the H2 has been depleted (Roberge et al., 2006).
5 Acknowledgments
We thank Al Glassgold for discussions clarifying the ionization mechanisms in the disk. This work was supported by NASA through grants GO-08317, GO-09081, GO-9374, GO-10810 and GO-10840 from the Space Telescope Science Institute. This material is also based upon work supported by the National Science Foundation under Grant No. 0707777 to EAB.
References
- Abgrall et al. (1997) Abgrall, H., Roueff, E., Liu, X., & Shemansky, D. E. 1997, ApJ, 481, 557
- Agnor & Ward (2002) Agnor, C. B., & Ward, W. R. 2002, ApJ, 567, 579
- Alexander et al. (2005) Alexander, R. D., Clarke, C. J., & Pringle, J. E. 2005, MNRAS, 358, 283
- Bary et al. (2008) Bary, J. S., Weintraub, D. A., Shukla, S. J., Leisenring, J. M., & Kastner, J. H. 2008, ApJ, 678, 1088
- Bergin et al. (2004) Bergin, E., et al. 2004, ApJ, 614, L133
- Bitner et al. (2008) Bitner, M. A., et al. 2008, ApJ, 688, 1326
- Bohlin (2007) Bohlin, R.C. 2007, Instrument Science Report ACS 2007-06
- Briceno et al. (1997) Briceno, C., Hartmann, L. W., Stauffer, J. R., Gagne, M., Stern, R. A., & Caillault, J.-P. 1997, AJ, 113, 740
- Briceño et al. (2007) Briceño, C., Hartmann, L., Hernández, J., Calvet, N., Vivas, A. K., Furesz, G., & Szentgyorgyi, A. 2007, ApJ, 661, 1119
- Calvet et al. (2004) Calvet, N., Muzerolle, J., Briceño, C., Hernández, J., Hartmann, L., Saucedo, J. L., & Gordon, K. D. 2004, AJ, 128, 1294
- Calvet et al. (2005) Calvet, N., Briceño, C., Hernández, J., Hoyer, S., Hartmann, L., Sicilia-Aguilar, A., Megeath, S. T., & D’Alessio, P. 2005, AJ, 129, 935
- Carmona et al. (2007) Carmona, A., van den Ancker, M. E., Henning, T., Goto, M., Fedele, D., & Stecklum, B. 2007, A&A, 476, 853
- Carpenter et al. (2008) Carpenter, J. M., et al. 2008, ApJS, 179, 423
- Carpenter et al. (2009) Carpenter, J. M., et al. 2009, ApJS, 181, 197
- Carr & Najita (2008) Carr, J. S., & Najita, J. R. 2008, Science, 319, 1504
- Chen et al. (2005) Chen, C. H., et al. 2005, ApJ, 634, 1372
- Edwards et al. (2006) Edwards, S., Fischer, W., Hillenbrand, L., & Kwan, J. 2006, ApJ, 646, 319
- Espaillat et al. (2008) Espaillat, C., et al. 2008, ApJ, 689, L145
- Fernández et al. (2006) Fernández, R., Brandeker, A., & Wu, Y. 2006, ApJ, 643, 509
- Furlan et al. (2006) Furlan, E., et al. 2006, ApJS, 165, 568
- Gullbring et al. (1998) Gullbring, E., Hartmann, L., Briceno, C., & Calvet, N. 1998, ApJ, 492, 323
- Günther et al. (2007) Günther, H. M., Schmitt, J. H. M. M., Robrade, J., & Liefke, C. 2007, A&A, 466, 1111
- Hartmann (2003) Hartmann, L. 2003, ApJ, 585, 398
- Herbst et al. (1994) Herbst, W., Herbst, D. K., Grossman, E. J., & Weinstein, D. 1994, AJ, 108, 1906
- Herczeg et al. (2002) Herczeg, G. J., Linsky, J. L., Valenti, J. A., Johns-Krull, C. M., & Wood, B. E. 2002, ApJ, 572, 310
- Herczeg et al. (2004) Herczeg, G. J., Wood, B. E., Linsky, J. L., Valenti, J. A., & Johns-Krull, C. M. 2004, ApJ, 607, 369
- Herczeg et al. (2006) Herczeg, G. J., Linsky, J. L., Walter, F. M., Gahm, G. F., & Johns-Krull, C. M. 2006, ApJS, 165, 256
- Hernández et al. (2007) Hernández, J., et al. 2007, ApJ, 671, 1784
- Hillenbrand et al. (2008) Hillenbrand, L. A., et al. 2008, ApJ, 677, 630
- Ingleby et al. (2009) Ingleby, L. et al., 2009, in prep.
- Kastner et al. (1997) Kastner, J. H., Zuckerman, B., Weintraub, D. A., & Forveille, T. 1997, Science, 277, 67
- Kenyon & Bromley (2006) Kenyon, S. J., & Bromley, B. C. 2006, AJ, 131, 1837
- Kominami & Ida (2002) Kominami, J., & Ida, S. 2002, Icarus, 157, 43
- Larsen (2006) Larsen, S.S. 2006, Instrument Science Report ACS-2006-02
- Low et al. (2005) Low, F. J., Smith, P. S., Werner, M., Chen, C., Krause, V., Jura, M., & Hines, D. C. 2005, ApJ, 631, 1170
- Najita et al. (2008) Najita, J. R., Crockett, N., & Carr, J. S. 2008, ApJ, 687, 1168
- Meijerink et al. (2008) Meijerink, R., Glassgold, A. E., & Najita, J. R. 2008, ApJ, 676, 518
- Pascucci et al. (2006) Pascucci, I., et al. 2006, ApJ, 651, 1177
- Pascucci et al. (2009) Pascucci, I., Apai, D., Luhman, K., Henning, T., Bouwman, J., Meyer, M. R., Lahuis, F., & Natta, A. 2009, ApJ, 696, 143
- Roberge et al. (2006) Roberge, A., Feldman, P. D., Weinberger, A. J., Deleuil, M., & Bouret, J.-C. 2006, Nature, 441, 724
- Salyk et al. (2008) Salyk, C., Pontoppidan, K. M., Blake, G. A., Lahuis, F., van Dishoeck, E. F., & Evans, N. J., II 2008, ApJ, 676, L49
- Spitzer & Tomasko (1968) Spitzer, L. J., & Tomasko, M. G. 1968, ApJ, 152, 971
- Telleschi et al. (2007) Telleschi, A., Güdel, M., Briggs, K. R., Audard, M., & Palla, F. 2007, A&A, 468, 425
- Verrier & Evans (2008) Verrier, P. E., & Evans, N. W. 2008, MNRAS, 390, 1377
- Webb et al. (1999) Webb, R. A., Zuckerman, B., Platais, I., Patience, J., White, R. J., Schwartz, M. J., & McCarthy, C. 1999, ApJ, 512, L63
- White & Ghez (2001) White, R. J., & Ghez, A. M. 2001, ApJ, 556, 265
- Whittet et al. (2004) Whittet, D. C. B., Shenoy, S. S., Clayton, G. C., & Gordon, K. D. 2004, ApJ, 602, 29
| Object | Spectral Type | Age | H2 Feature | ||||
|---|---|---|---|---|---|---|---|
| mag | Myr | g cm-2 | |||||
| ACS CTTS | |||||||
| AA Tau | M0 | 1.1 | 1.4 | 1 | 0.13 | 79.9 | 49.3 |
| CI Tau | K6 | 1.3 | 2.1 | 1 | 0.47 | 3.3 | 9.9 |
| DE Tau | M1 | 1.2 | 1.1 | 1 | 0.16 | 2.9 | 36.3 |
| DL Tau | K7 | 1.0 | 1.6 | 1 | 0.32 | 3.3 | 22.5 |
| DN Tau | M0 | 1.2 | 0.8 | 1 | 0.04 | 0.49 | 18.4 |
| DO Tau | M0 | 1.4 | 2.4 | 1 | 0.29 | 46.1 | 84.6 |
| DP Tau | M0 | 0.2 | 0.5 | 1 | 0.01 | 4.2 | 17.6 |
| DR Tau | K7 | 1.7 | 1.0 | 1 | 1.03 | 14.1 | 43.2 |
| FM Tau | M0 | 0.5 | 1.9 | 1 | 0.30 | 16.0 | 61.7 |
| FP Tau | M3 | 0.4 | 0.1 | 1 | 0.001 | 0.021 | 4.9 |
| GK Tau | M0 | 1.4 | 1.1 | 1 | 0.06 | 0.98 | 18.1 |
| HN Tau A∗ | K5 | 0.2 | 1.2 | 1 | 0.07 | 16.6 | 38.8 |
| HN Tau B∗ | M4 | 0.03 | 0.9 | 1 | – | 0.15 | 5.8 |
| IP Tau | M0 | 0.7 | 0.9 | 1 | 0.02 | 0.61 | 15.0 |
| UZ Tau A∗ | M1 | 0.3 | 0.5 | 1 | 0.02 | 0.80 | 14.3 |
| UZ Tau B∗ | M2 | 0.3 | 1.0 | 1 | 0.02 | 1.5 | 8.5 |
| CVSO 206 | K6 | 0.2 | 0.2 | 9 | – | 1.2 | 13.9 |
| CVSO 35 | K7 | 0.7 | 0.7 | 9 | 0.02 | 3.2 | 16.6 |
| CVSO 224† | M3 | 0.1 | 0.5 | 9 | – | – | – |
| OB1a 1630 | M2 | 1.0 | 0.0 | 9 | – | 1.3 | 13.3 |
| STIS CTTS | |||||||
| BP Tau | K7 | 1.3 | 1.0 | 1 | 0.23 | 14.1 | 41.6 |
| DM Tau | M1 | 0.3 | 0.6 | 1 | 0.08 | 15.4 | 39.5 |
| GM Aur | K3 | 1.2 | 1.1 | 1 | 0.18 | 19.7 | 48.7 |
| LkCa 15 | K5 | 1.0 | 1.0 | 1 | 0.03 | 8.6 | 26.4 |
| RY Tau | G1 | 9.6 | 2.2 | 1 | 1.6 | 338.0 | 148.4 |
| SU Aur | G1 | 7.8 | 0.9 | 1 | 0.10 | 6.8 | 30.0 |
| T Tau | G6 | 7.8 | 1.8 | 1 | 0.90 | 104.5 | 103.9 |
| CO Ori | G0 | 22.3 | 2.0 | 1 | 1.7 | 303.5 | 149.0 |
| EZ Ori | G3 | 5.9 | 0.6 | 1 | 0.10 | 20.0 | 41.1 |
| GW Ori | G0 | 61.8 | 1.3 | 1 | 4.7 | 188.2 | 178.8 |
| P2441 | F9 | 11.5 | 0.4 | 1 | 0.4 | 3.4 | 29.0 |
| V1044 Ori | G2 | 6.7 | 0.4 | 1 | 0.6 | 4.6 | 37.6 |
| TW Hya | K7 | 0.3 | 0 | 10 | 0.03 | 2.6 | 43.9 |
| ACS WTTS | |||||||
| HD 12039 | G4 | – | 0 | 31.6 | 0 | .021 | 2.2 |
| HD 202917 | G5 | 0.7 | 0 | 31.6 | 0 | .016 | 2.8 |
| HD 61005 | G8 | 0.6 | 0 | 125.9 | 0 | .013 | 1.3 |
| HD 92945 | K2 | – | 0 | 20 - 150 | 0 | .006 | 0.93 |
| HD 98800 | K5 | 0.6 | 0 | 10.0 | 0 | .019 | 0.84 |
| MML 28 | K2 | – | 0.1 | 15.8 | 0 | .015 | 2.4 |
| MML 36 | K5 | – | 0.3 | 15.8 | 0 | .042 | 3.3 |
| TWA 7 | M1 | 0.31 | 0 | 10.0 | 0 | .003 | 1.0 |
| TWA 13A | M1 | 0.18 | 0 | 10.0 | 0 | .016 | 1.5 |
| TWA 13B | M1 | 0.17 | 0 | 10.0 | 0 | .002 | 1.5 |
Note. —
∗ Stellar properties for binaries are from White & Ghez (2001). UZ Tau A and B are themselves binaries; UZ Tau A is a spectroscopic binary and UZ Tau B is a binary system (White & Ghez, 2001) but is unresolved by ACS/SBC.
† CVSO 224 is a CTTS surrounded by a transitional disk (Espaillat et al., 2008) and has a very low . The ACS/SBC spectrum of this target is noisy and while we cannot confidently quantify the H2 emission, we do see the rise in the spectrum at 1600 Å which indicates its presence.