Decade time-scale modulation of low mass X-ray binaries
Abstract
Regular observations by the All Sky Monitor aboard the Rossi X-ray Timing Explorer satellite have yielded well-sampled light-curves with a time baseline of over ten years. We find that up to eight of the sixteen brightest persistent low mass X-ray binaries show significant, possible sinusoidal, variations with periods of order ten years. We speculate on its possible origin and prevalence in the population of low mass X-ray binaries and we find the presence of a third object in the system, or long-period variability intrinsic to the donor star, as being attractive origins for the X-ray flux modulation we detect. For some of the objects in which we do not detect a signal, there is substantial short-term variation which may hide modest modulation on long time-scales. Decade time-scale modulations may thus be even more common.
keywords:
Stars: neutron; X-rays: binaries;1 Introduction
Low mass X-ray binaries (LMXBs) are systems in which a compact object accretes matter from a late-type ordinary donor star (main sequence or evolved), which is filling its Roche lobe. They can either be transient or persistent X-ray sources. The former, as the name suggests, exhibit very large changes in timing, spectral, and luminosity properties. Transient outbursts are observed with a wide range of time-scales from hours to 10 yr. Persistent LMXBs, although they undergo out-bursts and flaring episodes, have not been seen to change in luminosity by more than a factor of a few. They have not, by definition, been seen to enter quiescence, a very low luminosity state. They typically contain a neutron star as the accreting compact object. The persistent LMXBs include the so-called Z-sources, Accretion Disc Corona (ADC) sources, and Atoll Sources, where the naming scheme reflects their behaviour on a X-ray hardness/luminosity or colour-colour diagram. Charles and Coe (2006) review observational properties.
The Rossi X-ray Timing Explorer (RXTE, Bradt et al., 1993; Jahoda et al. 1996) is a satellite dedicated to time-domain investigation of X-ray sources. It includes three instruments: the Proportional Counter Array (PCA) for pointed observations in the soft-medium energy band (2–30 keV), the High-energy Timing Experiment for simultaneous high-energy observations (20–200 keV) and the All-Sky Monitor (ASM, Levine et al., 1996). The ASM comprises three shadow cameras, and scans 20% to 80% of the sky every 90 min in the energy range 2–-10 keV. It produces light-curves for all sources of interest (with a spatial resolution of 3–15′), has been operational since 1996, and now provides light-curves for 564 sources. (Note: all raw data is archived, and light-curves can be generated for a given position a-posteriori.)
Accreting binary systems manifest a wide range of timing signals: kHz oscillations and ms bursts/pulsations (possibly from the neutron star surface, Lamb & Miller, 2001), Hz and sub-Hz quasi-periodic oscillations (QPOs) from the inner parts of the accretion disc, and mHz “slow” QPOs perhaps due to feedback processes within the accretion disc (e.g., Bozzo et al., 2009). The time-scale of variability produced by changes in the disc will be related to local Keplerian frequencies, and may also be related to the convection time-scale or viscous in-fall time-scale. Added to this are the periodicities associated with the orbital system: the orbital period and the precession in the disc, which may be the cause of super-orbital such as for Her X-1 (Scott & Leahy, 1999). Clearly, timing of X-ray binaries is a rich source of information on the system dynamics.
Whereas high-frequency, i.e., Hz and kHz, QPOs are extremely well-studied in the literature (e.g., van der Klis, 2004), long time-scale variability is not, since its study requires homogeneous observations with good sampling over time base-lines beyond most observing campaigns. The RXTE/ASM archive provides light-curves of the brightest X-ray sources on the sky in a homogeneous way, and with regular observations. The sample we choose are the persistent neutron star X-ray binaries with typical count rates above 5 cts s-1 in the ASM; this is the same sample as in Reig et al. (2003), less Cyg X-1 (a black hole) but plus Ser X-1. In an investigation of the long time-scale variability of a number of bright sources in X-ray monitoring data, Reig et al. (2003) plotted power density spectra down to frequencies of the order 10-7 Hz (0.3 yr), and interpreted the spectra in terms of red noise.
Wen et al. (2006) were the latest to perform a systematic search for periodicities (or quasi-periodicities) in RXTE/ASM data (see also Levine & Corbet, 2006). They discovered a number of significant peaks in Lomb-Scargle periodograms (Scargle, 1989), but only in a few cases did they report evidence for periods over 100 days. The longest period reported was that of 4U 1820303, and there were also two further objects with power spectrum peaks classified as quasi-periodic.
For details of the objects considered in this work, see the X-ray binary catalogues of Ritter & Kolb (2003) and Liu et al. (2007) and their respective updates, and many references therein. For details on high-frequency timing characteristics, see van der Klis (2004). We summarise brief details of our sample in Table 1.
| Name | Type | Bursts | kHz QPOs | Orbital Period | Comments |
|---|---|---|---|---|---|
| GX 9+9 | Atoll | yes | 4.2 hr | The only object for which a multi-year periodicity has | |
| already been found and discussed (Harris et al., 2009) | |||||
| GX 9+1 | Atoll | yes | |||
| GX 3540 | Atoll | yes | Month time-scale variability in Kong et al. (1998) | ||
| GX 3+1 | Atoll | yes | yes | Makishima et al. (1983) give some evidence of multi- | |
| year variability | |||||
| Ser X-1 | Atoll | yes | yes | ||
| 4U 1735444 | Atoll | yes | yes | 4.7 hr | |
| Sco X-1 | Z-source | yes | 18.9 hr | ||
| 4U 1636536 | Atoll | yes | yes | 3.8 hr | Shih et al. (2005) found 40 day periodicity |
| (see also Belloni et al. 2007) | |||||
| GX 340+0 | Z-source | yes | |||
| 4U 170544 | Atoll | yes | no | 1.3 hr? | possible 223 d on/off cycle (Priedhorsky & Holt, 1987) |
| 4U 182030 | Atoll | yes | yes | 0.19 hr | 176 d cycle, S̃imon (2003) |
| Cyg X-2 | Z-source | ? | yes | 236.2 hr | 39 d period (and strong harmonics, Boyd & Smale. 2004) |
| GX 13+1 | Atoll | ? | 24 d period, possible disc warp (Corbet 2003) | ||
| GX 17+2 | Z-source | yes | no | ||
| GX 349+2 | Z-source | yes | |||
| GX 51 | Z-source | yes |
In Section 2 we analyse light-curves from the ASM aboard RXTE. We find that six show clear modulation with periods of the order 10 yr, and that two more show variability that suggests periodic or quasi-periodic behaviour. We fit these with a simple function, and thereby obtain estimates of periods and amplitudes. In Section 3 we discuss the possible causes of periodicities that could produce such variations, and the prevalence of modulation in the population of persistent X-ray binaries.
2 Analysis and results
We retrieved ASM data, as ten-observation averages across all the available time, from the ASM Weather Map web-page111http://heasarc.gsfc.nasa.gov/xte_weather/ of the sources in Reig et al.’s (2003) neutron star binary sample plus Ser X-1. The data for GX 9+1 was not available from that web page at the time of writing; instead we retrieved one-day averages from the ASM Light Curves Overview page222http://xte.mit.edu/ASM_lc.html. Nine light-curves are plotted in Figure 1. They are all well-sampled, with 3900–7600 points per light-curve. The vertical banding is due to those times when the source was too close to the sun, and therefore no observations were possible. They occur, therefore, once per year, with a typical gap size of order 1-2months, depending on the source position and brightness. We note from the outset, that although the light-curve of GX 340+0 is shown here, the fitted period is much longer than the observation time base-line; we only show it as an example of a long-term trend (see below).
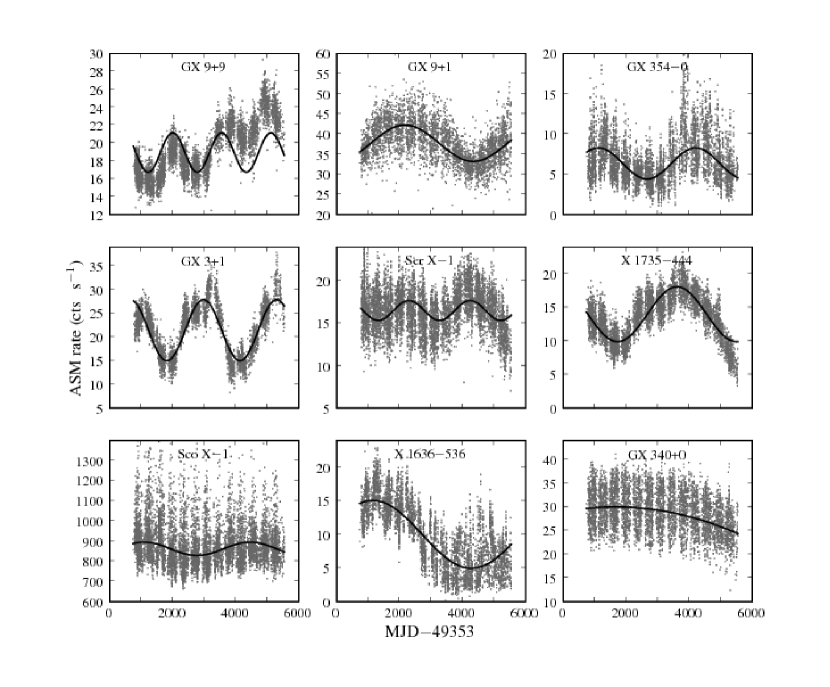
A sine-like modulation is apparent in a number of the light curves. Although clearly no simple model, such as a sinusoid, completely describes the variability in each source (or even necessarily the form of the slow modulation), a simple approach gives useful numeric estimates of amplitudes and periods. Given that only three or fewer cycles are seen, we note that the determination of a period and amplitude does not imply the presence of a true periodicity; this is discussed in more detail below.
To each data-set, we fitted a simple function of the form
| (1) |
giving the flux at day . is a constant, is the amplitude of the sinusoid, is the time of zero phase and is the period. The given uncertainties in each measurement are rather small, typically less than 1 cts s-1. Although we use these uncertainties in our least-squares fits in the calculation of weights, they clearly do not reflect the scatter seen in the measured values, which may be due to additional activity in the source, e.g., short-term flaring. In order, therefore, to derive uncertainties in the fit parameters, we have scaled the given uncertainties such that the best-fit model gives . Note that the uncertainties on each ASM measurement are rather similar throughout a single light-curve, and unweighted fits would yield essentially the same parameters and uncertainties thereon as obtained in our weighted fits.
| Name | Sine-like | Period | Amplitude | Constant | Phase Zero | PL-S 2 | |
|---|---|---|---|---|---|---|---|
| modulation | (d) | (cts s-1) | (cts s-1) | (MJD49353) | |||
| GX 9+9 | yes | 1558(8) | 2.20(5) | 18.95(3) | 49(10) | 1.17 | |
| GX 9+1 | yes | 4340(30) | 4.50(8) | 37.74(6) | 1090(20) | 1.26 | |
| GX 3540 | yes | 3085(30) | 1.92(5) | 6.36(4) | 340(30) | 1.15 | |
| GX 3+1 | yes | 2321(7) | 6.44(6) | 21.44(5) | 72(9) | 1.93 | |
| Ser X-1 | possible | 1945(15) | 1.17(4) | 16.52(3) | 135(13) | 1.06 | |
| 4U 1735444 | yes | 3770(14) | 4.08(4) | 13.99(3) | 1105(6) | 1.72 | |
| Sco X-1 | possible | 3364(60) | 33.1(2) | 861.5(12) | 246(60) | 1.02 | |
| 4U 1636536 | possible | 6254(80) | 5.05(5) | 10.02(6) | 411(60) | 1.66 | |
| GX 340+01 | trend | 68600 | 90 | 60 | 15500 | 1.08 | |
| 4U 170544 | short-term3 | ||||||
| 4U 182030 | short-term3 | ||||||
| Cyg X-2 | short-term3 | ||||||
| GX 13+1 | trend | ||||||
| GX 17+2 | trend | ||||||
| GX 349+2 | trend | ||||||
| GX 51 | no |
1: This fit is highly uncertain, and sample numbers are only indicative. is clearly unphysical.
2: highest Lomb-Scargle power for periods yr.
3: too much variability on short time-scales to be able to reliably determine if there is any slow modulation.
By eye, the fits to the light-curves generally appear to be reasonable. Certainly, a constant plus a sinusoid is preferred over a constant (see Table 2). However, a sinusoid may not be better than other periodic functions or polynomials. Nevertheless, it grossly characterises the variability, and the periods give a good idea of the time-scales involved.
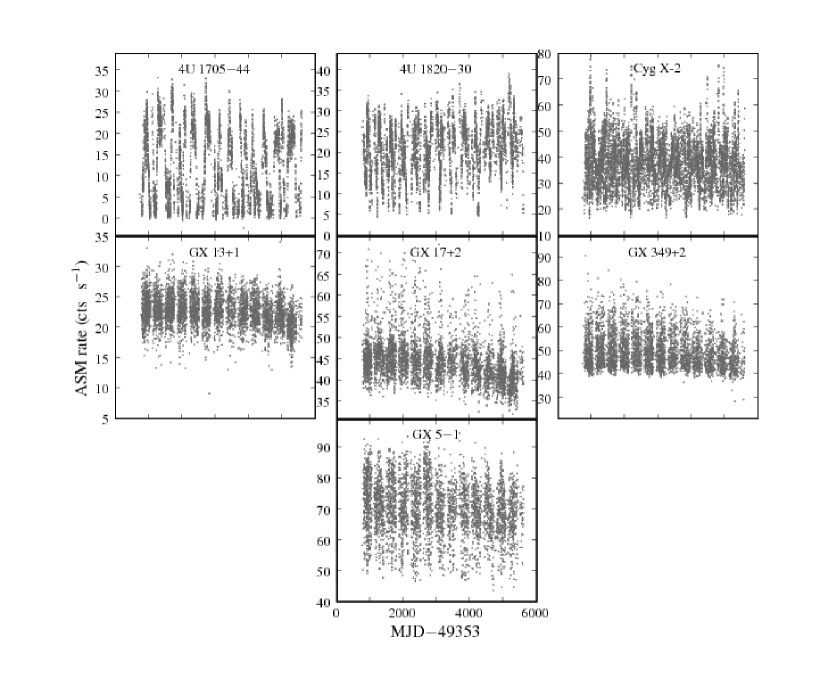
We list all of the objects analysed in Table 2 together with information, where available, on the results of the fits. The fit curves are shown, together with the original data in Figure 1 for the cases where we believe a model fit to be at least a first-order description of the trend in the data. We also include in Figure 1 the light curve of one binary, GX 340+0, that serves as an example of the light-curves which are designated ”trend” in Table 2, wherein the fit produces a period much longer than the observation base-line, and therefore we cannot even claim to have detected a sine-like modulation. The remaining light-curves are shown in Figure 2. The light-curves of some of these sources are dominated by very strong variability on time scales of 40 to 200 days.
The source 4U 1636-536 is an interesting special case. Since MJD 51353 it has shown state transitions between low/hard and high/soft states with the total flux changing by a factor 10, and having a peak value near the typical flux before this behaviour commenced (Farrell et al. 2009). This makes the fit in Table 2 more troublesome, yet it still appears to first order to fit the data points as presented.
Alternative methods are also generally available to assess periodicities, such as phase-dispersion minimisation (PDM; see Schwarzenberg-Czerny, 1997, for a thorough description of the relevant statistics). In the case we have here, however, with data sets covering less than two periods, such methods do not work reliably, as the statistics are dominated by the number of samples in each bin and therefore the number of bins chosen; they become equivalent to coarse re-binning and sine fitting. The power spectrum method below is roughly equivalent to the method of fitting a sine function, but it provides interesting information at all frequencies.
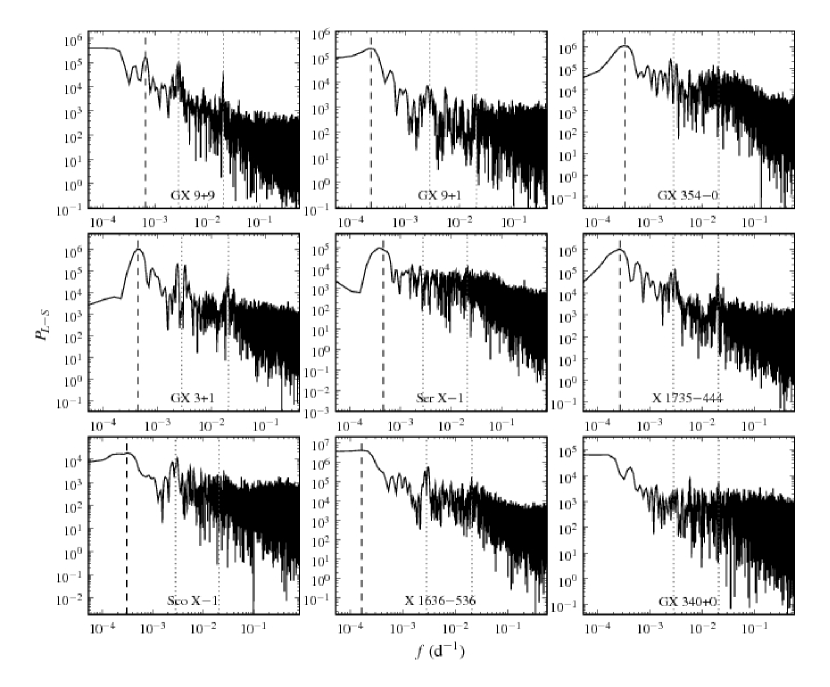
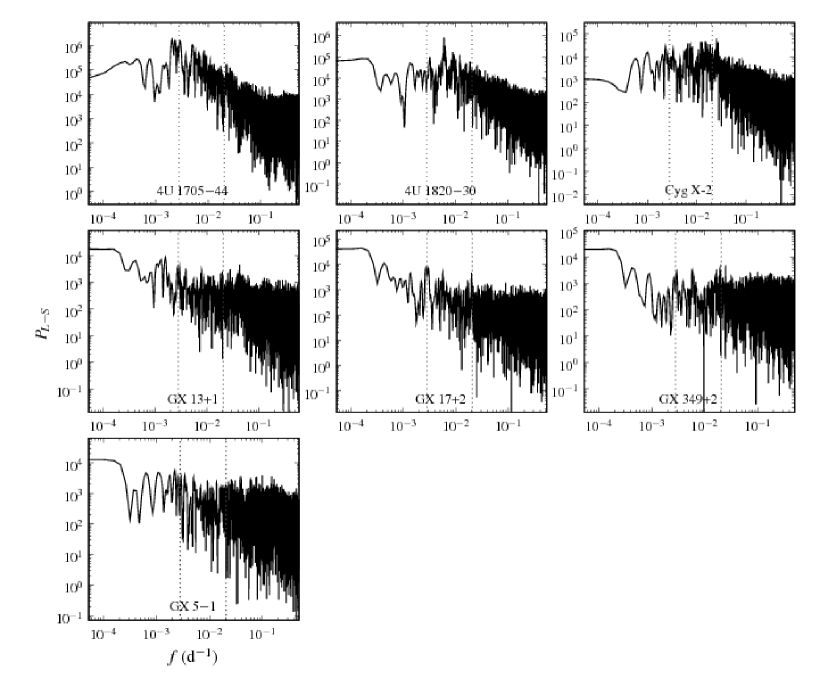
In Figures 3 and 4 we also show the Lomb-Scargle power spectra for all the sources, those with putative periods and those without, respectively (following Scargle, 1989). For each source where we find a periodic solution, this corresponds to the lowest-frequency isolated peak in the power-spectra, with the exception of GX 9+9, where there is an additional high shoulder at the lowest frequencies (see Harris et al., 2009). The diagram for GX 340+0 shows a long-term trend, where the peak is still rising at the low-frequency cut-off. This is similar to the other light-curves labeled as long-term trends in Table 2. Note the spurious peaks at 1 yr and 50 d in Figures 3 and 4. These peaks are artificial, due to the gaps in the data when the source is near the sun: once per year a source is unobservable for a typical 50 d duration (the exact size and frequency of the shorter-period peak depends on how close the source passes to the sun). Another possible origin for the 50 d peak is the precession period of the spacecraft, which affect the number of observations possible during each orbit (e.g., Corbet, 2003). This leaves little sample space left to allow us to measure the red-noise, and thus independently show the significance of the putative periods. We have included the value of the peak power in each power spectrum in Table 2 for reference.
As an interesting aside, we note that the spurious peaks in Figures 3 and 4 are commonly double-peaked about the contaminating frequency. This kind of behaviour was noted by Farrell et al. (2005) at higher frequencies, and ascribed by them to power leakage in the sampling. It may be that similar processes are at work here.
We have also investigated the light-curves of the three separate ASM energy bands (nominally 1.5–3.0, 3.0–5.0 and 5.0–12 keV). We find that the slow modulations are similar in the three bands and, therefore, there do not appear to be any changes in the ratios of fluxes between these bands that are correlated to any large extent with the overall flux.
Having found a number of sinusoidal modulations with amplitudes of 10%–50%, with various periods, for different objects, it seems very difficult to ascribe this effect to some calibration or other instrumental effect. Indeed, the performance of the ASM is checked regularly against the observed emission of the Crab, and corrected for any long-term change in sensitivity (Levine et al., 1996). Note that for some objects in the ASM catalogue, the intensity is stable over many years. See also the discussion in Harris et al. (2009) concerning the fluxes measured in the ASM and the PCA instruments of RXTE - certainly for the case of GX 9+9, the light-curve modulations appear to be real.
3 Discussion
We have found that the light curves of up to eight of 16 bright LMXBs appear to have sine-like modulations that may be characterized by periodicities with periods in the range 1500–6250 d (4–17 yr) and relative amplitudes () of 7–50%. A simple function consisting of a constant plus a sinusoidal function of time provides a first order description of the data, but there is also shorter time-scale variability and scatter and even some long-term trends that are not fit by this simple model. With periods similar to the duration of the total observing window, it is not possible to say if the modulation is strictly periodic, quasi-periodic or chaotic. That the sines fit so closely the forms of some of the light-curves, however, suggests the presence of some kind of periodicity or quasi-periodicity.
The modulation amplitudes above are rather large compared to the X-ray modulations seen due to orbital motion. Excepting eclipsing or nearly-eclipsing systems (called “dippers”), the orbital amplitude is rarely more than a couple of percent (Liu et al., 2007), and indeed some orbital periods have been found from the larger-amplitude optical modulation. Super-orbital periods can be stronger, however: for instance, the amplitude of the 176 day semi-periodic modulation of 4U 182003 is about a factor of 2 (i.e., , Zdziarski et al. 2007), in the same range as our numbers. In a few cases, super-orbital modulations are large enough to be described, in part, as turn on/off events, e.g., as in the case of the 35 day super-orbital period of Her X-1 (Scott & Leahy, 1999). As already mentioned above, short-term variations of luminosity by factors 2 are not uncommon, including some of the sources considered here (see Figure 1 and Table 2).
It is is interesting that it seems to be mostly the Atoll sources which show the type of modulation considered here. Indeed, they seem to be more likely to have shorter-term (of order 30)̣ modulations also. One might suspect that this was due to large fractional erratic variability among the Z-sources, but the light-curves in Figures 1 and 2 do not appear to bear this out. There may be a clue here to what makes the difference between Z- and Atoll sources. There is no obvious relation to bursting or kHz QPO behaviour.
A number of concrete possibilities can be considered as origins for the periods we detect. Since the X-ray emission is powered by accretion onto the compact object in each binary, it is natural to attribute a change in observed flux to a change in accretion rate. In LMXBs, accretion occurs through the transfer of mass from the donor star through the L1 point (known as Roche lobe over-flow); if the un-deformed radius of the star or its magnetic field configuration change on time-scales of order decades, this can explain the modulations we see. Long-period variable stars are known (Wood, 1987), and indeed the sun has a well-studied 11 yr magnetic configuration cycle.
The presence of a third body in a binary system such as a low-mass star, could result in the presence of long-term periodicities. If the modulation seen has the same periodicity as the orbit of this third body, it would need to come close enough in its orbit to tidally interact with the inner binary system at some point during its orbit. The size of the inner binary is determined by the requirement that matter can transfer out of the Roche lobe of the donor, and the total mass is dominated by the neutron star. Thus, for the given periods and a typical K-type or smaller donor star, the orbit of the third body would be of order 100 times the inner binary separation, and may require some eccentricity to get close enough to cause tidal interactions; in this case, a smoothly varying light-curve may be hard to explain. With an orbital period of the order days, however, it can interact with the disc and with the binary. The interaction can induce precession within the inner binary, or possibly directly in the accretion disc though tidal resonances, causing accretion flow variations that have the time-scales of beat periods, much longer than the third body orbital period (Mazeh & Shaham, 1979; Ford et al., 2000). Zdziarski et al. (2007) used such a model to explain the 176 day modulation seen in 4U 182030.
Periodicities due to the disc alone are also possible. For example, precession may occur with respect to the orbital plane and the neutron star spin/magnetic field. The periodicities may be the result of feedback cycles, such as commonly invoked to explain the much stronger cyclic/episodic behaviour seen in X-ray transients. In these, the build up of a magnetic field suppresses the accretion on to the neutron star, but is subsequently suppressed when the disc has built up enough matter (e.g., Lasota, 2008).
We cannot envision a scenario in which the observed X-ray modulations are caused by variable amounts of obscuration, e.g., like that resulting from a precessing warp in the accretion disc (see Ogilvie & Dubus, 2001; Clarkson et al. 2003). Increases in the intervening column density of cool or partially ionized gas would produce stronger variations in the softest energy channel, and this effect is not observed. Alternatively, if the intervening gas were highly ionized, then its origin and substantial modulation would have to be hypothesized without any clear physical motivation. Partial obscuration of the X-ray source by an opaque medium is also a possibility, but it may be difficult to tie such structures to the accretion disc, given the small angular size of the X-ray source and the smooth sinusoidal appearances of the X-ray modulation.
To summarise our findings: out of the sixteen sources considered, we found evidence for sine-like modulation in six, with two more possible cases, and four with long-term variability on time-scales too long for us to be able to determine the form of the modulation or if it is periodic. Only four sources showed no sign of such a signal, and even here for three we may speculate that it is present, but hidden under more prominent short-term variability. Thus it would seem that within the persistent neutron star LMXB population, multi-year periodic or quasi-periodic variability is common. Indeed, some of the systems for which we found no clear modulation are those for which long super-orbital periods were already known (Cyg X2, 4U 182030 and GX 13+1). If the modulation for 4U 1636536 and GX 3540 are real and (quasi-)periodic, they would be a new class of variability, since both systems already have known super-orbital periods.
When the operation of the RXTE ASM terminates some time in the next few years, it will not be possible to monitor these light-curves further in exactly the same way. Hopefully, either the coming MAXI sky monitor on the International Space Station or the ASTROSAT mission with its sky monitor or both will provide a comparable or even better capability. The Swift and INTEGRAL satellites perform regular observations of much of the sky; if they operate over long enough times, their results from somewhat higher photon energies may also be able to provide important information about the modulations of the binary systems studied in this work .
Acknowledgments
MD is supported by the Spanish Ministry of Science under grant AYA20042646; MD and RC receive some support from Consolider-Ingeniero 2010 Program grant CSD2006-00070; RC acknowledges a Ramon y Cajal fellowship (RYC-2007-01046). RXTE is operated by NASA.
References
- [] Belloni, T., Homan, J., Motta, S., Ratti, E., Méndez, M., 2007, MNRAS, 379, 247
- [] Bozzo, E., Stella, L., Vietri, M., Ghosh, P., 2009, A&A, 493, 809
- [] Boyd, P. T., & Smale, A. P., 2004, ApJ, 612, 1006
- [] Bradt, H., Rothschild, R., Swank, J., 1993, A&AS, 97, 355
- [] Charles, P. & Coe, M., 2006, In: Compact stellar X-ray sources, eds Lewin & van der Klis. Cambridge Astrophysics Series, No. 39. Cambridge University Press
- [] Clarkson, W., Charles, P., Coe, M., Laycock, S., 2003, MNRAS, 343, 1213
- [] Corbet, R., 2003, ApJ, 595, 1086
- [] Farrell, S., Barret, D., Skinner, G., 2009, MNRAS, 393, 139
- [] Farrell, S., O’Neill, P., Sood, R., 2005, PASA, 22, 267
- [] Ford, E., Kozinsky, B., Rasio, F., 2000, ApJ, 535, 385
- [] Harris, R., Levine, A., Durant, M., Kong, A., Charles, P., Shahbaz, T., 2009, ApJ, 696, 1987
- [] Jahoda, K., Swank, J., Giles, A., Stark, M., Strohmayer, T., Zhang, W., Morgan, E., 1996, SPIE, 2808, 59
- [] Kong, A., Charles, P., Kuulkers, E., 1998, NewA, 3, 301
- [] Lamb, F. K., Miller, M., C., 2001, ApJ, 554, 1210
- [] Lasota, J.-P., 2008, NewAR, 51, 752
- [] Levine, A., Bradt, H., Cui, W., Jernigan, J., Morgan, E., Remillard, R., Shirey, R., Smith, D., 1996, ApJ, 469, L33
- [] Levine, A. & Corbet, R., 2006, ATel 940
- [] Liu, Q., van Paradijs, J., van den Heuvel, E., 2007, A&A, 469, 807
- [] Makishima, K., Mitsuda, K., Inoue, H. et al., 1983, ApJ, 267, 310
- [] Mazeh, T. & Shaham, J., 1979, A&A, 77, 145
- [] Ogilvie, G & Dubus, G., 2001, MNRAS, 320, 485
- [] Priedhorsky, W., & Holt, S., 1987, Space Science Reviews, v45 no3, 291
- [] Priedhorsky, W. & Terrell, J., 1984, ApJ, 284, L17
- [] Reig, P., Papadakis, I., Kylafis, N., 2003, A&A, 398, 1103
- [] Ritter, H., Kolb, U., 2003, A&A, 404, 301
- [] Scargle, J., 1989, 343, 874
- [] Schwarzenberg-Czerny, A., 1997, ApJ, 489, 941
- [] Scott, D. & Leahy, D., 1999, ApJ, 510,974
- [] Shih, I., Bird, A., Charles, P., Cornelisse, R., Tiramani, D., 2005, MNRAS, 361, 602
- [] S̃imon, V., 2003, A&A, 405, 199
- [] Smale, A. & Lochner, J., 1992, ApJ, 395, 582
- [] van der Klis, 2004, in Compact stellar X-ray sources, Lewin & van der Klis (eds), Cambridge University Press, see astro-ph.10551
- [] Wen, L., Levine, A., Corbet, R., Bradt, H., 2006, ApJS, 163, 372
- [] Wood, P., 1987, LNP, 274, 250
- [] Zdziarski, A., Wen, L., Gierliński, M., 2007, MNRAS, 377, 1006