Surface energies of stoichiometric FePt and CoPt alloys and their implications for nanoparticle morphologies
Abstract
We have calculated surface energies and surface magnetic order of various low-indexed surfaces of monoatomic Fe, Co, and Pt, and binary, ordered FePt, CoPt, and MnPt using density functional theory. Our results for the binary systems indicate that elemental, Pt-covered surfaces are preferred over Fe- and Co-covered and mixed surfaces of the same orientation. The lowest energy orientation for mixed surfaces is the highly coordinated (111) surface. We find Pt-covered (111) surfaces, which can be realized in the L11 structure only, to be lower in energy by about 400 meV/atom compared to the mixed L10 (111) surface. We conclude that in small nanoparticles this low surface energy can stabilize the L11 structure, which is suppressed in bulk alloys. From the interplay of surface and bulk energies, equilibrium shapes of single-crystalline ordered nanoparticles and crossover sizes between the different orderings can be estimated.
I Introduction
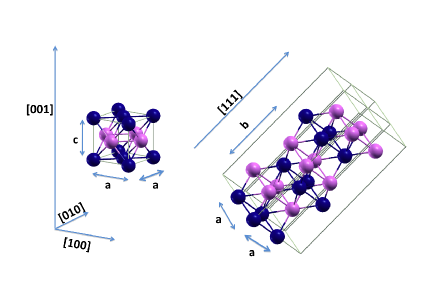
During the last two decades, an exponential increase of the magnetic data storage areal density has been achieved. Thus, in order to continue with this trend, a constant further miniaturization of the bit size is required. Promising candidates for future ultra-high density storage media are L10-ordered FePt or CoPt nanoparticles due to their extraordinary high magnetocristalline anisotropy in the bulk phase (FePt: Ku = 7erg/, CoPt: Ku = 4.9erg/).Perez et al. (2005); Yang et al. (2004); Weller and Moser (1999) The L10-lattice structure is characterized by a tetragonal distortion of a few percent along the -axis accompanied by an alternating stacking of elemental layers along the [001] direction (cf. Fig. 1). The intriguing properties of L10 FePt and CoPt alloys and nano-composites have been subject to numerous experimental and theoretical studies, e.g., see Refs. Lyubina et al., 2005; Honolka et al., 2009; Ködderitzsch
et al., 2007; Shick and Mryasov, 2003; Gruner, 2008; Zotov and Ludwig, 2008; MacLaren et al., 2005; Podgórny, 1991; Solovyev et al., 1995; Antoniak et al., 2008; Friedenberger, 2007 and references therein.
A subtle interplay between surface energies and internal interface energies determines the equilibrium shape of nanoparticles. One major obstacle in producing L10 FePt nanoparticles is the occurrence of multiple twinning.Dmitrieva (2007); Sudfeld et al. (2007); Dai et al. (2002); Wang et al. (2008); Stappert et al. (2003); Rellinghaus et al. (2003); Dmitrieva et al. (2005) Multiply-twinned nanoparticles such as icosahedra or decahedra do not exhibit high uniaxial magnetocrystalline anisotropy energy due to the different crystallographic orientation of the individually ordered twins. Multiple twinning appears if the energy gain due to low surface energies exceeds the energy needed for the creation of twin boundaries. The hierarchy of surface energies is thus one important function determining the equilibrium shape of small nanoparticles.Wulff (1901) Since surface energies are particularly difficult to measure in experiment, their theoretical calculation is an important task.
Apart from the L10 phase, also in the less common L11 structure a high uniaxial magnetic anisotropy is reported.Yamashita et al. (1997); Huang et al. (1999a) In the L11 structure, alternating fcc Cu and Pt layers are stacked along the [111] direction, similar to the L10 structure, which consists of alternating (001) planes (cf. Fig. 1). In contrast to the L10 structure, the L11 phase is only stable for bulk materials in the metallic CuPt alloy.Clark et al. (1995); Lu et al. (1991); Takizawa et al. (1991) Very recently, L11 type CoPt ordered films with a large magnetocristalline anisotropy, comparable in size to L10 type FePt films, were successfully fabricated.Sato et al. (2008); Huang et al. (1999b) Consequently, we include also investigations of L11 ordered FePt and CoPt alloys in our study.
By means of density functional theory (DFT) calculations we have determined surface energies and surface magnetism of various low-index surfaces, including the (100), (001), (110), (011), and the (111) facet in the L10 phase (cf. Fig. 2) as well as the (111) surface of the L11 structure (cf. Fig. 1).
Regarding the surfaces of elemental systems, including bcc Fe surfacesBłoński and Kiejna (2007); Wu and Freeman (1993); Ohnishi et al. (1983); Wang and Freeman (1981), Pt (111) and (001) surfacesMethfessel and Fiorentini (1996); Da Silva et al. (2006), and 4d transition metal surfaces,Methfessel et al. (1991); Fiorentini et al. (1993) numerous studies can be found in literature.Skriver and Rosengaard (1992); Lu et al. (2005); Kiejna (2005); Kiejna et al. (1999) For binary transition metal alloys however, only few investigations are available.Chen et al. (2003); Hong and Yoo (2005)
To the best of our knowledge, this is the first systematic first principles comparison of the energies of various low-index surfaces of FePt, CoPt and MnPt with L10 and L11 order.
II Method
For the evaluation of the surface energies, the so called slab approachMethfessel and Fiorentini (1996) was used. Here, the semi-infinite problem is represented by a periodically repeated two-dimensional slab with two surfaces separating the periodic images by a sufficient amount of vacuum in the third direction. Some representative slabs are shown in Fig. 2.
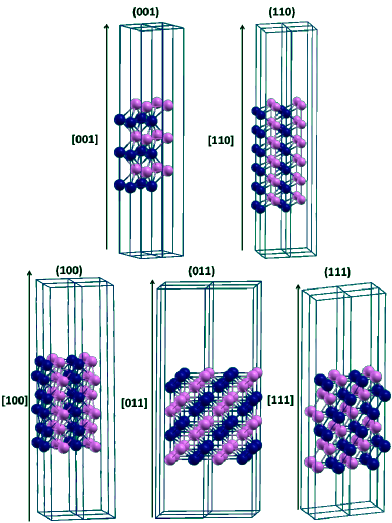
Here it can be seen that for binary alloys two different surfaces are encountered when slabs are stacked along the [001] and [110] direction in the L10 structure and along [111] in the L11 phase. In those cases, one surface is entirely covered by Fe atoms while the other is covered with Pt atoms, respectively. Then the surface energy should be divided into two element-specific contributions as one single material component may be predominantly found at the surface. For these cases, surface-energy phase diagrams have been evaluated in order to account for the surface energies of the single material constituents. Regarding other metallic surfaces and, in specific, semiconductor surfaces, systematic investigations have been devoted to obtain structure, surface free energies, and segregation properties by, among others, the group of M. Scheffler.Reuter et al. (2005); Lee et al. (2000); Moll et al. (1996); Northrup and Froyen (1993); Penev and Kratzer (2005); Kratzer et al. (2003); Kitchin et al. (2008)
II.1 Computational details
The self-consistent calculations are carried out with the Vienna ab initio simulation package (VASP) using a plane wave basis set and the projector augmented wave (PAW) framework.Kresse and Furthmüller (1996); Kresse and Joubert (1999) The exchange-correlation potential is used in the functional form of Perdew, Burke and Ernzerhof (PBE).Perdew et al. (1996, 1992) The PAW potentials include the following valence electrons: Fe: 3p63d74s1, Co: 3d84s1, Pt: 5d95s1 and Mn: 3d64s1. All plane waves with energies below the cut-off energy are included in the basis set. The cut-off energies were always chosen 25% larger than the largest default cut-off of the element-specific potentials. We used (in eV): Fe: 366.5, Co: 335.0, Mn: 337.3, FePt: 366.5, CoPt: 335.0 and MnPt: 337.3. The integration over the Brillouin zone is done by means of finite temperature smearing (Methfessel-Paxton method for the surfaces) or tetrahedron method (for bulk systems). For the first case, the parameter determines the width of the smearing (in eV): -Fe: 0.15, -Fe: 0.32, Co: 0.15, FePt: 0.2, CoPt: 0.28 and MnPt: 0.2. We used the following k-point grids: For bulk calculations: A centered (G) (13/13/13) grid. For (001) surface calculations: -Fe: G (19/19/1), -Fe: Monkhorst (M) generated (16/16/1) grid, fcc Co: M (16/16/1), Pt: G (19/19/1), FePt: M (16/16/1), CoPt: M (14/14/1), and MnPt: M (14/14/1). The parameter has been carefully chosen, so that the entropy term is lower than . The electronic self-consistency iteration cycle is aborted when the energy difference between the old and the new energy is less than 10-7 eV. The slabs used to model the surfaces consist of up to 32 atomic layers. Adjacent supercells are separated by a vacuum region of about 15 Å to avoid interaction between neighboring supercells (Fig. 2). The geometric relaxation is done by the conjugate gradient algorithm and at least the outermost 4 layers are optimized. Relaxation was stopped when the forces were less than 0.1 eV/Å.
II.2 Surface energy calculations
Surfaces can be created by dividing an infinite crystal into two parts. The energy needed to cut the bonds and bring the two resulting parts to infinity determines the surface energy. A straight forward procedure to calculate the surface energy is to examine the total energy of a slab of the material of interest with atomic layers and to subtract times the bulk energy Ebulk of an atomic layer obtained from a separate calculation (e.g., see Ref. Gross, 2003 for a detailed introduction):
| (1) |
Here, is the unit surface area. For sufficiently thick slabs, bulk properties are approached in the interior of the slab and is expected to converge as a function of the slab thickness towards the exact surface energy.
But proceeding as above, the surface energy rather diverges with slab thickness due to slight, unavoidable, numerical discrepancies which can be caused, e.g., by the choice of different basis or k-point grids in slab and bulk calculation.Boettger (1994) In order to avoid this, the so called slab approach was proposed.Methfessel and Fiorentini (1996) Within the slab approach, the bulk energy, , is estimated from the same slab systems for the surface energy calculations instead of using a single separate bulk calculation within a small unit cell. Therefore, the divergence problem can be avoided as consistency in all technical parameters is maintained.
The quantity is extracted as follows: First all of the total energy of various slabs with increasing thickness is calculated and plotted versus slab thickness. For large enough thicknesses the slope of a fitted straight line yields the bulk energy . In the present calculations, the surface energy converges properly if slabs with 6 atomic layers or less are discarded.
When an L10 FePt crystal is cleaved on any of the (100), (011), and (111) planes, the two exposed surfaces are of mixed atomic composition, i.e. they consist of the same amount of Fe and Pt atoms.
On the other hand, in the cases of both (001) and (110) cleavages, one surface consists entirely of Pt atoms while the other surface consists entirely of Fe atoms. Thus, proceeding as described above, we obtain an averaged value over the surface energies of both orientations but no information about the element specific contributions and . However, a variation range for the surface energies can be given by means of surface-energy phase diagrams.Reuter et al. (2005); Lee et al. (2000); Northrup and Froyen (1993); Moll et al. (1996) Two equivalent surfaces on top and on the bottom of the slab require to consider off-stoichiometric systems. If we compare energies of non-stoichiometric systems, the chemical potentials of the single material constituents become involved:
| (2) |
Here, is the number of atoms of the material component and its chemical potential. Eq. (2) is considered here only at temperature T=0. At finite temperatures, the total energy has to be replaced by the Helmholtz surface free energy. A detailed thermodynamic derivation can be found in the literature, e.g., see Refs. Reuter et al., 2005; Zangwill, 1988 for more details. For the case of FePt, Eq. (2) reads
| (3) |
The surface atoms are in equilibrium with the surrounding bulk reservoirs, which consist of the pure Fe or Pt metal and the underlying bulk alloy. Thus, the chemical potentials and are not independent, but related to the bulk alloy chemical potential , the bulk chemical potentials of the elemental constituents and and the heat of the alloy formation :
| (4) |
Unlike in their bulk equilibrium phases, the chemical potentials of the single material constituents within the alloy, , are not known. However, one can eliminate one of them, e.g. :
| (5) |
Here, we assume a slightly Pt-rich environment and the surface stoichiometry is given by NNNFe . The stability of the bulk alloy against decomposition requests that the chemical potential can take only values in the range:
| (6) |
Now we can express Eq. (5) as a function of the difference in Pt chemical potential, :
| (7) | |||||
With the help of this equation, the so-called surface-energy phase diagrams can be determined. This approach has been applied successfully to estimate the stability of various semiconductor surface reconstructions.Reuter et al. (2005); Penev and Kratzer (2005); Kratzer et al. (2003); Penev (2002)
III Results
III.1 Elemental Systems
| System | (111) | (001) | (110) | bulk | ||||
|---|---|---|---|---|---|---|---|---|
| M | M | M | M | |||||
| Co (fcc) | unr | 0.705 | 1.76 | 0.979 | 1.87 | 1.398 | 1.9 | 1.63 |
| r | 0.687 | 1.74 | 0.964 | 1.83 | 1.324 | 1.85 | ||
| Pt (fcc) | unr | 0.650 | 0.0 | 0.918 | 0.0 | 1.370 | 0.0 | 0.0 |
| r | 0.637 | 0.0 | 0.908 | 0.0 | 1.305 | 0.0 | ||
| Fe (fcc) | unr | 0.790 | 2.71 | 0.908 | 2.87 | 1.336 | 2.94 | 2.57 |
| r | 0.790 | 2.71 | 0.906 | 2.86 | 1.288 | 2.88 | ||
| Fe (bcc) | unr | 2.434 | 2.9 | 1.268 | 2.97 | 0.872 | 2.6 | 2.21 |
| r | 2.355 | 2.83 | 1.261 | 2.95 | 0.872 | 2.6 | ||
| Method/ | Co | Pt | –Fe | –Fe | |||||
| Source | (111) | (001) | (111) | (001) | (110) | (111) | (111) | (001) | (110) |
| DFTa | 0.687 (2.045) | 0.964 (2.110) | 0.637 (1.490) | 0.908 (1.840) | 1.305 (1.869) | 0.790 (2.203) | 2.355 (2.694) | 1.261 (2.499) | 0.872 (2.444) |
| DFTIddir et al. (2007),b | 0.660 (1.535) | 0.915 (1.843) | 1.308 (1.863) | ||||||
| DFTGetman and Schneider (2007),b | 0.620 (1.450) | ||||||||
| DFTBłoński and Kiejna (2004) | 2.220 (2.540) | 1.135 (2.250) | 0.803 (2.250) | ||||||
| DFTSpencer et al. (2002),b | 2.203 (2.520) | 1.155 (2.290) | 0.810 (2.270) | ||||||
| DFTVitos et al. (1998),c | 2.694 (2.733) | 1.265 (2.222) | 0.978 (2.430) | ||||||
| DFTWu and Freeman (1993),k | 2.972 (3.400) | ||||||||
| DFTDa Silva et al. (2006),i | 0.710 (1.661) | ||||||||
| DFTDa Silva et al. (2006),j | 0.610 (1.427) | ||||||||
| DFTBłoński and Kiejna (2007),e | 2.260 (2.580) | 1.250 (2.470) | 0.850 (2.370) | ||||||
| DFTMethfessel and Fiorentini (1996),d | 1.245 (2.522) | ||||||||
| DFTAldén et al. (1992),f | 0.907 (2.700) | 1.270 (2.780) | 1.100 (2.180) | 0.949 (2.660) | |||||
| DFTSkriver and Rosengaard (1992),g | 1.100 (3.230) | 0.980 (2.350) | 1.190 (2.480) | 1.150 (3.280) | 1.120 (3.090) | ||||
| TBMehl and Papaconstantopoulos (1996),h | 1.073 (2.510) | 1.397 (2.830) | 2.074 (2.970) | ||||||
| MEAMFoiles et al. (1986),l | 0.616 (1.440) | 0.814 (1.650) | 1.222 (1.750) | ||||||
| MEAMBaskes (1992),l | 0.710 (1.660) | 1.071 (2.170) | 1.487 (2.130) | 1.503 (1.720) | 1.155 (2.289) | 0.559 (1.566) | |||
| Exp.Tyson and Miller (1977),m | () | () | |||||||
| Exp.de Boer et al. (1989),n | () | () | () | ||||||
| Exp.Tyson (1975),m | () | () | |||||||
a Authors: GGA (PBE), VASP.
b GGA (PW91), VASP.
c Full charge density (FCD) method in the GGA, based on linear muffin tin orbitals in tight binding (TB-LMTO) and atomic-sphere approximation (ASA). Unrelaxed surface energies, using a lattice constant Å.
d LDA, FP-LMTO, and Ceperly-Alder parametrization for xc-potential, slab approach.
e VASP, TB-LMTO spinpolarized GGA for xc-potential.
f TB-LMTO, ASA, Ceperly-Alder for xc-potential.
g TB-LMTO, ASA, Ceperly-Alder for xc-potential. Surface relaxation neglected. Using experimental lattice constant.
h Tight binding method (TB). Unrelaxed surfaces geometries.
i All-electron full-potential linearized augmented plane-wave FPLAPW (WIEN97), GGA(PBE).
j FPLAPW (WIEN97), GGA(PBE). Using the experimental lattice constant.
k FPLAPW, LDA, Barth and Hedin formula for exchange-correlation potential.
l Empirical, modified embedded-atom method: MEAM.
m Extrapolation from experimental solid-vapour surface energies at higher temperatures to K (approximation for an "averaged (av)" polycrystalline surface). The solid-vapour surface energy is derived from liquid surface-tension measurements.
n Estimation of surface energy by subtracting from the measured surface-tension of the liquid an entropy term propotional to the melting temperature.
For the elementary systems, the properties of the bulk phases are well known and have been reported previously for most cases.Herper et al. (1999); Entel et al. (2000); Acet et al. (1994); Cleri and Rosato (1993); Khein et al. (1995); Moroni et al. (1997); Kokalj and Causà (1999); Fox and Jansen (1999) Our results match well with these investigations especially with those, where similar methods and technical parameters were used.Moroni et al. (1997); Entel et al. (2000); Kokalj and Causà (1999); Fox and Jansen (1999) For metals with fcc lattice structure, we could confirm the following trend: With decreasing coordination number of the surface atoms, the surface energy, , and the spin moment, M, of the outermost surface layer increases. This correlation is well known in literatureGross (2003); Methfessel et al. (1991) and leads for fcc metals to:
These results match intuition since the surface energy (the energy needed for cutting some "bonds") must grow with decreasing surface coordination number.
The coordination numbers () for the fcc structure are: for the most open surface (110), for the (001) facet and for the most densely packed (111) surface orientation. For the very open bcc geometry we have: for the (001) and the (111) surface and for the (110) surface.
Table 1 presents our calculation of surface energies, , in eV/atom and magnetic moment on surface atom, M, in /atom of all considered elemental systems. Results for unrelaxed (unr) as well as relaxed (r) structures are presented. In the last column, the bulk magnetic moment is given.
For platinum, a large variation in surface energy (by a factor of two) between the most open (110) surface and the densely packed (111) surface is found. In the surface layers, the spin moment is enhanced between and % compared to the bulk value. This is in accordance with the observation of increased magnetic moments in low dimensional systems, e.g., as in small Fe clusters.Rollmann et al. (2004, 2006)
In Table 2, our results for the surface energies are compared to data available in the literature.
For Pt, we find very good consistency of our surface energies with the ab initio calculations of Ref. Getman and Schneider, 2007, Da Silva et al., 2006, Iddir et al., 2007. Concerning the work of da Silva et al.Da Silva et al. (2006) the deviations remain in the range of 4-8%. They use the same functional form for the exchange correlation potential (PBE) and their slabs are relaxed as well. Noteworthy deviations occur in comparison with Ref. Methfessel and Fiorentini, 1996, where DFT calculations within the local density approximation (LDA) are performed. The authors use seven layer of vacuum in between adjacent supercells and do not relax their slabs. Their surface energy for the Pt (001) facet eV/atom is by 27% larger than our value of eV/atom, and presumably related to the different choice of the exchange-correlation potential. For 3-transition metals the LDA is known to show strong over-binding, i.e. cohesive energies turn out to be too large and lattice constants too small compared to experiment. As the surface energy is correlated to the cohesive energy, the values obtained within the LDA can be expected to be too large as well. This is different for the gradient corrected exchange correlation potential where a slight overestimation of the lattice constant is common.
The values reported by Skriver et alSkriver and Rosengaard (1992) using the tight-binding linear-muffin-tin orbital approach (TB-LMTO) with the atomic sphere approximation (ASA) are considerably larger than our PBE-values for all systems under investigation, e.g., larger by 0.4 eV/atom for Co (111). Similar considerations hold true for the data of Ref. Mehl and
Papaconstantopoulos, 1996 which again show strong deviations to larger values. For completeness, we list in Table 2 also semi-empirical and empirical methods, as e.g. the tight-binding and the modified embedded atom method (MEAM). These approaches do not yield the same accuracy of DFT methods but are frequently used for large scale simulations. Here, free parameters are fitted to reproduce certain surface properties and thus can no longer be considered as high-level ab initio investigations.
Also for –Fe very good agreement with other first-principle DFT calculations (Ref. Błoński and Kiejna, 2004, Spencer et al., 2002, Błoński and Kiejna, 2007) is achieved. Slight deviations occur compared to the results of Ref. Vitos et al., 1998, Wu and Freeman, 1993, Aldén et al., 1992 which may again be in part related to the different approximations for the exchange correlation potential as discussed above, different lattice constants or missing relaxation of the surface layer.
If experimental data are available at all, they mostly are obtained by liquid metal surface-tension measurement at higher temperatures and are then extrapolated to K. Thus, they are "averaged" values which can not be attributed to a special surface orientation.
The large discrepancies found in literature show that the calculation of surface energies is a rather delicate task. They should be interpreted in terms of a comparison to other values. This underlines the necessity for a systematic and (technically) consistent comparative investigation of single element and binary transition metal surfaces as presented in this work.
III.2 Binary Alloys of Fe, Co, Mn with Pt
The structural and energetic properties of bulk Pt-based alloys with L10 order have also been subject to numerous theoretical and experimental surveys.Burkert et al. (2005); Shick and Mryasov (2003); Ravindran et al. (2001); Galanakis et al. (2000); Kashyap et al. (1999); Zotov and Ludwig (2008); MacLaren et al. (2005); Solovyev et al. (1995) However, as we also deal with the less well studied L11 structure, we provide a detailed comparison of both phases in the following.
III.2.1 L10 and L11 bulk phases of FePt and CoPt
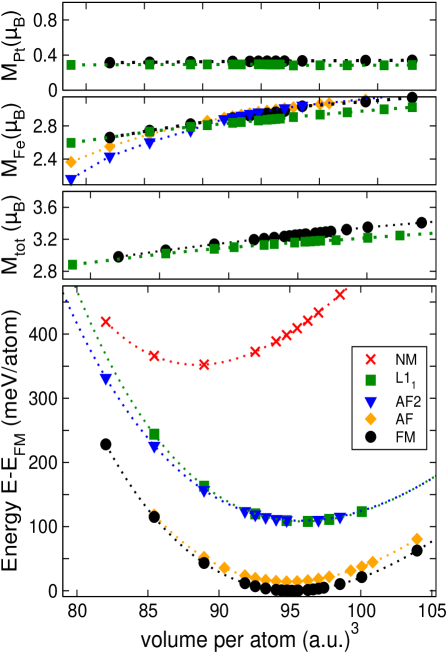
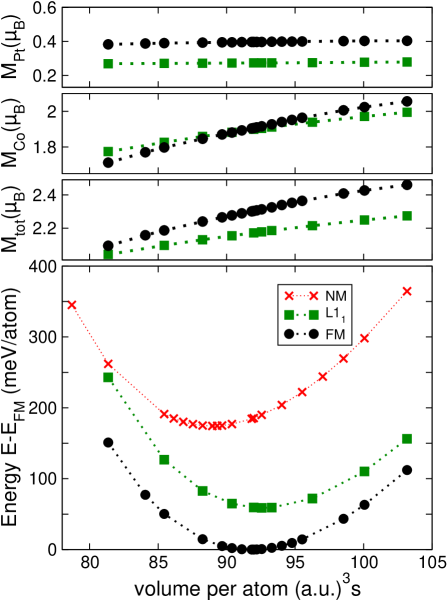
In the left panel of Fig. 3, the energies of different magnetic structures of the ordered L10 and L11 phases are compared as a function of atomic volume.
The ferromagnetic (FM) phase with L10 order is the ground state with a lattice constant of Å. The layer-wise antiferromagnetic order (AF) is only 13.6 meV/atom higher in energy. This shows the competing behavior between ferromagnetism and antiferromagnetism, which has been predicted previously from ab initio calculations for L10 FePt.Zeng et al. (2002); Brown et al. (2003); MacLaren et al. (2005) The L11 structure is characterized by an equilibrium lattice parameter of Å and is found to be 122 meV/atom higher in energy. This is in agreement with the experimental observation that bulk L11 FePt is not stable. However, the energy difference between the phases decreases as the valence electron concentration increases.Dannenberg et al. (2009)
As expected, the total magnetic moment, , in the FM L10 structure and FM L11 structure is dominated by the Fe spin moment, , and steadily increases with increasing volume. The induced Pt moment, , follows the trend of the Fe moments.
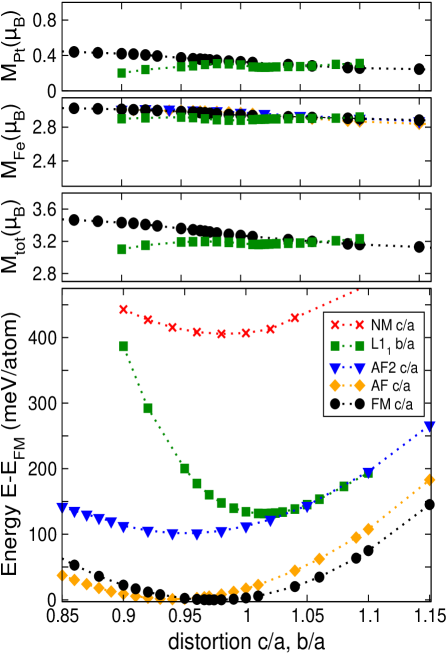
The optimum -ratio is determined keeping the volume at the energetic minimum of the cubic structures fixed (cf. Fig. 3, right).
For the ferromagnetic phase, minimizes the total energy while the antiferromagnetic phase becomes stable at a slightly lower -ratio. For the L11 structure the -ratio is varied and shows that minimizes the total energy (cf. Fig. 3).
The total magnetic moment in the L10 structure decreases with increasing -ratio, while in the L11 phase shows only little variation.
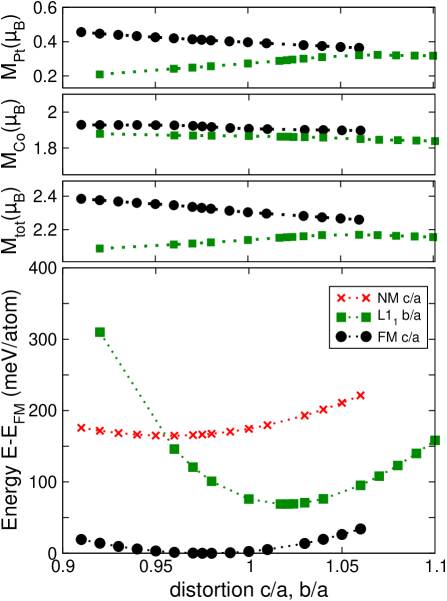
Analogous bulk calculations have been also carried out for CoPt and MnPt. MnPt possesses an antiferromagnetic groundstate with Å and . For bulk CoPt, the energy versus volume curve and the -variation (and -variation for the L11 structure) is shown in Fig. 4. We find the FM L10 structure to be the most stable one with an equilibrium lattice constant of Å and . In the FM L11 structure a lattice parameter of Å and a -ratio of 1.017 is obtained. The FM L11 structure is higher in energy.
The magnetic spin moments show qualitatively the same behaviour as for FePt. But interestingly, the induced Pt moment is as high as in the case of FePt, even though the spin moment of the Co atom is clearly lower than the spin moment of the Fe atom. Thus, the hybridization between the Co and the Pt -electrons seems to be stronger than in the FePt alloy. Furthermore, for CoPt, the hybridization is stronger in the L10 phase than in the L11 phase.
III.2.2 Surface properties of FePt, CoPt, and MnPt
| (hkl)/Structure | FePt (fct) | CoPt (fct) | MnPt (fct) | ||||||
| FM, | FM, | AF, | |||||||
| M | M | M | |||||||
| (eV/atom) | (eV/atom) | (eV/atom) | |||||||
| (111)av/L11 | unr | 0.690 | 1.63 | 0.694 | 1.15 | ||||
| r | 0.675 | 1.781 | 1.63 | 0.675 | 1.717 | 1.15 | |||
| (100)/L10 | unr | 0.976 | 1.78 | 0.978 | 1.25 | ||||
| r | 0.967 | 2.125 | 1.75 | 0.947 | 2.125 | 1.23 | |||
| (011)/L10 | unr | 1.407 | 1.82 | 1.409 | 1.26 | ||||
| r | 1.310 | 2.008 | 1.81 | 1.287 | 2.024 | 1.26 | |||
| (111)/L10 | unr | 0.714 | 1.71 | 0.682 | 1.19 | 0.649 | 3.80 | ||
| r | 0.701 | 1.763 | 1.69 | 0.654 | 1.680 | 1.19 | 0.626 | 3.83 | |
| (001)av/L10 | unr | 1.038 | 1.70 | 1.005 | 1.19 | 1.025 | 3.89 | ||
| r | 0.991 | 2.121 | 1.70 | 0.977 | 2.192 | 1.20 | 0.986 | 3.85 | |
| (110)av/L10 | unr | 1.440 | 1.80 | 1.422 | 1.27 | ||||
| r | 1.342 | 2.085 | 1.77 | 1.284 | 2.039 | 1.57 | |||
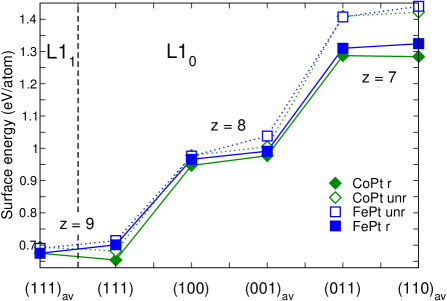
Most preceding surface energy studies for binary alloys have been carried out for ideal cleaved surfaces, neglecting the effects of possible relaxations. To close this gap and to give an account on the importance of relaxations in FePt and CoPt surfaces, the surface energies of L10 and L11 FePt and CoPt with subsequent relaxation of the atomic positions are compared in Fig. 5 for all investigated surfaces.
For the slabs with two different surfaces the values are averaged over both possible terminations, i.e., for the L10 phase, the (001) and the (110) facet and in L11 the (111) facet.
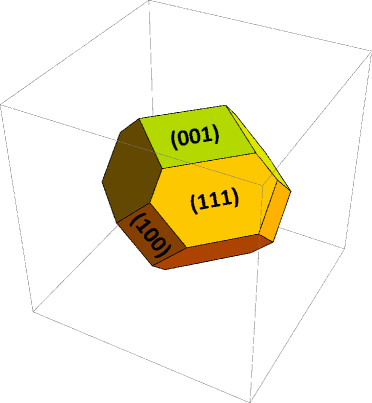
Lowest surface energies are found for the highly coordinated (111) facet: In the case of L11 FePt and CoPt we find: eV/atom, in the case of L10 FePt: eV/atom, and for L10 CoPt our calculations yield: eV/atom (cf. Table 3). These results may to some extent explain the trend that in gas phase experiments frequently FePt icosahedral nanoparticles with platinum covered (111) surfaces are generated.Stappert et al. (2003); Rellinghaus et al. (2003); Dmitrieva et al. (2005) The more open (100) facets, which occur in the L10 cuboctahedron (cf. Fig. 11) which is desired for magnetic data storage media, lie with higher in energy. The highest surface energies are found for the most open facets (011) and (110). Qualitatively similar results have been found for L10 PdZn and PtZn.Chen et al. (2003) Again, the surface energy decreases with increasing coordination numbers analogous to the trend for the fcc metals.
The modification of the surface energy by relaxation is maximum for the most open surfaces (cf. Fig. 5). Here, a reduction of the surface energy of about 7% occurs while for the densely packed (111) facet the reduction amounts only to approximately 2%.
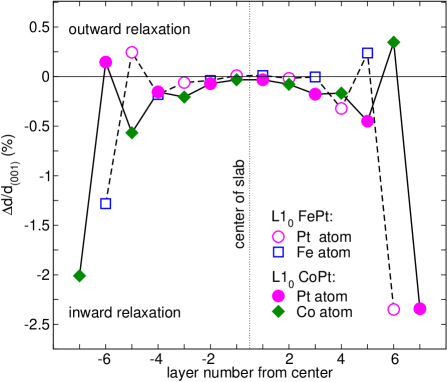
The layer resolved atomic relaxation processes is shown in Fig. 6.
The outermost layers of the slab move slightly inwards. Here, the relative displacement amounts to about 1.25% for the Fe surface layer, about 2% for the Co surface layer, and about 2.3% for the Pt surface layers. In the interior of the slab, the relaxation shows an oscillating behaviour which disappears for FePt beneath the fourth subsurface layer. This agrees with previous findings for bcc Fe surfacesBłoński and Kiejna (2007) and FePt nanoparticlesGruner (2008).
The relaxation in this (001) slab system is significantly lower than for the (111) facet of a L10 FePt cuboctahedron (ca. 8%).Friedenberger (2007); Sudfeld et al. (2007) This agrees well with the experimental findings in the case of cuboctahedra, where no noteworthy relaxation of the (001) and (110) surfaces is found.
The relaxation behaviour of elementary metal surfaces has been subject to various studies in the past six decades.Smoluchowski (1941); Finnis and Heine (1974); Pettifor (1978); Landman and Hill (1980); Heine and Marks (1986); Methfessel et al. (1991); Zólyomi et al. (2009)
For transition metals, it has been attributed to the competing influence of the partial pressures arising from the localized -bonds on the one side and the -electrons on the other, which are partially relieved at the surface.Pettifor (1978) However, the picture for the complete transition metal series is not uniform. While for most transition metal systems with a nearly half-filled -band strong inward relaxation is observed, the effect diminishes towards the end of the series and eventually reverses sign for the noble metals Pt and Au.Heine and Marks (1986); Methfessel et al. (1991); Zólyomi et al. (2009) The effective inwards relaxation, which we observe for the binary FePt and CoPt surfaces is thus certainly influenced by the hybridization of the and electrons within the surface and subsurface layer.
Now we turn to the question how the single material constituents contribute to the averaged values. The exact determination of, for example, (001) in FePt (cf. Fig. 2) is not possible within the slab approach due to the missing knowledge of the chemical potential of the material components in the alloy. But the range of variation for the surface energy can be given by means of surface-energy phase diagrams. Here the two limiting cases for (001) in FePt are calculated by artificially varying the stoichiometry and with this the difference in Pt chemical potential as explained in section II.2, cf. Eq. (5).
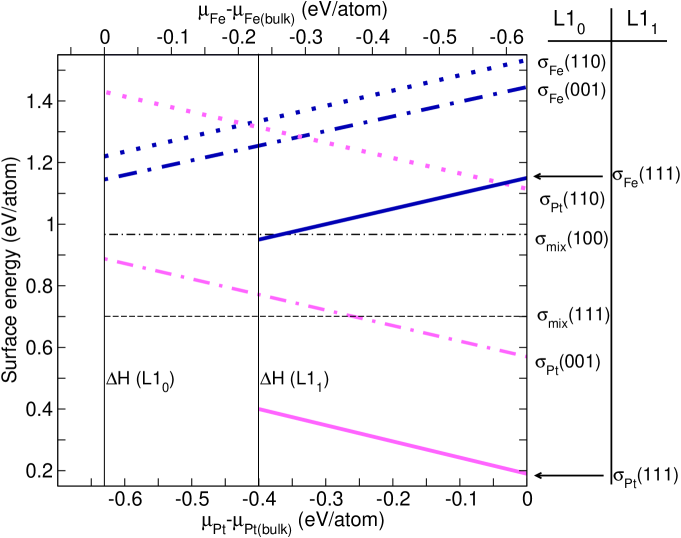
Our results for the surfaces energies in FePt are collected in the surface-energy phase diagram shown in Fig. 7. The data are in perfect agreement with Hong et al.Hong and Yoo (2005) (see Table 3) which were also obtained using the simulation package VASP. In addition we consider facets with two different terminations and surfaces compatible with L11 order. Vertical lines in Fig. 7 and Fig. 8 mark the limiting cases for the difference in Pt chemical potential given by the formation enthalpies in the L11 and L10 phase and the zero value, as for negative values () no alloying would occur. At the right side of the diagram, a Pt rich environment is assumed and thus and : The surface atoms are in equilibrium with the surrounding Pt-metal and the underlying FePt bulk reservoir. On the left border, at eV, an Fe-rich environment in the L10 structure is assumed and therefore . The vertical line at eV corresponds to in the L11 phase. The two limiting cases for (inserted into Eq. 7) yield the corresponding limiting values for the realistic value of .
When we artificially vary the stoichiometry by varying on the horizontal axis, at the same time the difference in Fe chemical potential changes inversely (upper horizontal axis), as can be seen from equation (4).
The surface energy of Pt covered, i.e. not mixed, (111) facets in the L11 structure can take extraordinarily low values (in eV/atom):
| (8) |
These have direct consequences for FePt nanoparticle morphologies and confirm the results of previous ab initio cluster simulations.Gruner et al. (2008) These predict radially onion-shell type ordered core-shell icosahedra to be energetically favored over single crystalline L10 cuboctahedra for small particle diameters. The low energy of Pt-terminated (111) facets overcompensates the high energy of the 20 twins, which possesses an individual L11 order and the additional contribution of the twin boundaries.
For comparison the particle surface energies of orientations with mixed atomic composition as the (100) and the (111) facet in the L10 phase are given in Fig. 7, too (horizontal lines).
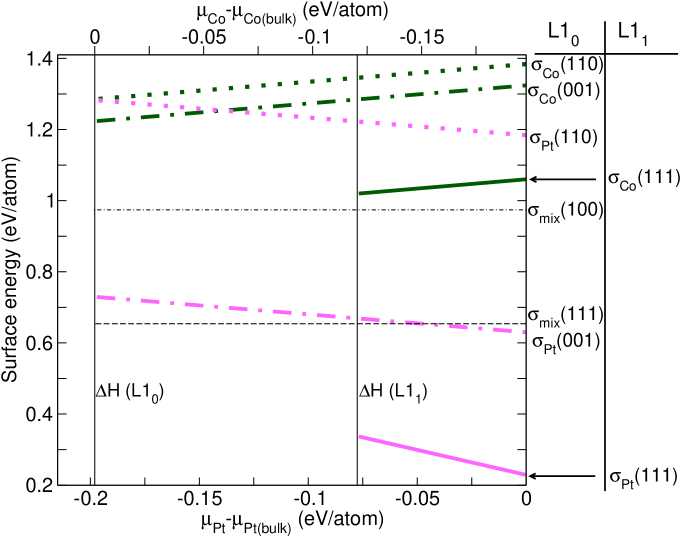
A further promising candidate for future ultra-high density magnetic storage devices is L10 CoPt due to its similar high magnetocristalline anisotropy energy in the bulk phase (K).
Therefore, analogous calculations were done for CoPt surfaces (cf. Fig. 8). Qualitatively the same trends for the surface energies were found. Pt-covered (111)-facets in the L11 structure are here even more favorable (see Table 3).
In general, we find that elemental, solely Pt-terminated surfaces are preferred over Fe covered and mixed surfaces of the same orientation. The consistently low surface energy of Pt covered facets may be regarded as one important driving force for the strong surface segregation tendency of Pt in these alloys.Ma and Balbuena (2008); Yuge et al. (2007)
The lowest energy orientation for mixed surfaces is the highly coordinated (111) surface in accordance with the elemental systems discussed in Section III.1.
For binary systems with perfect L10-order, (111) surfaces which are covered by only one atomic species can not exist for geometric reasons. On the other hand, this surface modification can be realized for the L11 structure, which is however not stable for bulk FePt. Thus, a sufficiently low surface energy may stabilize the L11 structure in small particles.
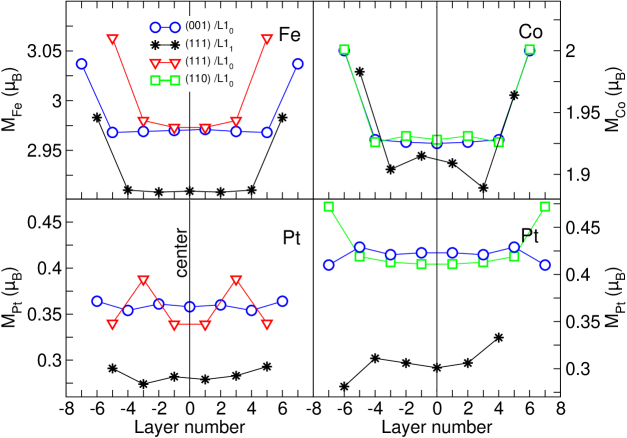
In addition, we have investigated the distribution of the Fe (Co respectively) spin moments and induced Pt moments inside relaxed L10 and L11 FePt and CoPt slabs with various surface orientations and different surface terminations (cf. Fig. 9). For the case of FePt, we consider an Fe termination for the (001) slab in L10 order and the (111) slab in L11 order. (The (111) surface in the L10 order always consists of mixed atomic composition). For comparison we have chosen for CoPt a Pt-covered (001) and (110) slab in the L10 phase while the (111) slab in the L11 phase has one Co and one Pt surface. The (111) and (110) surfaces in L10 phase are qualitatively the same for both alloys and are thus shown only once. Again, the spin moment of the transition metal atom is enhanced by about at the outermost layers. The induced Pt surface moments show a strong dependence of the number of neighboring transition metal atoms. In the outermost layer, the Pt atoms lose a part of their magnetic partners. For the (111) FePt surface in the L10 phase, which consists of Fe and Pt atoms (mixed atomic composition), the missing magnetic Fe neighbors are decisive for the reduced Pt moment in the outermost layer. In contrast to the situation in the subsurface layer: Here, the Pt atoms have full coordination and thus show an enhanced moment due to the large Fe moment in the surface layer. In a similar manner the Pt moment is slightly enhanced in the subsurface layer of the Fe terminated (001) slab in L10 order and the (111) slab in L11 order. For CoPt this simple rule does not seem to hold true as we find an enhanced Pt moment for the Pt surfaces in the (110) slab in L10 order as well.
Recently performed ab initio cluster simulations revealed that the stability of single crystalline morphologies might be stabilized in these alloys by reducing the number of 3d electrons.Entel and Gruner (2009); Gruner et al. (2008); Gruner and Entel (2009) In an extreme case, this may be achieved by changing from FePt to MnPt, as Mn has one 3 electron less than Fe. On the other hand, one has to take care of the strong antiferromagnetic tendencies present in Mn alloys.
Therefore, we considered the most relevant surfaces (001) and (111) in the L10 structure of AF MnPt. A collection of calculated surface energies and surface spin moments for FePt, CoPt and MnPt are listed in Table 3.
The surface energies of the (001) facets only vary in between 15 meV/atom for the different binary alloys.
For the (111)-facet the variation amounts to 70 meV/atom.
Also for MnPt the (111) surface is more favorable than the (001)-facet with an even increasing energy difference. Further investigation of non-stoichiometric ternary Fe-Mn-Pt alloys might thus be an interesting task.
III.2.3 Stability range of L10- versus L11-ordered clusters
In order to get an idea of the influence of the calculated surface energies on the equilibrium shape of small nanoparticles, we apply a simple approach to approximate the stability range of different structural morphologies in the L10 and competing L11 order.
In the limit of large diameters the particles can be regarded as spherical.
For a first rough estimate we make only use of the energy differences between the L10 and L11 order for volume and for surface atoms of the lowest energy surfaces. These are the platinum covered (111) facets in the L11 structure and the platinum covered (001) facets in the L10 phase. A more realistic picture should also take into account twin boundary energies and internal stress. As the L11 phase is not stable for bulk FePt, completely L10-ordered particles are expected for large diameters. But with decreasing volume, the surface to volume ratio increases and the extraordinarily low surface energy of the platinum covered (111) facet in the L11 phase gains increasing importance.
Because of this, the L11-order becomes more favorable than the L10-ordering for particle sizes below a critical diameter. At this critical diameter, the gain in surface energy is equal to the energy loss due to L11 ordering. For FePt we find a critical diameter of 3.7 nm and 6 nm for CoPt for averaged values of in agreement with total energy calculations of binary transition metal clusters ( Appendix A for more details).Gruner and Entel (2009)
However, the equilibrium crystal shape of an arbitrary particle is not necessarily spherical.
Following the investigation of the structural stability of single crystalline and multiply twinned FePt nanoparticles, which has recently been performed by Müller and Albe,Müller and Albe (2007) we apply a more detailed continuum model, in which the different surface energies of the various facets are taken into account in terms of a Wulff construction. Müller and Albe considered symmetric particles and surfaces with mixed atomic composition only. We will also allow for asymmetric particle morphologies in the following, details are given in Appendix B.
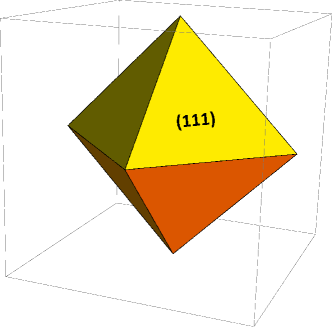
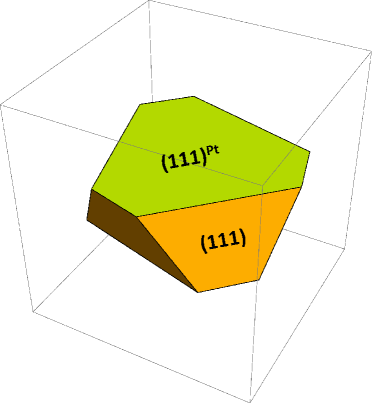
Thus, an octahedron which is solely terminated by (111) facets may be considered as a favorable particle morphology (cf. Fig. 10). Other candidates are multiply twinned morphologies as icosahedra. Here, the calculation of optimum shapes requires the calculation of twinning energies which is beyond the scope of this paper. Therefore, we compare only two competing single crystalline structural motifs: On the one hand, the above mentioned L11 ordered octahedron with two elemental Pt covered (111) surfaces and six (111) facets of mixed atomic composition (cf. Fig. 10 and Fig. 12) and on the other hand, the L10 ordered Wulff polyhedron with eight (111) facets of mixed atomic composition, two elemental Pt terminated (001) facets, and four (100) surfaces covered with Fe as well as Pt atoms (cf. Figure 11).
The resulting energy differences, , are shown in Figure 13 for FePt (blue) and CoPt (green). These are given as a function of , describing the distance of a (111) facets from the particle center. In addition, we consider the possible variation of the surface energy of Pt terminated (001) facets in L10 and (111) facets in L11 order with the chemical potential.
This it is important to mention, since these asymmetric binary structures are in general non-stoichiometric and the composition differs between the two morphologies. Therefore, in a strict sense, we can only give an estimate of the stability range of the different morphologies in the two competing ordered phases.
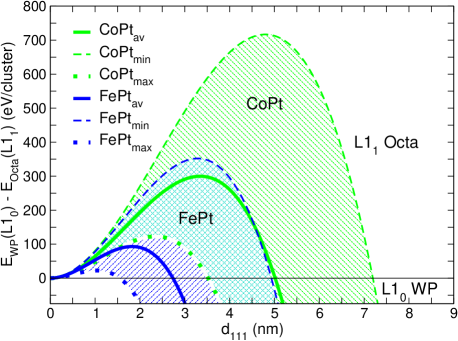
For FePt as well as CoPt the asymmetric L11 ordered octahedron is the energetically preferred particle morphology for sufficiently small particle sizes. Using averaged surface energies of Pt terminated (001) facets in L10 order and (111) facets in L11 order, the L11 octahedron is lower in energy for distances nm for FePt (blue solid line). This corresponds to particle diameters up to nm (assuming a spherical particle with equal volume) and a total number of approximately atoms per cluster. The energetic advantage of the L11 octahedron becomes maximum for nm which is equal to a particle diameter of approximately nm (about atoms) and amounts to eV/cluster (35.7 meV/atom) (see Figure 13).
Applying the same considerations to CoPt leads to a critical particle diameter of approximately nm below which the L11 order is the thermodynamically stable phase. At a particle diameter of nm, the maximum energy difference ( meV/atom) is reached. Here, the CoPt L11 octahedron contains about atoms.
If one takes the minimum possible surface energies for Pt terminated (001) facets in L10 order and (111) facets in L11 order, the L11 octahedron is stable up to nm for FePt, which corresponds to a critical diameter of nm, and nm for CoPt (critical diameter of nm). Taking the opposite case, i.e. maximal Pt surface energies, leads to the dotted lines. Here, the L10 ordered Wulff polyhedron is the thermodynamically stable morphology for particle diameters larger than nm (critical diameter nm) for FePt and nm (critical diameter nm) for CoPt. In summary, the L11 ordered, Pt terminated, asymmetric octahedron can be expected for particle diameters between nm and nm for FePt and between nm and nm for CoPt. This large expectation ranges of 7.5 nm for FePt and 8.5 nm for CoPt must be seen as a kind of error bar, due to the missing knowledge of the chemical potential of the single material components.
Nevertheless, in comparison to the simplified considerations above these results yield on average even larger diameters and thus support the prediction that L11 ordered nanoparticles with Pt covered (111) facets are a competitive particle morphology for small cluster sizes for both, FePt and CoPt binary alloys.
Multiply twinned morphologies as icosahedra, which have been investigated in Ref. Gruner et al., 2008, might even further optimize the area of favorable Pt-covered (111) surfaces, while providing a more spherical shape. This however is achieved at the expense of internal interfaces, which need to be considered separately.
IV Conclusion
We have calculated surface energies and surface magnetism of various low indexed surfaces for the elemental systems bcc and fcc Fe, fcc Co, fcc Pt and for the binary (fct) alloys FePt, CoPt, and MnPt. For Fe, Co and Pt we have considered the (001), (110) and the (111) surfaces. In addition, also the (100), (011) orientation in the L10 phase and the (111) surface in the L11 structure have been examined for the binary alloys.
The surface energies were determined using the slab approach. For the special surface orientations in the binary alloys with more than one possible coverage, surface-energy phase diagrams have been evaluated in order to account for the surface energy contributions of the single material components.
For all systems under investigation, (111) facets show the lowest surface energy. Especially Pt covered (111) surfaces, as found in L11 ordered FePt, possess an extraordinarily low surface energy which is considerably lower than the respective surface energy of pure Pt. This gives rise to the preferred appearance of Pt terminated core-shell icosahedral nanoparticles in gas-phase experiments and agrees well with the results of theoretical cluster calculations which show that platinum terminated, radially L10-ordered core-shell icosahedra are energetically favorable.Gruner et al. (2008); Gruner and Entel (2009)
The surface energies of CoPt qualitatively follow the same trend as found for FePt:
. For L10 MnPt, the surface energies of the (001) and the (111) facet lie in the same range as those of FePt and CoPt while (111) surfaces are still previleged. We may speculate that the addition of Mn to FePt should not substantially modify the relation of the surface energies. The surface energy of purely Pt-covered surfaces is always lower than the energy of the elemental surfaces of the corresponding 3d-metal.
These results allow us to estimate the stability range of the most favorable particle morphologies in L10 and L11 order. In a first simple approach, relying only on the energy difference between the L11 and the L10 structure for bulk and for surface atoms, we can derive a critical diameter below which the L11 phase may be stabilized. For FePt, this diameter is about , which is in good agreement with ab initio cluster simulations.Gruner and Entel (2009) For CoPt we find a critical diameter of .
Similar crossover sizes were obtained within a refined continuum model, which allows to assess contributions of different faces more precisely. Assuming single crystalline particles, candidates for stable structures can be determined following the Wulff construction: Favorable single crystalline morphologies are the non-spherical Wulff polyhedron with Pt covered (001) facets for the L10 order and the asymmetric octahedron with Pt covered (111) facets in case of the L11 order. Comparing the total energy of those two structural motifs and using averaged Pt chemical potential yields a critical diameter of nm diameter for FePt and nm diameter for CoPt below which the L11 ordered, asymmetric octahedron is the energetically preferred structure.
This underlines the central result of this study, that the extraordinarily low surface energy of elemental Pt terminated (111) facets of L11 bulk crystals may stabilize FePt and CoPt nanoparticles with L11 crystalline order for sufficiently small particle diameters - although the corresponding bulk materials are unstable in the L11 structure.
Acknowledgements.
The authors would like to thank P. Kratzer and H. C. Herper for fruitful discussions. Financial support was granted by the Deutsche Forschungsgemeinschaft (SFB 445 and SPP 1239).Appendix A Spherical model for the clusters
In the limit of large diameters the particles are assumed to be spherical and the difference in surface energy per atom is approximated by . The volume energy difference per atom between the L11 phase and the L10 phase is . The gain in surface energy is equal to the energy loss due to L11 ordering if the following condition is fullfilled:
| (9) |
Here is the total number of atoms in the particle and the number of surface atoms. Relation (9) gives the percentage of surface atoms that leads to the stability of the L11 phase:
| (10) |
With the bulk and surface energy differences taken from section III.2.2, and for FePt, we estimate that the critical percentage of surface atoms per particle () amounts to 32.7%. We can find the corresponding total number of atoms per particle using .Edelstein and Cammarat (1997) For this leads to 1840. The particle diameter can then be estimated with the help of the averaged atomic volume in L10 FePt, , using the formula .
Appendix B Asymmetric continuum model
As the surface energies of the various facets in L10- and L11-ordered FePt and CoPt differ considerably, the assumption of a spherical particle is not necessarily valid. Rather asymmetric particles with an enlarged area ot the energetically favored facets are expected. This is taken care of in a more detailed continuum model. For single crystalline metal particles, the thermodynamically stable shape is determined by a Wulff constructionWulff (1901), where the energy minimizing shape is given by a constant ratio with the distance from particle center of a (hkl) facet with surface energy per unit area . The Wulff theorem applies to a macroscopic crystal. The ratios and for the L10 structure, and for the L11 phase determine which particle morphology possesses the energy minimizing shape. In the strong faceting limit () and if the condition is fulfilled, the Wulff shape is a truncated octahedron terminated by (111) and (100) facets only (cf. Fig. 11). This applies to L10 FePt and CoPt particles where and , respectively. In the limiting case of the Wulff construction leads to a regular octahedron as depicted in Fig. 10. The L10 ordered Wulff polyhedron can be constructed with the help of the ratios and by truncating the vertices of a regular octahedron at distances , and from the center.Wulff (1901); Müller and Albe (2007) The volume of the truncated octahedron can easily be derived by subtracting from the total octahedron volume, , half of the volume of two small octahedra truncated at the vertices in [001] direction, , and four small octahedra truncated in [100] directions, :
| (11) |
with and (analogously for ). The area of the (100) and (001) surfaces is simply given by the square of the edge length while the remaining (111) surface areas of the octahedron can be calculated following the same idea when determining the volume:
| (12) |
with
| (13) |
and
| (14) |
(correspondingly for ).
With this preliminary considerations and after substituting and , the volume and the total area of (111), (100) and Pt covered (001) surfaces of the L10 Wulff polyhedron can be written as a function of the variable :
| (15) |
| (16) |
| (17) |
| (18) |
As the surface energy of Pt terminated (001) facets, , is a function of the difference in Pt chemical potentials, , (Fig. 7 and Fig. 8) the value of also varies between two limiting cases:
| (19) |
leading to for FePt and for CoPt.
The averaged values are almost the same for FePt and CoPt: and , respectively. Thus, also the volume, , and the areas and are not exactly determined but vary as a function of . For the quantitative examples and representative particle shapes shown in section III.2.3 averaged values for are used.
The non-spherical, asymmetric L11-ordered octahedron is defined by the ratios
| (20) |
and
| (21) |
As for Pt terminated (001) facets in L10 order, here, the Pt covered (111) facets are known only in between two limiting cases (Fig. 7 and Fig. 8) yielding: for FePt and for CoPt. In analogy to the L10 ordered Wulff polyhedron, we express the volume , the total area of Pt covered (111) facets , and (111) facets of mixed composition for the L11 ordered octahedron as a function of and by
| (22) |
| (23) |
| (24) |
Under the assumption of an averaged value of the surface energy, for FePt and for CoPt we were able to precise the structural motifs. The resulting particle shapes are shown in Fig. 11 and 12, respectively.
As expected, the Pt covered (001) facets are considerably enlarged by almost a factor of compared to the (100) facets with mixed atomic composition ( for CoPt). The ratio of the distance of the Pt terminated (001) facet and the mixed (100) facet from particle center ( and , respectively) giving the aspect ratio of the particle, amounts to ( for CoPt).
Using the continuum model, also the total energy of a particle can be expressed as a function of the distance of a (111) facet from the particle center . For large enough particles, it can be approximated by the sum of volume and surface energy terms.Müller and Albe (2007)
If denotes the total number of atoms in a particle, the particle volume is given by , where is the atomic volume. Thus, the total number of atoms varies with cluster size as
| (25) |
If we neglect the twin boundary energy and the contributions of edge and corner atoms, we obtain:
| (26) |
Applying Eq. (26) yields for the L10 Wulff polyhedron (WP)
| (27) |
The dependence on is formally obmitted for simplicity. As mentioned above, also the total energy is a function of the difference in Pt chemical potentials, , and is determined only in a certain range.
Analogously such considerations also apply for the L11 ordered octahedron. Again, the low surface energy of Pt covered (111) facets will lead to an enlargement, compared to (111) facets with mixed atomic composition. We here also consider a non-spherical, asymmetric shape.
Applying Eq. (26) to the L11 ordered, asymmetric octahedron gives
| (28) |
Under the assumption of an averaged value of the surface energy for FePt and CoPt we are able to predict structural motifs. Their shape is shown in Fig. 12. Indeed, the hexagonal Pt terminated (111) facets on top and bottom are enlarged by a factor of for FePt ( for CoPt) compared to the (111) facets of mixed atomic composition on the side of the particle. The distance of the Pt terminated (001) facet from particle center, , is even more shortened compared to the mixed (100) facet, , as found for the L10 WP. The ratio amounts to for FePt and for CoPt.
References
- Perez et al. (2005) A. Perez, V. Dupuis, J. Tuaillon-Combes, L. Bardotti, B. Prével, E. Bernstein, P. Mélinon, L. Favre, A. Hannour, and M. Lamet, Adv. Eng. Mater. 7, 475 (2005).
- Yang et al. (2004) X. Yang, C. Liu, J. Yu, T. Klemmer, E. Johns, and D. Weller, J. Vac. Sci. Technol. B 22, 31 (2004).
- Weller and Moser (1999) D. Weller and A. Moser, IEEE Trans. Magn. 35, 4423 (1999).
- Lyubina et al. (2005) J. Lyubina, I. Opahle, K.-H. Müller, O. Gutfleisch, M. Richter, M. Wolf, and L. Schultz, J. Phys.: Condens. Matter 17, 4157 (2005).
- Honolka et al. (2009) J. Honolka, T. Y. Lee, K. Kuhnke, A. Enders, R. Skomski, S. Bornemann, S. Mankovsky, J. Minar, J. Staunton, H. Ebert, et al., Phys. Rev. Lett. 102, 067207 (2009).
- Ködderitzsch et al. (2007) D. Ködderitzsch, H. Ebert, D. A. Rowlands, and A. Ernst, New J. Physics 9, 81 (2007).
- Shick and Mryasov (2003) A. B. Shick and O. N. Mryasov, Phys. Rev. B 67, 172407 (2003).
- Gruner (2008) M. E. Gruner, J. Phys. D: Appl. Phys. 41, 134015 (2008).
- Zotov and Ludwig (2008) N. Zotov and A. Ludwig, Intermetallics 16, 113 (2008).
- MacLaren et al. (2005) J. M. MacLaren, R. R. Duplessis, R. A. Stern, and S. Willoughby, IEEE Trans. Magn. 41, 4374 (2005).
- Podgórny (1991) M. Podgórny, Phys. Rev. B 43, 11300 (1991).
- Solovyev et al. (1995) I. V. Solovyev, P. H. Dederichs, and I. Mertig, Phys. Rev. B 52, 13419 (1995).
- Antoniak et al. (2008) C. Antoniak, A. Trunova, M. Spasova, M. Farle, H. Wende, F. Wilhelm, and A. Rogalev, Phys. Rev. B 78, 041406(R) (2008).
- Friedenberger (2007) N. Friedenberger, Layer resolved Lattice Relaxation in magnetic Nanopartices, Universität Duisburg-Essen (2007), Diploma thesis.
- Dmitrieva (2007) O. Dmitrieva, Ph.D. thesis, Universität Duisburg-Essen (2007).
- Sudfeld et al. (2007) D. Sudfeld, O. Dmitrieva, N. Friedenberger, G. Dumpich, M. Farle, C. Y. Song, C. Kisielowski, M. E. Gruner, and P. Entel, Mater. Res. Soc. Symp. Proc. 998E, 0998 (2007).
- Dai et al. (2002) Z. R. Dai, S. Sun, and Z. L. Wang, Surf. Sci. 505, 325 (2002).
- Wang et al. (2008) R. M. Wang, O. Dmitrieva, M. Farle, G. Dumpich, H. Q. Ye, H. Poppa, R. Kilaas, and C. Kisielowski, Phys. Rev. Lett. 100, 017205 (2008).
- Stappert et al. (2003) S. Stappert, B. Rellinghaus, M. Acet, and E. F. Wassermann, J. Cryst. Growth 252, 440 (2003).
- Rellinghaus et al. (2003) B. Rellinghaus, S. Stappert, M. Acet, and E. F. Wassermann, J. Magn. Magn. Mater. 266, 142 (2003).
- Dmitrieva et al. (2005) O. Dmitrieva, B. Rellinghaus, J. Kästner, M. O. Liedke, and J. Fassbender, J. Appl. Phys. 97, 10N112 (2005).
- Wulff (1901) G. Wulff, Z. Kristallogr. 34, 449 (1901).
- Yamashita et al. (1997) S. Yamashita, S. Iwata, and S. Tsunashima, J. Magn. Soc. Jpn. 21, 433 (1997).
- Huang et al. (1999a) J. C. A. Huang, A. C. Hsu, and Y. H. Lee, J. Appl. Phys. 85, 5977 (1999a).
- Clark et al. (1995) J. F. Clark, F. J. Pinski, D. D. Johnson, P. A. Sterne, J. B. Staunton, and B. Ginatempo, Phys. Rev. Lett. 74, 3225 (1995).
- Lu et al. (1991) Z. W. Lu, S.-H. Wei, A. Zunger, S. Frota-Pessoa, and L. G. Ferreira, Phys. Rev. B 44, 512 (1991).
- Takizawa et al. (1991) S. Takizawa, S. Blügel, K. Terakura, and T. Oguchi, Phys. Rev. B 43, 947 (1991).
- Sato et al. (2008) H. Sato, T. Shimatsu, Y. Okazaki, H. Muraoka, H. Aoi, S. Okamoto, and O. Kitakami, J. Appl. Phys. 103, 07E114 (2008).
- Huang et al. (1999b) J. C. A. Huang, T. H. Wu, A. C. Hsu, L. C. Wu, and Y. M. Hu, J. Magn. Magn. Mater. 193, 166 (1999b).
- Błoński and Kiejna (2007) P. Błoński and A. Kiejna, Surf. Sci. 601, 123 (2007).
- Wu and Freeman (1993) R. Wu and A. J. Freeman, Phys. Rev. B 47, 3904 (1993).
- Ohnishi et al. (1983) S. Ohnishi, A. J. Freeman, and M. Weinert, Phys. Rev. B 28, 6741 (1983).
- Wang and Freeman (1981) C. S. Wang and A. J. Freeman, Phys. Rev. B 24, 4364 (1981).
- Methfessel and Fiorentini (1996) M. Methfessel and V. Fiorentini, J. Phys.: Condens. Matter 8, 6525 (1996).
- Da Silva et al. (2006) J. L. F. Da Silva, C. Stampfl, and M. Scheffler, Surf. Sci. 600, 703 (2006).
- Methfessel et al. (1991) M. Methfessel, D. Hennig, and M. Scheffler, Phys. Rev. B 46, 4816 (1992).
- Fiorentini et al. (1993) V. Fiorentini, M. Methfessel, and M. Scheffler, Phys. Rev. Lett. 71, 1051 (1993).
- Skriver and Rosengaard (1992) H. L. Skriver and N. M. Rosengaard, Phys. Rev. B 46, 7157 (1992).
- Lu et al. (2005) G.-H. Lu, M. Huang, M. Cuma, and F. Liu, Surf. Sci. 588, 61 (2005).
- Kiejna (2005) A. Kiejna, Surf. Sci. 598, 276 (2005).
- Kiejna et al. (1999) A. Kiejna, J. Peisert, and P. Scharoch, Surf. Sci. 432, 54 (1999).
- Chen et al. (2003) Z.-X. Chen, K. M. Neyman, A. B. Gordienko, and N. Rösch, Phys. Rev. B 68, 075417 (2003).
- Hong and Yoo (2005) S. Hong and M. H. Yoo, J. Appl. Phys. 97, 084315 (2005).
- Kresse and Furthmüller (1996) G. Kresse and J. Furthmüller, Phys. Rev. B 54, 11169 (1996).
- Reuter et al. (2005) K. Reuter, C. Stampfl, and M. Scheffler, in Handbook of Materials Modeling, edited by S. Yip (Springer, Berlin Heidelberg, 2005), vol. 1, p. 149.
- Lee et al. (2000) S.-H. Lee, W. Moritz, and M. Scheffler, Phys. Rev. Lett. 85, 3890 (2000).
- Moll et al. (1996) N. Moll, A. Kley, E. Pehlke, and M. Scheffler, Phys. Rev. B 54, 8844 (1996).
- Northrup and Froyen (1993) J. E. Northrup and S. Froyen, Phys. Rev. Lett. 71, 2276 (1993).
- Penev and Kratzer (2005) E. Penev and P. Kratzer, in Quantum Dots: Fundamentals, Applications, and Frontiers, edited by B. A. Joyce (Springer, The Netherlands, 2005), vol. 190, p. 27.
- Kratzer et al. (2003) P. Kratzer, E. Penev, and M. Scheffler, Appl. Surf. Sci. 216, 436 (2003).
- Kitchin et al. (2008) J. R. Kitchin, K. Reuter, and M. Scheffler, Phys. Rev. B 77, 075437 (2008).
- Kresse and Joubert (1999) G. Kresse and D. Joubert, Phys. Rev. B 59, 1758 (1999).
- Perdew et al. (1996) J. P. Perdew, K. Burke, and M. Ernzerhof, Phys. Rev. Lett. 77, 3865 (1996).
- Perdew et al. (1992) J. P. Perdew, J. A. Chevary, S. H. Vosko, K. A. Jackson, M. R. Pederson, D. J. Singh, and C. Fiolhais, Phys. Rev. B 46, 6671 (1992).
- Gross (2003) A. Gross, Theoretical Surface Science-A Microscopic Perspective (Springer, Berlin, 2003).
- Boettger (1994) J. C. Boettger, Phys. Rev. B 49, 16798 (1994).
- Zangwill (1988) A. Zangwill, Physics at Surfaces (Cambridge University Press, Cambridge, 1988).
- Penev (2002) E. S. Penev, Ph.D. thesis, Technische Universität Berlin (2002).
- Iddir et al. (2007) H. Iddir, V. Komanicky, Öǧüt, H. You, and P. Zapol, J. Phys. Chem. C 111, 14782 (2007).
- Getman and Schneider (2007) R. B. Getman and W. F. Schneider, J. Phys. Chem. C 111, 389 (2007).
- Błoński and Kiejna (2004) P. Błoński and A. Kiejna, Vacuum 74, 179 (2004).
- Spencer et al. (2002) M. J. S. Spencer, A. Hung, I. K. Snook, and I. Yarovsky, Surf. Sci. 513, 389 (2002).
- Vitos et al. (1998) L. Vitos, A. V. Ruban, H. L. Skriver, and J. Kollár, Surf. Sci. 411, 186 (1998).
- Aldén et al. (1992) M. Aldén, S. Mirbt, H. L. Skriver, N. M. Rosengaard, and B. Johansson, Phys. Rev. B 46, 6303 (1992).
- Mehl and Papaconstantopoulos (1996) M. J. Mehl and D. A. Papaconstantopoulos, Phys. Rev. B 54, 4519 (1996).
- Foiles et al. (1986) S. M. Foiles, M. I. Baskes, and M. S. Daw, Phys. Rev. B 33, 7983 (1986).
- Baskes (1992) M. I. Baskes, Phys. Rev. B 46, 2727 (1992).
- Tyson and Miller (1977) W. R. Tyson and W. A. Miller, Surf. Sci. 62, 267 (1977).
- de Boer et al. (1989) F. R. de Boer, R. Boom, W. C. M. Mattens, A. R. Miedema, and A. K. Niessen, Cohesion in metals (North-Holland Physics Publishing, 1989).
- Tyson (1975) W. R. Tyson, Can. Met. Quart. 14, 307 (1975).
- Herper et al. (1999) H. C. Herper, E. Hoffmann, and P. Entel, Phys. Rev. B 60, 3839 (1999).
- Entel et al. (2000) P. Entel, H. C. Herper, E. Hoffmann, G. Nepecks, E. F. Wassermann, M. Acet, V. Crisan, and H. Akai, Phil. Mag. B 80, 141 (2000).
- Acet et al. (1994) M. Acet, H. Zähres, E. F. Wassermann, and W. Pepperhoff, Phys. Rev. B 49, 6012 (1994).
- Cleri and Rosato (1993) F. Cleri and V. Rosato, Phys. Rev. B 48, 22 (1993).
- Khein et al. (1995) A. Khein, D. J. Singh, and C. J. Umrigar, Phys. Rev. B 51, 4105 (1995).
- Moroni et al. (1997) E. G. Moroni, G. Kresse, J. Hafner, and J. Furthmüller, Phys. Rev. B 56, 15629 (1997).
- Kokalj and Causà (1999) A. Kokalj and M. Causà, J. Phys.: Condens. Matter 11, 7463 (1999).
- Fox and Jansen (1999) S. Fox and H. J. F. Jansen, Phys. Rev. B 60, 4397 (1999).
- Rollmann et al. (2004) G. Rollmann, S. Sahoo, and P. Entel, Phys. Status Solidi 201, 3263 (2004).
- Rollmann et al. (2006) G. Rollmann, P. Entel, and S. Sahoo, Comp. Mater. Sci. 35, 275 (2006).
- Burkert et al. (2005) T. Burkert, O. Eriksson, S. I. Simak, A. V. Ruban, B. Sanyal, L. Nordström, and J. M. Wills, Phys. Rev. B 71, 134411 (2005).
- Ravindran et al. (2001) P. Ravindran, A. Kjekshus, H. Fjellvaag, P. James, L. Nordström, B. Johansson, and O. Eriksson, Phys. Rev. B 63, 144409 (2001).
- Galanakis et al. (2000) I. Galanakis, M. Alouani, and H. Dreysse, Phys. Rev. B 62, 6475 (2000).
- Kashyap et al. (1999) A. Kashyap, K. B. Garg, A. K. Solanki, T. Nautiyal, and S. Auluck, Phys. Rev. B 60, 2262 (1999).
- Zeng et al. (2002) H. Zeng, R. Sabirianov, O. Mryasov, M. L. Yan, K. Cho, and D. J. Sellmyer, Phys. Rev. B 66, 184425 (2002).
- Brown et al. (2003) G. Brown, B. Kraczek, A. Janotti, T. C. Schulthess, G. M. Stocks, and D. D. Johnson, Phys. Rev. B 68, 052405 (2003).
- Dannenberg et al. (2009) A. Dannenberg, M. E. Gruner, and P. Entel, J. Phys.: Conf. Ser. (2009), to be published.
- Smoluchowski (1941) R. Smoluchowski, Phys. Rev. 60, 661 (1941).
- Finnis and Heine (1974) M. W. Finnis and V. Heine, J. Phys. F: Metal Phys. 4, L37 (1974).
- Pettifor (1978) D. G. Pettifor, J. Phys. F: Metal Phys. 8, 219 (1978).
- Landman and Hill (1980) U. Landman, R. N. Hill and M. Mostoller Phys. Rev. B 21, 448 (1980).
- Heine and Marks (1986) V. Heine and L. D. Marks, Surf. Sci. 165, 65 (1986).
- Zólyomi et al. (2009) V. Zólyomi, L. Vitos, S. K. Kwon, and J. Kollár, J. Phys.: Condens. Matter 21, 095007 (2009).
- Gruner et al. (2008) M. E. Gruner, G. Rollmann, P. Entel, and M. Farle, Phys. Rev. Lett. 100, 087203 (2008).
- Ma and Balbuena (2008) Y. Ma and P. B. Balbuena, Surf. Sci. 602, 107 (2008).
- Yuge et al. (2007) K. Yuge, A. Seko, A. Kuwabara, F. Oba, and I. Tanaka, Phys. Rev. B 76, 045407 (2007).
- Entel and Gruner (2009) P. Entel and M. E. Gruner, J. Phys.: Condens. Matter 21, 064228 (2009).
- Gruner and Entel (2009) M. E. Gruner and P. Entel, J. Phys.: Condens. Matter 21, 293201 (2009).
- Edelstein and Cammarat (1997) A. S. Edelstein and R. C. Cammarat, Nanomaterials: synthesis, properties and applications (Institute of Physics Publishing, Bristol, 1997).
- Müller and Albe (2007) M. Müller and K. Albe, Acta Mater. 55, 6617 (2007).