11email: jmparedes@ub.edu, jmoldon@am.ub.es, vzabalza@am.ub.es, pbordas@am.ub.es, mribo@am.ub.es 22institutetext: Departamento de Física, EPS, Universidad de Jaén, Campus Las Lagunillas s/n, Edif. A3, 23071 Jaén, Spain
22email: jmarti@ujaen.es, ajmunoz@ujaen.es 33institutetext: Grupo de Investigación FQM-322, Universidad de Jaén, Campus Las Lagunillas s/n, Edif. A3, 23071 Jaén, Spain
33email: jrssutil@ujaen.es, peter@ujaen.es 44institutetext: NCRA, TIFR, Post Bag 3, Ganeshkhind, Pune-411 007, India
44email: ishwar@ncra.tifr.res.in 55institutetext: Institut d’Informàtica i Aplicacions, Universitat de Girona, Girona, Spain
55email: marta.peracaula@udg.edu 66institutetext: Max Planck Institut für Kernphysik, Saupfercheckweg 1, Heidelberg 69117, Germany
66email: vbosch@mpi-hd.mpg.de 77institutetext: Instituto Argentino de Radioastronomía (CCT La Plata, CONICET), C.C.5, (1894) Villa Elisa, Buenos Aires, Argentina
77email: romero@iar.unlp.edu.ar 88institutetext: Facultad de Ciencias Astronómicas y Geofísicas, UNLP, Paseo del Bosque, 1900 La Plata, Argentina
88email: romero@fcaglp.unlp.edu.ar
Radio continuum and near-infrared study of the MGRO~J2019+37 region
Abstract
Context. MGRO~J2019+37 is an unidentified extended source of very high energy gamma-rays originally reported by the Milagro Collaboration as the brightest TeV source in the Cygnus region. Its extended emission could be powered by either a single or several sources. The GeV pulsar AGL~J2020.5+3653, discovered by AGILE and associated with PSR~J2021+3651, could contribute to the emission from MGRO~J2019+37.
Aims. Our aim is to identify radio and near-infrared sources in the field of the extended TeV source MGRO~J2019+37, and study potential counterparts to explain its emission.
Methods. We surveyed a region of about 6 square degrees with the Giant Metrewave Radio Telescope (GMRT) at the frequency 610 MHz. We also observed the central square degree of this survey in the near-infrared -band using the 3.5 m telescope in Calar Alto. Archival X-ray observations of some specific fields are included. VLBI observations of an interesting radio source were performed. We explored possible scenarios to produce the multi-TeV emission from MGRO~J2019+37 and studied which of the sources could be the main particle accelerator.
Results. We present a catalogue of 362 radio sources detected with the GMRT in the field of MGRO~J2019+37, and the results of a cross-correlation of this catalog with one obtained at near-infrared wavelengths, which contains sources, as well as with available X-ray observations of the region. Some peculiar sources inside the 1° uncertainty region of the TeV emission from MGRO~J2019+37 are discussed in detail, including the pulsar PSR~J2021+3651 and its pulsar wind nebula PWN~G75.2+0.1, two new radio-jet sources, the H ii region Sh~2-104 containing two star clusters, and the radio source NVSS~J202032+363158. We also find that the hadronic scenario is the most likely in case of a single accelerator, and discuss the possible contribution from the sources mentioned above.
Conclusions. Although the radio and GeV pulsar PSR~J2021+3651 / AGL~J2020.5+3653 and its associated pulsar wind nebula PWN~G75.2+0.1 can contribute to the emission from MGRO~J2019+37, extrapolation of the GeV spectrum does not explain the detected multi-TeV flux. Other sources discussed here could contribute to the emission of the Milagro source.
Key Words.:
gamma-rays: observations – H ii regions – infrared: stars – radio continuum: stars – X-rays: binaries1 Introduction
The Galactic very-high-energy (VHE) -ray sources discovered by the latest generation of Cherenkov observatories (H.E.S.S., MAGIC, Milagro) are currently an actively studied topic in modern high-energy astrophysics. Among the 75 detected sources, nearly one third remain yet as unidentified. A significant number of them have extended morphologies on 0.1–1° scales in the TeV energy band, ensuring that the identification of counterparts at lower energies is a very difficult task. The most representative of this new population of Galactic sources is TeV~J2032+4130, inside whose error box both compact and extended radio sources on arcsecond scales were found (Paredes et al. 2007). XMM-Newton observations of this source also detected faint extended X-ray emission (Horns et al. 2007a).
An addition to the population of extended, unidentified TeV sources was reported by the Milagro collaboration, following the discovery in the Cygnus region of the most extended TeV source known so far (Abdo et al. 2007a, b). The TeV emission from this area covers several square degrees and includes diffuse emission and at least one new source, MGRO~J2019+37, located to within an accuracy of 0.4°. After the Crab Nebula, MGRO~J2019+37 is the strongest source detected by Milagro. The Tibet AS- experiment confirmed the detection of this source by measuring a 5.8 signal compatible with the position of MGRO~J2019+37 (Amenomori et al. 2008). On the other hand, VERITAS inferred an upper limit that is compatible with the Milagro detection for a hard-spectrum extended source (Kieda et al. 2008).
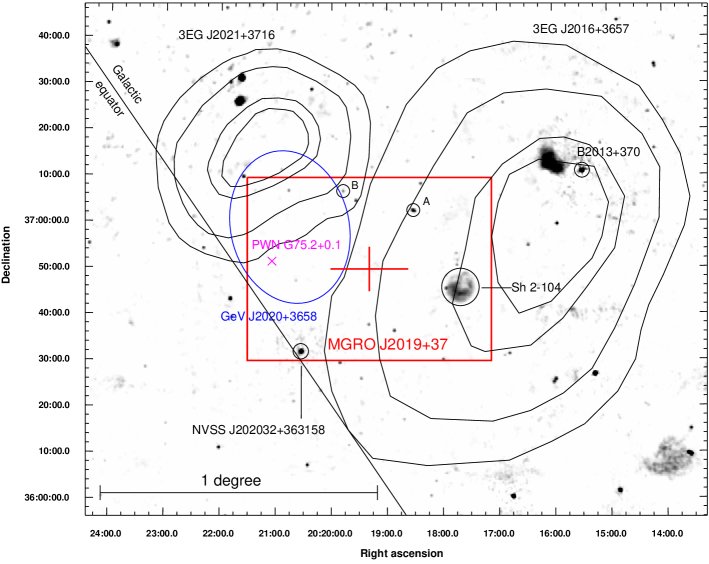
The origin of all these types of emission and their association with astrophysical sources is unclear. Although a possible connection with the anisotropy of Galactic cosmic rays was proposed (Amenomori et al. 2006), the TeV -ray flux measured at 12 TeV from the diffuse emission of the Cygnus region (after excluding MGRO~J2019+37), exceeds that predicted by a conventional model of cosmic ray production and propagation (Abdo et al. 2007a). This strongly infers the existence of hard-spectrum cosmic-ray sources and/or other types of TeV -ray sources in the region. It is unclear whether the emission originates in either a single extended source or a combination of several point sources. MGRO~J2019+37 is positionally coincident with the EGRET sources 3EG~J2021+3716 and 3EG~J2016+3657 (see Fig. 1). These sources could represent the GeV counterparts to the TeV source MGRO~J2019+37, which may be a multiple source. Only one of them, 3EG~J2021+3716, appears in the bright gamma-ray source list published by the Fermi Gamma-ray Space Telescope (Abdo et al. 2009). Previous observations with AGILE illustrated its pulsar nature and inferred an association of this source with PSR~J2021+3651 (Halpern et al. 2008).
To explain steady VHE -ray emission, hadronic models have been developed by several authors (e.g., Aharonian & Atoyan 1996; Butt et al. 2003; Torres et al. 2004; Bordas et al. 2009). The electromagnetic radiation produced by both hadronic jets from microquasars and Galactic cosmic rays, and their interaction with the ISM were explored by Bosch-Ramon et al. (2005). The interaction between the high energy protons, accelerated at the jet termination shock, and the interstellar hydrogen nuclei produces charged and neutral pions (, and ); the first set will decay to electrons and positrons and the second set to photons. The primary radiation, -decay photons, is in the -ray band, but the secondary particles can produce significant fluxes of synchrotron (from radio frequencies to X-rays) and bremsstrahlung emission (from soft -rays to the TeV range), and in general lower efficiency, inverse Compton (IC) emission by interaction with ambient infrared photons. Detectable fluxes of extended and steady emission should be produced by this mechanism. Other scenarios involve a jet-driven termination shock at which relativistic electrons produce synchrotron and TeV IC emission (Aharonian & Atoyan 1998). In this context, X-ray observations provide a crucial constraint of the IC emission.
To understand the nature of the Milagro source in the Cygnus region, we performed a multiwavelength campaign comprising a deep radio survey at 610 MHz using the Giant Metrewave Radio Telescope (GMRT) interferometer covering the 3.5°3.5° MGRO~J2019+37 field, near-infrared observations in the band using the 3.5 m telescope at Calar Alto of the central square degree, and archival X-ray data.
This paper is organized as follows. In Sect. 2, we report on previous radio surveys of the Cygnus region, while in Sect. 3 we present the GMRT survey and the results obtained. In Sect. 4, we provide an overview of the near-infrared survey, and in Sect. 5 we report on the cross-correlations both between our GMRT survey and the near-infrared survey, and between the GMRT survey and previous X-ray observations. We comment on particularly interesting sources in Sect. 6 and we discuss their possible contribution to the TeV emission of MGRO~J2019+37 in Sect. 7. We finish with our conclusions in Sect. 8.
2 Previous radio surveys of the Cygnus region
At radio frequencies, the Cygnus region has been imaged many times, sometimes as part of Galactic surveys. However, these studies were carried out at poor angular resolution and/or a relatively high limiting flux density. Some of the most representative of previous surveys are: the Canadian Galactic Plane Survey (CGPS) performed with the Synthesis Telescope at the Dominion Radio Astrophysical Observatory (DRAO) at 408 and 1420 MHz, with angular resolutions of 53 and 16, and limiting flux densities of 9 and 1 mJy, respectively, at declination of +40° (Taylor et al. 2003); the Westerbork Synthesis Radio Telescope (WSRT) 327 MHz survey with an angular resolution of 1′ and a limiting flux density of 10 mJy (Taylor et al. 1996); and the DRAO 408 and 1430 MHz survey with angular resolution of and , respectively, and limiting flux densities of 150 and 45 mJy, respectively (Wendker et al. 1991). The most recent survey of this region is the WSRT 350 and 1400 MHz continuum survey of the Cygnus OB2 association, with angular resolutions of and , and limiting flux densities of 10–15 and 2 mJy, respectively (Setia Gunawan et al. 2003). The WSRT survey does not cover the MGRO~J2019+37 field.
3 GMRT 610 MHz Radio Survey
3.1 Observations
The MGRO~J2019+37 region was observed with wide-field deep radio imaging at 610 MHz (49 cm) using the GMRT, located in Pune (India). We designed an hexagonal pattern of 19 pointings to cover the region of about 2.5°2.5° centred on the MGRO~J2019+37 peak of emission. The observations were carried out in July 2007, but were affected by a series of power failures in the array and compensatory time was scheduled in August 2007.
The flux density scale was set using the primary amplitude calibrators 3C~286 and 3C~48, which were observed at the beginning and end of each observing session. On the other hand, phase calibration was performed by repeated observations of the nearby phase calibrator J2052+365. Each pointing was observed for a series of scans to achieve a good coverage in the plane, the total time spent on each field being 45 minutes. The total effective time amounts to 20 hours.
Observations were made in two 16-MHz upper and lower sidebands (USB and LSB) centered on 610 MHz, each divided into 128 spectral channels. The data of each side-band were separately edited with standard tasks of the Astronomical Image Processing System (AIPS) package. There were no major radio frequency interference (RFI) problems. However, we did find that narrow band RFI affected a few channels across the band, which were completely flagged. Once poor antennas, baselines, or channels were removed, the bandpass correction was used to extend the calibration to all channels. After the bandpass calibration, the central channels of each sideband were averaged, leading to a data file of 5 compressed channels, of a bandwidth small enough to avoid bandwidth smearing problems in our images. Standard calibration for continuum data was performed beyond this point. At the end of the self-calibration deconvolution iteration scheme, we combined both USB and LSB images of each pointing and mosaicked the entire region using the AIPS task FLATN.
We produced different maps of between high and low angular resolution of the GMRT mosaic. Our highest quality image has an rms of 0.2 mJy beam-1 with a 5″ resolution because of the long baselines of the GMRT. A low angular resolution version was also produced using a restoring beam of 30″ to enhance the extended radio sources in the field. This map has an rms of 0.5 mJy beam-1.
3.2 Results
Figure 1 shows a low angular resolution radio image of the MGRO~J2019+37 field, together with the position of sources at other wavelengths. The location of MGRO~J2019+37 is consistent with those of the EGRET sources 3EG~J2016+3657 and 3EG~J2021+3716. The first of them is positionally coincident with the blazar-like source B2013+370 (G74.87+1.22) (Mukherjee et al. 2000; Halpern et al. 2001), although this blazar is well outside the inner box of MGRO~J2019+37. The second is marginally coincident with the pulsar wind nebula PWN~G75.2+0.1 (Hessels et al. 2004). High-energy gamma-ray pulsations originating in the pulsar were detected by AGILE and Fermi (Halpern et al. 2008; Abdo et al. 2009). There are other known strong and/or extended radio sources in the field, such as the brightest one inside the MGRO~J2019+37 center of gravity box, NVSS~J202032+363158, and the H ii region Sh~2-104 (also known as Sh~104). Other interesting sources not obvious at first glance become evident when considering the whole field in detail. Some of them display a resolved morphology, and in Sect. 6 we discuss these objects in more detail.
3.3 Radio catalogue
We applied the SEXtractor automatic procedure (Bertin & Arnouts 1996) to our 5″ resolution mosaic (with pixel size of 1″) to produce a list of sources with peak flux density higher than about ten times the local noise after primary beam correction. Objects with less than 5 connected pixels above the threshold were not included. The output was visually inspected and all candidate detections inferred to be false (i.e., deconvolution artifacts near bright sources) were simply deleted by hand. We used the local background analysis in SEXtractor to take into account the uneven background because of beam response effects. Considering the 5″ beam size of the mosaic that we used, and the signal-to-noise ratio that we required for detection, we estimate that the positions obtained have a typical uncertainty of 05 or smaller.
The resulting list, considered to be very reliable although not complete at the lowest flux density levels, contains 362 radio sources. Among them, 203 are fainter than 10 mJy and the majority were previously undetected at radio wavelengths. We present the catalogue in Table LABEL:table:list of the online material accompanying this paper. The first and second columns provide the catalogue number and the source name. The third and fourth columns give the J2000.0 position in right ascension order. The fifth and sixth columns provide the peak flux density and the local noise, respectively. The seventh and eighth columns list the integrated flux density and its error. Uncertainties quoted for the peak and integrated flux densities are based on the formal errors of the fit and allow the reliability of the detection to be judged. However, they do not include the error due to primary beam correction as a function of angular distance to the phase centre because of unknown antenna offsets, which is estimated to be around 10% of the flux density values (see for instance Paredes et al. 2008). In Fig. 2, we show the source distribution histogram as a function of .

4 Near-infrared survey
We also carried out a near-infrared (NIR) survey of the central square degree of the region using the OMEGA2000 wide field camera () on the 3.5 m telescope at Centro Astronómico Hispano Alemán (CAHA) in Calar Alto (Spain) on 25 September 2007. This instrument consists of a Rockwell HAWAII2 HgCdTe detector with pixels sensitive from 0.8 to 2.5 m. The observations were performed in the -band (2.15 m) to minimize the interstellar absorption. Individual frames were sky-subtracted, flat-field corrected, and then combined into a final mosaic using the AIPS task FLATN. The ensamble of pointings covers almost completely the center of gravity and uncertainty region of the TeV emission from the source MGRO~J2019+37. The average limiting magnitude across the mosaic is mag, and the total field of view is . Astrometric solutions for the final frames were determined within 01 by identifying about twenty reference stars in each pointing, for which positions were retrieved from the 2MASS catalogue (Skrutskie et al. 2006). A catalogue of 315 000 near-infrared sources was produced using the SEXtractor package.
5 Radio, near-infrared, and X-ray cross-correlation catalogue
We performed a cross-correlation between the radio and near-infrared source catalogues. Considering the 05 uncertainty in the radio positions and the 01 uncertainty in the NIR ones, we used a conservative maximum offset of 06 for associations (neglecting systematics between both catalogues). There are 42 of the 362 detected radio sources inside the area imaged in the near infrared. A total of 6 of these 42 sources have a near-infrared counterpart candidate within 06 of their radio position. Their magnitudes are listed in the ninth column of Table LABEL:table:list of the online material. The chance coincidence probability of finding a NIR source closer than 06 to a given radio source is estimated to be the number of NIR sources multiplied by the area of the uncertainty in positions occupied by the 42 radio sources, divided by the total area of the region: . Therefore, of the six radio sources with NIR counterpart, we expect that one of them is a random coincidence.
We also obtained source lists of all X-ray observations of the region
performed by Chandra and XMM-Newton, computed by the
celldetect and edetect_chain tasks from CIAO 4.0 and SAS 8.0,
respectively. A total of 41 of the 362 radio sources are located in fields
observed in X-rays, which cover an area of arcmin2
( arcsec2) and contain 519 X-ray sources. We found that 5
of the 41 radio sources have an X-ray counterpart candidate within 5″ (the typical uncertainty for XMM-Newton). Their X-ray fluxes are listed
in the tenth column of Table LABEL:table:list of the online material. The
chance coincidence probability of finding a radio source closer than 5″ to a
given X-ray source is estimated to be the number of radio sources multiplied by
the area of the uncertainty in positions occupied by the 5 X-ray sources,
divided by the total area of the region: arcsec. Therefore, of the five X-ray sources with radio
counterpart we also expect that one of them is a random coincidence.
A single triple radio/near-infrared/X-ray coincidence has been found (source number 115 in Table LABEL:table:list of the online material).
6 Individual sources in the MGRO~J2019+37 field
The most interesting radio sources that appear in the uncertainty region of the TeV emission (red box in Fig. 1) are described below.
6.1 PSR~J2021+3651 / PWN~G75.2+0.1
The radio pulsar PSR~J2021+3651 has a rotation period s, a characteristic age of kyr, and a spin-down luminosity erg s-1. It is coincident with the unidentified source GeV~2020+3658 (Roberts et al. 2002), which overlaps with the EGRET source 3EG~J2021+3716 (see Fig. 1). Chandra observations of this pulsar detected a pulsar wind nebula named PWN~G75.2+0.1 (Hessels et al. 2004). Chandra observations of the pulsar and its PWN detected rings and jets around PSR~J2021+3651, and inferred a distance to the pulsar of 3–4 kpc (Van Etten et al. 2008), in contrast to the 12 kpc implied by the pulsar dispersion measure (Roberts et al. 2002). XMM-Newton observations show emission extending to a distance of 10–15 arcminutes, whereas radio observations with the VLA at 1.4 GHz show a radio nebula coincident with the X-ray extension (Roberts et al. 2008).
AGILE detected the source AGL~J2020.5+3653 at energies above 100 MeV range, which shows pulsations and was associated with the pulsar PSR~J2021+3651 (Halpern et al. 2008). The photon spectrum of the source can be fitted by a power-law of photon index in the range 100–1000 MeV, while a turndown is seen above 1.5 GeV. This source appears as 1AGL~J2021+3652 in the first AGILE catalog of high confidence gamma-ray sources (Pittori et al. 2009). Fermi also detected the source 0FGL~2020.8+3649 in positional coincidence with the pulsar (Abdo et al. 2009).
We found neither a (low-frequency) radio nor a near-infrared source at the position of PSR~J2021+3651. The nearest near-infrared source is at a distance of 39 and has a magnitude of 17.3. In the radio, from our 610 MHz GMRT data we can establish an upper limit to any possible point-like counterpart of 1.0 mJy by multiplying the background emission level by a factor of 5. The radio flux density of the extended emission found with the VLA at 1.4 GHz amounts to 700 mJy in an area of about 100 arcmin2, which for a uniform distribution yields 7 mJy arcmin-2. On the other hand, the rms of our low-resolution radio map at 610 MHz shown in Fig. 1, with a beam size of 30″, is 0.5 mJy beam-1. This provides a conservative 5- upper limit of either 2.5 mJy beam-1 or 9 mJy arcmin-2. This upper limit implies that if the radio emission is uniformly distributed, its spectral index must be above 0.3. This value is compatible with the radio emission being produced by the synchrotron mechanism, as expected in this nebula.
6.2 Jet-like radio sources
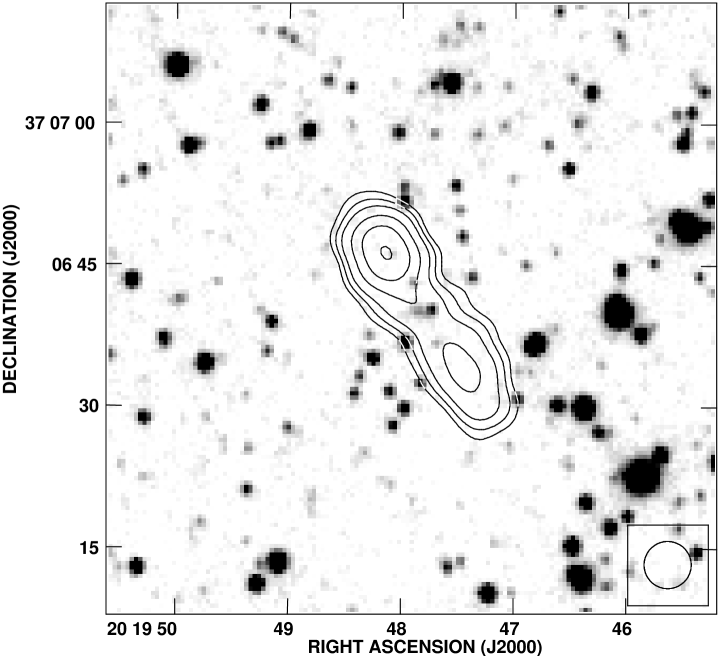
We discovered two jet-like radio sources located well inside the uncertainty region of MGRO~J2019+37. Their J2000.0 positions are =, =+ (source A) and =, =+ (source B). In Fig. 3, we show a GMRT high resolution image of each of them superimposed on the near-infrared image. Both sources appear to be unresolved in the NVSS 1.4 GHz catalogue (Condon et al. 1998). Based on our GMRT survey, the NVSS survey, and the Westerbork Northern Sky Survey (WENSS; Rengelink et al. 1997) data at 327 MHz, we estimate a spectral index of 1.160.02 for source A, clearly indicating a non-thermal nature. It is interesting to note that the source is not detected in the VLA Low-Frequency Sky Survey (VLSS; Cohen et al. 2007) at 74 MHz, with a 3- upper limit of 1.2 Jy. With the spectral index above, we would expect a flux density of 1.9 Jy, clearly indicative of a turnover at lower radio frequencies, which could be produced by intrinsic self-absorption or by Galactic foreground free-free absorption. The GMRT and NVSS data for source B provide a spectral index of 0.70.6, compatible with the non-detection in WENSS, and suggesting a non-thermal nature for this radio source.
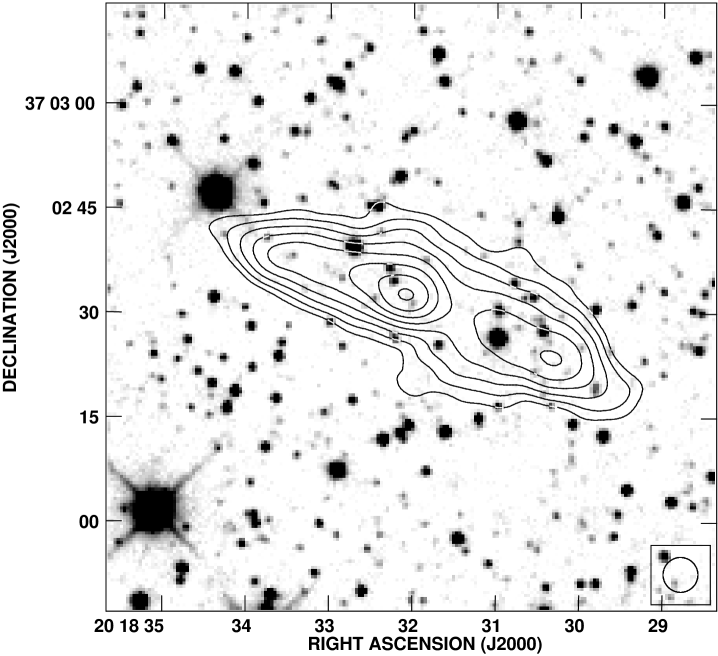
Source A (Fig. 3-top) shows a double-sided morphology, sources #141 and #142 in Table LABEL:table:list of the online material, with a slight bending towards the south-east. This structure resembles ones typically seen in radio galaxies with a non-negligible pressure from the intergalactic medium. Unfortunately, there is no clear extended NIR counterpart in the axis joining the radio lobes that could be identified with the parent galaxy, and no firm conclusion can be obtained from the present data.
Source B (Fig. 3-bottom) shows a morphological and spectral similarity to the radio lobes of the ‘great annihilator’ 1E~1740.7$-$2942, a microquasar at the Galactic center (Mirabel et al. 1992). The two lobes correspond to sources #193 and #194 in Table LABEL:table:list of the online material. We did not detect a radio core in this source but, as for the one present in 1E~1740.7$-$2942, it could have a flat spectrum and the flux density at such a low frequency is expected to be very low compared to that of the radio lobes. As can be seen in the figure, there are two near-infrared objects close to the central position of the source. Their J2000.0 coordinates and magnitudes are: =, =+, =16.5, and =, =+, =17.4. Their proximity significantly biases the photometry. The bright source is point-like and offset from the axis traced by the radio lobes. The faint source is aligned with the axis and fuzzy, implying that the origin of the double radio source is most likely a radio galaxy.
Previous ROSAT pointed observations (Obs. Id. 500248P conducted on 24 October 1993) did not detect any of these two radio-jet sources, placing a 3- upper limit of erg cm2 s-1 on their persistent flux in the energy range 0.1–2.4 keV. With the present data, we cannot elucidate whether the sources are Galactic or extragalactic, although there are hints of their extragalactic nature.
6.3 H ii region Sh~2-104
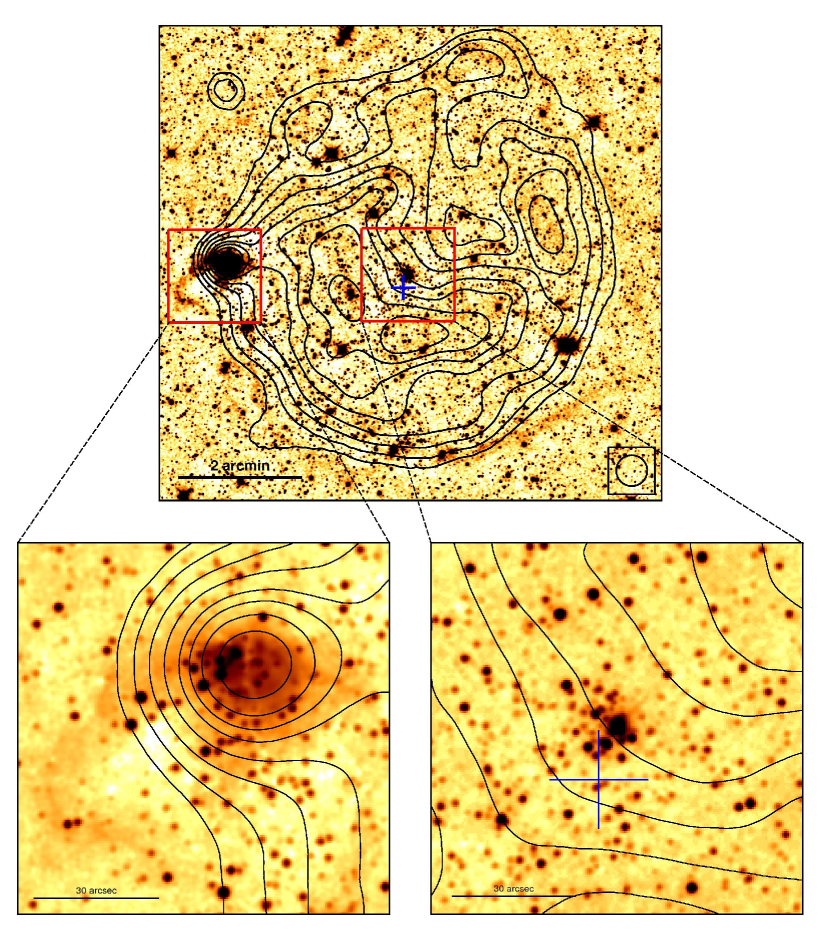
Sh~2-104, also known as Sh~104, is an optically visible H ii region of diameter at a distance of 4.00.5 kpc (Deharveng et al. 2003). There is a central O6 V star suspected of being responsible for ionizing the region (Lahulla et al. 1985). The appearance of Sh~2-104 in the optical and in the radio bands is very similar, although the radio images show the presence of an ultra compact H ii (UCHII) region at the eastern border, which is not visible in the optical image (Deharveng et al. 2003). The interaction between the expanding H ii region Sh~2-104 and the UCHII region may be responsible for triggered star formation in the latter, resulting in a deeply embedded young cluster. This region has also been detected as a high luminosity ( L⊙) IRAS source.
Our GMRT observations (see Fig. 4) detect a structure similar to that found at 1.46 GHz with the VLA (Fich 1993) and at 1.4 GHz within the NVSS radio continuum survey (Condon et al. 1998).
We also observed Sh~2-104 in the near-infrared -band. The images obtained are deeper than those from 2MASS. Figure 4 shows our near-infrared images of the field of Sh~2-104 with the radio emission contours superimposed. In the eastern region of the ring (to the left side), the near-infrared image shows the well known cluster associated with the UCHII region, which must contain at least one massive OB star (Deharveng et al. 2003). In the central part of the image, the single O6 V star of Lahulla et al. (1985), which corresponds to 2MASS~J20174184+3645264 (Skrutskie et al. 2006), now appears to be resolved as several point-like objects, indicative of the presence of a cluster. Therefore, apart from this ionizing early-type star, the new cluster candidate could also contribute to the formation of the H ii region (e.g., additional early type stars, wind shocks). Furthermore, an elongated arc along the south of Sh~2-104 as well as to the east of the UCHII region can be discerned in the NIR images. These features may be related to the interaction between the expanding H ii region and the interstellar medium.
Despite its deep coverage at other wavelengths, Sh~2-104 was poorly explored in the X-ray domain. Previous X-ray observations of this region by ROSAT detected a source (2RXP~J201742.3+364513; Rosat consortium 2000) located at =, =+ with a positional error of 12″, overlapping with the central star 2MASS~J20174184+3645264 and the cluster candidate (see bottom-right of Fig. 4). The count rate of count s-1 in the energy range 0.1–2.0 keV, provides a flux of erg cm-2 s-1 based on the assumption of a thermal spectrum with a temperature of 1.5 keV (a typical value for colliding wind regions). On the other hand, OB stars are known to be X-ray sources, presumably because of shocks in their stellar winds (see Güdel 2004 for a review). According to the complete study by Berghöfer et al. (1997) of more than 200 isolated OB stars detected in ROSAT data, for an O6 V star, with bolometric luminosity of erg s-1 (Martins et al. 2005), the corresponding X-ray luminosity is erg s-1. Considering a distance of 4.0 kpc to both Sh~2-104 and its ionizing central star 2MASS~J20174184+3645264, the expected X-ray flux is erg cm-2 s-1, fully compatible with the detected X-ray flux from 2RXP~J201742.3+364513.
6.4 NVSS~J202032+363158
The source NVSS~J202032+363158 is the brightest compact radio source within the error box of the TeV peak emission of MGRO~J2019+37 in our GMRT observations. Its flux density at 610 MHz is 833 mJy and has not been resolved. This source appears in the VLSS at 74 MHz, in the WENSS at 327 MHz, in the CGPS at 408 MHz (Taylor et al. 1996), in the Effelsberg survey of the Cygnus X region at 1420 MHz (Wendker et al. 1991), and in the Green Bank 4.85 GHz northern sky surveys 87GB (Gregory & Condon 1991) and GB6 (Gregory et al. 1996). In Table LABEL:table:flux, we summarize the detected flux densities within these surveys, and we plot the corresponding spectrum in Fig. 5. Assuming a stable flux density, the radio spectrum of this source can be described by , and it is, therefore, clearly a non-thermal emitter. Despite very low frequencies being sampled, no evidence of the turnover frequency below 1 GHz is obvious from this simple power-law fit.
| Survey | Frequency | Flux density |
|---|---|---|
| (MHz) | (mJy) | |
| VLSS | 74 | 6354708 |
| WENSS | 327 | 1442216 |
| CGPS | 408 | 1180360 |
| GMRT | 610 | 83356 |
| NVSS | 1400 | 38612 |
| GB6 | 4850 | 12112 |
| 87GB | 4850 | 10815 |


By inspecting of the NRAO archives, we found a previous VLA snapshot (6 min on source) of this radio source at the 20 cm wavelength in B configuration (providing a nominal synthesized beam of 4″) observed on 25 March 1989. This observation was calibrated using standard AIPS tasks, including phase self-calibration. A uniformly weighted image is shown in Fig. 6-left. As can be seen, this radio source is resolved, displaying a one-sided radio jet extending a few arcsec towards the north, with a core component of 250 mJy and a secondary component of about 70 mJy. To enhance the compact structure of the source, we obtained an image for the longest baselines of the same VLA run, using a -range of 30–50 k. The image, shown in Fig. 6-right, clearly shows a compact core and a secondary component, with peak flux densities of 170 and 20 mJy, respectively, resembling the large-scale jet of a microquasar.
To explore the source at higher angular resolutions, we observed the core of NVSS~J202032+363158 at 1.6 GHz (18 cm wavelength) with the European VLBI Network in eVLBI mode (eEVN). This is a technique in which the signals from distant radio telescopes are directly streamed into the central data processor for real-time correlation, instead of being recorded on disk or tape. The observation took place on 3 March 2007 from 5:00 to 13:00 UT (centered on MJD 54163.375), and was performed using 6 antennas: Cm, Mc, Jb-2, On-85, Tr, and Wb. Scans on NVSS~J202032+363158 were interleaved with scans on the compact phase calibrator J2015+3710, with a 6-min cycle time (66 s on the calibrator and 246 s on the source). The data were recorded using dual polarization and 2-bit sampling, at 256 Mbps. A total bandwidth of 32 MHz per polarization was provided by 4 sub-bands. The e-VLBI data were processed at the Joint Institute for VLBI in Europe (JIVE) correlator in real time, using an integration time of 2 sec. The target source was correlated with the position obtained from the VLA-B (30–50 k) data: and , for a total maximum uncertainty of 100 mas. During observations, we experienced synchronization problems and the correlation had to be restarted several times. A few antennas were dropped out of the correlation jobs during the gaps used for measuring the system temperatures. Due to these disconnections, part of the data, which is not recorded onto disks for these experiments, was lost during the correlation, and the true on-source time is estimated to be around 3 hours.
We performed the post-correlation data reduction using the AIPS software package and Difmap. We applied ionospheric corrections to the visibility data, and the system temperatures were used to obtain the a priori visibility amplitude calibration. All stations produced fringes with the 1-Jy phase calibrator, situated at 12 from the target, and we therefore transferred the solutions for the phases to the target source. We improved the amplitude calibration using correction factors for each antenna obtained from the self-calibration of J2015+3710. Self-calibration of the NVSS~J202032+363158 data was impossible because of the lack of bright sources in the primary beam of the antennas. The phased-referenced natural-weighted image that we obtained had a synthesized beam of 22.719.8 mas at a position angle of 303, and an rms noise of 0.20 mJy beam-1. No significant detections were found within a distance of 5″ from the correlated phase center.
There is no near-infrared counterpart candidate to NVSS~J202032+363158. The nearest sources are both at 41, with magnitudes of 14.2 and 17.3 in the -band.
7 Could any of the selected individual sources power the TeV emission from MGRO~J2019+37?
MGRO~J2019+37 covers a sky region of approximately . The extended emission could be produced by either a single powerful accelerator, or by the superposition of several point-like sources. Although we focus on the individual sources presented in Sect. 6, we cannot exclude some of the additional radio sources listed in Table LABEL:table:list of the online material being responsible for, or contributing to, the Milagro source.
If MGRO~J2019+37 is a single extended source, and not a combination of different sources, the origin of the 12 TeV emission is likely to be hadronic. The time required to fill a region of a size of 1° (or (1–5) cm at 2–10 kpc distance) with electrons of 100 TeV by means of diffusion is
| (1) |
where cm is the source size, and G is the ISM turbulent magnetic field. For realistic ISM densities of cm-3, and reasonable magnetic/mm-far IR field energy densities, i.e., 1 eV cm-3, the electron cooling timescale is dominated by synchrotron and IC losses and found to be s. Therefore, given that , electrons injected from a single accelerator cannot fill the entire multi-TeV source. Otherwise, protons cool mainly by means of collisions with the ISM nuclei ()
| (2) |
For 1 000–200 cm-3 (2–10 kpc) in the Milagro region, proton injection luminosities of erg s-1 should be enough to explain the observed luminosities (Abdo et al. 2007a) assuming that 0.1–1% of the proton power is in 12 TeV photons. As a result of interactions, secondary electron-positron pairs and neutrinos are also produced with luminosities and energies similar to those of gamma-rays (e.g., Kelner et al. 2006). These secondary pairs should radiate via synchrotron, relativistic bremsstrahlung, and IC. Extended radio and X-ray emission was detected within the Milagro region (Roberts et al. 2008; Hessels et al. 2004; Van Etten et al. 2008). However, the smaller extent of these diffuse sources compared to the size of the TeV emission makes any possible association difficult. Nevertheless, for typical ISM densities and magnetic and radiation fields, most of the emission from the secondary pairs could be produced at relatively low gamma-ray fluxes, rendering them undetectable.
Once the most probable emission scenario is decided, we will be able to see whether the different objects proposed in Sect. 6 could act as the accelerator.
The spin-down luminosity of PSR~J2021+3651 is marginally in agreement with the energetic requirements stated above. Nevertheless, for this object to act as the accelerator, most of this luminosity should be in the form of protons (as in, e.g., Horns et al. 2007b). In addition, the accelerated protons should escape the nebula in a time shorter than or equal to the age of the pulsar, kyr, which may not be possible if the turbulent magnetic field in the nebula reaches value of several 10 G or higher. On the other hand, the turndown in the AGILE GeV spectrum questions the association of AGL~J2020.5+3653 as the only counterpart to MGRO~J2019+37. Extrapolation of the last two data points in the spectrum shown in Halpern et al. (2008) provide a flux at 20 TeV a factor of 3500 below the reported MGRO~J2019+37 flux (Abdo et al. 2007b). Even ignoring the turndown and fitting the entire spectrum with a single power-law, there is still a one order of magnitude difference. Therefore, if no additional components are present in the GeV-TeV spectrum of PSR~J2021+3651/PWN~G75.2+0.1, this source alone can hardly explain the multi-TeV emission from MGRO~J2019+37.
The massive star and the star-forming region (MSR; SFR) associated with the H ii region Sh~2-104 could be responsible for the extended Milagro source if they were capable of injecting 1037 erg s-1 in the form of relativistic protons into their surroundings. Assuming an efficiency of a 10% for the kinetic energy converted to non-thermal proton energy in the shocks present inside the H ii/SFR region, about 100 massive (proto)stars producing jets or winds with velocities of cm s-1 and mass-loss rates of would be required to reach the needed proton luminosities. It seems unlikely that Sh~2-104 can harbor such a high number of massive (proto)stars. However, Sh~2-104 may be part of a larger MSR or SFR that have not yet been detected, and in that case, the larger whole MSR or SFR could represent the emitter of the whole Milagro source through wind collisions or jet/medium interactions (see, e.g., Torres et al. 2004; Romero 2008), respectively. In this scenario, thermal free-free radio emission from the whole SFR would be expected. The non-detection of this SFR in our GMRT observations could be explained by free-free absorption in the ionized regions and the surrounding material of the MSR/SFR, although the development of the particular details of this scenario are beyond the scope of this work. Observations searching for maser emission with instruments such as Apex or Nanten could help us to detect this hypothetical star-forming region.
We note that the accelerator itself might be outside MGRO~J2019+37, as in the case of the stellar cluster Berkeley~87 mentioned in Abdo et al. (2007a). This cluster could accelerate the protons that would then escape from it diffusing towards, and ultimately interacting with, a denser region located near the Milagro source best-fit model position.
We found three non-thermal radio sources with jet-like structures in the field of MGRO~J2019+37: sources A and B, and source NVSS~J202032+363158. Although some arguments support the extragalactic nature of sources A and B, we cannot exclude the possibility that they are Galactic in nature. VLBI observations of NVSS~J202032+363158 provide an upper limit of 1 mJy beam-1 to the flux for a beam size of 20 mas. Therefore, this source did not exhibit a compact core during our observations. It was either completely resolved or is a variable radio source, since no radio emission is expected in the high/soft state of microquasars. In any case, these three sources could be hadronic microquasars whose jets would interact with the ISM accelerating protons (e.g., Heinz & Sunyaev 2002; Bordas et al. 2009). The accelerated protons may escape from the accelerating region colliding with the surrounding regions of the ISM, rendering very high-energy emission (e.g., Bosch-Ramon et al. 2005). From the energetic point of view, although these sources could explain the Milagro source, the lack of clear X-ray counterparts needs to be explained, if accretion is taking place in these objects. It might be the case that accretion is inefficient in producing X-rays (as could be the case in LS~5039; e.g., Bosch-Ramon et al. 2007). Finally, a microquasar located outside the Milagro region could be powering the multi-TeV radiation.
The constraint on a hadronic origin for the Milagro emission does not apply if the source consists of different accelerators/emitters. In this case, several leptonic emitters, which may or may not coincide with (some of) the sources discussed here, could be behind MGRO~J2019+37.
From this analysis, we conclude that several objects should be considered when trying to understand the origin of MGRO~J2019+37, although the nature of the accelerator/emitter remains uncertain. Insights into this question could be provided by further multiwavelength studies, by future imaging atmospheric Cherenkov telescopes (MAGIC-II, H.E.S.S.-II), and by , which should be able to constrain the source position and morphology more tightly, and explore in detail its physics by obtaining spectral information across a broad wavelength range. Finally, neutrino detections with future neutrino instruments could provide additional evidence to support the hadronic scenario.
8 Conclusions
We have carried out a deep radio survey of about 6 square degrees region in the direction of MGRO~J2019+37, and a near-infrared survey of the central square degree. This has provided a catalogue of 362 radio sources and a catalogue of 315 000 NIR sources. The radio and NIR data presented here detect a large number of previously unknown sources and shed additional light on known objects. We have found that if a single accelerator is powering MGRO~J2019+37, the most likely origin of the multi-TeV emission is hadronic in nature. We have shown that the extrapolation of the spectrum of the pulsar AGL~J2020.5+3653 does not explain the detected flux from MGRO~J2019+37. This indicates either that there is an additional component in the GeV-TeV spectrum of the pulsar and/or that other sources, such as those discussed here, could contribute to the emission of the Milagro source. The results presented in this paper may be useful in interpreting future data provided by the Fermi satellite of the gamma-ray sources in this remarkable region of the Galactic plane. The physical understanding of the most relevant sources in the field is currently a work in progress, in addition to the analysis of new XMM-Newton and AGILE observations.
Acknowledgements.
We thank the staff of the GMRT who have made these observations possible. GMRT is run by the National Centre for Radio Astrophysics of the Tata Institute of Fundamental Research. Based on observations collected at the Centro Astronómico Hispano Alemán (CAHA) at Calar Alto, operated jointly by the Max-Planck Institut für Astronomie and the Instituto de Astrofísica de Andalucía (CSIC) This publication makes use of data products from the Two Micron All Sky Survey, which is a joint project of the University of Massachusetts and the Infrared Processing and Analysis Center/California Institute of Technology, funded by the NASA and NSF in the USA. e-VLBI developments in Europe are supported by the EC DG-INFSO funded Communication Network Developments project ’EXPReS’ Contract No. 02662. The European VLBI Network is a joint facility of European, Chinese, South African and other radio astronomy institutes funded by their national research councils. We acknowledge support by DGI of the Spanish Ministerio de Educación y Ciencia (MEC) under grants AYA2007-68034-C03-01, AYA2007-68034-C03-02 and AYA2007-68034-C03-03, FEDER funds and Junta de Andalucía under PAIDI research group FQM-322. J.M. was supported by the Spanish Ministerio de Ciencia e Innovacion (MICINN) under fellowship BES-2008-004564. M.P. and M.R. acknowledge financial support from MEC and European Social Funds through a Ramón y Cajal research contract. V.B-R. gratefully acknowledges support from the Alexander von Humboldt Foundation. P.B. was supported by the DGI of MEC (Spain) under fellowship BES-2005-7234. G.E.R is supported by the Argentine Agencies CONICET (PIP 5375) and ANPCyT (PICT 03-13291). We thank the anonymous referee for his useful comments.References
- Abdo et al. (2007a) Abdo, A. A., Allen, B., Berley, D., et al. (The Milagro Collaboration) 2007a, ApJ, 658, L33
- Abdo et al. (2007b) Abdo, A. A., Allen, B., Berley, D., et al. (The Milagro Collaboration) 2007b, ApJ, 664, L91
- Abdo et al. (2009) Abdo, A. A., Ackermann, M., Ajello, M., et al. (The Fermi LAT Collaboration) 2009, ApJS, submitted, [arXiv:0902.1340v1]
- Aharonian & Atoyan (1996) Aharonian, F. A., & Atoyan, A. M. 1996, A&A, 309, 917
- Aharonian & Atoyan (1998) Aharonian, F. A., & Atoyan, A. M. 1998, NewAR, 42, 579
- Amenomori et al. (2006) Amenomori, M., Ayabe, S., Bi, X. J., et al. 2006, Science, 314, 439
- Amenomori et al. (2008) Amenomori, M., Bi, X. J., Chen, D., & et al. 2008, Proceedings of the 30th ICRC, 2, 695
- Berghöfer et al. (1997) Berghöfer, T. W., Schmitt, J. H. M. M., Danner, R., & Cassinelli, J. P. 1997, A&A, 322, 167
- Bertin & Arnouts (1996) Bertin, E., & Arnouts, S. 1996, A&AS, 117, 393
- Bordas et al. (2009) Bordas, P., Bosch-Ramon, V., Paredes, J. M., & Perucho, M. 2009, A&A, 497, 325
- Bosch-Ramon et al. (2005) Bosch-Ramon, V., Aharonian, F. E., & Paredes, J. M. 2005, A&A, 432, 609
- Bosch-Ramon et al. (2007) Bosch-Ramon, V., Motch, C., Ribó, M., et al. 2007, A&A, 473, 545
- Butt et al. (2003) Butt, Y., Benaglia, P., Combi, J. A., et al. 2003, ApJ, 597, 494
- Cohen et al. (2007) Cohen, A. S., Lane, W. M., Cotton, W. D., et al. 2007, AJ, 134, 1245
- Condon et al. (1998) Condon, J. J., Cotton, W. D., Greisen, E. W., et al. 1998, AJ, 115, 1693
- Deharveng et al. (2003) Deharveng, L., Lefloch, B., Zavagno, A., et al. 2003, A&A, 408, L25
- Fich (1993) Fich, M. 1993, ApJS, 86, 475
- Gregory & Condon (1991) Gregory, P. C., & Condon, J. J. 1991, ApJS, 75, 1011
- Gregory et al. (1996) Gregory, P. C., Scott, W. K., Douglas, K., & Condon, J. J. 1996, ApJS, 103, 427
- Güdel (2004) Güdel, M. 2004, Astron. Astrophys. Review, 12, 71
- Halpern et al. (2001) Halpern, J. P., Gotthelf, E. V., Leighly, K. M., Helfand, D. J. 2001, ApJ, 547, 323
- Halpern et al. (2008) Halpern, J. P., Camilo, F., Giuliani, A., et al. 2008, ApJ, 688, L33
- Hartman et al. (1999) Hartman, R. C., Bertsch, D. L., Bloom, S. D., et al. 1999, ApJS, 123, 79
- Heinz & Sunyaev (2002) Heinz, S., & Sunyaev, R. 2002, A&A, 390, 751
- Hessels et al. (2004) Hessels, J. W. T., Roberts, M. S. E., Ransom, S. M., et al. 2004, ApJ, 612, 389
- Horns et al. (2007a) Horns, D., Hoffmann, A. I. D., Santangelo, A., Aharonian, F. A., & Rowell, G. P. 2007a, A&A, 469, L17
- Horns et al. (2007b) Horns, D., Aharonian, F., Hoffmann, A. I. D., & Santangelo, A. 2007b, Ap&SS, 309, 189
- Kelner et al. (2006) Kelner, S. R., Aharonian, F. A., & Bugayov, V. V. 2006, Phys. Rev. D, 74, 4018
- Kieda et al. (2008) Kieda, D. B., et al. 2008, Proceedings of the 30th ICRC, 2, 843
- Lahulla et al. (1985) Lahulla, J. F. 1985, A&AS, 61, 537
- Lamb & Macomb (1997) Lamb, R. C., & Macomb, D. J. 1997, ApJ, 488, 872
- Martins et al. (2005) Martins, F., Schaerer, D., & Hillier, D. J. 2005, A&A, 436, 1049
- Mirabel et al. (1992) Mirabel, I. F., Rodríguez, L. F., Cordier, B., Paul, J., & Lebrun, F. 1992, Nature, 358, 215
- Mukherjee et al. (2000) Mukherjee, R., Gotthelf, E. V., Halpern, J., & Tavani, M. 2000, ApJ, 542, 740
- Paredes et al. (2007) Paredes, J. M., Martí, J., Ishwara Chandra, C. H., & Bosch-Ramon, V. 2007, ApJ, 654, L135
- Paredes et al. (2008) Paredes, J. M., Martí, J., Ishwara-Chandra, C. H., et al. 2008, A&A, 482, 247
- Pittori et al. (2009) Pittori, C., Verrecchia, F., Chen, A. W., et al. 2009, A&A, submitted, [arXiv:0902.2959v1]
- Rengelink et al. (1997) Rengelink, R. B., Tang, Y., de Bruyn, A. G., et al. 1997, A&AS, 124, 259
- Roberts et al. (2002) Roberts, M. S. E., Hessels, J. W. T., Ransom, S. M., et al. 2002, ApJ, 577, L19
- Roberts et al. (2008) Roberts, M. S. E., Brogan, C., Ransom, S., et al. 2008, AIP Conference Series, 1085, 328
- Rosat consortium (2000) Rosat Consortium 2000, VizieR Online Data Catalog, 9030, 0
- Romero (2008) Romero, G. E. 2008, AIP Conference Series, 1085, 97
- Setia Gunawan et al. (2003) Setia Gunawan, D. Y. A., de Bruyn, A. G., van der Hucht, K. A., & Williams, P. M. 2003, ApJS, 149, 123
- Skrutskie et al. (2006) Skrutskie, M. F., Cutri, R. M., Stiening, R., et al. 2006, AJ, 131, 1163
- Taylor et al. (1996) Taylor, A. R., Goss, W. M., Coleman, P. H., van Leeuwen, J., & Wallace, B. J. 1996, ApJS, 107, 239
- Taylor et al. (2003) Taylor, A. R., Gibson, S. J., Peracaula, M., et al. 2003, AJ, 125, 3145
- Torres et al. (2004) Torres, D. F., Domingo-Santamaría, E., & Romero, G. E. 2004, ApJ, 601, L75
- Van Etten et al. (2008) Van Etten, A., Romani, R. W., & Ng, C.-Y. 2008, ApJ, 680, 1417
- Wendker et al. (1991) Wendker, H. J., Higgs, L. A., & Landecker, T. L. 1991, A&A, 241, 551
| # | Name | RA | DEC | Peak flux density | Local Noise | Integrated flux density | Error | ||
| (J2000.0) | (J2000.0) | (mJy beam-1) | (mJy beam-1) | (mJy) | (mJy) | (mag) | (erg cm-2 s-1) | ||
| 1 | GMRT J201142.7+374208 | 20:11:42.73 | +37:42:08.5 | 8.00 | 0.53 | 9.24 | 0.18 | … | ND |
| 2 | GMRT J201146.3+364937 | 20:11:46.38 | +36:49:37.5 | 4.59 | 0.33 | 24.81 | 0.30 | … | ND |
| 3 | GMRT J201146.5+362243 | 20:11:46.58 | +36:22:43.8 | 74.05 | 0.44 | 136.67 | 0.24 | … | … |
| 4 | GMRT J201147.6+362234 | 20:11:47.62 | +36:22:34.2 | 86.34 | 0.42 | 149.12 | 0.22 | … | … |
| 5 | GMRT J201201.3+362753 | 20:12:01.33 | +36:27:53.7 | 12.93 | 0.37 | 14.96 | 0.12 | … | … |
| 6 | GMRT J201205.7+371130 | 20:12:05.71 | +37:11:30.6 | 9.14 | 0.49 | 17.85 | 0.30 | … | … |
| 7 | GMRT J201209.8+361841 | 20:12:09.85 | +36:18:41.2 | 4.15 | 0.26 | 4.51 | 0.09 | … | … |
| 8 | GMRT J201210.2+373305 | 20:12:10.20 | +37:33:05.6 | 7.30 | 0.37 | 8.72 | 0.14 | … | … |
| 9 | GMRT J201215.7+364050 | 20:12:15.74 | +36:40:50.5 | 5.55 | 0.31 | 6.23 | 0.12 | … | … |
| 10 | GMRT J201226.0+364915 | 20:12:26.09 | +36:49:15.3 | 7.32 | 0.24 | 6.98 | 0.08 | … | … |
| 11 | GMRT J201231.1+361933 | 20:12:31.14 | +36:19:33.2 | 39.65 | 0.23 | 46.83 | 0.10 | … | … |
| 12 | GMRT J201231.9+361939 | 20:12:31.98 | +36:19:39.0 | 39.07 | 0.23 | 45.91 | 0.10 | … | … |
| 13 | GMRT J201238.8+362608 | 20:12:38.86 | +36:26:08.8 | 4.82 | 0.28 | 5.10 | 0.09 | … | … |
| 14 | GMRT J201239.1+360441 | 20:12:39.18 | +36:04:41.3 | 8.42 | 0.19 | 8.83 | 0.07 | … | … |
| 15 | GMRT J201239.2+363457 | 20:12:39.24 | +36:34:57.5 | 14.63 | 0.36 | 40.81 | 0.24 | … | ND |
| 16 | GMRT J201239.6+372145 | 20:12:39.65 | +37:21:45.7 | 11.85 | 0.40 | 17.96 | 0.18 | … | … |
| 17 | GMRT J201239.7+362538 | 20:12:39.71 | +36:25:38.8 | 5.06 | 0.26 | 5.22 | 0.08 | … | … |
| 18 | GMRT J201240.2+363444 | 20:12:40.26 | +36:34:44.0 | 16.26 | 0.36 | 36.98 | 0.22 | … | … |
| 19 | GMRT J201242.7+365510 | 20:12:42.78 | +36:55:10.4 | 11.65 | 0.24 | 20.67 | 0.11 | … | … |
| 20 | GMRT J201243.7+374416 | 20:12:43.75 | +37:44:16.5 | 46.67 | 0.38 | 54.87 | 0.16 | … | … |
| 21 | GMRT J201245.3+363333 | 20:12:45.39 | +36:33:33.1 | 41.41 | 0.33 | 65.06 | 0.16 | … | … |
| 22 | GMRT J201246.6+361309 | 20:12:46.61 | +36:13:09.7 | 4.06 | 0.23 | 4.07 | 0.08 | … | … |
| 23 | GMRT J201248.2+374332 | 20:12:48.20 | +37:43:32.5 | 18.02 | 0.35 | 19.03 | 0.12 | … | ND |
| 24 | GMRT J201300.6+370004 | 20:13:00.65 | +37:00:04.8 | 4.51 | 0.26 | 4.87 | 0.10 | … | … |
| 25 | GMRT J201304.5+365736 | 20:13:04.57 | +36:57:36.2 | 43.73 | 0.28 | 69.86 | 0.13 | … | … |
| 26 | GMRT J201305.3+365739 | 20:13:05.35 | +36:57:39.4 | 58.91 | 0.28 | 100.44 | 0.15 | … | … |
| 27 | GMRT J201305.4+360134 | 20:13:05.41 | +36:01:34.5 | 21.11 | 0.22 | 21.95 | 0.09 | … | ND |
| 28 | GMRT J201317.0+370715 | 20:13:17.03 | +37:07:15.8 | 14.39 | 0.29 | 16.44 | 0.11 | … | ND |
| 29 | GMRT J201319.6+373729 | 20:13:19.66 | +37:37:29.4 | 8.81 | 0.30 | 9.25 | 0.12 | … | … |
| 30 | GMRT J201320.9+375132 | 20:13:20.94 | +37:51:32.4 | 30.36 | 0.40 | 37.25 | 0.16 | … | … |
| 31 | GMRT J201324.1+375516 | 20:13:24.13 | +37:55:16.7 | 10.60 | 0.45 | 13.89 | 0.17 | … | … |
| 32 | GMRT J201334.0+361501 | 20:13:34.03 | +36:15:01.8 | 35.94 | 0.26 | 82.97 | 0.15 | … | … |
| 33 | GMRT J201334.3+360926 | 20:13:34.33 | +36:09:26.0 | 224.70 | 0.37 | 376.50 | 0.22 | … | … |
| 34 | GMRT J201337.0+360942 | 20:13:37.01 | +36:09:42.7 | 54.91 | 0.38 | 241.40 | 0.30 | … | … |
| 35 | GMRT J201346.1+365908 | 20:13:46.19 | +36:59:08.2 | 5.20 | 0.24 | 5.45 | 0.08 | … | … |
| 36 | GMRT J201347.5+365539 | 20:13:47.56 | +36:55:39.4 | 3.49 | 0.23 | 5.49 | 0.10 | … | ND |
| 37 | GMRT J201347.7+373920 | 20:13:47.70 | +37:39:20.5 | 9.85 | 0.33 | 13.32 | 0.14 | … | ND |
| 38 | GMRT J201349.1+355827 | 20:13:49.11 | +35:58:27.9 | 6.72 | 0.26 | 5.90 | 0.07 | … | … |
| 39 | GMRT J201405.5+372431 | 20:14:05.59 | +37:24:31.4 | 12.58 | 0.38 | 15.84 | 0.15 | … | ND |
| 40 | GMRT J201408.7+373325 | 20:14:08.77 | +37:33:25.4 | 28.25 | 0.37 | 47.09 | 0.18 | … | … |
| 41 | GMRT J201409.4+373400 | 20:14:09.49 | +37:34:00.1 | 50.56 | 0.39 | 74.39 | 0.19 | … | … |
| 42 | GMRT J201410.4+371552 | 20:14:10.48 | +37:15:52.8 | 23.05 | 0.50 | 36.08 | 0.23 | … | … |
| 43 | GMRT J201410.7+371544 | 20:14:10.71 | +37:15:44.1 | 14.84 | 0.50 | 21.21 | 0.21 | … | … |
| 44 | GMRT J201412.4+355218 | 20:14:12.48 | +35:52:18.0 | 8.82 | 0.30 | 16.61 | 0.15 | … | … |
| 45 | GMRT J201413.4+355242 | 20:14:13.45 | +35:52:42.7 | 5.31 | 0.29 | 8.41 | 0.13 | … | … |
| 46 | GMRT J201416.1+372344 | 20:14:16.16 | +37:23:44.0 | 7.36 | 0.42 | 28.14 | 0.30 | … | … |
| 47 | GMRT J201418.2+372339 | 20:14:18.23 | +37:23:39.7 | 5.58 | 0.44 | 13.50 | 0.19 | … | ND |
| 48 | GMRT J201425.7+353650 | 20:14:25.78 | +35:36:50.1 | 14.38 | 0.34 | 24.24 | 0.16 | … | … |
| 49 | GMRT J201435.8+364550 | 20:14:35.80 | +36:45:50.7 | 4.49 | 0.34 | 13.36 | 0.18 | … | … |
| 50 | GMRT J201449.4+374335 | 20:14:49.45 | +37:43:35.1 | 38.17 | 0.34 | 75.05 | 0.19 | … | … |
| 51 | GMRT J201450.9+360136 | 20:14:50.94 | +36:01:36.6 | 95.37 | 0.39 | 264.77 | 0.30 | … | … |
| 52 | GMRT J201451.6+360149 | 20:14:51.64 | +36:01:49.9 | 31.94 | 0.39 | 138.58 | 0.30 | … | … |
| 53 | GMRT J201451.8+370025 | 20:14:51.82 | +37:00:25.6 | 14.90 | 0.56 | 23.33 | 0.24 | … | … |
| 54 | GMRT J201452.0+361758 | 20:14:52.07 | +36:17:58.6 | 13.67 | 0.33 | 17.10 | 0.12 | … | … |
| 55 | GMRT J201454.4+370034 | 20:14:54.46 | +37:00:34.6 | 16.24 | 0.56 | 25.47 | 0.21 | … | … |
| 56 | GMRT J201509.0+373725 | 20:15:09.05 | +37:37:25.0 | 7.66 | 0.33 | 9.47 | 0.12 | … | … |
| 57 | GMRT J201509.3+371655 | 20:15:09.32 | +37:16:55.6 | 17.09 | 0.88 | 60.91 | 0.60 | … | … |
| 58 | GMRT J201510.6+370049 | 20:15:10.69 | +37:00:49.5 | 10.73 | 0.54 | 21.55 | 0.30 | … | … |
| 59 | GMRT J201516.5+362701 | 20:15:16.52 | +36:27:01.5 | 401.95 | 0.69 | 632.20 | 0.50 | … | … |
| 60 | GMRT J201517.1+362705 | 20:15:17.17 | +36:27:05.3 | 294.24 | 0.69 | 415.41 | 0.40 | … | ND |
| 61 | GMRT J201518.9+353616 | 20:15:18.91 | +35:36:16.1 | 10.61 | 0.22 | 15.70 | 0.09 | … | … |
| 62 | GMRT J201527.4+353621 | 20:15:27.47 | +35:36:21.1 | 22.28 | 0.25 | 37.70 | 0.12 | … | … |
| 63 | GMRT J201528.7+371100 | 20:15:28.77 | +37:11:00.2 | 1309.26 | 1.26 | 1891.45 | 0.70 | … | … |
| 64 | GMRT J201529.7+380119 | 20:15:29.70 | +38:01:19.0 | 49.27 | 0.29 | 74.70 | 0.15 | … | … |
| 65 | GMRT J201529.7+363943 | 20:15:29.71 | +36:39:43.5 | 5.07 | 0.31 | 6.63 | 0.11 | … | ND |
| 66 | GMRT J201534.7+375728 | 20:15:34.76 | +37:57:28.7 | 8.19 | 0.20 | 29.68 | 0.17 | … | ND |
| 67 | GMRT J201535.1+363928 | 20:15:35.15 | +36:39:28.4 | 3.96 | 0.30 | 7.07 | 0.13 | … | … |
| 68 | GMRT J201535.5+375718 | 20:15:35.57 | +37:57:18.4 | 7.11 | 0.20 | 50.31 | 0.30 | … | … |
| 69 | GMRT J201556.3+365935 | 20:15:56.35 | +36:59:35.6 | 80.35 | 0.40 | 103.09 | 0.18 | … | … |
| 70 | GMRT J201557.8+375014 | 20:15:57.80 | +37:50:14.7 | 7.19 | 0.17 | 8.70 | 0.06 | … | … |
| 71 | GMRT J201558.1+381003 | 20:15:58.12 | +38:10:03.6 | 7.62 | 0.23 | 10.78 | 0.10 | … | |
| 72 | GMRT J201558.5+362559 | 20:15:58.56 | +36:25:59.1 | 31.57 | 0.26 | 73.82 | 0.17 | … | … |
| 73 | GMRT J201558.7+381004 | 20:15:58.73 | +38:10:04.1 | 12.22 | 0.23 | 23.42 | 0.13 | … | … |
| 74 | GMRT J201559.9+362536 | 20:15:59.90 | +36:25:36.8 | 6.07 | 0.26 | 10.12 | 0.15 | … | … |
| 75 | GMRT J201600.7+362517 | 20:16:00.71 | +36:25:17.1 | 13.06 | 0.26 | 54.98 | 0.23 | … | … |
| 76 | GMRT J201603.2+375721 | 20:16:03.20 | +37:57:21.6 | 39.66 | 0.19 | 58.18 | 0.10 | … | … |
| 77 | GMRT J201616.9+353948 | 20:16:16.95 | +35:39:48.4 | 50.40 | 0.29 | 180.26 | 0.23 | … | … |
| 78 | GMRT J201619.8+380044 | 20:16:19.82 | +38:00:44.2 | 3.38 | 0.16 | 4.39 | 0.07 | … | … |
| 79 | GMRT J201620.9+353945 | 20:16:20.90 | +35:39:45.7 | 97.32 | 0.29 | 314.61 | 0.21 | … | … |
| 80 | GMRT J201621.4+354020 | 20:16:21.41 | +35:40:20.6 | 4.15 | 0.28 | 7.07 | 0.12 | … | … |
| 81 | GMRT J201621.6+380519 | 20:16:21.60 | +38:05:19.9 | 2.15 | 0.18 | 3.48 | 0.07 | … | … |
| 82 | GMRT J201626.0+355829 | 20:16:26.03 | +35:58:29.5 | 5.76 | 0.28 | 8.36 | 0.12 | … | … |
| 83 | GMRT J201627.5+365501 | 20:16:27.51 | +36:55:01.1 | 19.55 | 0.26 | 38.45 | 0.13 | … | … |
| 84 | GMRT J201641.9+353650 | 20:16:41.98 | +35:36:50.3 | 48.59 | 0.28 | 88.20 | 0.14 | … | … |
| 85 | GMRT J201645.3+360034 | 20:16:45.38 | +36:00:34.8 | 325.22 | 0.55 | 698.65 | 0.40 | … | … |
| 86 | GMRT J201645.6+360109 | 20:16:45.66 | +36:01:09.7 | 15.07 | 0.58 | 20.37 | 0.23 | … | … |
| 87 | GMRT J201646.2+380601 | 20:16:46.26 | +38:06:01.9 | 2.80 | 0.17 | 3.35 | 0.07 | … | … |
| 88 | GMRT J201648.2+363133 | 20:16:48.23 | +36:31:33.8 | 13.05 | 0.18 | 44.51 | 0.13 | … | ND |
| 89 | GMRT J201654.2+372553 | 20:16:54.27 | +37:25:53.0 | 15.98 | 0.41 | 24.75 | 0.23 | … | … |
| 90 | GMRT J201654.4+363104 | 20:16:54.46 | +36:31:04.5 | 4.44 | 0.18 | 9.43 | 0.11 | … | … |
| 91 | GMRT J201656.4+371353 | 20:16:56.46 | +37:13:53.8 | 3.98 | 0.25 | 4.93 | 0.10 | … | … |
| 92 | GMRT J201657.6+370545 | 20:16:57.62 | +37:05:45.4 | 6.43 | 0.21 | 11.75 | 0.09 | … | … |
| 93 | GMRT J201659.9+363231 | 20:16:59.99 | +36:32:31.0 | 2.76 | 0.18 | 2.57 | 0.06 | … | … |
| 94 | GMRT J201700.5+360126 | 20:17:00.52 | +36:01:26.3 | 9.45 | 0.42 | 14.53 | 0.15 | … | … |
| 95 | GMRT J201700.5+354712 | 20:17:00.55 | +35:47:12.8 | 11.58 | 0.27 | 23.36 | 0.14 | … | … |
| 96 | GMRT J201701.5+354654 | 20:17:01.53 | +35:46:54.3 | 39.87 | 0.33 | 87.71 | 0.19 | … | … |
| 97 | GMRT J201716.8+375819 | 20:17:16.83 | +37:58:19.3 | 12.53 | 0.17 | 23.37 | 0.09 | … | … |
| 98 | GMRT J201720.8+350749 | 20:17:20.88 | +35:07:49.9 | 5.90 | 0.34 | 10.16 | 0.15 | … | … |
| 99 | GMRT J201721.9+354610 | 20:17:21.98 | +35:46:10.7 | 17.31 | 0.30 | 47.70 | 0.17 | … | … |
| 100 | GMRT J201725.8+373043 | 20:17:25.88 | +37:30:43.1 | 6.84 | 0.41 | 11.19 | 0.18 | … | … |
| 101 | GMRT J201726.7+371357 | 20:17:26.70 | +37:13:57.2 | 9.57 | 0.19 | 15.02 | 0.10 | ND | … |
| 102 | GMRT J201727.9+355144 | 20:17:27.97 | +35:51:44.1 | 12.91 | 0.26 | 21.93 | 0.12 | … | … |
| 103 | GMRT J201732.1+371605 | 20:17:32.15 | +37:16:05.9 | 3.09 | 0.19 | 3.30 | 0.07 | ND | … |
| 104 | GMRT J201741.4+355629 | 20:17:41.42 | +35:56:29.3 | 4.63 | 0.26 | 12.86 | 0.16 | … | … |
| 105 | GMRT J201742.1+355628 | 20:17:42.10 | +35:56:28.4 | 3.89 | 0.26 | 10.35 | 0.15 | … | … |
| 106 | GMRT J201742.1+373507 | 20:17:42.15 | +37:35:07.6 | 9.83 | 0.31 | 14.15 | 0.15 | … | … |
| 107 | GMRT J201742.5+372501 | 20:17:42.55 | +37:25:01.8 | 4.92 | 0.25 | 5.06 | 0.07 | … | … |
| 108 | GMRT J201744.3+365142 | 20:17:44.37 | +36:51:42.2 | 5.89 | 0.16 | 15.00 | 0.13 | 16.0 | ND |
| 109 | GMRT J201744.8+365045 | 20:17:44.82 | +36:50:45.2 | 22.12 | 0.17 | 33.46 | 0.08 | ND | |
| 110 | GMRT J201745.4+365315 | 20:17:45.48 | +36:53:15.6 | 8.61 | 0.17 | 14.93 | 0.09 | 14.9 | ND |
| 111 | GMRT J201748.5+371322 | 20:17:48.58 | +37:13:22.2 | 3.08 | 0.18 | 3.57 | 0.07 | ND | … |
| 112 | GMRT J201748.6+351833 | 20:17:48.60 | +35:18:33.9 | 4.10 | 0.30 | 5.43 | 0.11 | … | … |
| 113 | GMRT J201748.7+375807 | 20:17:48.76 | +37:58:07.0 | 4.36 | 0.19 | 7.02 | 0.09 | … | … |
| 114 | GMRT J201749.5+381549 | 20:17:49.59 | +38:15:49.6 | 206.04 | 0.48 | 417.19 | 0.30 | … | … |
| 115 | GMRT J201749.9+365508 | 20:17:49.90 | +36:55:08.3 | 5.11 | 0.18 | 6.57 | 0.08 | 16.6 | |
| 116 | GMRT J201750.4+370311 | 20:17:50.48 | +37:03:11.3 | 4.67 | 0.16 | 5.18 | 0.06 | ND | … |
| 117 | GMRT J201750.5+353407 | 20:17:50.52 | +35:34:07.9 | 3.11 | 0.25 | 3.04 | 0.07 | … | … |
| 118 | GMRT J201751.5+351821 | 20:17:51.51 | +35:18:21.6 | 77.25 | 0.29 | 122.32 | 0.16 | … | … |
| 119 | GMRT J201753.7+381522 | 20:17:53.73 | +38:15:22.8 | 7.03 | 0.46 | 10.21 | 0.18 | … | … |
| 120 | GMRT J201753.8+351822 | 20:17:53.88 | +35:18:22.2 | 104.31 | 0.27 | 189.99 | 0.17 | … | … |
| 121 | GMRT J201754.8+375451 | 20:17:54.84 | +37:54:51.5 | 20.96 | 0.22 | 26.22 | 0.09 | … | ND |
| 122 | GMRT J201755.1+380017 | 20:17:55.10 | +38:00:17.5 | 3.13 | 0.20 | 5.01 | 0.09 | … | ND |
| 123 | GMRT J201756.3+363726 | 20:17:56.35 | +36:37:26.9 | 11.41 | 0.25 | 16.38 | 0.11 | ND | ND |
| 124 | GMRT J201756.5+364540 | 20:17:56.56 | +36:45:40.9 | 15.95 | 0.20 | 51.76 | 0.13 | ND | |
| 125 | GMRT J201756.5+364825 | 20:17:56.59 | +36:48:25.3 | 12.40 | 0.16 | 16.51 | 0.08 | ND | … |
| 126 | GMRT J201758.2+370125 | 20:17:58.29 | +37:01:25.3 | 2.28 | 0.17 | 2.57 | 0.06 | 13.5 | … |
| 127 | GMRT J201758.8+351806 | 20:17:58.83 | +35:18:06.3 | 3.16 | 0.25 | 6.00 | 0.11 | … | … |
| 128 | GMRT J201759.7+353655 | 20:17:59.70 | +35:36:55.5 | 14.47 | 0.28 | 25.90 | 0.14 | … | … |
| 129 | GMRT J201759.7+363018 | 20:17:59.75 | +36:30:18.1 | 29.44 | 0.21 | 39.47 | 0.09 | ND | … |
| 130 | GMRT J201803.9+375314 | 20:18:03.91 | +37:53:14.6 | 4.45 | 0.22 | 5.55 | 0.09 | … | … |
| 131 | GMRT J201807.4+381436 | 20:18:07.46 | +38:14:36.1 | 7.84 | 0.30 | 9.09 | 0.10 | … | … |
| 132 | GMRT J201807.6+360357 | 20:18:07.64 | +36:03:57.2 | 7.70 | 0.21 | 13.11 | 0.09 | … | … |
| 133 | GMRT J201808.0+345816 | 20:18:08.04 | +34:58:16.2 | 12.21 | 0.39 | 27.64 | 0.19 | … | … |
| 134 | GMRT J201810.1+371936 | 20:18:10.16 | +37:19:36.5 | 3.11 | 0.17 | 8.97 | 0.08 | … | … |
| 135 | GMRT J201811.2+354551 | 20:18:11.25 | +35:45:51.1 | 2.68 | 0.23 | 3.77 | 0.07 | … | … |
| 136 | GMRT J201812.7+350746 | 20:18:12.79 | +35:07:46.7 | 5.00 | 0.21 | 5.35 | 0.06 | … | … |
| 137 | GMRT J201813.0+360046 | 20:18:13.08 | +36:00:46.3 | 14.58 | 0.21 | 19.16 | 0.10 | … | … |
| 138 | GMRT J201815.4+352032 | 20:18:15.45 | +35:20:32.5 | 10.38 | 0.18 | 11.18 | 0.07 | … | … |
| 139 | GMRT J201822.6+351212 | 20:18:22.61 | +35:12:12.8 | 4.80 | 0.19 | 5.67 | 0.08 | … | ND |
| 140 | GMRT J201823.9+370819 | 20:18:23.94 | +37:08:19.4 | 27.63 | 0.16 | 37.99 | 0.08 | ND | … |
| 141 | GMRT J201830.6+370225 | 20:18:30.64 | +37:02:25.6 | 7.55 | 0.17 | 61.16 | 0.20 | ND | … |
| 142 | GMRT J201832.4+370234 | 20:18:32.43 | +37:02:34.5 | 13.66 | 0.16 | 103.51 | 0.21 | ND | … |
| 143 | GMRT J201833.5+374016 | 20:18:33.53 | +37:40:16.7 | 3.72 | 0.22 | 10.24 | 0.13 | … | … |
| 144 | GMRT J201834.4+374020 | 20:18:34.45 | +37:40:20.8 | 9.48 | 0.22 | 17.34 | 0.13 | … | … |
| 145 | GMRT J201839.3+380853 | 20:18:39.32 | +38:08:53.6 | 77.29 | 0.30 | 269.62 | 0.21 | … | … |
| 146 | GMRT J201841.8+361717 | 20:18:41.86 | +36:17:17.8 | 10.01 | 0.25 | 14.25 | 0.11 | … | … |
| 147 | GMRT J201842.7+381242 | 20:18:42.79 | +38:12:42.0 | 72.15 | 0.25 | 84.24 | 0.11 | … | … |
| 148 | GMRT J201843.7+351006 | 20:18:43.78 | +35:10:06.2 | 2.39 | 0.18 | 2.44 | 0.06 | … | … |
| 149 | GMRT J201843.7+381656 | 20:18:43.79 | +38:16:56.6 | 4.28 | 0.21 | 4.23 | 0.07 | … | … |
| 150 | GMRT J201844.9+375108 | 20:18:44.93 | +37:51:08.8 | 5.09 | 0.21 | 6.35 | 0.08 | … | … |
| 151 | GMRT J201848.4+353512 | 20:18:48.43 | +35:35:12.9 | 11.20 | 0.18 | 12.45 | 0.07 | … | ND |
| 152 | GMRT J201848.4+353137 | 20:18:48.49 | +35:31:37.2 | 4.76 | 0.16 | 7.74 | 0.09 | … | … |
| 153 | GMRT J201848.5+371937 | 20:18:48.50 | +37:19:37.7 | 6.76 | 0.16 | 8.57 | 0.08 | … | … |
| 154 | GMRT J201850.2+351734 | 20:18:50.24 | +35:17:34.7 | 3.37 | 0.15 | 3.64 | 0.05 | … | … |
| 155 | GMRT J201850.8+350926 | 20:18:50.80 | +35:09:26.0 | 5.68 | 0.18 | 13.84 | 0.13 | … | … |
| 156 | GMRT J201851.6+350930 | 20:18:51.60 | +35:09:30.0 | 4.02 | 0.18 | 8.61 | 0.10 | … | … |
| 157 | GMRT J201852.4+363632 | 20:18:52.46 | +36:36:32.0 | 32.61 | 0.22 | 64.00 | 0.12 | ND | … |
| 158 | GMRT J201854.0+355023 | 20:18:54.07 | +35:50:23.1 | 3.83 | 0.23 | 3.56 | 0.07 | … | ND |
| 159 | GMRT J201854.6+352821 | 20:18:54.64 | +35:28:21.4 | 5.39 | 0.16 | 5.26 | 0.05 | … | … |
| 160 | GMRT J201855.5+360213 | 20:18:55.50 | +36:02:13.1 | 2.54 | 0.17 | 2.38 | 0.06 | … | … |
| 161 | GMRT J201856.5+360609 | 20:18:56.58 | +36:06:09.9 | 2.81 | 0.19 | 3.08 | 0.07 | … | … |
| 162 | GMRT J201858.0+375656 | 20:18:58.02 | +37:56:56.6 | 2.82 | 0.23 | 7.95 | 0.12 | … | … |
| 163 | GMRT J201859.5+372451 | 20:18:59.58 | +37:24:51.2 | 11.17 | 0.21 | 16.11 | 0.09 | … | … |
| 164 | GMRT J201904.0+370206 | 20:19:04.04 | +37:02:06.6 | 3.17 | 0.12 | 4.57 | 0.05 | ND | … |
| 165 | GMRT J201904.8+360809 | 20:19:04.83 | +36:08:09.8 | 4.86 | 0.20 | 4.52 | 0.07 | … | … |
| 166 | GMRT J201908.7+374925 | 20:19:08.78 | +37:49:25.8 | 11.24 | 0.24 | 13.52 | 0.10 | … | … |
| 167 | GMRT J201913.7+352154 | 20:19:13.72 | +35:21:54.3 | 49.36 | 0.20 | 60.42 | 0.10 | … | … |
| 168 | GMRT J201914.5+351518 | 20:19:14.56 | +35:15:18.7 | 2.28 | 0.16 | 4.01 | 0.07 | … | ND |
| 169 | GMRT J201914.5+354400 | 20:19:14.58 | +35:44:00.7 | 58.11 | 0.25 | 90.26 | 0.13 | … | … |
| 170 | GMRT J201914.6+352156 | 20:19:14.67 | +35:21:56.9 | 28.84 | 0.20 | 43.13 | 0.10 | … | … |
| 171 | GMRT J201916.0+373528 | 20:19:16.03 | +37:35:28.5 | 9.35 | 0.16 | 12.51 | 0.07 | … | … |
| 172 | GMRT J201916.6+371151 | 20:19:16.64 | +37:11:51.0 | 2.35 | 0.12 | 12.85 | 0.11 | ND | … |
| 173 | GMRT J201917.5+373553 | 20:19:17.51 | +37:35:53.9 | 9.41 | 0.17 | 9.13 | 0.06 | … | … |
| 174 | GMRT J201918.2+355025 | 20:19:18.25 | +35:50:25.1 | 18.46 | 0.23 | 41.69 | 0.12 | … | … |
| 175 | GMRT J201918.3+373828 | 20:19:18.35 | +37:38:28.6 | 23.21 | 0.16 | 25.67 | 0.07 | … | … |
| 176 | GMRT J201920.0+363750 | 20:19:20.04 | +36:37:50.5 | 20.59 | 0.22 | 30.44 | 0.10 | 16.9 | … |
| 177 | GMRT J201920.4+380314 | 20:19:20.48 | +38:03:14.7 | 3.03 | 0.17 | 3.04 | 0.06 | … | … |
| 178 | GMRT J201920.9+373504 | 20:19:20.95 | +37:35:04.2 | 2.16 | 0.17 | 4.02 | 0.08 | … | … |
| 179 | GMRT J201922.0+352227 | 20:19:22.09 | +35:22:27.0 | 2.17 | 0.18 | 2.39 | 0.06 | … | ND |
| 180 | GMRT J201925.9+354158 | 20:19:25.92 | +35:41:58.9 | 34.62 | 0.25 | 50.12 | 0.12 | … | … |
| 181 | GMRT J201926.9+381656 | 20:19:26.91 | +38:16:56.1 | 6.35 | 0.16 | 6.30 | 0.06 | … | … |
| 182 | GMRT J201928.1+362610 | 20:19:28.11 | +36:26:10.4 | 12.91 | 0.19 | 28.06 | 0.10 | 15.6 | … |
| 183 | GMRT J201930.6+375339 | 20:19:30.62 | +37:53:39.8 | 3.23 | 0.20 | 4.16 | 0.08 | … | … |
| 184 | GMRT J201931.8+372423 | 20:19:31.81 | +37:24:23.1 | 4.03 | 0.16 | 12.35 | 0.11 | … | … |
| 185 | GMRT J201932.3+372440 | 20:19:32.31 | +37:24:40.3 | 3.10 | 0.17 | 9.80 | 0.11 | … | ND |
| 186 | GMRT J201933.9+370440 | 20:19:33.95 | +37:04:40.2 | 34.03 | 0.14 | 56.00 | 0.07 | ND | … |
| 187 | GMRT J201940.6+350424 | 20:19:40.67 | +35:04:24.4 | 2.97 | 0.25 | 3.35 | 0.08 | … | … |
| 188 | GMRT J201941.2+361144 | 20:19:41.24 | +36:11:44.1 | 11.58 | 0.26 | 13.62 | 0.10 | … | … |
| 189 | GMRT J201943.2+372956 | 20:19:43.24 | +37:29:56.0 | 17.74 | 0.24 | 24.76 | 0.10 | … | … |
| 190 | GMRT J201943.7+353224 | 20:19:43.70 | +35:32:24.3 | 7.89 | 0.19 | 13.47 | 0.08 | … | … |
| 191 | GMRT J201943.9+371909 | 20:19:43.93 | +37:19:09.7 | 4.40 | 0.14 | 5.19 | 0.07 | … | … |
| 192 | GMRT J201945.4+351826 | 20:19:45.41 | +35:18:26.8 | 3.13 | 0.17 | 2.99 | 0.06 | … | … |
| 193 | GMRT J201947.4+370634 | 20:19:47.47 | +37:06:34.3 | 3.70 | 0.16 | 10.88 | 0.10 | ND | … |
| 194 | GMRT J201948.1+370645 | 20:19:48.12 | +37:06:45.6 | 6.85 | 0.16 | 17.08 | 0.11 | ND | ND |
| 195 | GMRT J201950.2+382949 | 20:19:50.22 | +38:29:49.5 | 16.78 | 0.19 | 19.26 | 0.07 | … | … |
| 196 | GMRT J201951.1+362936 | 20:19:51.13 | +36:29:36.3 | 34.80 | 0.25 | 53.50 | 0.12 | ND | … |
| 197 | GMRT J201952.4+354727 | 20:19:52.40 | +35:47:27.4 | 5.07 | 0.24 | 6.44 | 0.09 | … | … |
| 198 | GMRT J201953.8+350353 | 20:19:53.87 | +35:03:53.6 | 3.58 | 0.27 | 7.45 | 0.12 | … | … |
| 199 | GMRT J201955.3+371757 | 20:19:55.37 | +37:17:57.3 | 7.78 | 0.13 | 9.19 | 0.06 | ND | … |
| 200 | GMRT J201956.8+373914 | 20:19:56.84 | +37:39:14.3 | 3.51 | 0.16 | 2.94 | 0.05 | … | … |
| 201 | GMRT J201958.7+381427 | 20:19:58.78 | +38:14:27.4 | 2.58 | 0.15 | 2.36 | 0.05 | … | … |
| 202 | GMRT J201959.2+371833 | 20:19:59.25 | +37:18:33.0 | 4.93 | 0.15 | 10.18 | 0.09 | … | ND |
| 203 | GMRT J202000.5+365806 | 20:20:00.52 | +36:58:06.7 | 2.10 | 0.13 | 2.71 | 0.05 | ND | … |
| 204 | GMRT J202000.7+351809 | 20:20:00.74 | +35:18:09.7 | 17.71 | 0.22 | 69.92 | 0.20 | … | ND |
| 205 | GMRT J202000.9+351829 | 20:20:00.99 | +35:18:29.1 | 3.16 | 0.23 | 21.59 | 0.19 | … | … |
| 206 | GMRT J202001.5+351736 | 20:20:01.51 | +35:17:36.3 | 9.55 | 0.21 | 49.79 | 0.20 | … | … |
| 207 | GMRT J202003.7+375018 | 20:20:03.75 | +37:50:18.0 | 54.54 | 0.23 | 73.58 | 0.11 | … | … |
| 208 | GMRT J202003.9+373135 | 20:20:03.92 | +37:31:35.8 | 8.21 | 0.30 | 17.49 | 0.17 | … | … |
| 209 | GMRT J202007.5+352415 | 20:20:07.57 | +35:24:15.5 | 22.37 | 0.23 | 127.83 | 0.22 | … | … |
| 210 | GMRT J202008.0+374027 | 20:20:08.04 | +37:40:27.8 | 4.73 | 0.18 | 4.35 | 0.07 | … | … |
| 211 | GMRT J202008.4+370147 | 20:20:08.47 | +37:01:47.8 | 4.59 | 0.12 | 6.91 | 0.07 | ND | … |
| 212 | GMRT J202010.5+365749 | 20:20:10.56 | +36:57:49.3 | 2.68 | 0.14 | 2.63 | 0.05 | ND | … |
| 213 | GMRT J202011.1+362246 | 20:20:11.16 | +36:22:46.1 | 2.98 | 0.22 | 3.96 | 0.08 | … | … |
| 214 | GMRT J202011.6+354916 | 20:20:11.65 | +35:49:16.4 | 3.92 | 0.23 | 5.66 | 0.10 | … | ND |
| 215 | GMRT J202011.9+362335 | 20:20:11.97 | +36:23:35.7 | 12.46 | 0.22 | 22.50 | 0.11 | … | … |
| 216 | GMRT J202012.6+374016 | 20:20:12.67 | +37:40:16.2 | 2.94 | 0.18 | 3.61 | 0.07 | … | … |
| 217 | GMRT J202020.2+370059 | 20:20:20.22 | +37:00:59.7 | 1.65 | 0.12 | 1.69 | 0.04 | ND | … |
| 218 | GMRT J202020.6+382845 | 20:20:20.64 | +38:28:45.0 | 3.21 | 0.18 | 3.24 | 0.06 | … | … |
| 219 | GMRT J202022.0+352459 | 20:20:22.09 | +35:24:59.9 | 8.46 | 0.26 | 20.32 | 0.15 | … | … |
| 220 | GMRT J202022.1+372843 | 20:20:22.11 | +37:28:43.0 | 62.30 | 0.26 | 88.20 | 0.13 | … | … |
| 221 | GMRT J202026.0+360726 | 20:20:26.07 | +36:07:26.7 | 35.89 | 0.35 | 88.69 | 0.21 | … | ND |
| 222 | GMRT J202029.1+364212 | 20:20:29.10 | +36:42:12.5 | 3.60 | 0.20 | 5.08 | 0.08 | ND | … |
| 223 | GMRT J202029.6+355131 | 20:20:29.65 | +35:51:31.8 | 11.72 | 0.21 | 19.07 | 0.10 | … | … |
| 224 | GMRT J202029.8+353821 | 20:20:29.81 | +35:38:21.1 | 5.88 | 0.22 | 8.48 | 0.10 | … | … |
| 225 | GMRT J202033.0+363159 | 20:20:33.03 | +36:31:59.5 | 421.37 | 0.43 | 833.51 | 0.30 | ND | … |
| 226 | GMRT J202035.3+363130 | 20:20:35.32 | +36:31:30.2 | 5.65 | 0.44 | 8.35 | 0.16 | ND | ND |
| 227 | GMRT J202036.4+373634 | 20:20:36.43 | +37:36:34.9 | 8.22 | 0.17 | 10.24 | 0.10 | … | … |
| 228 | GMRT J202038.6+364721 | 20:20:38.65 | +36:47:21.1 | 4.63 | 0.18 | 8.42 | 0.08 | ND | … |
| 229 | GMRT J202039.6+352621 | 20:20:39.64 | +35:26:21.0 | 58.18 | 0.27 | 95.75 | 0.14 | … | … |
| 230 | GMRT J202040.8+362113 | 20:20:40.87 | +36:21:13.1 | 8.80 | 0.20 | 16.28 | 0.09 | … | … |
| 231 | GMRT J202043.9+381811 | 20:20:43.91 | +38:18:11.4 | 17.22 | 0.15 | 26.29 | 0.08 | … | … |
| 232 | GMRT J202044.8+354540 | 20:20:44.87 | +35:45:40.9 | 4.10 | 0.25 | 10.66 | 0.14 | … | … |
| 233 | GMRT J202046.7+362731 | 20:20:46.78 | +36:27:31.8 | 4.25 | 0.33 | 4.60 | 0.10 | ND | … |
| 234 | GMRT J202046.7+370650 | 20:20:46.79 | +37:06:50.0 | 20.31 | 0.17 | 27.76 | 0.08 | ND | … |
| 235 | GMRT J202047.6+351429 | 20:20:47.60 | +35:14:29.1 | 7.24 | 0.35 | 26.85 | 0.30 | … | … |
| 236 | GMRT J202047.8+353249 | 20:20:47.85 | +35:32:49.8 | 10.52 | 0.23 | 14.88 | 0.11 | … | … |
| 237 | GMRT J202048.3+380858 | 20:20:48.31 | +38:08:58.0 | 45.50 | 0.18 | 67.08 | 0.10 | … | … |
| 238 | GMRT J202054.3+371120 | 20:20:54.39 | +37:11:20.5 | 7.91 | 0.15 | 12.65 | 0.08 | ND | … |
| 239 | GMRT J202055.8+383625 | 20:20:55.89 | +38:36:25.1 | 37.89 | 0.35 | 49.79 | 0.16 | … | … |
| 240 | GMRT J202101.6+354028 | 20:21:01.66 | +35:40:28.7 | 3.75 | 0.19 | 4.20 | 0.07 | … | … |
| 241 | GMRT J202105.3+382326 | 20:21:05.39 | +38:23:26.0 | 6.71 | 0.19 | 6.92 | 0.06 | … | … |
| 242 | GMRT J202106.6+352441 | 20:21:06.69 | +35:24:41.3 | 10.14 | 0.26 | 17.39 | 0.14 | … | … |
| 243 | GMRT J202109.3+371446 | 20:21:09.34 | +37:14:46.1 | 3.49 | 0.19 | 4.40 | 0.06 | ND | … |
| 244 | GMRT J202116.6+362128 | 20:21:16.68 | +36:21:28.5 | 5.33 | 0.19 | 6.22 | 0.08 | … | … |
| 245 | GMRT J202120.1+362229 | 20:21:20.12 | +36:22:29.1 | 2.66 | 0.20 | 2.39 | 0.06 | … | … |
| 246 | GMRT J202120.2+352628 | 20:21:20.24 | +35:26:28.1 | 86.25 | 0.24 | 113.62 | 0.12 | … | … |
| 247 | GMRT J202121.7+355226 | 20:21:21.75 | +35:52:26.4 | 4.01 | 0.26 | 8.78 | 0.13 | … | … |
| 248 | GMRT J202126.9+382542 | 20:21:26.97 | +38:25:42.9 | 11.76 | 0.24 | 13.77 | 0.09 | … | … |
| 249 | GMRT J202128.6+354623 | 20:21:28.62 | +35:46:23.1 | 5.33 | 0.20 | 5.90 | 0.08 | … | … |
| 250 | GMRT J202131.0+355452 | 20:21:31.03 | +35:54:52.6 | 14.50 | 0.24 | 18.32 | 0.10 | … | … |
| 251 | GMRT J202131.1+354706 | 20:21:31.19 | +35:47:06.7 | 8.45 | 0.21 | 8.04 | 0.07 | … | … |
| 252 | GMRT J202131.2+354338 | 20:21:31.24 | +35:43:38.1 | 3.86 | 0.17 | 3.56 | 0.06 | … | … |
| 253 | GMRT J202133.8+355005 | 20:21:33.81 | +35:50:05.7 | 209.34 | 0.27 | 240.10 | 0.14 | … | … |
| 254 | GMRT J202135.6+370950 | 20:21:35.67 | +37:09:50.5 | 49.01 | 0.19 | 104.52 | 0.13 | ND | ND |
| 255 | GMRT J202136.0+382122 | 20:21:36.05 | +38:21:22.0 | 3.12 | 0.23 | 2.59 | 0.07 | … | … |
| 256 | GMRT J202136.2+380704 | 20:21:36.26 | +38:07:04.3 | 3.63 | 0.19 | 5.10 | 0.08 | … | … |
| 257 | GMRT J202136.7+381812 | 20:21:36.71 | +38:18:12.0 | 3.40 | 0.24 | 4.69 | 0.09 | … | … |
| 258 | GMRT J202138.4+373110 | 20:21:38.48 | +37:31:10.8 | 68.13 | 0.32 | 3090.77 | 0.90 | … | … |
| 259 | GMRT J202141.3+372557 | 20:21:41.36 | +37:25:57.6 | 54.13 | 0.53 | 2866.42 | 1.50 | … | … |
| 260 | GMRT J202143.3+353334 | 20:21:43.34 | +35:33:34.1 | 3.01 | 0.17 | 4.06 | 0.07 | … | … |
| 261 | GMRT J202147.7+363929 | 20:21:47.76 | +36:39:29.2 | 37.14 | 0.24 | 48.73 | 0.11 | ND | … |
| 262 | GMRT J202149.1+373301 | 20:21:49.13 | +37:33:01.6 | 6.15 | 0.30 | 11.48 | 0.18 | … | … |
| 263 | GMRT J202149.5+362526 | 20:21:49.55 | +36:25:26.9 | 8.66 | 0.21 | 9.71 | 0.08 | ND | … |
| 264 | GMRT J202149.6+364323 | 20:21:49.60 | +36:43:23.0 | 71.92 | 0.29 | 175.73 | 0.18 | ND | … |
| 265 | GMRT J202150.4+373014 | 20:21:50.40 | +37:30:14.2 | 9.00 | 0.32 | 48.84 | 0.40 | … | … |
| 266 | GMRT J202153.8+355622 | 20:21:53.84 | +35:56:22.7 | 18.53 | 0.23 | 27.50 | 0.11 | … | ND |
| 267 | GMRT J202154.4+354339 | 20:21:54.41 | +35:43:39.3 | 5.05 | 0.17 | 4.56 | 0.06 | … | … |
| 268 | GMRT J202154.6+374619 | 20:21:54.62 | +37:46:19.2 | 48.56 | 0.19 | 56.53 | 0.08 | … | … |
| 269 | GMRT J202158.0+370938 | 20:21:58.06 | +37:09:38.7 | 2.69 | 0.23 | 4.51 | 0.09 | … | … |
| 270 | GMRT J202158.4+380651 | 20:21:58.44 | +38:06:51.6 | 2.52 | 0.19 | 3.01 | 0.07 | … | … |
| 271 | GMRT J202158.6+354335 | 20:21:58.66 | +35:43:35.7 | 15.72 | 0.17 | 27.36 | 0.09 | … | … |
| 272 | GMRT J202201.3+361112 | 20:22:01.38 | +36:11:12.1 | 51.45 | 0.24 | 78.39 | 0.13 | … | … |
| 273 | GMRT J202207.8+373006 | 20:22:07.89 | +37:30:06.9 | 2.28 | 0.27 | 5.16 | 0.10 | … | … |
| 274 | GMRT J202209.9+352927 | 20:22:09.98 | +35:29:27.6 | 11.60 | 0.19 | 13.90 | 0.08 | … | … |
| 275 | GMRT J202210.7+380826 | 20:22:10.78 | +38:08:26.1 | 5.83 | 0.22 | 8.16 | 0.11 | … | … |
| 276 | GMRT J202213.2+355940 | 20:22:13.21 | +35:59:40.8 | 4.23 | 0.23 | 5.52 | 0.09 | … | … |
| 277 | GMRT J202214.1+370031 | 20:22:14.10 | +37:00:31.4 | 3.31 | 0.23 | 3.44 | 0.07 | … | … |
| 278 | GMRT J202216.7+373059 | 20:22:16.75 | +37:30:59.5 | 4.62 | 0.24 | 5.20 | 0.11 | … | … |
| 279 | GMRT J202218.7+365421 | 20:22:18.71 | +36:54:21.6 | 35.30 | 0.28 | 56.32 | 0.13 | … | … |
| 280 | GMRT J202218.8+362526 | 20:22:18.86 | +36:25:26.6 | 2.92 | 0.24 | 3.17 | 0.07 | … | … |
| 281 | GMRT J202220.5+374759 | 20:22:20.59 | +37:47:59.5 | 30.61 | 0.15 | 32.57 | 0.07 | … | … |
| 282 | GMRT J202225.1+363138 | 20:22:25.12 | +36:31:38.2 | 3.73 | 0.25 | 4.12 | 0.09 | … | … |
| 283 | GMRT J202225.8+355521 | 20:22:25.83 | +35:55:21.7 | 38.20 | 0.22 | 43.09 | 0.09 | … | … |
| 284 | GMRT J202230.0+370105 | 20:22:30.00 | +37:01:05.8 | 5.17 | 0.24 | 9.57 | 0.11 | … | … |
| 285 | GMRT J202231.6+375537 | 20:22:31.64 | +37:55:37.1 | 17.90 | 0.16 | 24.74 | 0.07 | … | … |
| 286 | GMRT J202235.5+351935 | 20:22:35.59 | +35:19:35.6 | 57.51 | 0.33 | 87.06 | 0.16 | … | … |
| 287 | GMRT J202236.1+351940 | 20:22:36.18 | +35:19:40.5 | 14.35 | 0.33 | 22.32 | 0.15 | … | … |
| 288 | GMRT J202242.1+380342 | 20:22:42.14 | +38:03:42.1 | 5.23 | 0.17 | 5.70 | 0.06 | … | … |
| 289 | GMRT J202242.7+353445 | 20:22:42.73 | +35:34:45.3 | 3.44 | 0.18 | 3.43 | 0.06 | … | … |
| 290 | GMRT J202242.9+373227 | 20:22:42.91 | +37:32:27.9 | 3.72 | 0.23 | 4.11 | 0.08 | … | … |
| 291 | GMRT J202248.9+373927 | 20:22:48.94 | +37:39:27.7 | 8.79 | 0.17 | 8.70 | 0.06 | … | … |
| 292 | GMRT J202251.6+353326 | 20:22:51.67 | +35:33:26.4 | 5.02 | 0.18 | 4.89 | 0.06 | … | … |
| 293 | GMRT J202258.2+361625 | 20:22:58.28 | +36:16:25.2 | 7.58 | 0.19 | 12.72 | 0.11 | … | … |
| 294 | GMRT J202258.5+361147 | 20:22:58.50 | +36:11:47.2 | 4.62 | 0.23 | 4.86 | 0.08 | … | … |
| 295 | GMRT J202259.9+375020 | 20:22:59.95 | +37:50:20.4 | 24.07 | 0.17 | 24.95 | 0.07 | … | … |
| 296 | GMRT J202303.7+352129 | 20:23:03.73 | +35:21:29.3 | 99.10 | 0.37 | 145.95 | 0.18 | … | … |
| 297 | GMRT J202308.0+355829 | 20:23:08.00 | +35:58:29.5 | 4.90 | 0.35 | 5.98 | 0.12 | … | … |
| 298 | GMRT J202309.0+373641 | 20:23:09.09 | +37:36:41.1 | 4.14 | 0.17 | 4.15 | 0.07 | … | … |
| 299 | GMRT J202313.5+374833 | 20:23:13.57 | +37:48:33.5 | 95.36 | 0.20 | 133.27 | 0.10 | … | … |
| 300 | GMRT J202319.3+351811 | 20:23:19.35 | +35:18:11.5 | 26.57 | 0.46 | 38.88 | 0.20 | … | … |
| 301 | GMRT J202320.8+362834 | 20:23:20.83 | +36:28:34.3 | 6.87 | 0.20 | 18.72 | 0.15 | … | … |
| 302 | GMRT J202329.2+375111 | 20:23:29.29 | +37:51:11.3 | 4.45 | 0.16 | 4.98 | 0.06 | … | … |
| 303 | GMRT J202329.9+371530 | 20:23:29.96 | +37:15:30.1 | 9.06 | 0.19 | 10.03 | 0.09 | … | … |
| 304 | GMRT J202339.9+355100 | 20:23:39.94 | +35:51:00.2 | 55.50 | 0.33 | 79.15 | 0.15 | … | … |
| 305 | GMRT J202345.3+372731 | 20:23:45.35 | +37:27:31.8 | 13.46 | 0.23 | 19.61 | 0.10 | … | … |
| 306 | GMRT J202347.8+373425 | 20:23:47.83 | +37:34:25.4 | 8.91 | 0.21 | 10.22 | 0.08 | … | … |
| 307 | GMRT J202351.4+375343 | 20:23:51.44 | +37:53:43.9 | 4.04 | 0.16 | 3.78 | 0.06 | … | … |
| 308 | GMRT J202355.0+373810 | 20:23:55.03 | +37:38:10.0 | 50.73 | 0.22 | 249.27 | 0.18 | … | … |
| 309 | GMRT J202403.3+360803 | 20:24:03.38 | +36:08:03.8 | 4.32 | 0.30 | 7.94 | 0.14 | … | … |
| 310 | GMRT J202404.2+380216 | 20:24:04.20 | +38:02:16.4 | 8.05 | 0.21 | 7.21 | 0.07 | … | … |
| 311 | GMRT J202404.2+374300 | 20:24:04.29 | +37:43:00.6 | 30.30 | 0.18 | 93.28 | 0.13 | … | … |
| 312 | GMRT J202407.1+360032 | 20:24:07.17 | +36:00:32.7 | 9.59 | 0.42 | 12.26 | 0.18 | … | … |
| 313 | GMRT J202415.5+360821 | 20:24:15.57 | +36:08:21.1 | 6.93 | 0.30 | 8.63 | 0.13 | … | … |
| 314 | GMRT J202420.6+355043 | 20:24:20.60 | +35:50:43.6 | 3.76 | 0.34 | 7.61 | 0.13 | … | … |
| 315 | GMRT J202422.3+365518 | 20:24:22.37 | +36:55:18.0 | 45.56 | 0.27 | 62.30 | 0.12 | … | … |
| 316 | GMRT J202422.6+355354 | 20:24:22.60 | +35:53:54.8 | 9.21 | 0.32 | 9.06 | 0.11 | … | … |
| 317 | GMRT J202424.6+373354 | 20:24:24.67 | +37:33:54.3 | 10.12 | 0.20 | 13.81 | 0.10 | … | … |
| 318 | GMRT J202430.6+364604 | 20:24:30.60 | +36:46:04.1 | 20.59 | 0.25 | 50.61 | 0.16 | … | … |
| 319 | GMRT J202431.0+365139 | 20:24:31.00 | +36:51:39.0 | 10.79 | 0.26 | 16.51 | 0.11 | … | … |
| 320 | GMRT J202431.7+363020 | 20:24:31.73 | +36:30:20.0 | 19.59 | 0.36 | 35.91 | 0.21 | … | … |
| 321 | GMRT J202432.0+372355 | 20:24:32.00 | +37:23:55.0 | 11.04 | 0.24 | 15.61 | 0.11 | … | … |
| 322 | GMRT J202432.0+363012 | 20:24:32.03 | +36:30:12.1 | 74.10 | 0.36 | 121.98 | 0.20 | … | … |
| 323 | GMRT J202446.1+370236 | 20:24:46.12 | +37:02:36.2 | 4.04 | 0.28 | 8.03 | 0.13 | … | … |
| 324 | GMRT J202450.0+361706 | 20:24:50.02 | +36:17:06.2 | 4.76 | 0.39 | 4.42 | 0.11 | … | … |
| 325 | GMRT J202450.7+370300 | 20:24:50.74 | +37:03:00.8 | 16.17 | 0.28 | 40.96 | 0.17 | … | … |
| 326 | GMRT J202454.1+361501 | 20:24:54.13 | +36:15:01.6 | 20.39 | 0.41 | 40.35 | 0.20 | … | … |
| 327 | GMRT J202455.3+375744 | 20:24:55.33 | +37:57:44.8 | 10.70 | 0.33 | 12.62 | 0.11 | … | … |
| 328 | GMRT J202504.3+370312 | 20:25:04.35 | +37:03:12.4 | 4.08 | 0.27 | 6.65 | 0.12 | … | … |
| 329 | GMRT J202505.1+370256 | 20:25:05.18 | +37:02:56.0 | 4.02 | 0.26 | 5.06 | 0.10 | … | … |
| 330 | GMRT J202508.4+362535 | 20:25:08.42 | +36:25:35.4 | 8.16 | 0.46 | 10.36 | 0.17 | … | … |
| 331 | GMRT J202509.4+353642 | 20:25:09.45 | +35:36:42.5 | 8.96 | 0.52 | 47.92 | 0.50 | … | … |
| 332 | GMRT J202515.9+370916 | 20:25:15.91 | +37:09:16.8 | 22.68 | 0.28 | 25.20 | 0.11 | … | … |
| 333 | GMRT J202523.5+372901 | 20:25:23.59 | +37:29:01.5 | 43.45 | 0.18 | 48.67 | 0.08 | … | … |
| 334 | GMRT J202523.6+372314 | 20:25:23.61 | +37:23:14.8 | 34.09 | 0.17 | 1033.75 | 0.50 | … | … |
| 335 | GMRT J202532.1+354459 | 20:25:32.14 | +35:44:59.8 | 4.59 | 0.32 | 5.35 | 0.12 | … | … |
| 336 | GMRT J202538.5+372024 | 20:25:38.50 | +37:20:24.9 | 2.69 | 0.14 | 2.88 | 0.06 | … | … |
| 337 | GMRT J202542.3+374942 | 20:25:42.36 | +37:49:42.4 | 5.18 | 0.42 | 6.55 | 0.13 | … | … |
| 338 | GMRT J202543.5+370607 | 20:25:43.57 | +37:06:07.2 | 6.42 | 0.26 | 6.32 | 0.08 | … | … |
| 339 | GMRT J202543.6+374917 | 20:25:43.67 | +37:49:17.5 | 10.20 | 0.40 | 15.01 | 0.15 | … | … |
| 340 | GMRT J202555.7+361553 | 20:25:55.73 | +36:15:53.9 | 6.17 | 0.42 | 7.03 | 0.16 | … | … |
| 341 | GMRT J202556.3+365011 | 20:25:56.38 | +36:50:11.4 | 5.15 | 0.21 | 4.42 | 0.06 | … | … |
| 342 | GMRT J202603.5+363628 | 20:26:03.59 | +36:36:28.7 | 24.43 | 0.26 | 25.51 | 0.10 | … | … |
| 343 | GMRT J202605.9+361108 | 20:26:05.97 | +36:11:08.3 | 10.66 | 0.43 | 10.25 | 0.12 | … | … |
| 344 | GMRT J202608.3+360111 | 20:26:08.38 | +36:01:11.1 | 7.62 | 0.32 | 12.67 | 0.15 | … | … |
| 345 | GMRT J202611.1+372845 | 20:26:11.14 | +37:28:45.6 | 7.54 | 0.16 | 10.10 | 0.10 | … | … |
| 346 | GMRT J202616.7+360053 | 20:26:16.72 | +36:00:53.2 | 5.42 | 0.34 | 7.58 | 0.14 | … | … |
| 347 | GMRT J202625.8+365929 | 20:26:25.85 | +36:59:29.6 | 6.84 | 0.27 | 10.33 | 0.13 | … | ND |
| 348 | GMRT J202625.9+365319 | 20:26:25.90 | +36:53:19.1 | 5.64 | 0.25 | 5.82 | 0.11 | … | |
| 349 | GMRT J202626.8+363712 | 20:26:26.87 | +36:37:12.6 | 5.32 | 0.25 | 5.82 | 0.09 | … | … |
| 350 | GMRT J202629.6+370513 | 20:26:29.65 | +37:05:13.6 | 5.56 | 0.29 | 5.94 | 0.09 | … | … |
| 351 | GMRT J202632.8+371147 | 20:26:32.80 | +37:11:47.6 | 2.54 | 0.20 | 2.52 | 0.06 | … | … |
| 352 | GMRT J202638.4+370730 | 20:26:38.42 | +37:07:30.1 | 9.79 | 0.24 | 6.07 | 0.08 | … | … |
| 353 | GMRT J202638.8+370728 | 20:26:38.84 | +37:07:28.1 | 16.74 | 0.30 | 41.84 | 0.20 | … | … |
| 354 | GMRT J202645.0+370022 | 20:26:45.04 | +37:00:22.1 | 42.16 | 0.32 | 57.57 | 0.14 | … | … |
| 355 | GMRT J202647.2+370613 | 20:26:47.23 | +37:06:13.3 | 4.88 | 0.32 | 9.50 | 0.16 | … | … |
| 356 | GMRT J202703.3+374853 | 20:27:03.33 | +37:48:53.5 | 70.63 | 0.48 | 99.53 | 0.21 | … | … |
| 357 | GMRT J202712.4+365818 | 20:27:12.44 | +36:58:18.8 | 8.85 | 0.48 | 10.46 | 0.19 | … | … |
| 358 | GMRT J202724.8+371042 | 20:27:24.88 | +37:10:42.6 | 48.80 | 0.38 | 89.73 | 0.20 | … | ND |
| 359 | GMRT J202727.3+372258 | 20:27:27.32 | +37:22:58.4 | 72.93 | 0.50 | 5013.70 | 1.40 | … | ND |
| 360 | GMRT J202730.3+371523 | 20:27:30.31 | +37:15:23.2 | 10.13 | 0.32 | 14.10 | 0.17 | … | … |
| 361 | GMRT J202733.3+373116 | 20:27:33.32 | +37:31:16.7 | 4.32 | 0.30 | 25.96 | 0.30 | … | … |
| 362 | GMRT J202735.0+373124 | 20:27:35.00 | +37:31:24.6 | 5.64 | 0.31 | 13.32 | 0.18 | … | … |