Hadronic Models for the Extra Spectral Component in the short GRB 090510
Abstract
A short gamma-ray burst GRB 090510 detected by Fermi shows an extra spectral component between 10 MeV and 30 GeV, an addition to a more usual low-energy ( MeV) Band component. In general, such an extra component could originate from accelerated protons. In particular, inverse Compton emission from secondary electron-positron pairs and proton synchrotron emission are competitive models for reproducing the hard spectrum of the extra component in GRB 090510. Here, using Monte Carlo simulations, we test the hadronic scenarios against the observed properties. To reproduce the extra component around GeV with these models, the proton injection isotropic-equivalent luminosity is required to be larger than ergs. Such large proton luminosities are a challenge for the hadronic models.
1 Introduction
The very high bulk Lorentz factor and high magnetic field strengths in outflows of gamma-ray burst (GRB) make GRBs potential sources of ultra-high-energy cosmic rays (UHECRs; Waxman, 1995; Vietri, 1995; Gialis & Pelletier, 2004). Recent time-resolved detections of GeV photons with Fermi/LAT from GRB 080916C and GRB 090510 (Abdo et al., 2009a, b) reveal that the minimum Lorentz factor , required to make the sources optically thin for such GeV photons, should be . While those high values of are favorable to accelerate protons to very high energies, it makes difficult to produce the photomeson-induced secondary photons and neutrinos frequently discussed by many authors (e.g., Rachen & Mészáros, 1998; Dermer, 2002; Asano, 2005; Dermer & Atoyan, 2006; Asano & Nagataki, 2006; Gupta & Zhang, 2007). This is because, given the variability timescale , photon luminosity, and spectrum, a higher bulk Lorentz factor decreases the photon number density as . The wide-band spectra (10 keV - GeV) of GRB 080916C are well fitted by a smooth Band function (Band et al., 1993), and in that case the lack of evidence for an extra spectral component is consistent with a low efficiency of photomeson production due to high .
However, from 0.5 s to 1.0 s after the trigger time (), the short GRB 090510 does exhibit a very significant () spectral deviation to the standard Band function. With the parameters of the standard Band function at MeV, , and , the excess is adequately fit with an additional power law of index . The power law extends from the lowest energy in Fermi/GBM (i.e., 8 keV), to at least 31 GeV in Fermi/LAT. The extra-component counts for about 37% of the total fluence and the powerlaw dominates the standard integrated-Band spectrum up to a few tens of keV and above 10 MeV. This additional component is the most intense from s to s. There is no clear evidence of existence of an extra component at times after s, however there is not enough statistical significance in the data to fully reject this hypothesis. The onset of the main emission above 100 MeV is delayed about 200 ms compared to the main spike from 8 keV up to few MeV. No lags have been found below 1 MeV with respect to the lowest energy band 8-40keV over the whole light curve ( to s). Above 1 MeV, lags increase progressively to reach 248 ms and remaining constant after 40 MeV. This extra component could be of leptonic origin, e.g., external Compton emission from internal shocks (e.g., Toma et al., 2009) or synchrotron self-Compton emission from the reverse shock or forward shock in the early afterglow phase (Ghirlanda et al., 2009) as discussed for GRB 941017 (Granot & Guetta, 2003; Pe’er & Waxman, 2004).
In this Letter we consider an alternative possibility, namely hadronic models, in particular photomeson cascade and proton synchrotron models (Vietri, 1997; Totani, 1998; Razzaque et al., 2009), for representing the extra spectral component of GRB 090510, which is present only in the prompt emission between and s. Although the cascade processes initiated by // are complicated, the resultant photon signatures of proton cascades mostly appear as synchrotron or inverse Compton emission from secondary electron-positron pairs produced via . In such pair cascade processes the effective injection index of secondary pairs tends to be about (e,g, Coppi, 1992) so that the synchrotron radiation from secondary pairs yields a flat spectrum in an plot, while the power law index of the extra component in GRB 090510 is . However, the inverse Compton component from secondary pairs can harden the spectrum as Asano et al. (2009) showed. Using the numerical code of Monte Carlo techniques in Asano et al. (2009) (see also Asano & Inoue, 2007), we constrain the hadronic models in this Letter.
2 Model and Methods
In order to constrain hadronic models for the observed extra spectral component of GRB 090510, we simulate the photon emission with photomeson-induced cascade processes from ultrarelativistic outflows of bulk Lorentz factor . The numerical code is the same as that in Asano et al. (2009), which was matured via a series of GRB studies (Asano, 2005; Asano & Nagataki, 2006; Asano & Inoue, 2007), so that we omit the detailed explanation for the code. As an optimistic case, which would lead to hadronic cascades, we assume that protons are injected with a power law energy distribution above 10 GeV in the outflow rest frame at radii from the central engine. The acceleration timescale of a proton is parameterized as , where is the Larmor radius of the proton. The maximum proton energy is determined by equating the acceleration timescale and the expansion timescale of the outflow or the cooling timescale due to proton synchrotron or photomeson production.
We assume that the main low-energy component, which is fitted by a Band function, is of leptonic origin Abdo et al. (2009b), which we do not discuss further. The photon energy distribution in the outflow rest frame is estimated from the time-averaged Band parameters from s to s ( MeV, , , and the isotropic-equivalent luminosity ergs at ) and the numerically obtained extra component originating from protons. The energy distributions of photons and particles are simulated iteratively until they converge to a self-consistent spectrum. On a timescale comparable to , the photon density and the magnetic fields, etc., can be approximately taken as constant, and we can neglect the emission from particles beyond this timescale after their injection, because the photon density and the magnetic field decline. The physical processes taken into account are 1) photon emission processes of synchrotron and Klein-Nishina regime Compton scattering for electrons/positrons, protons, pions, and muons, 2) synchrotron self-absorption for electrons/positrons, 3) pair production, 4) photomeson production from protons and neutrons, 5) Bethe-Heitler pair production (), and 6) decays of pions, and muons. The code can also output the spectra of neutrinos from pions and muons.
There are five model parameters: the proton acceleration parameter , the proton injection radius , the bulk Lorentz factor , the energy density of the magnetic field , and the injection luminosity of accelerated protons . The last two parameters are normalized by the photon energy density of the Band component or itself as and .
3 Hadronic Emission
Within the time interval between s and s, two high-energy photons of 3.4 GeV and 31 GeV were detected. These photons belong to the extra component of the prompt emission, whose spectrum is well fitted by a power law of , on which we concentrate here. (There is in addition a tail extending to s, attributable to an afterglow, which we do not discuss here.) Since the photon statistics above GeV are not enough, we do not attempt to carry out a detailed fitting of the spectrum. Alternatively, we search for parameter sets that reproduce a comparable fluence of the extra component to that of the Band component.
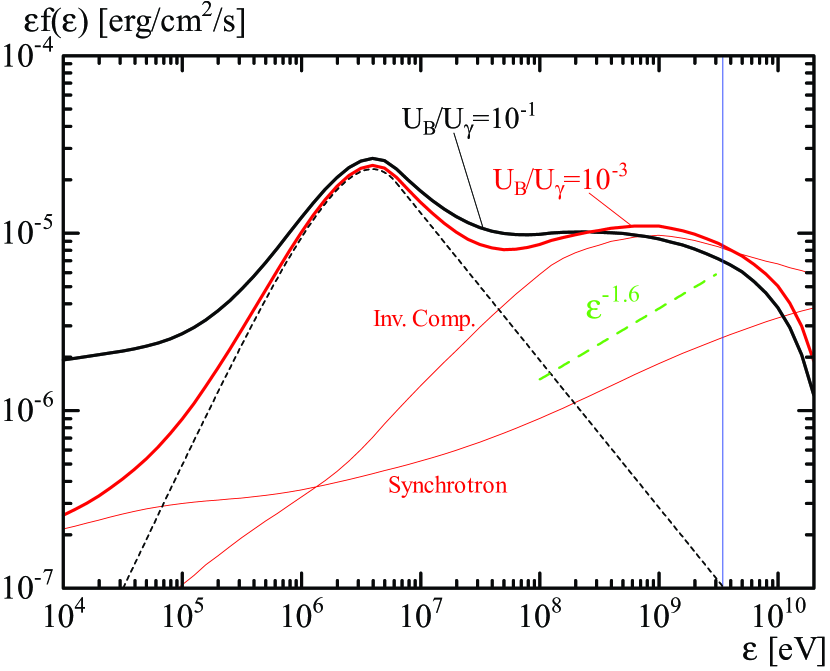
First, we consider photomeson cascades, for the most extreme case . Fig. 1 shows two examples of photon spectra, in which the flux of the hadronic component at 3.4 GeV is comparable to the Band component. The model spectrum with seems consistent with the observed spectrum. The second peak at GeV is mainly due to pair absorption. The assumed value of is 200, which is quite large, so that the proton injection luminosity should be larger than ergs in this case. On the other hand, if we adopt a stronger magnetic field such as , the required amount of protons can be suppressed to a lower value of ( ergs). However, the dominance of synchrotron radiation from secondary pairs makes in this case the spectrum too soft below about 100 keV. Such a large deviation from the Band function around 10 keV is not seen in GRB 090510.
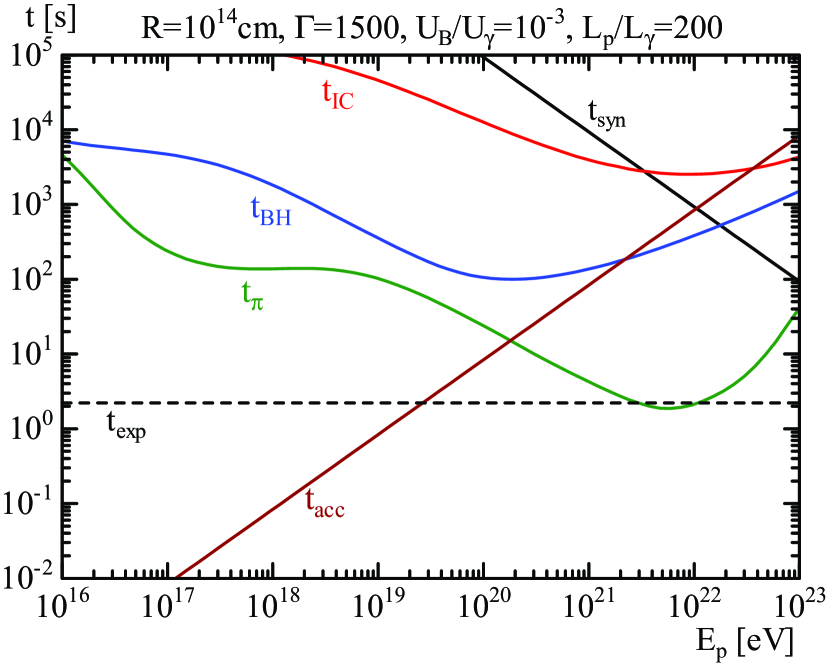
The various timescales for the case of are plotted in Fig. 2. Apparently, the maximum energy of protons is determined by the condition . The low efficiency of hadronic cascade is attributed to the much longer cooling timescale due to photopion production than the expansion timescale of the outflow even at . The target photons for pion production below eV are the Band component. Above this energy, protons interact with UV-photons below the observed energy range of Fermi, where secondary synchrotron photons dominate. In our simulation the synchrotron self-absorption makes a spectral peak of plot at eV, which corresponds to the typical target photon energy for protons of eV, where becomes minimum. In spite of the enhancement of the pion production efficiency due to secondary photons, we still need a large proton luminosity. The curves in Fig. 2 can be shifted by changes of , , and . The increase of due to the decrease of with increasing magnetic fields leads to a higher efficiency of photomeson production. As shown in Fig. 1, however, we need to decrease the magnetic field to values as low as in order to harden the spectrum, since the Klein-Nishina effect is crucial.
Let us consider protons that interact with photons of . The cooling timescale for such protons behaves as , where the photon density . If we adopt a smaller value of , the pion production efficiency would be improved as . However, we should note that there is a lower limit to , which is required to make the source optically thin to GeV photons. Given the photon luminosity and spectral shape, this minimum Lorentz factor can be estimated as shown in the online supporting materials in Abdo et al. (2009a, b). The adopted value in Fig. 1 is close to the lower limit for cm. Even if we take a larger , the lower limit of the Lorentz factor does not decrease drastically (since , ). Although a smaller cm and a slightly larger can reduce the required amount of protons, the typical variability timescale in Fig. 1 ( cm and ) is already as small as ms. The poor photon statistics in GRB 090510 cannot constrain well the variability timescale, but the required proton energy may remain very large even for ms (note that in Abdo et al. (2009b) the variability timescales are estimated as ms, which are adopted to obtain the minimum Lorentz factor).
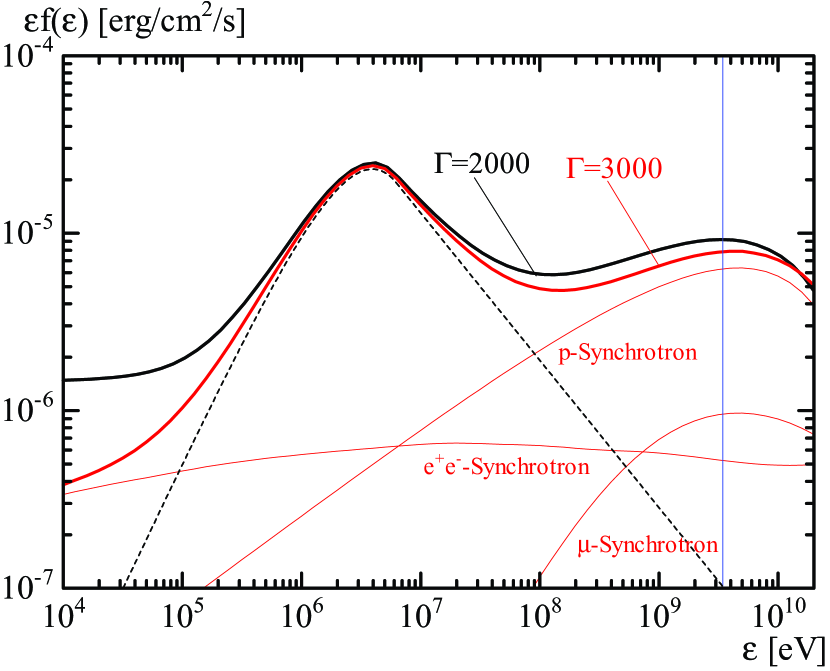
An alternative hadronic scenario is a proton synchrotron model with very strong magnetic field. In this model, we need to avoid the pair cascades initiated by photomeson production, because the synchrotron spectrum from secondary pairs is too soft as discussed above. Therefore, we adopt to suppress . Examples for this model in Fig. 3 require the same order of magnitude ratios of as the pair cascade model. Considering the typical energy of protons emitting GeV photons, , the efficiency of proton synchrotron can be enhanced by a decrease of , according to . However, even for in Fig. 3, the pair cascades due to photomeson production cannot be neglected in the low-energy regions. The photon spectrum below 100 keV becomes too soft again for owing to the pair cascade. If we can neglect the observed variability timescale ms, it seems that a much larger and slightly smaller could decrease the required luminosity of protons. Under the conservative assumption of , however, a decrease of leads to a low efficiency of proton synchrotron due to the low . Considering the dependence of , we cannot avoid the requirement of a large proton luminosity even in the proton synchrotron scenario.
In the above, we have sought to reproduce the flux at 3.4 GeV by photons originating from protons. To extend the extra component as far as 31 GeV, a much larger is required, which would decrease the efficiency of photopion production. (for example, is required to obtain sufficient flux at 31 GeV for , , , and cm). Thus, we need an isotropic equivalent proton luminosity in excess of ergs in order to explain the photon flux and hard spectrum of the extra component, independently of the model details.
Another aspect of this burst is the reported -0.2 s delayed onset of the LAT high-energy photons relative to the GBM trigger. This delayed onset is a common property of other Fermi/LAT GRBs (Abdo et al., 2009a, etc.). Within the hadronic models, this delay could in principle be attributed to the acceleration timescale of protons, which is limited by the shell expansion timescale. This would suggest that the timescale of the delayed onset is comparable to the variability timescale, which may be comparable to or shorter than 10 ms. However, since the cooling timescale is much longer than the shell expansion timescale in our models (which is equivalent to the requirement ), we cannot deduce the delay timescale in this manner from the models considered here. In order to explain the delayed onset, we would need additional assumptions, an example of which might be spatially different origins of the Band and the extra component. However, with only two photons above 1 GeV, it is premature to engage here in such additional modeling.
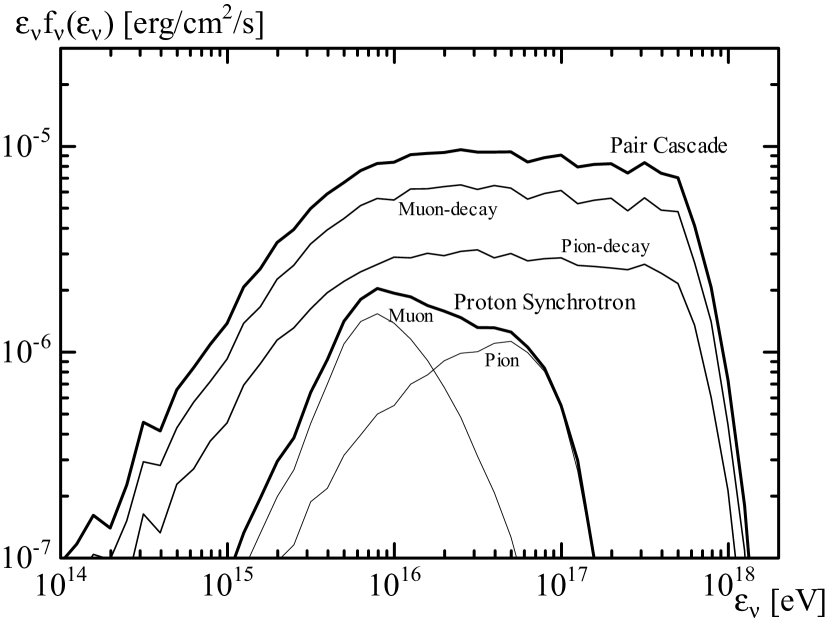
In Fig. 4, we have also plotted the neutrino spectra (sum over all species) obtained from the model for in Fig. 1 (photopion-induced pair cascade model) and for in Fig. 3 (proton synchrotron model). For the pair cascade case, the very large proton luminosity leads to a neutrino luminosity comparable to the photon luminosity. The neutrino number flux is estimated as for each energy decade from to eV. Considering the effective area of the IceCube detector (Abbasi et al., 2009), we may not expect neutrino detections from this burst (the upper limit of the muon neutrino fluence for the “naked-eye” GRB 080319B by the IceCube detector is for eV). For the proton synchrotron model, the strong magnetic field efficiently cools pions and muons via synchrotron radiation so that the highest neutrino energies are suppressed, compared to the pair cascade model.
4 Conclusions
The detection of GeV photons from the short GRB 090510 requires a very large Lorentz factor, which leads to a low efficiency of photomeson production. Adopting the observed spectrum, we have simulated the photon emission due to accelerated protons to produce the extra spectral component around GeV. We have shown that this mechanism is capable of reproducing the flux in this extra component, during the approximate time interval between the trigger and s when this component is present. However, because of the low efficiency of photopion production, a very large proton isotropic-equivalent luminosity of ergs is required to produce GeV photons from electron-positron pairs. While we have assumed a power-law proton spectrum with an exponential cutoff for simplicity, the energy range, in which photopion production predominantly contributes to the secondary photon emissions, is narrow as shown in Fig. 2. The required proton luminosity we suggest here practically represents the required normalization of the proton flux at this energy range ( eV for the example in Fig. 2). Even if we change the proton injection spectrum, the effect on the photon spectrum would be negligible as long as the proton amount in that energy range is the same. Fixing the proton amount in this energy range, of course, steeper proton spectra enhance the total injection luminosity. In principle, a lower proton luminosity associated with a stronger magnetic field could reproduce the flux around GeV, provided the spectral modifications below 100 keV due to secondary pairs are weak. This remains to be investigated, but in the absence of some physical mechanism to suppress the emission of low-energy photons from secondary pairs, the spectrum predicted from such a strong field model would contradict the observations. Also for the proton synchrotron model with discussed above, the required proton isotropic-equivalent luminosity is ergs.
Such “proton-dominated” GRB models (e.g., Asano et al., 2009) are favorable for scenarios of ultra-high-energy cosmic-ray generation by GRBs, but as in this case too, they require very high isotropic-equivalent proton energies erg/s, which are challenging for such hadronic models. However, we should note that even the photon isotropic equivalent luminosities of quite a few bursts have been found to be of that order of magnitude (e.g., GRB 080913, etc.), so that the hadronic interpretation of the extra GeV component does not exceed such observed photon luminosities in other bursts. Jet collimation effects can significantly alleviate such energetic problems. Unfortunately, in the case of GRB 090510 the afterglow is brief, and there is so far no evidence for or against any jet collimation. Adopting as the collimation factor, the required energy may strain a conventional NS-BH merger model, but is not huge. The strain would be less on a core collapse model, but this model has not solved the short-duration issue yet. Therefore, the extreme energetics of such hadronic outflow models remain a substantial challenge.
In order to distinguish models of internal shock origin including hadronic models and afterglow origin (Ghirlanda et al., 2009) for GeV photons, better photon statistics above GeV are desirable. Although the correlation function for this burst shows a clear correlation between GBM (250 keV-3MeV) and LAT ( GeV) light curves (Abdo et al., 2009b), the typical photon number above GeV in a pulse is a few. Closer GRBs than GRB 090510 at least by a factor of 3, from which we expect more than 10 photons in a pulse, may strengthen the correlation, but we should note that the GRB rate may decrease with increasing photon statistics (the present detection rate with Fermi LAT is GRBs ).
References
- Abbasi et al. (2009) Abbasi, R. et al. 2009, ApJ, 701, 1721
- Abdo et al. (2009a) Abdo, A. A. et al., 2009a, Science, 323, 1688
- Abdo et al. (2009b) Abdo, A. A. et al., 2009b, Accepted for Nature, arXiv:0908.1832
- Asano (2005) Asano, K. 2005, ApJ, 623, 967
- Asano & Inoue (2007) Asano, K. and Inoue, S. 2007, ApJ, 671, 645
- Asano et al. (2009) Asano, K., Inoue, S., & Mészáros, P. 2009, ApJ, 699, 953
- Asano & Nagataki (2006) Asano, K., & Nagataki, S. 2006, ApJ, 640, L9
- Band et al. (1993) Band, D. et al. 1993, ApJ, 413, 281
- Coppi (1992) Coppi, P. S. 1992, MNRAS, 258, 657
- Dermer (2002) Dermer, C. D. 2002, ApJ, 574, 65
- Dermer & Atoyan (2006) Dermer, C. D., & Atoyan, A. 2006, New J. of Phys. 8, 122
- Ghirlanda et al. (2009) Ghirlanda, G., Ghisellini, G. & Nava, L. 2009, arXiv:0909.0016
- Granot & Guetta (2003) Granot, J., & Guetta, D., 2003, ApJ, 598, L11
- Gupta & Zhang (2007) Gupta, N., & Zhang, B., 2007, MNRAS, 380, 78
- Pe’er & Waxman (2004) Pe’er, A., & Waxman, E., 2004, ApJ, 603, L1
- Rachen & Mészáros (1998) Rachen, J. P., & Mészáros, P. 1998, Phys. Rev. D, 58, 123005
- Razzaque et al. (2009) Razzaque, S., Dermer, C. D., & Finke, J. D. 2009, arXiv:0908.0513
- Toma et al. (2009) Toma, K., Wu, X.-F. & Mészáros, P. 2009, arXiv:0905.1697
- Totani (1998) Totani, T. 1998, ApJ, 509, L81
- Vietri (1995) Vietri, M. 1995, ApJ, 453, 883
- Vietri (1997) Vietri, M. 1997, Phys. Rev. Lett., 78, 4328
- Waxman (1995) Waxman, E. 1995, Phys. Rev. Lett., 75, 386
- Gialis & Pelletier (2004) Gialis, D & Pelletier, G, 2004, A&A, 425, 395G