The Effects of the Ionizing Radiation Background on Galaxy Evolution
Abstract
We find that the amount and nature of the assumed ionizing background can strongly affect galaxy formation and evolution. Galaxy evolution simulations typically incorporate an ultraviolet background which falls off rapidly above ; e.g., that of Haardt & Madau (1996). However, this decline may be too steep to fit the WMAP constraints on electron scattering optical depth or observations of intermediate redshift () Ly-alpha forest transmission. As an alternative, we present simulations of the cosmological formation of individual galaxies with UV backgrounds that decline more slowly at high redshift: both a simple intensity rescaling and the background recently derived by Faucher-Giguère et al. (2009), which softens the spectrum at higher redshifts. We also test an approximation of the X-ray background with a similar z-dependence. We find for the test galaxies that an increase in either the intensity or hardness of ionizing radiation generically pushes star formation towards lower redshifts: although overall star formation in the simulation boxes is reduced by , the galaxies show a factor of increase in the fraction of stars within a 30 kpc radius that are formed after . Other effects include late gas inflows enhanced up to 30 times, stellar half-mass radii decreased by up to 30%, central velocity dispersions increased up to 40%, and a strong reduction in substructure. The magnitude of the effects depends on the environmental/accretion properties of the particular galaxy.
Subject headings:
galaxies: elliptical and lenticular — Galaxy: formation — methods: numerical1. Introduction
The importance of the ionizing background on the gas dynamics and hence the star-formation history of galaxies has long been recognized (Rees, 1986; Efstathiou, 1992), and studied both numerically (e.g. Gnedin, 2000) and semianalytically (e.g. Benson et al., 2002). (In this paper we take “ionizing background” to refer to both the heating and H/He ionization effects of the 13.6 eV - 100 keV portion of the external radiation field experienced by galaxies at various epochs; i.e., the energies which can ionize H and other species but have a large enough cross-section to significantly affect the gas properties.) However, although the hydrodynamic simulation of galaxies has become something of a cottage industry in recent years (see Mayer et al. 2008 for a review with special focus on disk galaxies), relatively little attention has been paid to the form of ionizing background which is used. The default option (seen recently in Governato et al. 2007 and Scannapieco et al. 2008, among others) is generally a version of the UV background of Haardt & Madau (1996). Those authors modeled the QSO background and the effects of reprocessing by Ly forest clouds. They fit the redshift dependence of the H photoionization rate with a generalized Gaussian of the form ; for their parameters (, , in the original paper), the intensity declines steeply above and the background is negligible beyond .
There is, however, a history of simulations using ionizing backgrounds with a less steep redshift dependence. Navarro & Steinmetz (1997) is one such example: they performed SPH particle simulations resampled from a larger P3M simulation, together with a UV background that was constant at high redshift. They found that the final amount of cooled gas was reduced by up to half, with late-accreted gas preferentially affected, compared to no background. Moreover, recent evidence such as the independent observations of the optical depth to electron scattering (WMAP: Dunkely et al., 2008) and the Lyman alpha Gunn-Peterson trough (SDSS: Chiu, Fan, & Ostriker, 2003) have put increasingly tight constraints on the reionization history of the universe. In particular, Faucher-Giguère et al. (2008) examine the Ly effective optical depth using 86 quasar spectra, and find an essentially flat ionization rate out to (see Fig. 1 and the discussion in §2.1 below); these authors have thus proposed a new UV background, described in Faucher-Giguère et al. (2009), which we investigate here. Dall’Aglio et al. (2009), using 1733 quasars from SDSS, similarly find a flat ionization rate for , albeit with a slightly different normalization. (Haardt & Madau (2001) themselves presented a UV background very similar to our New UV below, but that model has seemingly failed to gain widespread acceptance.)
Further, although the diffuse X-ray background is becoming increasingly well constrained, at least in the local universe (Gilli et al., 2007), and its unique role in heating the universe prior to full reionization has been established (Venkatesan et al., 2001; Ricotti, Ostriker & Gnedin, 2005), few recent simulations (Ricotti et al., 2008, for example) have incorporated this component. The hard X-ray background is largely produced by QSOs and lower-luminosity AGN. Combining the the total background at with the observed X-ray spectra of individual sources and the redshift dependence of AGN output permitted Sazonov, Ostriker, & Sunyaev (2004) to estimate the keV background as a function of redshift. This background has a Compton temperature of K due to the peak in around keV, which penetrates regions that are optically thick to UV (although many simulations, including ours, treat the UV as optically thin also) and can provide a considerable source of both ionization and heating. Indeed, Madau & Efstathiou (1999) found that including an X-ray background increases the equilibrium temperature of the IGM by %.
Finally, since the formation of massive ellipticals where star formation has been effectively quenched since is still not well understood and is the subject of ongoing studies (for a review see the introduction of Hopkins et al., 2008), a study to examine the extent to which results are sensitive to the assumed ionizing radiation background is warranted. (Naturally, further work could also be done with disk galaxies, Lyman-break populations at higher redshift and others.)
The paper is organized as follows. In §2, we describe the numerical methods and parameters of our simulations, in particular the ionizing radiation backgrounds which we apply, comprising a recent version of Haardt & Madau (1996), a new rescaled version of the UV background which falls off much more slowly at high redshift, this new UV background with an additional X-ray component, and the more realistic, recently calculated UV background of Faucher-Giguère et al. (2009). In §3 we describe the results obtained from those simulations, in particular the effects of the backgrounds on the gas properties, star formation and stellar dynamics. §4 is a discussion of the implications of these results when taken collectively, and §5 is conclusion.
2. Simulations and Backgrounds
2.1. Radiation Backgrounds
As a baseline, we use the Haardt & Madau (1996) UV background as used in e.g. Naab et al. (2007); we call this the “Old UV” model. To create an upper bound on high-z UV, we keep the same assumed spectral shape but set the intensity to decline as in physical units above the Haardt & Madau peak, which occurs at ; we call this the “New UV” model. For a more realistic case, we use the background calculated by Faucher-Giguère et al. (2009), which has a similar z-dependence of intensity but whose spectrum softens markedly for as the quasar contribution dies out; we call this “FG UV”. The H ionization rates of these three models are compared in Fig. 1, along with the data of Faucher-Giguère et al. (2008) mentioned above. It is apparent that New UV and FG UV provide a better fit to the observations than does Old UV, in particular at .
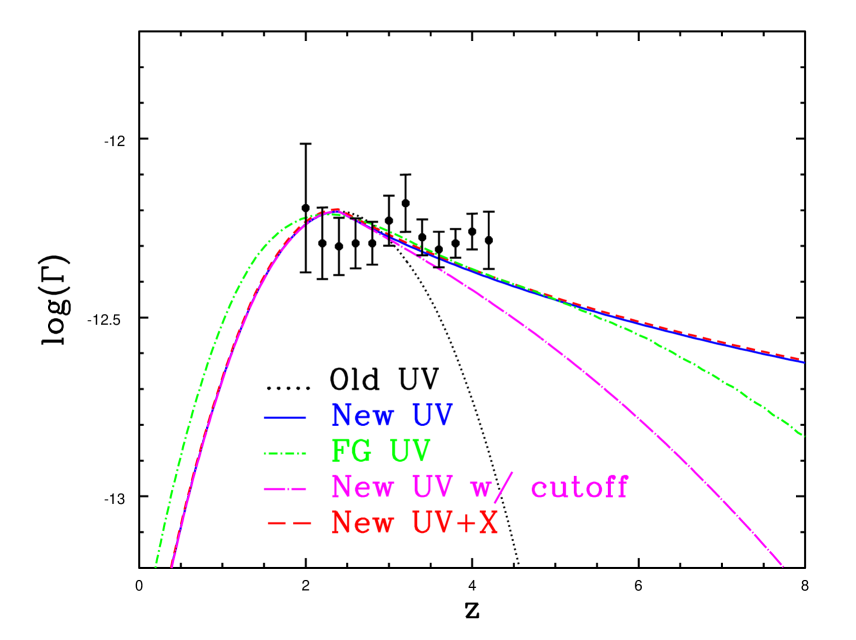
We also implement an X-ray background. This component uses the spectral shape given in Sazonov, Ostriker, & Sunyaev (2004), which represents an average quasar background considering both obscured and unobscured sources, and is strongly peaked around 30 keV in . The intensity normalization comes from Gilli et al. (2007), who modeled the AGN/QSO X-ray background using both deep pencil-beam pointings and shallow surveys. This is converted into heating and ionization rates using Cloudy (v07.02, last described in Ferland et al., 1998), which includes photo and Compton heating as well as secondary ionizations; the heating rates are then increased by a factor of 1.5 to better agree with the more recent model of Sazonov et al. (2005). Heating rates due to the UV and X-ray backgrounds are roughly equal for virialized gas at . The redshift dependence of this background is taken to be similar to New UV: intensity in physical units increases as to , and declines as thereafter (which is admittedly unrealistic; see below). We call this the “New UV+X” model. Notice in Fig. 1 that New UV+X has only a negligibly higher ionization rate than New UV: photons at keV energies and above deposit of their energy as heat in a highly ionized medium through electron-electron collisions (Shull & van Steenberg, 1985). The X-ray background also contributes at the level to the higher-energy HeII ionizations.
As an additional motivation for the revised ionizing background, we calculate a simple (homogeneous) semianalytic model of reionization using Cloudy. We create bins at successive epochs and apply the corresponding background (based on our z-dependence formulas) to gas of the corresponding (physical) density (i.e., the mean present density scaled as ); Cloudy outputs the electron-scattering and Gunn-Peterson optical depths ( and , respectively). For this method is replaced above redshift 10 by an analytic integral of the electron density (i.e., over the appropriate cosmology, with given by the balance of photoionization with collisional recombination); FG UV is specified to have zero intensity above , so in that case this integral is also. Note that removing the assumption of homogeneity and including the effects of clumpiness would in general decrease the effective recombination time (Madau, Haardt, & Rees, 1999), thus leading to a less-ionized universe and decreasing both and the epoch of reionization; this strengthens our conclusions below. Moreover this calculation is optically thin and in equilibrium, neither of which is the case for real reionization; however our Gadget code also assumes optical thinness and equilibrium (see below); so these results at least show what our simulations would produce for and and may be compared to each other, even though they are physically oversimplified and not directly comparable to observations or more detailed calculations.
The results are summarized in Table 1, and compared with WMAP-5 (Dunkely et al., 2008) and Chiu, Fan, & Ostriker (2003) (CFO). The Old UV model is significantly () low compared to WMAP in its prediction of , while New UV and New UV+X are extremely high (6.7 and , respectively). The evolution of the Gunn-Peterson (Ly) optical depth shows a qualitatively similar pattern, with the Old UV and New UV models comfortably bracketing the CFO results. FG UV agrees very well with both the WMAP and the CFO values.
The values of for the New models may seem at first too high to give physically relevant results in a simulation; however, these models exceed the WMAP value only due to contributions from , where it has been shown (Dijkstra et al., 2004) that the ionizing background has comparatively little effect. (Again, FG UV is specified to reach zero intensity at exactly , and matches the WMAP value very well.) Even though the gas may be highly ionized, its cooling time is still very short, so the entropy and hence the dynamics are not much affected (Thoul & Weinberg, 1996). Therefore we expect our results not to differ so dramatically from a WMAP-consistent model as the results would suggest. To test this hypothesis, we implement a high-z cutoff for the UV of the form , analogous to Haardt & Madau (1996) with parameters chosen to exactly match the WMAP-5 value of , and run a test simulation of Galaxy A to (this model is called “New UV with cutoff” in Table 1). We find this cutoff causes essentially no change in gas properties for all , and only a small (1.5%) increase in total stellar mass at (by contrast the Old UV simulation has 5% more stellar mass than New UV at this redshift). As we wish to ensure both that the new models represent a firm upper bound, and that any differences from Old UV are large enough to be easily discernible, we use the models without a cutoff in the rest of our analysis. These cutoff results also indicate that while New UV and FG UV have slightly different redshift dependences for their intensities, those differences will be negligible for our purposes compared to the differences in spectral shape of the two models. In other words, comparing the FG UV and New UV results will isolate the effect of the spectral shape of the UV background, while comparing New UV to Old UV will isolate the effect of its intensity (represented by e.g. H photoionization rate) as a function of z. In fact, our results will show that for most of the properties we study, increasing the intensity and increasing the spectral hardness give the same qualitative effects.
Furthermore, with regard to the New UV+X model, we don’t generically expect UV and X-ray backgrounds to have the same z-dependence; in fact, since the X-rays primarily come from quasars only rather than quasars and stars, and see a much smaller optical depth, a more sudden dropoff in the X-ray background intensity above the quasar luminosity function peak at might be expected. However, again we are looking for an upper bound and for any effects to be exaggerated for easy detection, and our overestimate is relatively modest: at , our New UV+X model gives a mean-density IGM temperature of K, 50% higher than the observationally-fit value of K (Zaldarriaga et al., 2001).
In sum, the FG UV model of the ionizing radiation background seems the best of those considered in matching the observational constraints of H ionization rate, electron-scattering optical depth, and Gunn-Peterson optical depth. In the following sections we will explore the effect of this background on galaxy evolution, in comparison with other backgrounds that are relatively too weak (Old UV) and too strong (New UV, New UV+X).
2.2. Simulations
We apply the different radiation fields to the SPH simulations described in Naab et al. (2007); see that paper for full details. The code is based on GADGET-2, and the galaxies are ellipticals selected from a (50 Mpc)3 box with cosmological (CDM) initial conditions, and resimulated in a (10 Mpc)3 box centered on each galaxy, using high-resolution DM and gas/star particles for the volume containing all particles which are within 500 kpc of the cental galaxy at (this is roughly 1.5 Mpc comoving). Importantly, the simulation does not include optical depth effects, in particular the self-shielding of dense star-forming regions from the ionizing backgrounds, although those regions would be optically thin to X-rays regardless. Neither does it include any feedback from supernovae or AGN; although those processes are certainly important in many if not most galaxies, our object is show the differential effect of changes in the ionizing background on the evolution of galaxies, independent of feedback effects. (However, it is interesting to note that recent work by Pawlik & Schaye (2008) suggests that feedback and background effects may not be independent, and may in fact amplify one another.) Star formation is performed at a fixed density threshold ( g cm-3, or cm-3, as in Naab et al., 2007).
For easy comparison, we use the same set of initial conditions that were designated galaxies/halos A, C, and E in Naab et al. (2007), and are so designated here as well. All simulations were performed with SPH particles (corresponding to a gravitational softening length of 0.25 kpc for the gas and star particles, and twice that for the dark matter particles; gas and star particles have masses of the order ). As will be discussed below, galaxies A and C gave the same qualitative results, while galaxy E was somewhat different, due to its different merger and accretion history. Since Galaxy A was the most well-studied in Naab et al. (2007), we choose here to focus on it, bringing in the other two galaxies where relevant. (FG UV, a later addition to the study, was run on galaxy A only.)
Throughout the paper, all distances are physical except where noted; the assumed cosmology is as in Naab et al. (2007).
3. Results
3.1. Gaseous effects
We naturally expect an increase in the ionizing background to lead to more efficient gas heating at high redshifts, but the consequences on galaxy formation cannot easily be predicted.
Figure 2 shows the temperature distribution of the gas in the central 2 Mpc comoving of the galaxy A simulation (essentially the high resolution region of validity; the simulations, being resampled from a larger box, are nonperiodic) with the three backgrounds, at (chosen to be where the Old UV background is nonzero but still substantially lower than New UV / FG UV) and . At the models are well separated; in fact the gas in the Old UV simulation has just finished heating from a very cold (100K) state (to which it had cooled by adiabatic expansion from its initial state at ; the cooling function implemented in the code is primordial (H-He only) and cuts off at K), and has just finished H/HeI reionization. As expected, the New UV model, which has been entirely reionized (including HeII) since , has significantly more hot gas, and including X-ray heating pushes most of the gas up to temperatures significantly above K. The FG UV model lies in between Old UV and New UV, which is expected since it has a higher intensity than the former but a softer spectrum than the latter. FG UV has been H/HeI reionized since but has not yet reionized HeII.
At , however, the Old UV, New UV, and FG UV models are essentially identical; increasing the intensity or changing the spectrum of the ionizing background at high redshift has no effect at the present (in other words, the cooling time for all gas is shorter than 11 Gyr, since it has forgotten the extra heat from ). This is consistent with Mesinger, Bryan, & Haiman (2006), who found that the effects of a UV background which is suddenly turned off begin to dissipate after of a Hubble time; since we are essentially turning off the extra radiation at , we would expect a similar convergence. Moreover, Hui & Haiman (2003) found that well ( Gyr) after reionization, the IGM equilibrium temperature approaches a value that depends only on the spectral shape and not the intensity of the ionizing background, so even if Old UV and New UV had different intensities all the way to we wouldn’t expect a significant difference.
Adding X-rays (to all epochs), on the other hand, significantly heats the gas, especially the coldest gas: the mean gas temperature rises 15% from K to K. The addition of X-rays also produces a 16% larger total mass of gas due to reduced star formation in small systems, as we will see in the next section. This larger reservoir of cool ( K) gas (cf. the lower panel of Fig. 2) helps to prolong and enhance the epoch of star formation in massive galaxies. The warm-hot gas mass (WHIM; K) is 30% larger in the X-ray case than in the cases without X-rays.
Of course, we are especially interested in the gas which has collapsed and virialized in dense halos. Figure 3 shows the temperature spectrum of high-density gas (, where is the mean baryonic density of the universe) at for the four backgrounds and the three galaxies. (We note again that these simulations include no optical depth effects and therefore overestimate the UV flux that virialized regions see.) We see that adding early UV does not affect the amount of cold (K) dense gas, and has uncertain effect on the hot (K) dense gas, increasing it slightly in galaxy C, making negligible change in galaxy E and decreasing it somewhat in galaxy A (although not for FG UV). Adding an X-ray background substantially increases the hot dense gas for galaxies A and C, while having negligible effect on galaxy E.
We explain these differences by reference to the merger histories of the three galaxies. As explored in Naab et al. (2007), galaxy A has a merger of mass ratio at (6 Gyr ago), galaxy C has a merger of mass ratio at (7 Gyr ago), while galaxy E has no significant merger events after an equal-mass merger at (10 Gyr ago). Since the gas-to-star ratio is a strongly declining function of halo mass, especially when there is significant ionizing radiation to keep the low-density gas in small halos hot, we expect in New UV+X for the accretion of smaller halos at later times to add more hot gas compared to accreting larger halos at earlier times, and the earlier the gas is added to the dense central galaxy, the more of it can cool and form stars in situ. On the other hand, the mergers in the New UV (no X) case involve large amounts of colder gas (see next paragraph), which mingles with the existing gas and forms stars quickly, thus paradoxically resulting in less hot gas at the present for Halo A.
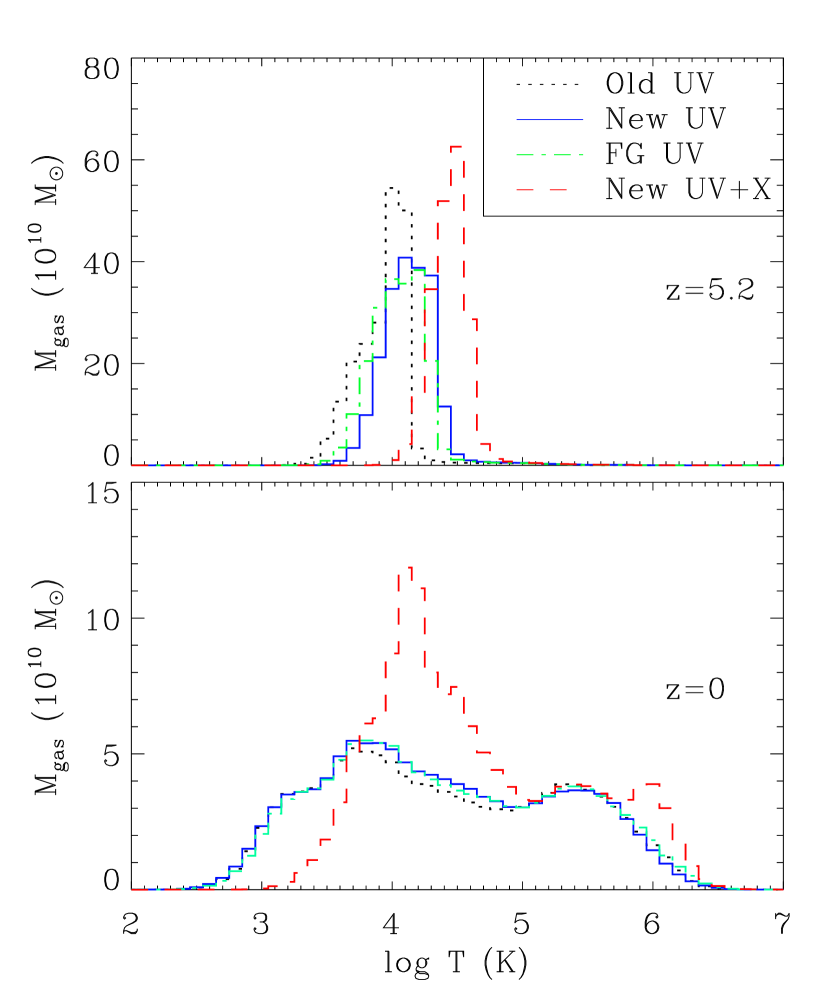
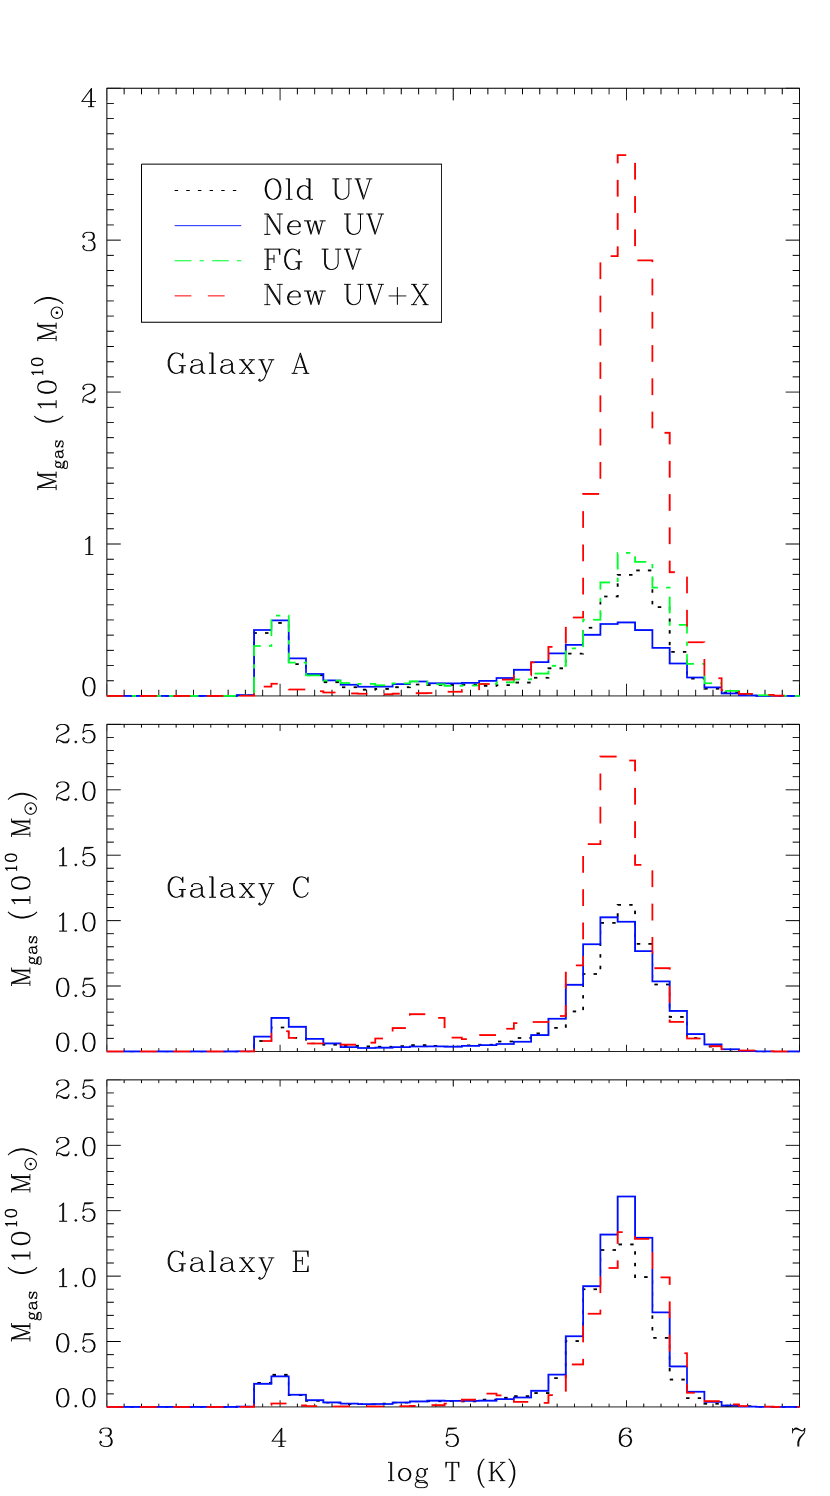
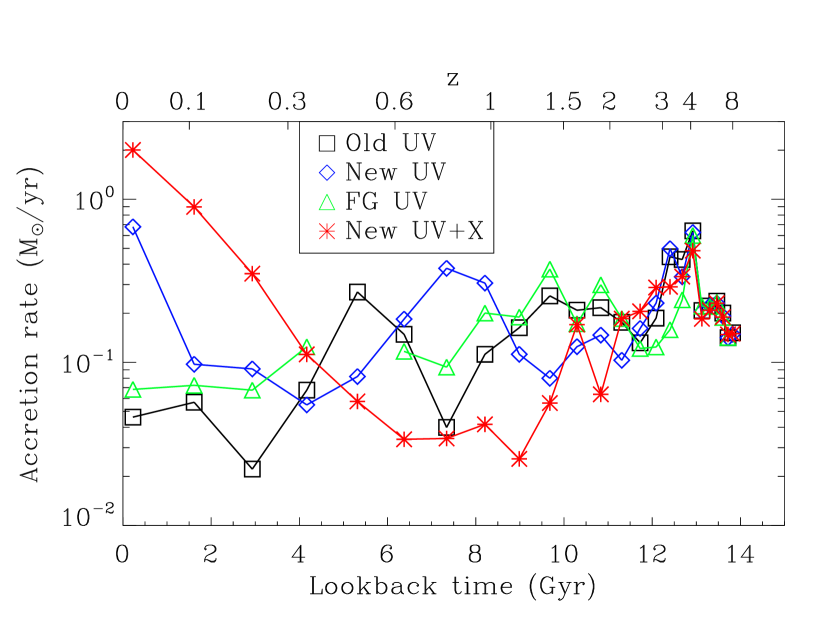
Figure 4 shows the accretion rate of gas onto the central physical 10kpc of galaxy A; galaxies C and E had qualitatively similar results. We see immediately that New UV and New UV+X have significantly higher accretion compared to Old UV, especially in the last 4Gyr () (and in the no X-ray case, the peak at Gyr ago, corresponding to the merger event mentioned above); FG UV has slightly enhanced accretion. This is easily understood as gas that was kept hot at early times by the harder early background of New UV and New UV+X (as per Hui & Haiman, 2003) finally cooling and flowing inward; in the model with lower UV, much of this gas would have formed small stellar systems and been unavailable for late inflows. At , the inflowing gas in the New UV model has a mean temperature of K, while for New UV+X the mean temperature is K.
3.2. Stellar effects
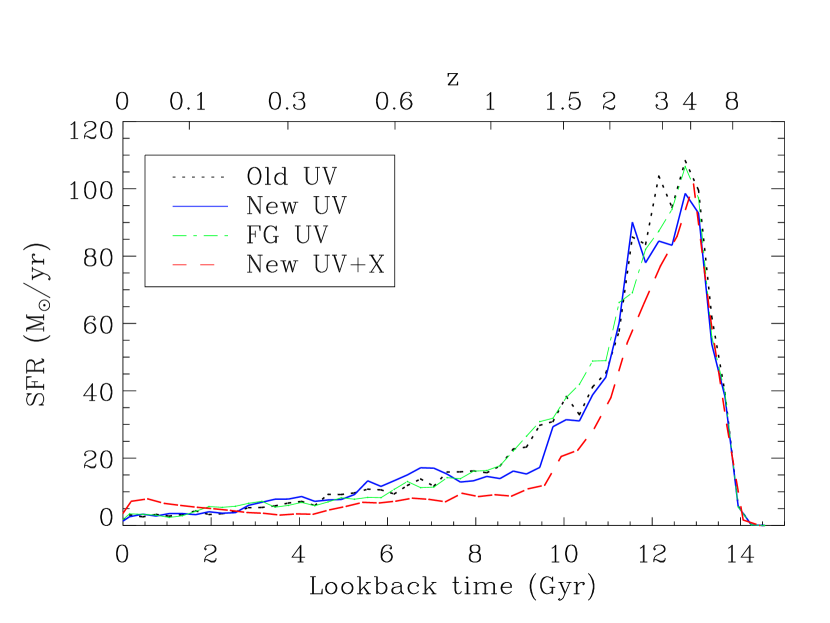
The effects of the different background models on star formation fits well with what we saw in the gas. Figure 5 shows the star-formation history of the central 2 Mpc of simulation A (that is, the formation history of stars in the central 2 Mpc at ). As we would expect, the early star star formation peak at is increasingly suppressed as we increase the intensity and hardness of the ionizing background, from Old UV to FG UV to New UV to New UV+X (and this carries forth to the total stellar mass at the present, which is decreased by 1.4% for FG UV, 7% for New UV, and 24% for New UV+X compared to Old UV; see Table 2). However, the increased radiation above in the New UV model has little effect on global star formation below that redshift. In contrast, New UV+X suppresses star formation until the last 2 Gyr, where there is a modest bump from the inflow of late-cooling gas.
| IC Name | Background | |||
|---|---|---|---|---|
| A | Old UV | 9.28 | 14.00 | 37.45 |
| A | FG UV | 10.09 | 14.14 | 36.92 |
| A | New UV | 10.23 | 14.72 | 34.95 |
| A | New UV+X | 9.91 | 13.91 | 28.52 |
| C | Old UV | 8.55 | 14.12 | 36.34 |
| C | New UV | 9.28 | 16.18 | 35.58 |
| C | New UV+X | 10.81 | 16.69 | 29.58 |
| E | Old UV | 8.24 | 12.43 | 27.98 |
| E | New UV | 8.78 | 16.71 | 27.75 |
| E | New UV+X | 12.66 | 13.78 | 25.29 |
Note. — Results are the mass of stars within the specified radius of the principal halo at . Masses are .
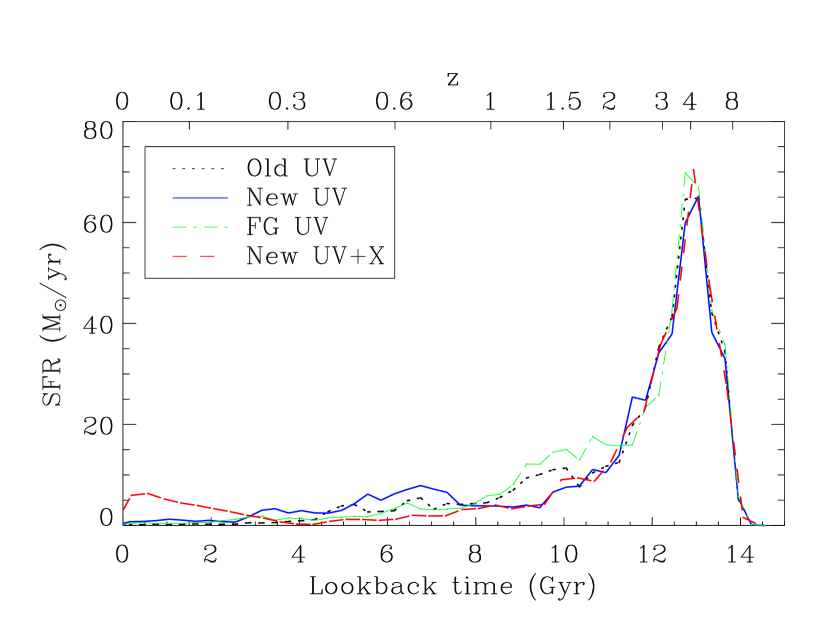
We also study the star-formation effects in a single, dense region: viz., the central 30 kpc of galaxy A, presented in Fig. 6. Here there is little effect on the initial peak, which we expect since this region should have a short cooling time due to its overdensity. However, star formation below is enhanced: 19% of the stellar mass within 30kpc is formed after in the New UV case, compared to 11% for Old UV (and 10% for FG UV). The bump in New UV centered at 7 Gyr ago matches well with the merger-event peak in gas accretion we saw centered at 8 Gyr ago in Fig 4. This results in the New UV version of galaxy A actually having 5% more stars at the present within the 30 kpc radius compared to Old UV; FG UV has only a 1% increase (again see Table 2). New UV+X has a very late burst of star formation 0.5 Gyr ago which is due to a the infall of warm gas that cools in situ, but this is not enough to make up for the earlier deficit, and it has slightly less stellar mass within 30 kpc than Old UV; 15% of the stellar mass is formed after .
Finally, we convert these star-formation histories into present luminosities via the galaxev code of Bruzual & Charlot (2003), assuming a Salpeter IMF and solar metallicity; bolometric magnitude and color results for Galaxy A are presented in Table 3. No dust extinction effects were included. In brief, we see that compared to Old UV, New UV has only a slight increase in bolometric luminosity (0.13 mag) and blueness (0.09 mag), and FG UV has even less change, while New UV+X is 1.3 mag or 3.25 times brighter, and 0.28 mag bluer in U-B, thanks to its late burst of star formation.
| Model Name | Bol. Mag. | B Mag. | R Mag. | U-B | B-V |
|---|---|---|---|---|---|
| Old UV | -21.91 | -20.16 | -21.72 | 0.59 | 0.93 |
| FG UV | -22.00 | -20.30 | -21.82 | 0.55 | 0.91 |
| New UV | -22.04 | -20.39 | -21.85 | 0.50 | 0.87 |
| New UV+X | -23.19 | -21.96 | -23.14 | 0.31 | 0.69 |
Note. — Results are for a radius of 30 kpc at .
These results, like those for the gas, are dependent on the environment of the galaxy. For example, with the Galaxy E simulations the New UV+X model has an 10% decrease in total stellar mass compared to Old UV, but has 34% more stellar mass in the central 30kpc from enhanced gas accretion. (New UV with no X-rays produces 1% less total stellar mass and an 11% increase within 30 kpc.) There is also a correspondingly stronger effect on the mean stellar age for galaxy E: the fraction of stellar mass within 30kpc formed after increases from 6% for Old UV to 35% with New UV+X. See §4 for discussion of these differences.
3.3. Dynamical effects
In addition to affecting the mass and hydrodynamic properties of the stars and gas in the simulations, the radiation background affects their arrangement; i.e., the dynamical properties of the galaxy. The first column of Table 2 shows a significant increase in the stellar mass within a 5 kpc radius as one moves from the Old UV to the New UV to the New UV+X case for all three galaxies (and FG UV again lies between Old UV and New UV): the mass increase from Old UV to New UV is an average of 10%, and from New UV to New UV+X averages 20%, although this includes a slight decrease for Galaxy A. This increase is natural considering the enhanced gas flows we saw in Fig. 4: once that gas reaches the center it must cool and form stars there. Figure 7 shows the circular speed for the innermost 2 kpc of galaxy A at . We see that the stars become more centrally concentrated as one moves up in background intensity or hardness (from Old UV to FG UV to New UV to New UV+X); this is a general feature for . Residual gas also increases in the same way.
Figure 8 shows the number of discrete (i.e., non-substructure) stellar systems with masses identified from the star particles with the HOP halo-finding algorithm (Eisenstadt & Hut, 1998) for the galaxy A simulation (within 2 Mpc comoving) over time. Many past simulations (Efstathiou, 1992; Quinn, Katz, & Efstathiou, 1996; Thoul & Weinberg, 1996) have shown that photoionization can prevent the formation of smaller stellar systems, and indeed we find that the number of total stellar systems decreases from Old UV to New UV to New UV+X, although we find the effect of increased high-z UV on the number of independent halos doesn’t persist past , where merger events consume several small halos that have formed in the Old UV case. Interestingly, FG UV shows fewer small halos than New UV: we see the suppression of halo formation () combined with late mergers (). In all cases star formation in smaller halos is preferentially suppressed. A future paper (Hambrick & Ostriker 2009, in prep.) will deal in more detail with the effect of radiation backgrounds on the mass spectrum of galaxies.
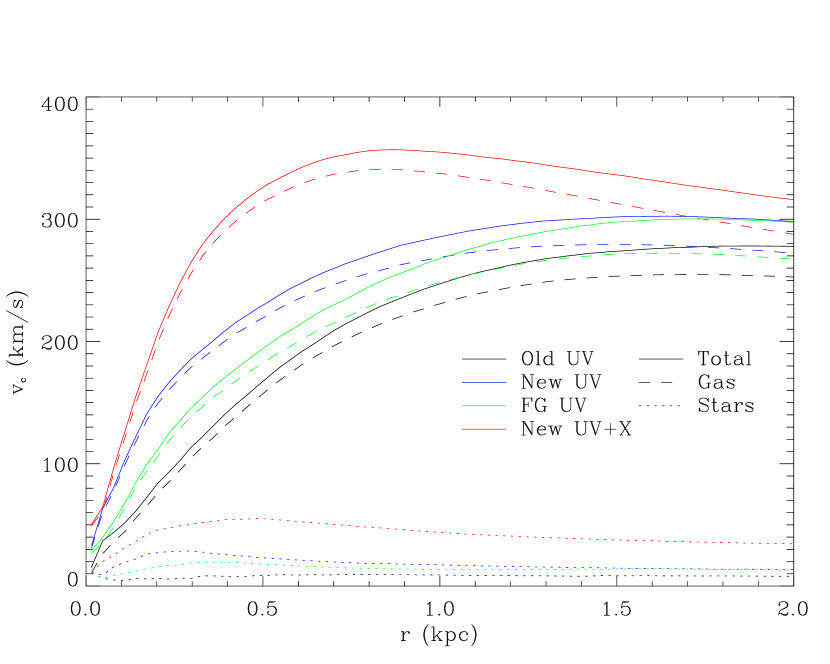
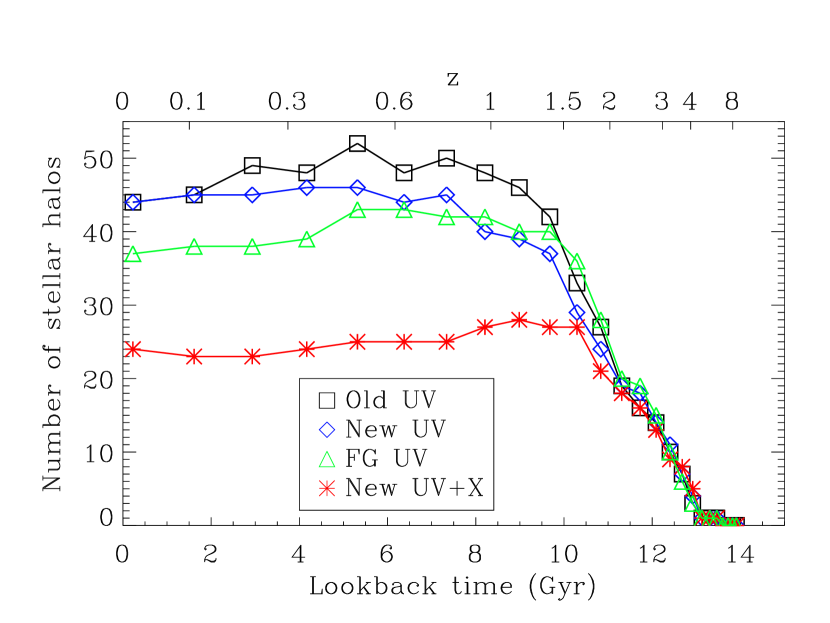
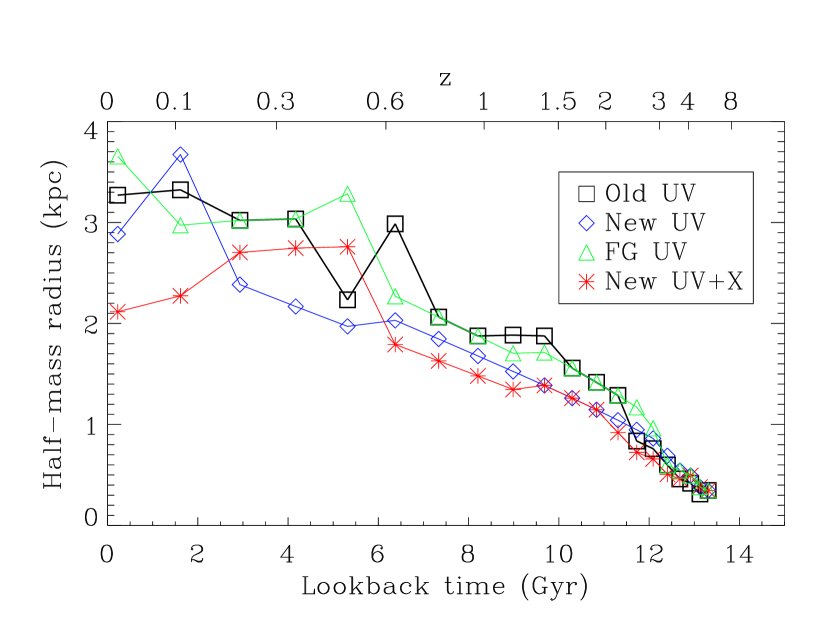
Figure 9 shows the half-mass radius for stars within 30kpc for the three radiation models with galaxy A. The major effect is secular growth from to the present, combined with the stochastic effects of major mergers. Naab, Johansson & Ostriker (2009) found in a detailed examination of galaxy A (with the Old UV background, and including SN feedback) that minor mergers are primarily responsible for the factor of increase in half-mass radius from to 0. The radiation background does have an effect, however: New UV and New UV+X show substantially () smaller radii compared to Old UV at all , modulo the intermittent merger effects; FG UV has negligible difference from Old UV, and in fact has a slightly larger radius at .
For the picture looks somewhat different: specifically, in our snapshot at , the New UV model for galaxy A has a 13%, and FG UV a 27% larger stellar half-mass radius than Old UV, (although New UV+X is smaller than Old UV by 13%). Further, New UV and New UV+X both show a 5% reduction in peak circular speed compared to Old UV at that redshift. Joung, Cen & Bryan (2008) found, using a modified Haardt & Madau 1996 background similar to our “New UV with cutoff”, that simulated galaxies have half-light radii that are too small and peak circular speeds that are too large compared to observed galaxies at redshift 3. However, these authors also used a more stringent star-formation criterion: when they repeated their simulations using the same density threshold as in this work, their results at agreed with obesrvations (Ryan Joung, priv. comm.).
We speculate that the increase in central concentration with increasing radiation is enhanced by reduced substructure in the galaxy (because small stellar halos are suppressed) and correspondingly less dynamical friction. To test this hypothesis, we have constructed a statistic to measure the substructure or “lumpiness” that we designate , which is created by an unsharp-mask-like procedure:
where is the effective (half-mass) radius of the galaxy, is the stellar density field (created by cloud-in-cell mapping of the star particles to a grid of resolution 0.38 kpc, or twice the gas softening length), and is a gaussian of width . That is, we create a mask by smoothing the stellar density field of the galaxy with a fixed-width gaussian kernel, then sum over all pixels in the grid where it is positive (i.e. overdense regions) except the central peak, and normalize to the size of the galaxy. We find that the Old UV model indeed has far more substructure than the two new models, at least for halos A and C; Table 4 shows for the three backgrounds and ICs. Halo E, as remarked on in Naab et al. (2007), is composed mainly of stars which formed in-situ rather than the accretion of smaller stellar systems, and therefore we expect its substructure to be much less affected by the ionizing background, which is what we find.
At first glance, Fig. 8 and Table 4 may seem to be incompatible, since the two models without X-rays are nearly the same in the former and vastly different in the latter. However, if we increase the outer radius in the definition of from two to three effective radii (roughly from 20 to 30 kpc for Galaxy A), we find that becomes for Old UV, New UV, and New UV+X respectively, a result much more in accordance with Fig. 8. That is, the New UV simulation has numerous small halos, but they are at larger radii from the central galaxy than in the Old UV case. On the other hand, Old UV and New UV have the same number of independent halos at the present, as seen Fig. 8, but Old UV has significantly more substructure. This means that Old UV formed more small halos initially, but they were accreted onto the central galaxy by , enhancing its substructure.
Figure 10 shows contours of stellar density for the central 20kpc of galaxy A with the four background models. The smaller size of New UV+X is readily apparent, as is the reduction in the number and mass of subhalos. One can also see the sharp central peak in New UV and New UV+X which is absent in Old UV.
| Model Name | A | C | E |
|---|---|---|---|
| Old UV | 114.6 | 98.9 | 113.9 |
| FG UV | 19.1 | - | - |
| New UV | 14.2 | 13.7 | 129.8 |
| New UV+X | 31.5 | 17.8 | 70.6 |
Note. — Data are ; see text for definition.

4. Discussion
Taken collectively, our results suggest a picture of the effects of an increased early UV radiation background along the following lines. At early times (), the more intense/harder radiation and earlier reionization make the gas hotter, especially the less-dense gas, which cannot cool as effectively (Fig. 2). That is to say, the processes of H and He reionization create large injections of heat, so even though the gas begins to cool one reionization is complete, an earlier reionization means the gas spends less time in the cold, neutral state it has been in since recombination. At very early times () the gas has not yet equilibrated, and so the more intense but softer FG UV background gives a higher temperature than Old UV, but by the situation has reversed, consistent with Hui & Haiman (2003) . At late times, this means that the primary galaxy has less substructure, since there are fewer small stellar systems to accrete; it contains more gas in its central regions (Fig. 4), and hence more late in-situ star formation (Fig. 6), since that gas would otherwise have formed stars before falling in; it is still smaller but now more tightly bound due to gaining less energy from dynamical friction (Naab, Johansson & Ostriker, 2009) and more central star formation from infalling cold streams. In the terms of the Birnboim, Dekel, & Neistein (2007) picture, the cold gas inflows persist longer when early star formation is suppressed by ionizing radiation.
We can distinguish the effects of intensity and spectral shape by comparing New UV and FG UV, since they have roughly the same intensity (H photoionization rate, etc.) from but FG UV has a significantly softer spectrum due to the rapid falloff of the quasar contribution. We find that FG UV in general gives results intermediate between Old UV and New UV, for gas temperature, rate of gas accretion by the central galaxy, star-formation rate, and concentration of stellar mass; in other words, an increase in the intensity of early radiation and an increase in the hardness of the background spectrum produce qualitatively the same results in most of properties we study here. One exception is in the total number of independent stellar systems: FG UV has somewhat fewer than both Old and New UV (though still far more than New UV+X).
Continuing the investigation of spectrum, the effects of X-ray as opposed to UV radiation are equally interesting. Since adding the X-rays increases radiation levels at all , not just , the gas at the present is substantially hotter, and star formation is pushed to even later times, in agreement with Johansson, Naab & Ostriker (2009), who found that the accretion of small stellar clumps (minor mergers) was sufficient to suppress star formation after : in the New UV+X case the small stellar clumps are themselves suppressed, so the central galaxy continues star formation to the present. There is less star formation overall, however, and therefore more dense (hot) gas. Substructure is further reduced and compactness increased (again agreeing with Naab, Johansson & Ostriker, 2009).
These effects are, however, dependent on the accretion history of the galaxy in question. Naab et al. (2007) described two distinct mechanisms by which galaxies assemble their stellar mass: the accretion of existing stellar systems, and the in situ formation of stars from inflowing gas. In our sample, the former mechanism is dominant for galaxies A and C, and the latter for galaxy E. The increase in ionizing radiation creates a bias toward the gas-accretion mechanism by suppressing star formation in small halos. Thus in the galaxies where stellar accretion was important in the low-radiation (Old UV) case, A and C, we find that the increase of in situ star formation is more or less balanced by a decrease in accreted stellar mass, so the total stellar mass in the galaxy at the present is not strongly affected, although the mean stellar age and hence the luminosity and color are. However, in galaxies where stellar accretion is not important (like galaxy E), there is no mass loss from that source, so extra surrounding gas falls in and leads to a higher total galaxy stellar mass. That is, gas which in the Old UV case formed stars in small satellite halos gets heated up at early times, then at late times (), flows in and forms stars in the large central galaxy.
5. Conclusions
As we develop accurate, detailed modeling for galaxy formation based on realistic cosmological initial conditions, we are learning just how sensitive the results are to the physical input parameters. One important parameter is the ionizing background radiation field. The commonly accepted Haardt & Madau (1996) model, while it has been of great utility, fails to produce a good match to the most relevant observational constraints: first, the ionization rate as determined by Gunn-Peterson observations of high-redshift quasars, and second, the electron scattering optical depth as determined by WMAP.
We have considered new models for the ionizing background: a simple rescaling of Haardt & Madau (1996) both with and without a significant X-ray component, intended to represent an upper bound of what is possible, and the recent results of Faucher-Giguère et al. (2009), representing a reasonable middle ground. We have performed a state-of-the-art set of cosmological simulations to assess the sensitivity of the results to the assumed ionizing background.
We find that the gas properties at late times are much more affected by the X-ray component than by early UV enhancement, with the result that there is as much as a 30% increase in the WHIM component (K), and a four-fold increas in the hot-dense component ( K; ) when X-ray heating is present. However even our rescaled background without X-rays (New UV) reduces the formation of stars in small systems and allow cold flows to persist to later times, markedly increasing the amount of late-time () star formation in massive galaxies. Correspondingly there is less substructure in the massive systems due to reduced accretion of smaller stellar systems and consequently less gravitational heating. The systems do still grow in size due to accretion of satellite systems but the effect is less pronounced with when X-ray heating. Despite the absence of feedback, and at a resolution of particles (with gas softening length of 0.1625/h kpc), all simulations have a star-formation rate of less than /yr at with the exception of the model with X-rays, in which cold flows persist to the present. Finally, the mass function for small-mass systems is somewhat reduced by extra early UV and substantially so with the addition of X-rays; this is a topic which will be explored in greater detail in a future paper.
The background of Faucher-Giguère et al. (2009) (FG UV), in contrast with New UV, matches both observed ionization rate and electron-scattering optical depth, and reduces the substructure in massive systems without creating galaxies that have too much gas, too many new stars, and too small a size at late times. Therefore we recommend its adoption over all the models studied here for future galaxy simulations.
JPO was supported by NSF grant AST 07-07505 and NASA grant NNX08AH31G. DCH thanks Luca Ciotti and Andrei Mesinger for helpful advice. TN and PHJ acknowledge support by the DFG cluster of excellence ‘Origin and Structure of the Universe’; TN thanks Shy Genel for an interesting discussion. The authors are especially grateful to the referee for many good suggestions and particularly for bringing the FG UV background to our attention.
References
- Benson et al. (2002) Benson, A. J., Lacey, C. G., Baugh, C. M., Cole, S., Frenk, C. S., 2002, MNRAS, 333, 156
- Birnboim, Dekel, & Neistein (2007) Birnboim, Y., Dekel, A., & Neistein, E., 2007, MNRAS, 380, 339
- Bruzual & Charlot (2003) Bruzual, G., & Charlot, S., 2003, MNRAS, 344, 1000
- Chiu, Fan, & Ostriker (2003) Chiu, W., Fan, X., & Ostriker, J., 2003, ApJ, 599, 759
- Dall’Aglio et al. (2009) Dall’Aglio, A., Wisotzki, L., Worseck, G., 2009, arXiv:0906.1484
- Dijkstra et al. (2004) Dijkstra, M., Haiman, Z., Rees, M.J., Weinberg, D.H., 2004, ApJ, 601, 666
- Dunkely et al. (2008) Dunkley, J., Komatsu, E., Nolta, M.R., Spergel, D.N., et al., 2008, arXiv:0803.0586
- Efstathiou (1992) Efstathiou, G., 1992, MNRAS, 256, 43
- Eisenstadt & Hut (1998) Eisenstein, D.J. & Hut, P., 1998, ApJ, 498, 137
- Faucher-Giguère et al. (2008) Faucher-Giguère, C.-A., Lidz, A., Hernquist, L., Zaldarriaga, M., 2008, ApJ, 682, 9
- Faucher-Giguère et al. (2009) Faucher-Giguère, C.-A., Lidz, A., Zaldarriaga, M., Hernquist, L., 2009, arXiv:0901.4554
- Ferland et al. (1998) Ferland, G. J., Korista, K.T., Verner, D.A., Ferguson, J.W., Kingdon, J.B., & Verner, E.M., 1998, PASP, 110, 761
- Gilli et al. (2007) Gilli, R., Comastri, A., Hasinger, G., 2007, A&A, 463, 79
- Gnedin (2000) Gnedin, N. Y., 2000, ApJ, 542, 535
- Governato et al. (2007) Governato, F., Willman, B., et al., 2007, MNRAS, 374, 1479
- Haardt & Madau (1996) Haardt, M. & Madau, P., 1996, ApJ, 461, 20
- Haardt & Madau (2001) Haardt, M. & Madau, P., 2001, astro-ph/0106018
- Hopkins et al. (2008) Hopkins, P.F., Cox, T.J., Kereš, D., Hernquist, L., 2008, ApJS, 175, 390
- Hui & Haiman (2003) Hui, L., & Haiman, Z., 2003, ApJ, 596, 9
- Johansson, Naab & Ostriker (2009) Johansson, P.H., Naab, T., & Ostriker, J.P., 2009, ApJ, 697, 38
- Joung, Cen & Bryan (2008) Joung, M., Cen, R., & Bryan, G.L., 2009, ApJ, 692, L1
- Madau & Efstathiou (1999) Madau, P. & Efstathiou, G., 1999, ApJ, 517, 9
- Madau, Haardt, & Rees (1999) Madau, P., Haardt, M., & Rees, M., 1999, ApJ, 514, 648
- Mayer et al. (2008) Mayer, L., Governato, F., & Kaufmann, T., 2008, arXiv:0801.3845
- Mesinger, Bryan, & Haiman (2006) Mesinger, A., Bryan, G.L., Haiman, Z., 2006, ApJ, 648, 835
- Naab et al. (2007) Naab, T., Johansson, P.H., Ostriker, J.P., & Efstathiou, G. 2007, ApJ, 658, 710
- Naab, Johansson & Ostriker (2009) Naab, T., Johansson, P.H., & Ostriker, J.P., 2009, ApJ, 699, 178
- Navarro & Steinmetz (1997) Navarro, J. F. & Steinmetz, M., 1997, ApJ, 478, 13
- Pawlik & Schaye (2008) Pawlik, A.H., Schaye, J., 2008, arXiv:0812.2913
- Quinn, Katz, & Efstathiou (1996) Quinn, T., Katz, N., Efstathiou, G., 1996, MNRAS, 278, 49
- Rees (1986) Rees, M.J., 1986, MNRAS, 218, 25
- Ricotti et al. (2008) Ricotti, M., Gnedin, N.Y., Shull, J.M., 2008, ApJ, 685, 21
- Ricotti, Ostriker & Gnedin (2005) Ricotti, M., Ostriker, J.P., Gnedin, N.Y., 2005, MNRAS, 357, 207
- Sazonov et al. (2005) Sazonov, S.Yu., Ostriker, J.P., Ciotti, L., Sunyaev, R.A., 2005 MNRAS, 358, 168
- Sazonov, Ostriker, & Sunyaev (2004) Sazonov, S.Yu., Ostriker, J.P., & Sunyaev, R.A. 2004 MNRAS, 347, 144
- Scannapieco et al. (2008) Scannapieco, C., White, S.D.M., Springel, V., Tissera, P.B., 2008, arXiv:0812.0976
- Shull & van Steenberg (1985) Shull, J. M., & van Steenberg, M. E., 1985, ApJ, 298, 268
- Thoul & Weinberg (1996) Thoul, A. A. & Weinberg, D.H., 1996, ApJ, 465, 608
- Venkatesan et al. (2001) Venkatesan, A., Giroux, M.L., Shull, J.M., 2001, ApJ, 563, 1
- Zaldarriaga et al. (2001) Zaldarriaga, M., Hui, L., & Tegmark, M., 2001, ApJ, 557, 519