The origin of failed subhaloes and the common mass scale of the Milky Way satellite galaxies
Abstract
We study the formation histories and present-day structure of satellite galaxies formed in a high resolution hydrodynamic simulation of a Milky Way-like galaxy. The simulated satellites span nearly 4 orders of magnitude in luminosity but have a very similar mass within their inner 600 pc, , with very little scatter. This result is in agreement with the recent measurements for dwarf spheroidal galaxies (dSphs) in the Milky Way by Strigari et al. In our simulations a preferred mass scale arises naturally from the effects of the early reionisation of gas. These impose a sharp threshold of km s-1 on the circular velocity of haloes which can cool gas and make stars. At the present day, subhaloes that host satellites as luminous as the classical Milky Way dwarfs (), have typically grown to have circular velocities of . There are, however, subhaloes with similar circular velocities today which were, nevertheless, below threshold at reionisation and thus remain dark. Star formation in above-threshold haloes is truncated when the halo is accreted into the main galaxy progenitor. Thus, many properties of today’s dwarf satellites such as their luminosity and star formation rate are set by their accretion time.
keywords:
methods: numerical – galaxies: evolution – galaxies: formation – cosmology: theory – galaxies: dwarf.1 Introduction
The mass density of the Universe is dominated by exotic dark matter whose identity remains unknown. Important clues could be hidden in the structure of the dwarf satellite galaxies of the Milky Way which are the most dark matter dominated systems known in the Universe. It has recently been found that these galaxies all seem to have approximately the same central density (within 300 or 600 pc), irrespective of their luminosity (Mateo, 1998; Gilmore et al., 2007; Strigari et al., 2007, 2008). There thus appears to be a special scale or threshold involved in the formation of dwarf satellites. A threshold central density could arise naturally if there is a cutoff in the primordial power spectrum of density fluctuations produced by free-streaming of warm dark matter particles in the early universe (Bond & Szalay, 1983). However, if the dark matter is cold, then there are no primordial processes that operate on the relevant scales. In this case the origin of the threshold must be a late-time astrophysical process that inhibits star formation in small dark matter haloes, such as the reionisation of gas at early times (e.g. Efstathiou, 1992; Okamoto, Gao, & Theuns, 2008a).
By suppressing star formation in small cold dark matter haloes, early reionisation would also solve the ‘missing satellite’ problem (Klypin et al., 1999; Moore et al., 1999), as demonstrated using semi-analytic models of galaxy formation (Bullock et al., 2000; Benson et al., 2002; Somerville, 2002; Kravtsov et al., 2004). Recently, Macciò et al. (2009) and Li et al. (2009) have confirmed, also with semi-analytic techniques, that this process sets the common mass scale seen in the inner 300 (or 600) pc of dwarf satellite haloes. One problem with the work of Li et al. (2009) and Macciò et al. (2009), however, is that they modelled reionisation using the filtering mass approach of Gnedin (2000) which has been shown to overestimate the importance of this effect (Hoeft et al., 2006; Okamoto et al., 2008a).
Since the reionisation of gas at early times and its effects on star formation are complex processes, full hydrodynamic simulations are required to determine how they influence the structure and evolution of dwarf galaxies. In this Letter, we analyse a high resolution hydrodynamic simulation that follows the formation of a Milky Way-type galaxy and is well suited to a detailed study of the formation of dwarf satellite galaxies. This simulation has been shown by Okamoto et al. (2009, Fig. 10) to give an excellent match to the observed number of faint satellites in the Milky Way down to the resolution limit of the simulation (-band magnitude ), although it predicts somewhat too few very bright () satellites. Here, we focus on the physical processes that determine whether or not a subhalo is able to form a galaxy and on the inner structure of the resulting object.
2 The simulations
We study the satellite population that formed in a high-resolution resimulation, using full baryonic physics, of ‘Aquarius-D’, one of the 6 cold dark matter haloes simulated as part of the ‘Aquarius’ project by Springel et al. (2008). Our simulation includes all the gas physics thought to be relevant for galaxy formation: a time-evolving photoionising background (Haardt & Madau, 2001), metallicity-dependent gas cooling and photoheating (Wiersma et al., 2009), SN feedback (Okamoto et al., 2008b), and chemical evolution due to SNe II, SNe Ia, and AGB stars (Okamoto et al., 2005). Details of this simulation may be found in Okamoto et al. (2009, their halo ‘Aq-D-HR’).
For our analysis two processes are particularly important: reionisation and galactic winds. The former is treated as described in Okamoto et al. (2008a). For the latter, we use the model introduced by Okamoto et al. (2009). In brief, when a gas particle receives an amount of energy during a time-step , this particle is added to a wind with probability, , where is the initial wind speed. This is given as , where is the one-dimensional velocity dispersion of dark matter particles around the gas particle. This expression implies that the wind mass generated by an SN is proportional to , i.e. per unit of star formation, less massive galaxies blow more (but slower) winds. This model reproduces both the observed luminosity function of the Milky Way satellites and the luminosity-metallicity relation.
The mass of dark matter and gas particles in the simulation are and , respectively. The gravitational softening length for the dark matter, gas, and star particles is kept fixed in comoving coordinates for ; thereafter it is frozen in physical units, kpc. To test for numerical convergence, we also ran a low resolution version of the simulation with , , and kpc.
In order to identify subhaloes and satellites, we use the SUBFIND algorithm (Springel et al., 2001). We define subhaloes as systems that consist of at least 32 particles, and satellites as subhaloes that contain at least 10 star particles, unless otherwise stated. Satellite luminosities are computed using the population synthesis code PGASE2 (Fioc & Rocca-Volmerange, 1997).
3 Results
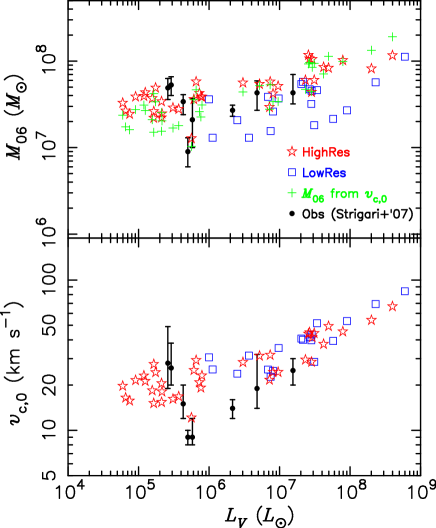
The main result of our study is presented in Fig. 1 where, in the upper panel, we plot the mass within the inner 600 pc, , of the 38 satellites resolved in the simulation, as a function of the -band luminosity. The mass varies by less than a factor of 5 over 4 orders of magnitude in luminosity, reproducing very well the overall behaviour of the Strigari et al. (2007) data for classical dSphs, shown by the black dots. The lower panel shows the maximum of the circular velocity curve, , which also agrees well with the data. The latter agreement is perhaps not too surprising given that in order to derive values of for the Milky Way satellites, Strigari et al. (2007) adopted a relation between and derived from the CDM simulation of Diemand et al. (2007b).
Before examining the physical processes responsible for the result of Fig. 1, we discuss the reliability of our numerical data. Both panels of this figure include results from our low resolution simulation. For these agree very well with those from the high resolution simulation, indicating that this quantity has converged. For on the other hand, the results from the low resolution simulation are about a factor of 2 lower than for the high resolution simulation. The explanation of this apparent paradox is simply that, is numerically more robust than (Springel et al., 2008). To test whether or not has converged in our high resolution simulation, we make use of the empirical relation between and derived from the highest resolution Aquarius simulation111 (which has about 100 times better resolution than our high resolution hydrodynamic simulation; Springel et al. (2008)). As shown in Fig. 1, the values of derived from this relation agree well with the directly measured values, showing that the high resolution simulation gives converged and reliable values of for all the satellites resolved in the simulation.
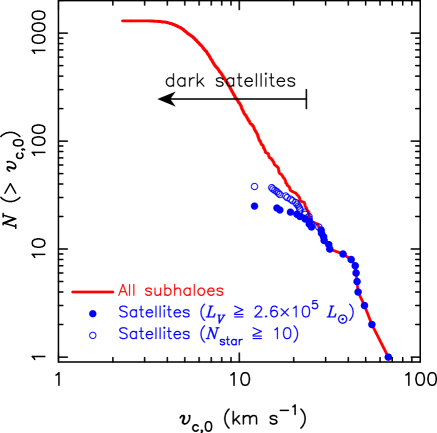
The lower panel of Fig. 1 provides an important clue to the reasons behind the preferred mass scale picked out in the top panel. Over the range spanned by the observed dSphs (), the velocity is essentially constant, at km s-1, and then it rises slowly with luminosity at brighter magnitudes. Thus, there appears to be a threshold circular velocity required for a dwarf satellite to form. This threshold is evident in Fig. 2 which compares the circular velocity distribution of satellites to that of the entire subhalo population. All subhaloes with km s-1 succeed in making a satellite, but below this value, the fraction of successful subhaloes drops rapidly. This inability of small subhaloes to form a visible galaxy is the reason why there is no ‘satellite problem’ in the CDM model: only a small fraction of the large subhalo population are lit up by galaxy formation.
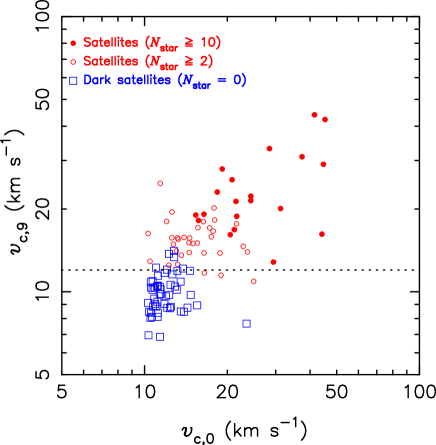
Note, however, that there is no hard cutoff in in Fig. 2. Below km s-1, there are subhaloes that succeed in making satellites as luminous as the classical dSphs (), but also failed subhaloes that do not contain any stars. The difference between haloes of similar, relatively large circular velocities which do and do not form a visible galaxies is apparent in Fig. 3. Here we compare the present day maximum circular velocity of a subhalo, , with the maximum circular velocity of its main progenitor, , at the epoch of reionisation, which in our simulations happens at . This figure shows a sharp transition in between subhaloes whose descendants go on to make visible galaxies and those whose descendants do not. Surprisingly, this threshold applies not only to luminous satellites, but also to subhaloes that contain only two star particles. The transition occurs at km s-1 and is due to the effects of reionisation: the increase in thermal pressure which follows reionisation evaporates the gas from subthreshold haloes (e.g. Rees, 1986; Okamoto et al., 2008a).
Haloes with maximum circular velocity above the transition critical velocity, km s-1, are observed as dwarf satellites today. Their circular velocities today peak at around km s-1, as may be seen in Fig. 3. This is the origin of the common velocity scale seen in the lower panel of Fig. 1. This characteristic velocity translates directly into the characteristic inner halo mass measured by observers in today’s satellites (Gilmore et al., 2007; Strigari et al., 2007, 2008).
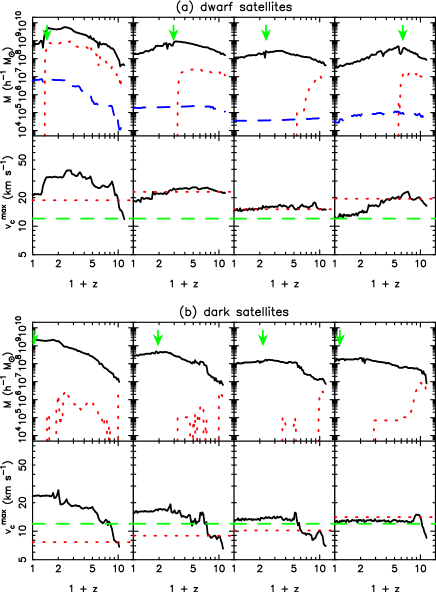
In our simulations, reionisation is the main process that separates successful from unsuccessful haloes. However, the properties of a satellite are determined by subsequent events. Particularly important is the accretion of the (sub)halo into the main progenitor of the host galaxy. The epoch of accretion determines many of the key properties of the final satellite, such as its luminosity and star formation rate. The key events in the life of a subhalo are illustrated in Fig. 4.
Consider first the evolution of haloes that go on to make visible satellites by the present day, illustrated in panels (a). As may be seen in the lower subpanels, at all these haloes have above-threshold maximum circular velocity ( km s-1). The gas in these objects, shown by the red line in the upper subpanels, is unaffected by reionisation and these haloes are able to form stars (blue lines). Eventually, however, the halo is accreted into the progenitor halo of the main galaxy, becoming a subhalo. At this time, the remaining gas is stripped completely and star formation ceases. This explains why most of today’s dwarf satellites are old. Although we do not find the correlation between accretion redshift and halo mass at the epoch of accretion reported in the semi-analytic models of Macciò et al. (2009), we do find a correlation between accretion redshift and final satellite luminosity. The satellite illustrated in the 3rd column has a slightly unusual behaviour. This object loses its gas well before becoming a subhalo. Since its maximum circular velocity at is just above the critical value, reionisation and photoheating do heat up the gas which becomes loosely bound and is subsequently blown out by supernova explosions and increased background radiation by . The photoionising background prevents gas from reaccreting into a halo with such small circular velocity (Okamoto et al., 2008a).
Panel (b) follows the fate of typical failed satellites, i.e. of haloes that are below the circular velocity threshold at reionisation and are destined to remain as dark subhaloes today. Most of them lose all of their gas by evaporation at . Although they can subsequently gain small amounts of gas as they grow in mass (and circular velocity), the gas density in their shallow potential wells is much too low for stars to form. The halo illustrated in the rightmost panel has value of which is only just above threshold. As a result, it does not lose its gas immediately after reionisation but holds on to it for some time before finally losing it at . This object never manages to make stars because the large thermal pressure prevents gas from attaining a sufficiently large density and so the (sub)halo remains forever dark.
4 Summary and discussion
In this Letter we have used a high resolution N-body hydrodynamic simulation to investigate the formation histories of the satellites that form in a Milky-Way type galaxies in a CDM universe. These simulations have been shown to reproduce the main optical and chemical properties of the Local Group satellites, including their luminosity function (Okamoto et al., 2009). In this study we have focused on the properties that distinguish the small subset of subhaloes that succeed in making a galaxy, from the vast majority that remain dark.
Our simulations naturally reproduce the observation that the Milky Way satellites have very similar central densities irrespective of their luminosity. They also show that there is a threshold circular velocity today, km s-1, above which all subhaloes present today host satellites with the luminosities typical of the classical satellites of the Milky Way (). The number of satellites drops rapidly below this critical circular velocity but around this value there are haloes which succeed in making a galaxy and haloes which do not. The distinction between them can be traced back to the epoch of reionisation when there is a hard threshold in maximum circular velocity, km s-1, that divides haloes where gas can cool and make stars from haloes in which it cannot. The scatter between and that develops over time explains why seemingly similar subhaloes today can have such different mass-to-light ratios. This key feature cannot be explained by the effect of galactic winds alone. Galactic winds in which the wind velocity scales in proportion to velocity dispersion were shown by (Okamoto et al., 2009) to be required to explain the satellite luminosity function. Here we have shown that reionisation is required to explain the circular velocity function.
Haloes with sub-threshold lose their gas by evaporation during reionisation while the haloes with above-threshold retain their gas which eventually overcomes the increased thermal pressure produced by reionisation and proceed to make stars. This explains why Okamoto et al. (2009) could not find any residual signs of reionisation in the star formation histories of simulated satellites.
If the CDM model is right, a large number of small, completely optically dark subhaloes should be orbiting in the Milky Way halo. They might one day be detected indirectly either through annihilation radiation if the dark matter consists of supersymmetric particles (e.g. Baltz et al., 2000; Calcáneo-Roldán & Moore, 2000; Evans et al., 2004; Diemand et al., 2007a; Springel et al., 2008) or through gravitational lensing effects (e.g Kochanek, 1991; Xu et al., 2009).
Broadly speaking, our results agree with those obtained using semi-analytic models applied to high-resolution -body simulations. These studies also find that a preferred mass scale arises naturally in dwarf galaxies from a combination of astrophysical processes that inhibit star formation in small haloes and the fact that the mass within 600 pc (or 300 pc) is not a very sensitive function of the total subhalo mass (Li et al., 2009; Macciò et al., 2009). It is nevertheless surprising that Li et al. (2009) managed to obtain a correlation between and satellite luminosity similar to ours (Fig. 1) and to the real data because they assumed an extreme reionisation model which is incompatible with the results of recent simulations (Okamoto et al., 2008a). It is possible that the minimum mass scale in their model was set by their assumption that gas does not cool in haloes with virial temperature below K rather than by the effects of photoionising background. Note that the threshold circular velocity imposed by reionisation in our simulations, km s-1, corresponds to a virial temperature of K.
Using a simple analytical model applied to an N-body simulation, Kravtsov (2009) also finds that a preferred satellite mass scale (as well as other properties of the satellite system, such as the luminosity function and spatial distribution) can be explained if the star formation efficiency decreases with decreasing halo mass. In our simulations a dependence of star formation efficiency on halo mass of this kind is a natural outcome of the behaviour of galactic winds. Kravtsov’s model does not assume a sharp threshold in the star formation efficiency. This, however, arises naturally in our simulations as a result of reionisation and seems to be required in order to explain why some dark matter halos always remain dark.
Our simulations ignore the possibilities that gas may be self-shielded against ionising radiation, or that star formation may result from molecular gas cooling before reionisation. Both of these processes could be important in the formation of small objects (Susa & Umemura, 2004a, b) and may allow small amounts of star formation in sub-threshold haloes. It will be particularly interesting to explore how important these effects are for the newly-discovered ultrafaint satellites (Koposov et al., 2008). We leave these issues for future work. Our present simulations, however, demonstrate that a preferred mass scale in satellites does not require abandoning the standard model of cosmology but is, in fact, a natural byproduct of galaxy formation in small cold dark matter haloes.
Acknowledgments
We thank Volker Springel for very useful comments on an early draft. The simulations were carried out on the computational facilities at the CCS, Tsukuba, the Cosmology Machine at the ICC, Durham, and Cray XT4 at CfCA, NAOJ. This work was supported by the FIRST project based on Grants-in-Aid for Specially Promoted Research by MEXT (16002003), Grant-in-Aid for Scientific Research (S) by JSPS (20224002), and an STFC rolling grant to the ICC. CSF acknowledges a Royal Society Wolfson Research Merit Award.
References
- Baltz et al. (2000) Baltz E. A., Briot C., Salati P., Taillet R., Silk J., 2000, Phys. Rev. D, 61, 023514
- Benson et al. (2002) Benson A. J., Frenk C. S., Lacey C. G., Baugh C. M., Cole S., 2002, MNRAS, 333, 177
- Bond & Szalay (1983) Bond J. R., Szalay A. S., 1983, ApJ, 274, 443
- Bullock et al. (2000) Bullock J. S., Kravtsov A. V., Weinberg D. H., 2000, ApJ, 539, 517
- Calcáneo-Roldán & Moore (2000) Calcáneo-Roldán C., Moore B., 2000, Phys. Rev. D, 62, 123005
- Diemand et al. (2007a) Diemand J., Kuhlen M., Madau P., 2007a, ApJ, 657, 262
- Diemand et al. (2007b) —, 2007b, ApJ, 667, 859
- Efstathiou (1992) Efstathiou G., 1992, MNRAS, 256, 43P
- Evans et al. (2004) Evans N. W., Ferrer F., Sarkar S., 2004, Phys. Rev. D, 69, 123501
- Fioc & Rocca-Volmerange (1997) Fioc M., Rocca-Volmerange B., 1997, A&A, 326, 950
- Gilmore et al. (2007) Gilmore G., Wilkinson M. I., Wyse R. F. G., Kleyna J. T., Koch A., Evans N. W., Grebel E. K., 2007, ApJ, 663, 948
- Gnedin (2000) Gnedin N. Y., 2000, ApJ, 542, 535
- Haardt & Madau (2001) Haardt F., Madau P., 2001, in Clusters of Galaxies and the High Redshift Universe Observed in X-rays, Neumann D. M., Tran J. T. V., eds.
- Hoeft et al. (2006) Hoeft M., Yepes G., Gottlöber S., Springel V., 2006, MNRAS, 371, 401
- Klypin et al. (1999) Klypin A., Kravtsov A. V., Valenzuela O., Prada F., 1999, ApJ, 522, 82
- Kochanek (1991) Kochanek C. S., 1991, ApJ, 373, 354
- Koposov et al. (2008) Koposov S., Belokurov V., Evans N. W., Hewett P. C., Irwin M. J., Gilmore G., Zucker D. B., Rix H.-W., Fellhauer M., Bell E. F., Glushkova E. V., 2008, ApJ, 686, 279
- Kravtsov (2009) Kravtsov A. V., 2009, ArXiv e-prints
- Kravtsov et al. (2004) Kravtsov A. V., Gnedin O. Y., Klypin A. A., 2004, ApJ, 609, 482
- Li et al. (2009) Li Y.-S., Helmi A., De Lucia G., Stoehr F., 2009, MNRAS, 397, L87
- Macciò et al. (2009) Macciò A. V., Kang X., Moore B., 2009, ApJL, 692, L109
- Mateo (1998) Mateo M. L., 1998, ARA&A, 36, 435
- Moore et al. (1999) Moore B., Ghigna S., Governato F., Lake G., Quinn T., Stadel J., Tozzi P., 1999, ApJL, 524, L19
- Okamoto et al. (2005) Okamoto T., Eke V. R., Frenk C. S., Jenkins A., 2005, MNRAS, 363, 1299
- Okamoto et al. (2009) Okamoto T., Frenk C. S., Jenkins A., Theuns T., 2009, submitted, arXiv:0909.0265
- Okamoto et al. (2008a) Okamoto T., Gao L., Theuns T., 2008a, MNRAS, 390, 920
- Okamoto et al. (2008b) Okamoto T., Nemmen R. S., Bower R. G., 2008b, MNRAS, 385, 161
- Rees (1986) Rees M. J., 1986, MNRAS, 218, 25P
- Somerville (2002) Somerville R. S., 2002, ApJL, 572, L23
- Springel et al. (2008) Springel V., Wang J., Vogelsberger M., Ludlow A., Jenkins A., Helmi A., Navarro J. F., Frenk C. S., White S. D. M., 2008, MNRAS, 391, 1685
- Springel et al. (2001) Springel V., White S. D. M., Tormen G., Kauffmann G., 2001, MNRAS, 328, 726
- Strigari et al. (2007) Strigari L. E., Bullock J. S., Kaplinghat M., Diemand J., Kuhlen M., Madau P., 2007, ApJ, 669, 676
- Strigari et al. (2008) Strigari L. E., Bullock J. S., Kaplinghat M., Simon J. D., Geha M., Willman B., Walker M. G., 2008, Nat, 454, 1096
- Susa & Umemura (2004a) Susa H., Umemura M., 2004a, ApJ, 600, 1
- Susa & Umemura (2004b) —, 2004b, ApJL, 610, L5
- Wiersma et al. (2009) Wiersma R. P. C., Schaye J., Smith B. D., 2009, MNRAS, 393, 99
- Xu et al. (2009) Xu D. D., Mao S., Wang J., Springel V., Gao L., White S. D. M., Frenk C. S., Jenkins A., Li G., Navarro J. F., 2009, ArXiv e-prints