The Massive Hubble Sequence beyond and the Connection between Large Star-Forming and Compact Quiescent Galaxies11affiliation: Based on observations made with the NASA/ESA Hubble Space Telescope (HST), obtained at the Space Telescope Science Institute, which is operated by AURA, Inc., under NASA contract NAS 5–26555.
Abstract
We present Hubble Space Telescope NIC2 morphologies of a spectroscopic sample of massive galaxies at , by extending our sample of 9 compact quiescent galaxies ( kpc) with 10 massive emission-line galaxies. The emission-line galaxies are classified by the nature of their ionized emission; there are six star-forming galaxies and four galaxies hosting an active galactic nucleus (AGN). The star-forming galaxies are the largest among the emission-line galaxies, with a median size of kpc. The three galaxies with the highest star formation rates () have irregular and clumpy morphologies. The AGN host galaxies are more similar to the compact quiescent galaxies in terms of their structures (kpc) and spectral energy distributions. The total sample clearly separates into two classes in a color–mass diagram: the large star-forming galaxies that form the blue cloud, and the compact quiescent galaxies on the red sequence. However, it is unclear how or even if the two classes are evolutionary related. Three out of six massive star-forming galaxies have dense cores and thus may passively evolve into compact galaxies due to fading of outer star-forming regions. For these galaxies a reverse scenario, in which compact galaxies grow inside-out by star formation is also plausible. We do caution though that the sample is small. Nonetheless, it is evident that a Hubble sequence of massive galaxies with strongly correlated galaxy properties is already in place at .
Subject headings:
galaxies: evolution — galaxies: formation — galaxies: high-redshift1. INTRODUCTION
Theoretical models are slowly converging to a coherent picture on how massive galaxies are building up their stellar mass over cosmic time. The early phase is thought to be comparable to a dissipative collapse model, and dominated by mergers of gas-rich sub-components and in situ star formation (e.g., Naab et al., 2007). This cold accretion mode is efficient for low-mass halos, but is expected to cease once the halo becomes too massive and too hot (e.g., Birnboim et al., 2007). However, massive galaxies at high redshift may still grow by cold clumpy streams, which penetrate the halo through the filaments (e.g., Dekel & Birnboim, 2008; Dekel et al., 2009a). In the second “quiescent” phase the galaxy is thought to primarily grow by accretion of smaller systems, and will build up at larger radii (e.g., Naab et al., 2007, 2009; Bournaud et al., 2007; Bezanson et al., 2009).
This picture is primarily inspired by new observational results. First, several studies find that star-forming galaxies exhibit irregular and clumpy structures (e.g., Elmegreen et al., 2007, 2009; Genzel et al., 2008; Förster Schreiber et al., 2009). Second, massive quiescent galaxies are found to increase in size by about a factor of (e.g., Trujillo et al., 2006; Longhetti et al., 2007; van Dokkum et al., 2008; Cimatti et al., 2008; Franx et al., 2008) from to the present, and this size growth is confirmed by the first dynamical studies (van Dokkum et al., 2009b; Cappellari et al., 2009).
Nonetheless, there is no observational evidence for an evolutionary relation between the irregular star-forming and compact quiescent galaxies. Clumpy star-forming galaxies could form compact bulges, as the clumps may migrate to the center and coalesce (Dekel et al., 2009b; Elmegreen et al., 2008). However, the high-redshift clumpy galaxies detected so far are not massive enough to qualify as direct progenitors of compact quiescent galaxies. In order to assess a possible evolutionary sequence, detailed morphological studies of complete massive galaxy samples are required.
In this Letter we present NIC2 imaging of a spectroscopic sample of massive galaxies at . The galaxies without detected emission lines were already studied in van Dokkum et al. (2008). Here, we extend this study with the morphologies of massive emission-line galaxies (Kriek et al., 2007). This massive galaxy sample enables us to study and relate the structures of star-forming and quiescent galaxies, obtain a census of the “Hubble Sequence” at , and explore a possible evolutionary sequence. A CDM cosmology with , , and km s-1 Mpc-1 and AB magnitudes are assumed throughout.
2. SAMPLE, OBSERVATIONS, REDUCTION AND FITTING
The galaxies studied in this Letter are selected from our spectroscopic sample of massive galaxies () at . For all galaxies we have spectroscopy with the near-infrared (NIR) spectrograph (GNIRS; Elias et al., 2006) and deep optical to NIR photometry as provided by the Multi-Wavelength Survey by Yale-Chile (MUSYC; Gawiser et al., 2006; Quadri et al., 2007; Taylor et al., 2009). The full sample consist of 28 massive galaxies at , ranging from strong starbursts, to AGN hosts, and quiescent systems. In terms of rest-frame color this sample is representative for a mass-limited sample (Kriek et al., 2008a). More information on the galaxy sample and properties of the individual galaxies can be found in Kriek et al. (2008a, b) and Muzzin et al. (2009).
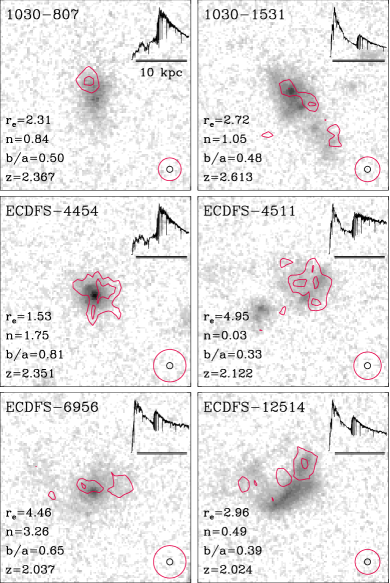
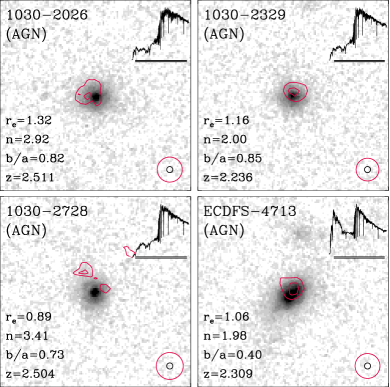
We obtained NIC2 imaging for 19 galaxies, the ones for which we obtained GNIRS spectra early on. Consequently, the NIC sample is not representative for our full sample, and slightly biased to the red. The NIC2 morphologies of the nine galaxies without detected emission lines (Kriek et al., 2006) were discussed in van Dokkum et al. (2008). Here, we add NIC2 imaging of the 10 massive emission-line galaxies (Figures 1 and 2), with SINFONI spectroscopy (Kriek et al., 2007). They were observed from 2007 July – 2008 October using the F160W filter. The total integration per galaxy is three orbits, each split in two (dithered) exposures. The data were reduced following the method by Bouwens & Illingworth (2006) and Bouwens et al. (2008).
We measure the structural parameters for each galaxy by fitting a single Sérsic (1968) radial surface brightness profile, using the two-dimensional fitting code GALFIT (Peng et al., 2002), and allowing the Sérsic -parameter to float. Thus, we assume all light is stellar. We use Tiny Tim 6.3 (Krist, 1995) to construct a synthetic NIC2 point-spread function (PSF) for each galaxy (see van Dokkum et al., 2008, for more details). The resulting fit parameters are given in Figures 1 and 2.
3. THE HUBBLE SEQUENCE AT
Figures 1 and 2 show that massive emission-line galaxies at exhibit a wide range in morphologies. In Kriek et al. (2007) we use emission-line diagnostics to determine whether star formation or active galactic nuclei (AGNs) dominate the line emission. The six massive star-forming galaxies are the largest with a median of 2.8 kpc, a median Sérsic parameter of , and half (1030-1531, ECDFS-4511, and ECDFS-12514) show irregular and clumpy morphologies. This fraction might be higher if we include the line-emitting regions (H and [N ii]), as observed by SINFONI. The galaxies hosting AGNs have sizes ( kpc), Sérsic parameters (), and spectral energy distributions (SEDs) more similar to the compact, quiescent galaxies without emission lines.
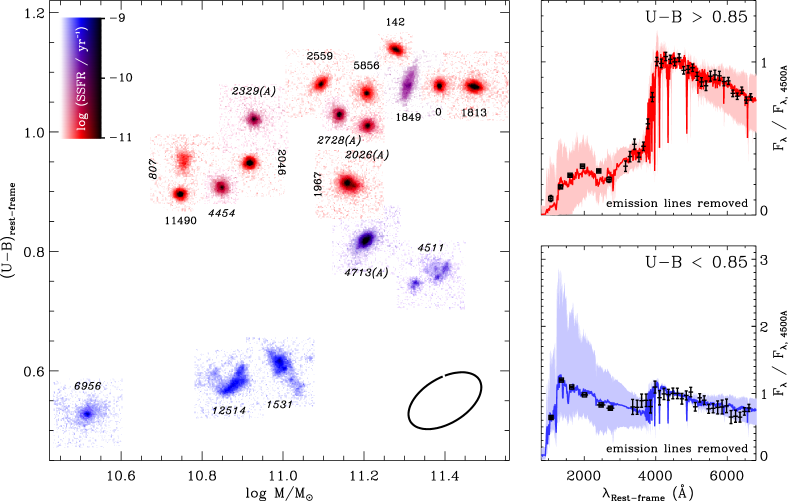
In Figure 3 we show the images of the full sample in a color–mass diagram. The stellar masses, rest-frame colors, and star formation rates (SFRs) are adopted from Kriek et al. (2008a, b, 2009). The SFRs are based on SED fits, not the H luminosities. Stellar masses and SFRs are corrected by 0.23 dex to convert from a Salpeter (1955) to a Chabrier (2003) initial mass function. The color coding reflects the specific SFR (SFR/).
There is a striking correspondence between the location of galaxies in the color–mass plane and morphology. The large (irregular) blue galaxies make up the blue cloud. The emission-line galaxies 1030-807 and ECDFS-4454, with lower specific SFRs, are closer to the red sequence and have sizes intermediate of the quiescent and star-forming galaxies. Their line maps exhibit residual star-forming regions, primarily in the outskirts. However, for ECDFS-4454 an AGN might contribute to the line emission as well (Kriek et al., 2007). Also HDFS1-1849 on the red sequence still has ongoing star formation according to the SED fit, and is likely a dusty edge-on disk. The high dust content might be the reason why we detected no emission lines for this galaxy. Three compact AGN hosts join the quiescent compact galaxies on the red sequence. The AGN host ECDFS-4713 is also compact, but has a higher specific SFR. However, in contrast to the other AGNs which are faint in the rest-frame UV, for this galaxy we cannot exclude that the UV emission might be of nuclear origin. Altogether, this diagram illustrates that structures and stellar population properties of massive galaxies at are strongly correlated.
Our results confirm previous studies based on lower resolution NIC3 or ground-based imaging of photometric galaxy samples (e.g., Toft et al., 2007; Zirm et al., 2007; Franx et al., 2008; Williams et al., 2009). Moreover, due to the higher spatial resolution, we better resolve the structures of the massive star-forming galaxies. This work extends the results by Elmegreen et al. (2007, 2009) and Förster Schreiber et al. (2009) to higher masses, suggesting that star formation in irregular and clumpy galaxies may represent the major star-forming mode beyond .
The massive Hubble sequence at is quite different from that in the local universe. First, quiescent galaxies are much more compact than local early-type galaxies (ETGs) at similar mass. Second, the galaxies with the highest SFRs () in our sample (1030-1531, ECDFS-4511, and ECDFS-12514) have irregular and clumpy structures, and thus do not resemble classical disk or spiral galaxies. Massive irregular galaxies with such high specific SFRs are very rare in the local universe. Star-forming galaxies 1030-807, HDFS1-1849, and ECDFS-6956 are structurally more similar to local massive disk galaxies, but their SFRs are also lower ().
4. DO BLUE GALAXIES HAVE DENSE CORES?
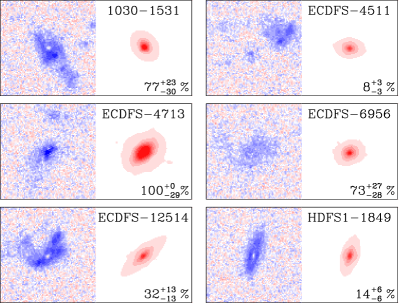
An obvious question is whether the blue star-forming galaxies are simply compact quiescent galaxies surrounded by active star-forming regions or disk with much lower mass-to-light ratios (). We assess this by examining how much of the stellar mass could be in a dense core for the six galaxies with the highest specific SFR in the total sample. For the core we assume an of 0.9 kpc, an of 3 (van Dokkum et al., 2008), and the median of the compact red-sequence galaxies. We apply the appropriate PSF and fit the brightest clump or core, leaving the axis ratio and the inclination as free parameters. The maximum mass fraction is set to 100% to ensure that unrealistic values do not occur (since star-forming populations have lower ). Figure 4 shows the compact cores and the residual images. The uncertainties on the mass fractions are dominated by variations in of the quiescent galaxies.
ECDFS-4713 , ECDFS-6956, and 1030-1531 can hide a major fraction of their stellar mass in a compact core. Thus, aside from active outer star-forming regions, they may be similar to the compact quiescent galaxies. The remaining galaxies do not seem to have such a strong light or mass concentration. However, this exercise is complicated by the effects of dust. For example, HDFS1-1849 ( = 1.6 mag) is likely a dusty edge on disk, and so there could be a hidden compact core.
In the above exercise we assume that the core has a similar to the quiescent galaxies, and thus much higher than the of the star-forming galaxies. If we were to assume a constant in the star-forming galaxies, we would infer fractions of only 29%, 76%, and 27% for 1030-1531, ECDFS-4713 and ECDFS-6956, respectively. Thus, it is crucial to study the stellar populations in the sub-components in detail to examine whether they indeed exhibit strong variations.
5. DISCUSSION
It is interesting to consider whether and how large star-forming and compact quiescent galaxies at may be evolutionary related. Below we discuss three different scenarios. The simplest conceptually is the scenario in which massive blue galaxies stop forming stars and move to the red sequence. In this scenario the massive irregular star-forming galaxies may represent the early clumpy star-forming phase, the red galaxies with residual star-forming regions may be transitional objects, and the compact quiescent systems represent the quenched phase in which galaxies live in hot halos, and only grow by (minor) red mergers. In the previous section we found that three massive star-forming galaxies might have 70%–100% of the total stellar mass in a compact core, and thus simple fading of outer star-forming regions could lead to a compact galaxy. However, the three remaining star-forming galaxies need non-passive processes, like (clump) coalescence in order to form a compact core. Irrespective of the mechanism, this requires a large increase in the stellar density of these systems.
Alternatively, compact quiescent galaxies may undergo periods of star formation and move to the blue cloud during that time. In this case galaxies may build up their outer parts by star formation. Several studies indeed show that compact quiescent galaxies grow inside-out (see Section 1), although the responsible process has yet to be identified. For this scenario, the two red galaxies with residual star forming regions, and the three star-forming galaxies with compact cores may directly exemplify this inside-out growth. However, this scenario fails for the star-forming galaxies lacking dense cores.
It is also possible that the two classes are not directly related, and follow distinct evolutionary paths. Theoretical models find that ETGs that form at later times are expected to be less compact (e.g., Khochfar & Silk, 2006). Thus, the large blue galaxies at may evolve into less compact ETGs. The typical average surface density of the star-forming galaxies presented here is , about a factor of 10 lower than those of the quiescent galaxies, but comparable to those of local ETGs. Thus the star-forming galaxies at are likely progenitor of local ETGs, as was previously found by Franx et al. (2008). Moreover, if compact, quiescent galaxies beyond evolve into the compact cores of local elliptical galaxies, it may be plausible that the massive star-forming galaxies evolve into the local S0’s. The stars in these galaxies are nearly as old as in local ellipticals, but their disk-like morphologies separates them in a structural way.
It is also interesting to consider how AGNs tie in with a possible evolutionary scenario. The fact that their hosts are more similar to red sequence galaxies, although being slightly less quiescent and less compact, may suggest that they are a transitional population. However, the AGN activity may just as well follow the star-formation activity, and the galaxy may be just temporarily “flaring up”. In this context it is interesting to note that by integrating significantly deeper, 1255-0 hosted an AGN as well, albeit less luminous (Kriek et al., 2009). We do stress though that the AGN sample may be incomplete, as our AGN identification is less appropriate for star-forming galaxies (Kriek et al., 2007).
Follow-up studies are needed to further discriminate between the different scenarios. Clustering and dynamical studies will be essential in linking the galaxy populations at different redshifts. Moreover, we need to study the stellar populations of different sub-components in massive galaxies. The combination of WFC3 and the NEWFIRM median-band survey (which provides accurate photometric redshifts and SEDs of large samples of galaxies at ; van Dokkum et al., 2009a) will enable detailed studies of larger samples of massive galaxies than presented here, to link them to lower and higher redshift populations, and thus to follow their star formation and assembly history over cosmic time.
References
- Bezanson et al. (2009) Bezanson, R., van Dokkum, P., G., Tal, T., Marchesini, D., Kriek, M., Franx, M., & Coppi, P. 2009, ApJ, 697, 1290
- Birnboim et al. (2007) Birnboim, Y., & Dekel, A., Neistein, E. 2007, MNRAS, 380, 339
- Bournaud et al. (2007) Bournaud, F., Jog, C. J., Combes, F. 2007, A&A, 476, 1179
- Bouwens & Illingworth (2006) Bouwens, R. J., & Illingworth, G. D. 2006, Nature, 433, 189
- Bouwens et al. (2008) Bouwens, R. J., Illingworth, G. D., Franx, M., & Ford, H. 2008, ApJ, 690, 1764
- Cappellari et al. (2009) Cappellari, M. et al. 2009, ApJ, submitted (arXiv:0906.3648)
- Cenarro & Trujillo (2009) Cenarro, A. J., & Trujillo, I. 2009, ApJ, 696, L43
- Chabrier (2003) Chabrier, G. 2003, PASP, 115, 763
- Cimatti et al. (2008) Cimatti, A., et al. 2008, A&A, 482, 21
- Dekel & Birnboim (2008) Dekel, A., & Birnboim, Y. 2008, MNRAS, 383, 119
- Dekel et al. (2009a) Dekel, A., et al. 2009, Nature, 457, 451
- Dekel et al. (2009b) Dekel, A., Sari, R., Ceverino, D., 2009b, ApJ, submitted (arXiv:0901.2458)
- Elias et al. (2006) Elias, J. H., et al. 2006, SPIE 6269, 139
- Elmegreen et al. (2007) Elmegreen, D. M., Elmegreen, B. G., Ravindranath, S., & Coe, D. A., 2007, ApJ, 658, 763
- Elmegreen et al. (2009) Elmegreen, D. M., Elmegreen, B. G., Marcus, M. T., Shahinyan, D., Yau, A., & Peterson, M. 2009, ApJ, 701, 306
- Elmegreen et al. (2008) Elmegreen, B. G., Bournaud, F., & Elmegreen, D. M. 2008, ApJ, 688, 67
- Förster Schreiber et al. (2009) Förster Schreiber, N. M. 2009, ApJ, submitted (arXiv:0903.1872)
- Franx et al. (2008) Franx, M., van Dokkum, P. G., Förster Schreiber, N. M., Wuyts, S., Labbé, I., & Toft, S. 2008, ApJ, 688, 770
- Gawiser et al. (2006) Gawiser, E., et al. 2006, ApJS, 162, 1
- Genzel et al. (2008) Genzel, R., et al. 2008, ApJ, 687, 59
- Khochfar & Silk (2006) Khochfar, S., & Silk, J. 2006, ApJ, 648, L21
- Kriek et al. (2006) Kriek, M., et al. 2006, ApJ, 649, L71
- Kriek et al. (2007) Kriek, M., et al. 2007, ApJ, 669, 776
- Kriek et al. (2008a) Kriek, M., et al. 2008a, ApJ, 677, 219
- Kriek et al. (2008b) Kriek, M., van der Wel, A., van Dokkum, P.G., Franx, M., & Illingworth, G.D. 2008b, ApJ, 682, 896
- Kriek et al. (2009) Kriek , M., van Dokkum, P. G., Labbé, I., Franx, M., Illingworth, G. D., Marchesini, D., & Quadri, R. F. 2009, ApJ, 700, 221
- Krist (1995) Krist, J. 1995, in ASP Conf. Ser. 77, Astronomical Data Analysis Software and Systems IV, ed. R. A. Shaw, H. E. Payne, & J. J. E. Hayes (San Francisco: ASP), 349
- Longhetti et al. (2007) Longhetti, M., et al. 2007, MNRAS, 274, 614
- Muzzin et al. (2009) Muzzin, A., Marchesini, D., van Dokkum, P. G., Labbé, I., Kriek, M., & Franx, M. 2009, ApJ, 701, 1839
- Naab et al. (2007) Naab, T., Johansson, P. H., Ostriker, J. P., & Efstathiou, G. 2007, ApJ, 658, 710
- Naab et al. (2009) Naab, T., Johansson, P. H., & Ostriker, J. P. 2009, ApJ, 699, L178
- Peng et al. (2002) Peng, C. Y., Ho, L. C., Impey, C. D., & Rix, H.-W. 2002, AJ, 124, 266
- Quadri et al. (2007) Quadri, R., et al. 2007, AJ, 134, 1103
- Salpeter (1955) Salpeter, E.E. 1955, ApJ, 121, 161
- Sérsic (1968) Sérsic, J. L. 1986, Atlas de Galaxias Australes (Cordoba: Obs. Astron.)
- Taylor et al. (2009) Taylor, E. N. et al. 2009, ApJSS, in press (arXiv:0903.3051)
- Toft et al. (2007) Toft, S., et al. 2007, ApJ, 671, 285
- Trujillo et al. (2006) Trujillo, I., et al. 2006, ApJ, 650, 18
- van Dokkum et al. (2008) van Dokkum, P. G. et al. 2008, ApJ, 677, L5
- van Dokkum et al. (2009a) van Dokkum, P. G., et al. 2009a, PASP, 121, 2
- van Dokkum et al. (2009b) van Dokkum, P. G., Kriek, M., & Franx, M. 2009b, Nature, 460, 717
- Williams et al. (2009) Williams, R. J., Quadri, R. F., Franx, M., van Dokkum, P. G., Toft, S., Kriek, M., & Labbé, I. 2009, ApJ, submitted (arXiv:0906.4786)
- Zirm et al. (2007) Zirm, A. W., et al. 2007, ApJ, 656, 66