Tracing Star Formation in Cool Core Clusters with GALEX
Abstract
We present recent results from a GALEX investigation of star formation in 16 cooling core clusters of galaxies, selected to span a broad range in both redshift and central cooling time. Initial results demonstrate clear UV excesses in most, but not all, brightest cluster galaxies in our sample. This UV excess is a direct indication of the presence of young massive stars and, therefore, recent star formation. We report on the physical extent of UV emission in these objects as well as their FUV-NUV colors, and compare GALEX inferred star formation rates to central cooling times, H and IR luminosities for our sample.
Keywords:
External galaxies and extragalactic objects: Origin, formation, evolution, age, and star formation; Astronomical Observations: Ultraviolet ( nm):
98.62.Ai; 95.85.Mt1 INTRODUCTION
Despite past evidence of star formation in “cooling flow” (hereafter referred to as CF) clusters (e.g., mcnamara89, ; crawford99, ) the fact that star formation rate (SFR) estimates differed drastically from inferred X-ray cooling rates led to doubt that the two phenomena were related. However, recent UV investigations mittaz01 ; hicks05 , Spitzer data quillen08 ; odea08 , and precision optical photometry bildfell08 have definitively shown that CF clusters are the sites of star formation, and that there is an indisputable relationship between X-ray properties and SFRs. Here we confirm and quantify this connection, using GALEX observations of a sample of 16 CF clusters.
2 SAMPLE AND OBSERVATIONS
The Galaxy Evolution Explorer (GALEX) is a space telescope with both imaging and spectroscopic capabilities in two ultraviolet wavebands, Far UV (FUV) Å and Near UV (NUV) Å martin05 . Our GALEX targets consist of 16 clusters of galaxies that exhibit strong evidence of central cooling. These objects were chosen to cover a wide range in redshift () and central (R kpc) cooling time ( Gyr). Table 1 lists the objects in our sample, their redshifts, and GALEX exposure times. All of our targets were easily detected in both GALEX wavebands, with an average SNR of 40 (21) in the NUV (FUV), and minimum SNRs of in each band.
| Cluster | Exposure (NUV/FUV) [s] | Cluster (cont.) | (cont.) | Exposure (cont.) | ||
|---|---|---|---|---|---|---|
| Abell 85 | 0.0557 | 2494 / 2494 | Hydra A | 0.0549 | 2230 / 2230 | |
| Abell 1204 | 0.1706 | 3738 / 3738 | MKW3s | 0.0453 | 2271 / 2271 | |
| Abell 2029 | 0.0779 | 1517 / 1517 | MKW4 | 0.0196 | 2194 / 2194 | |
| Abell 2052 | 0.0345 | 2863 / 2863 | MS0839.8+2938 | 0.1980 | 4729 / 4728 | |
| Abell 2142 | 0.0904 | 1556 / 1556 | MS1358.4+6245 | 0.3272 | 5614 / 5614 | |
| Abell 2597 | 0.0830 | 2111 / 2111 | MS1455.0+2232 | 0.2578 | 3385 / 3384 | |
| Abell 3112 | 0.0761 | 4873 / 2618 | RXJ1347.5-1145 | 0.4500 | 9120 / 9119 | |
| Hercules A | 0.1540 | 3870 / 3870 | ZwCl 3146 | 0.2906 | 3127 / 3127 |
3 IMAGING AND PHOTOMETRY
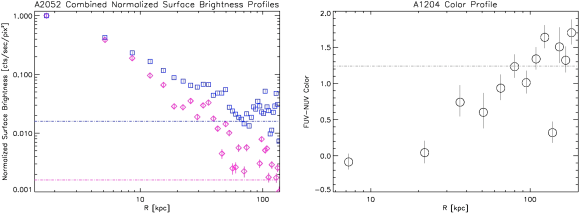
Surface brightness profiles in both wavebands were constructed for our targets in bins (the approximate size of the larger PSF). Some of these profiles indicate UV emission at greater radii than had been previously detected. The SB profiles were then used to create radial color profiles. These tend to indicate pure star formation at small radii, then become progressively redder until, at large radii, colors are consistent with those of non-star forming ellipticals gildepaz07 . An example of each is shown in Figure 1.
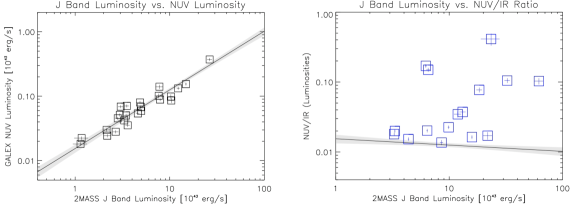
Photometry was performed in radius apertures centered on each BCG. This aperture size was chosen for compatibility with readily available 2MASS photometry. Using multiple archival GALEX observations, a control sample of 24 quiescent cluster ellipticals was obtained. These objects were used to construct a calibration relationship between UV and J band emission; effectively predicting the amount of UV light “expected” from a given old stellar popuation. This relationship was used to quantify the amount of “excess” UV light emitted by our CF sample (Figure 2). The majority of our sample exhibits clear UV excesses, indicating recent star formation.
4 MULTIWAVELENGTH COMPARISONS
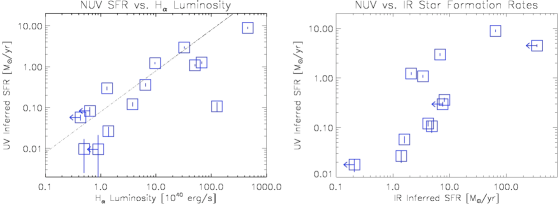
For comparative purposes only, we translated our UV excesses into star formation rates using a Starburst99 model for continuous star formation over 20 Myr leitherer99 . This timescale was chosen to grossly approximate episodic cooling timescales (during which the system undergoes feedback processes with alternating heating and cooling cycles). These SFRs were then compared to cluster properties from the literature.
H measurements for our sample were taken from crawford99 ; donahue92 ; cavagnolo09 , and are shown vs. UV inferred SFRs in Figure 3. The consistency between UV and H inferred star formation rates is remarkable, despite the many assumptions and unknowns that plague such comparisons. Infrared fluxes came from quillen08 ; edge01 ; egami06 ; donahue07 , and were converted to SFRs as in odea08 . This comparison plot is also shown in Figure 3.
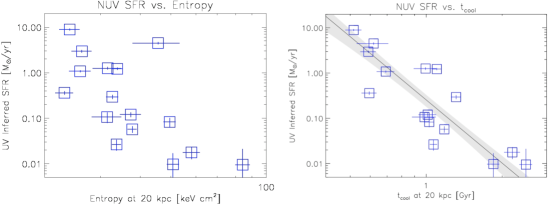
The X-ray properties of our sample come from (cavagnolo09, , plus private comm.). In Figure 4 we show UV inferred SFRs vs. both entropy and cooling time at 20 kpc from the cluster center. The correlation between UV SFR and cooling time proves conclusively that the star formation in these objects is directly related to cooling gas in the cluster cores.
5 SUMMARY
GALEX easily detects star formation in cluster BCGs out to and to unprecedented radii. In most of the CF clusters studied, we find significant UV luminosity excesses and colors in the central galaxies that together suggest recent and/or current star formation. This finding is corroborated by H and IR observations. A correlation between UV excess and central cooling time confirms that this star formation is directly and incontrovertibly related to the cooling gas.
References
- (1) B. R. McNamara, and R. W. O’Connell, Astronomical Journal, 98, 201 (1989).
- (2) C. S. Crawford et al. , Mon. Not. R. Astron. Soc., 306, 857 (1999).
- (3) J. P. D. Mittaz et al. , Astronomy & Astrophysics, 365, 93 (2001).
- (4) A. K. Hicks, and R. F. Mushotzky, Astrophyscial Journal Letters, 635, L9 (2005).
- (5) A. C. Quillen et al. , Astrophysical Journal Supplement Series, 176, 39 (2008).
- (6) C. P. O’Dea et al. , Astrophysical Journal, 681, 1035 (2008).
- (7) C. Bildfell et al. , Mon. Not. R. Astron. Soc., 389, 1637 (2008).
- (8) D. C. Martin et al. , Astrophysical Journal Supplement Series, 619, 1 (2005).
- (9) A. Gil de Paz et al. , Astrophysical Journal Supplement Series, 173, 185 (2007).
- (10) C. Leitherer et al. ., Astrophysical Journal, 123, 3 (1999).
- (11) M. Donahue, J. T. Stocke, and I. M. Gioia, Mon. Not. R. Astron. Soc., 385, 49 (1992).
- (12) K. W. Cavagnolo et al. , Astrophysical Journal Supplement Series, 182, 12 (2009).
- (13) A. C. Edge, Mon. Not. R. Astron. Soc., 328, 762 (2001).
- (14) E. Egami et al. , Astrophysical Journal, 647, 922 (2006).
- (15) M. Donahue et al. , Astrophysical Journal, 670, 231 (2007).
- (16) R. C. Kennicutt, Annual Review of Astronomy and Astrophysics, 36, 189 (1998).