Megaparsec-Scale Triggers for Star Formation: Clusters and Filaments of Galaxies in the Horologium-Reticulum Supercluster
Abstract
Specific indications of star-formation are presented within cluster and filament galaxies that are members of the Horologium-Reticulum supercluster (HRS, ). These indicators arise from multi-wavelength observations, primarily emission lines from optical spectroscopy and faint excess from radio continuum (1.4 GHz) photometry. HRS galaxies exhibiting current star formation are consistent with previous studies in that the star-forming populations organize around megaparsec-scale filament axes as well as near the cluster core. Therefore with support from optical photometry, mechanisms for triggering star formation in these galaxies are most likely due to merger interactions in lower density (and lower velocity) environments and possible bursts prior to stripping within the higher density (and higher velocity) environments.
1 Overview
The supercluster environment and its constituent structures have a role in the processes of galaxy star formation and its associated triggering mechanisms. Mature (low ) and dense superclusters () like the Horologium-Reticulum supercluster (HRS) of galaxies are the products of the formation of rich galaxy clusters, and they are also dependent on the evolution of mature voids ( Mpc). By using specific examples from the HRS, the purpose is to present some of the recent results in galaxy supercluster studies as they relate to star formation in galaxies.
The HRS is one of the largest supercluster complexes of galaxies in the low universe (, Fleenor et al. 2005). A rich dataset comprised primarily of optical spectroscopy and radio continuum photometry over small (e.g., deg2, Johnston-Hollitt et al. 2008) and wide ( deg2, Fleenor 2006) areas on the sky has provided the context for examining star formation on a variety of scales. In fact, knowledge of the the supercluster environment via such a comprehensive dataset provides a key in connecting the specific indications of star formation with their respective mechanism(s). The presentation of the results will follow an order-of-magnitude approach in obtaining perspectives of the supercluster environment on the scales of 100, 10, and 1 megaparsecs.
2 “Supercluster–Void Network,” on the scale of 100 megaparsecs
It is well-known that superclusters of galaxies are regions of higher galaxy density and are populated by a larger percentage of quiescent, early-type galaxies (e.g., Einasto et al. 2007, Tab. 1), which follows from a general understanding of the morphology-density relation extended out to galaxy superclusters (Goto et al. 2003; Gray et al. 2004). Therefore as a whole, star forming galaxies are seemingly less-likely to reside within superclusters when compared to field galaxies. However running counter to the suppression of star-formation in galaxies due to dense environments, some studies find an enhancement of star formation associated with galaxy filaments that stretch on the order of 10–50 Mpc (e.g., Porter et al. 2008; Pandey & Bharadwaj 2008). One potential cause for this enhancement is thought to occur due to an increase in low-velocity galaxy mergers or recent tidal interaction that occur more readily in gas-rich, poorer groups.
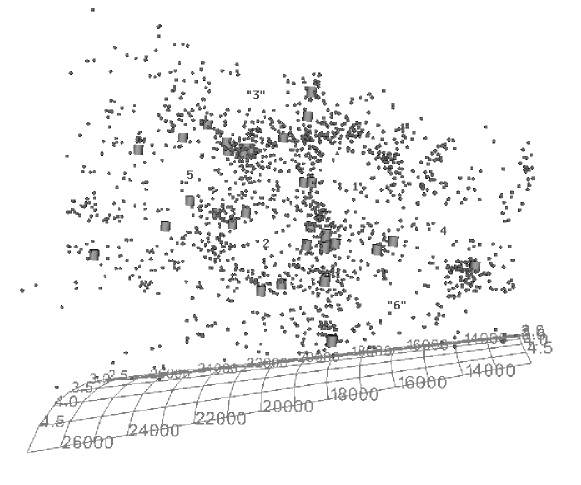
The increase in galaxy density within superclusters is not uniform, where clusters and filaments with higher density are contrasted against voids of lower density. Figure 1 shows the HRS survey volume as presented with the interactive, 3D visualization tool, GyVe (Miller et al. 2006). Specifically, intercluster galaxies are shown by the filled gray spheres, galaxy clusters by the filled cylinders, and mature voids ( Mpc) with numbers. These mature voids are completely absent of the fairly bright galaxies () selected for our survey (Fleenor et al. 2005), which was carried out in conjunction with the six-degree field galaxy survey (6dFGS, Jones et al. 2004). Particular to the case of star formation, filaments of galaxies that stretch on the order of 10–50 Mpc are detected on the peripheries of mature voids (, Fleenor 2006).
3 Filaments of Galaxies, on the scale of 10 megaparsecs
Guided by the understanding that merger interactions are potentially heightened in supercluster filaments and the observation that void peripheries contain such filamentary structures in the HRS, galaxies located at the void periphery are examined for enhanced star formation and for understanding the mechanism(s) provoking the enhancement. Similarly, Ceccarelli et al. (2008) used Sloan and 2dF observations of galaxies in ‘void walls’ to show that there are increases in star formation occurring in bluer galaxies across a wide range in both luminosity and local density. Ceccareli et al. attribute the modulation in star formation within these galaxies to the differing evolutionary history that void galaxies undergo (i.e., less disruptive) when compared with normal field galaxies.
To quantify the amount of star formation taking place in galaxies located within (i.e., the void rim), the H emission line equivalent widths (EW) were measured from the 6dFGS spectra. Galaxies are classified as “active star formers” when they display an EW(H) Å (This value correlates closely with the 2dFGRS that also indicates star formation, Madgwick et al. 2002). When comparing the ratios of star-forming and passive galaxies in void rims to those in Einasto et al., we find that active star-formation is elevated in bright () galaxies by 30% above normal levels in the supercluster (210 of 417 total 6dF galaxies).
To gain a better understanding of the characteristics of the active star-forming galaxies, Figure 2 shows a representative color-magnitude relation (CMR) for void rim galaxies in the HRS. Open circles represent galaxies in the void rim and filled circles represent galaxies that have measurements consistent with active star formation. While the and photometric measures are subject to modest errors (mags), most of these star forming galaxies are above (from Norberg et al. 2002, in the 2dFGRS). Therefore, our results are consistent with previous studies in showing a range of luminosities undergoing active star formation, but they do not seem tightly correlated with explicitly bluer populations.

Since the CMR does not show a definite color segregation for the active star-forming galaxies, photometric images are examined for signature signs of merging activity (e.g., faint near neighbors, asymmetric or warped disks, etc.). Of the active star-forming galaxies in the 6dF void rims, approximately half (%) contain some signature of interaction. Figure 3 shows representative examples of closely-neighbored, star-forming galaxies, often between brighter star-forming galaxies and faint bluer galaxies (, ) from the total sample of 210 galaxies. The moderate density environment of filaments combined with the low velocities consistent with void evolution seem to suggest that conditions are favorable for tidal and merging interactions.
4 Galaxy Clusters, scales of 1 megaparsec
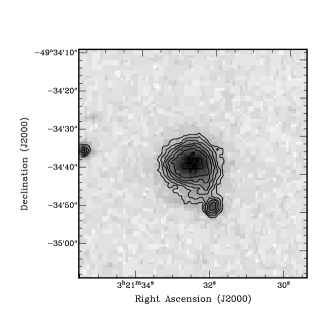
With detailed information of the HRS filament–cluster network (Fleenor 2006), plus recent results linking star formation to the infall region around galaxy clusters along filament axes (e.g., Porter et al. 2008), the view of the HRS is now restricted to the periphery of the rich galaxy cluster, A3158. Specifically, A3158 is a member of a 10 Mpc intercluster filament that forms a large portion of the southern HRS (Fleenor 2006). Furthermore, the 1.4 GHz luminosity function of A3158 at radio wavelengths shows an apparent suppression of AGN-type emission at higher radio power when compared with representative galaxy clusters, which is interpreted as a cluster in the later stages of merging (Venturi et al. 2000; Johnston-Hollitt et al. 2008). In combination with the suppression of emission at higher radio power around the cluster, Johnston-Hollitt et al. also find a significant excess of low-power radio galaxies at 1.4GHz (i.e., W Hz-1) seemingly aligned with the A3158 intercluster filament axis that also contains two, bright cD galaxies (see Fig. 10, Johnston-Hollitt et al. 2008). Such values of radio emission are often associated with star-formation occurring at modest rates, SFR yr-1 (Yun et al. 2001).
Having identified a potential population of star-forming galaxies using statistical measures (i.e., radio source counts and luminosity function), the characteristics of these galaxies are examined to better understand the mechanism(s) responsible for the burst of star-formation. While it has recently been observed that galaxies along filament axes undergo a burst of star formation at larger distances (2 Mpc, Porter et al. 2008), many of the low-power radio galaxies in A3158 are located at projected distances of Mpc (less than the virial radius). So deep within the cluster core, it is expected that star-formation mechanisms must coincide with higher velocities caused by the gravitational potential. Coupled with the previous observations of a relatively large axi-symmetric X-ray temperature distribution (Ohta et al. 2001), which also aligns with the radio galaxy–intercluster filament axis, stripping-induced star formation within the fainter and bluer populations of radio galaxies is a plausible mechanism. Some radio galaxies located at these distances also exhibit optical emission ( and H, Katgert et al. 1998) also consistent with a star-forming population (but is not required, see Owen et al. 2005). ICM stripping is also observed in detail for similar cluster galaxies (bluer and fainter) at equivalent distances, where galaxy transformations are apparently occurring (e.g., Crowl et al. 2005).
5 Conclusions
A rich, multi-wavelength dataset reveals the HRS to contain a variety of filamentary substructures that seem to facilitate star-formation in member galaxies. Specifically, statistical measures based on optical (EWs) and radio (source counts) datasets indicate the presence of enhanced star-forming populations in both lower density (void periphery) and higher density (cluster) environments. In both cases, galaxy filaments apparently aid the density-specific mechanisms. Filaments are effective organizers of material to provide a low-velocity environment with increased density, where star formation mechanisms like mergers and tidal interactions can operate effectively (Fig. 3). In higher density environments with increased infall velocities, galaxy filaments appear to be conduits for ICM interactions (like stripping) within fainter and bluer members (Johnston-Hollitt et al. 2008).
Acknowledgments.
MCF thanks J.A. Rose and M.E. Potts for their collaborative efforts. MCF also recognizes generous funding from the Roanoke College internal research grant program.
References
- Ceccarelli et al. (2008) Ceccarelli, L., Padilla, N., & Lambas, D. G. 2008, MNRAS, 390, L9
- Crowl et al. (2005) Crowl, H. H., Kenney, J. D. P., van Gorkom, J. H., & Vollmer, B. 2005, AJ, 130, 65
- Ebeling et al. (1996) Ebeling, H., Voges, W., Bohringer, H., Edge, A. C., Huchra, J. P., & Briel, U. G. 1996, MNRAS, 281, 799
- Einasto et al. (2007) Einasto, M., et al. 2007, A&A, 464, 815
- Fleenor et al. (2005) Fleenor, M. C., Rose, J. A., Christiansen, W. A., Hunstead, R. W., Johnston-Hollitt, M., Drinkwater, M. J., & Saunders, W. 2005, AJ, 130, 957
- Fleenor (2006) Fleenor, M. C. 2006, Ph. D. thesis, University of North Carolina
- Goto et al. (2003) Goto, T., Yamauchi, C., Fujita, Y., Okamura, S., Sekiguchi, M., Smail, I., Bernardi, M., & Gomez, P. L. 2003, MNRAS, 346, 601
- Gray et al. (2004) Gray, M. E., Wolf, C., Meisenheimer, K., Taylor, A., Dye, S., Borch, A. & Kleinheinrich, M. 2004, MNRAS, 347, L73
- Johnston-Hollitt et al. (2008) Johnston-Hollitt, M., Sato, M., Gill, J. A., Fleenor, M. C., & Brick, A.-M. 2008, MNRAS, 390, 289
- Jones et al. (2004) Jones, D. H., and the 6dFGS team 2004, MNRAS, 355, 747
- Katgert et al. (1998) Katgert, P., et al. 1998, A&AS, 129, 399
- Madgwick et al. (2002) Madgwick, D. S., and the 2dFGRS team 2002, MNRAS, 333, 133
- Miller et al. (2006) Miller, J., Quammen, C., & Fleenor, M. C. 2006, IEEE Trans., 12, 1149
- Norberg et al. (2002) Norberg, P., and the 2dFGRS team 2002, MNRAS, 336, 907
- Ohta et al. (2001) Ohta, Y. et al. 2001, in New Century of X-ray Astronomy, ed. Inoue, H., & Kunieda, H., 474
- Owen et al. (2005) Owen, F. N., Ledlow, M. J., Keel, W. C., Wang, Q. D., & Morrison, G. E. 2005, AJ, 129, 31
- Pandey & Bharadwaj (2008) Pandey, B. & Bharadwaj, S. 2008, MNRAS, 387, 767
- Porter et al. (2008) Porter, S. C., Raychaudhury, S., Pimbblet, K. A., & Drinkwater, M. J. 2008, MNRAS, 388, 1152
- Venturi et al. (2000) Venturi, T., Bardelli, S., Morganti, R., Hunstead, R. W. 2000, MNRAS, 314, 594
- Yun et al. (2001) Yun, M. S., Reddy, N. A., Condon, J. J. 2001, ApJ, 554, 803