A Spatially Resolved Map of the Kinematics, Star-Formation and Stellar Mass Assembly in a Star-Forming Galaxy at =4.9
Abstract
We present a detailed study of the spatially resolved kinematics, star-formation and stellar mass in a highly amplified galaxy at behind the lensing cluster MS 1358+62. We use the observed optical, near- and mid-infrared imaging from HST ACS & NICMOS and Spitzer IRAC to derive the stellar mass and the Gemini/NIFS IFU to investigate the velocity structure of the galaxy from the nebular [Oii]3726.8,3728.9 emission. Using a detailed gravitational lens model, we account for lensing amplification factor 12.52.0 and find that this intrinsically L∗ galaxy has a stellar mass of M⋆=72108M⊙, a dynamical mass of Mdyn=31109csc2(i) M⊙ (within of 2 kpc) and a star-formation rate of 428 M⊙ yr-1. The source-plane UV/optical morphology of this galaxy is dominated by five discrete star-forming regions. Exploiting the dynamical information we derive masses for individual star-forming regions of M108-9M⊙ with sizes of 200 pc. We find that, at a fixed size, the star-formation rate density within these Hii regions is approximately two orders of magnitude greater than those observed in local spiral/starburst galaxies, but consistent with the most massive Hii regions in the local Universe such as 30 Doradus. Finally, we compare the spatially resolved nebular emission line velocity with the Ly and UV-ISM lines and find that this galaxy is surrounded by a galactic scale outflow in which the Ly appears redshifted by 150 km s-1 and the UV-ISM lines blue-shifted by -200 km s-1 from the (systemic) nebular emission. The velocity structure of the outflow mirrors that of the nebular emission suggesting the outflow is young (15 Myr), and has yet to burst out of the system. Taken together, these results suggest that this young galaxy is undergoing its first major epoch of mass assembly.
keywords:
galaxies: high-redshift — galaxies: evolution; — galaxies: star formation rates, dynamics, — galaxies: individual: MS 1358+62arc1 Introduction
Deep imaging surveys, particularly with Hubble Space Telescope (HST) have now uncovered thousands of star-forming galaxies in the redshift range (eg. Ouchi et al. 2004; Giavalisco et al. 2004; Yoshida et al. 2006; Beckwith et al. 2006; Bouwens et al. 2007). Studying such galaxies are key steps towards understanding the physical processes that drive galaxy formation in the early Universe, probing the properties of galaxies when they formed their first generation of stars. Concentrated follow-up of Lyman-break galaxies at this epoch has provided estimates of stellar masses (109-10M⊙), ages (150-300 Myr) and hence inferred star-formation rates of a few 10’s M⊙ yr-1 (Verma et al., 2007; Stark et al., 2009; McLure et al., 2009). With high specific star-formation rates, these young galaxies are likely assembling their first significant stellar mass. Moreover, since this epoch is within 300 Myr of the end of reionisation (assuming reionisation was completed by 6) many of these galaxies should have been actively star-forming at 7. As such, probing the ubiquity of star-forming galaxies, the ionising photon density from star-formation and their relation to AGN are important issues, potentially allowing us to understand how and when the first galaxies were assembled and how the Universe was reionised. Moreover, theoretical models suggest that the most rapid epoch of dark halo assembly for galaxies such as the Milky-Way occur at 5 (Mo & White, 2002; Okamoto et al., 2005). Through detailed studies of the physical properties of galaxies at this epoch (such as masses and star-formation rates), we can accurately assess their contribution to the mass growth of galaxies like the Milky-Way, and their effect on the gaseous IGM.
Indeed, one of the key findings in recent years is the discovery that a significant fraction of high-redshift galaxies are surrounded by “superwinds” (e.g. Franx et al. 1997; Pettini et al. 2002b; Shapley et al. 2003; Bower et al. 2004; Wilman et al. 2005; Swinbank et al. 2007) – starburst and/or AGN driven outflows which expel gas from the galaxy potential and hence play no further role in the star-formation history of the galaxy. Such feedback processes may offer natural explanations to the shape and normalisation of the local luminosity function (Benson et al., 2003; Bower et al., 2006; Croton et al., 2006) and offer natural explanations as to why only 10% of the baryons cool to form stars (White & Rees, 1978; Balogh et al., 2001). Although velocity offsets between star-forming regions and outflowing gas of several hundred km/s have been measured (suggestive of large scale outflows), constraining the geometry and mass loading is vital to test whether the outflows are truly large-scale (as often observed in low-redshift Ultra-Luminous Infrared Galaxies (ULIRGS); Martin 2005), or whether the outflows are confined to individual star-forming regions. Such constraints are vital in order to test whether the outflowing material escapes into the IGM, or whether it eventually stalls, fragments and drains back down onto the galaxy disk, causing further bursts of star-formation.
However, probing the masses, star-formation rates, and interaction between star-formation and gas dynamics which are routine at 2 (eg. Genzel et al. 2006; Förster Schreiber et al. 2006; Swinbank et al. 2006b; Law et al. 2007; Stark et al. 2008; Lehnert et al. 2009; Law et al. 2009) are difficult beyond 3 due to a combination of surface brightness dimming and the smaller physical sizes of the earliest systems (and the strong evolution in the UV luminosity function between 3–6 means there are fewer luminous sources; eg. Stark et al. 2009). Prior to the launch of James Webb Space Telescope (JWST) one particularly appealing route to study the internal structures of primitive galaxies at is to target galaxies which have been highly magnified by their serendipitous alignment with a foreground massive cluster. The lensing magnification (up to a factor 30 in the most extreme cases) has two effects: the galaxy image is amplified at a fixed surface brightness so that the galaxy image appears both brighter and larger. By combining gravitational lensing with resolved spectroscopic imaging, detailed maps of the sizes, dynamics and hence masses of both young galaxies and even starburst/Hii regions within these galaxies can be made. Such observations can be used to investigate whether the physical conditions for star-formation were significantly different from comparably luminous galaxies at and galaxies today. Indeed, gravitational lensing and resolved spectroscopic imaging has been used to investigate galaxy dynamics on 1 kpc scales from –3 (eg. Swinbank et al. 2003, 2006a; Salucci et al. 2007; Nesvadba et al. 2006), whilst coupling lensing with adaptive optics (AO) source-plane studies can even reach 100 pc (Stark et al. 2008; Jones et al. 2009 in prep).
Studying the physical processes of galaxy formation on scales comparable to the largest Hii regions is likely to have broad implications for our understanding of the dominant mechanism by which galaxies at high redshift assemble their stellar mass, and what processes drive the star-formation activity (Bournaud & Elmegreen, 2009). For example, recent hydro-dynamical simulations have suggested that continuous gas accretion (so-called “cold-flows”) may play an important role in driving star-formation at (Davé, 2008; Dekel et al., 2009). In such models, these cold streams keep the rotating disk configuration intact, but with turbulent star-forming clumps which eventually merge to form a central spheroid. This is a provocative result, as it has generally been accepted that major mergers are the dominant mechanism by which massive galaxies assemble their stellar mass (Conselice et al., 2008). However, to test such models in detail, the galaxy velocity field and the turbulent speeds on scales comparable to individual Hii regions in a large sample of high-redshift, star-forming galaxies are required. Resolved dynamics of galaxies at have lent support to the cold-stream model, but at the spatial scales available in non-lensed galaxies (1–4 kpc) it is difficult to draw definitive conclusions. Nevertheless, the advances in instrumentation (particularly sensitive integral-field units and AO) are beginning to allow studies of the kinematics, distribution of star-formation, gas and stars and chemical properties in high-redshift star-forming galaxies which can be fed into (and thus test) numerical simulations.
In this paper we report the detailed follow-up of a lensed galaxy at behind the lensing cluster MS 1358+62, first studied in detail by Franx et al. (1997). We use the HST ACS & NICMOS imaging to investigate the rest-frame UV/optical morphology. Together with Spitzer IRAC imaging we construct the spectral energy distribution (SED) to estimate the stellar mass. Using the Gemini/NIFS integral field unit we map the [Oii]3726.2,3728.9 emission line strength and dynamics, distribution of star-formation and outflow energetics. We have adopted a standard CDM cosmology with , and . All quoted magnitudes are on the AB system.

2 Observations and Data Reduction
2.1 Optical-, near- and mid-infrared imaging
Details of the optical, near- and mid- infrared observations of this galaxy cluster are given in Richard et al. (2008). Briefly, the lensing cluster MS 1358+62 (zcl=0.33; : 13:59:50 : +62:31:05, J2000) was observed with HST ACS and NICMOS as part of program PID: 9717 & 10504 using the 435W, 475W, 625W, 775W, 850LP, F110W and F160W filters with integration times 5.4-16 ks each in the optical bands and 19 ks each in the near-infrared bands. The optical and near-infrared imaging reach typical 5 depths of AB=26.5–27.5 magnitudes. We also include -band photometry from Soifer et al. (1998) which reaches a 5 sensitivity of 23. The Spitzer IRAC 3.6, 4.5, 5.8 and 8.0m imaging comprises 2.4 ks in each band, reaching 5 depths of AB24 (Richard et al., 2008).
The arc lies approximately 21′′ south west of the brightest cluster galaxy at : 13:59:48.7 : +62:30:48.34 (J2000) and was discovered during a spectroscopic survey of this cluster by Franx et al. (1997) in which the redshifted Ly and UV-ISM lines were used to derive an unambiguous redshift of (a companion galaxy at the same redshift located approximately 200 kpc away in the source-plane was also discovered during the same survey). In Fig. 1 we show a true-colour HST ACS band image of the cluster core around the arc. We also show an ACS/NICMOS -band true-colour image, as well as thumb-nails around the galaxy in the four IRAC images showing that the galaxy is detected from -band to the IRAC 8.0m channel.
To calculate the photometry of the lensed galaxy we first consider the bright elliptical galaxy locate 6′′ due East (which has a low surface brightness halo which extends beyond the galaxy image). We construct a model of the elliptical galaxy surface photometry using the iraf bmodel ellipse fitting algorithm (Jedrzejewski et al., 1987) (we note that we mask the galaxy image during the fit). In this model, the surface photometry includes the Fourier coefficient (which is necessary to describe the boxiness of the isophotes), but all other Fourier terms were forced to zero. We then subtract the best fit model from the galaxy image and then use sextractor (Bertin & Arnouts, 1996) to estimate the residual background within the frame. Since accurate colours are required to derive the spectral energy distribution we calculate the magnitude of the lensed galaxy in the various pass bands using an elliptical aperture (approximately 31.5′′ centered on the first image of the arc as covered by the NIFS IFU). This aperture is constructed from the coadded - and -band images since these represent the highest signal-to-noise in the z=4.92 arc. The same aperture is then applied to all of the images to measure the photometry. In the IRAC channels we apply an aperture correction to account for the flux lying outside the aperture (0.6-0.8 magnitudes from 3.6–8.0m) as determined from bright (unsaturated) point sources in the image.
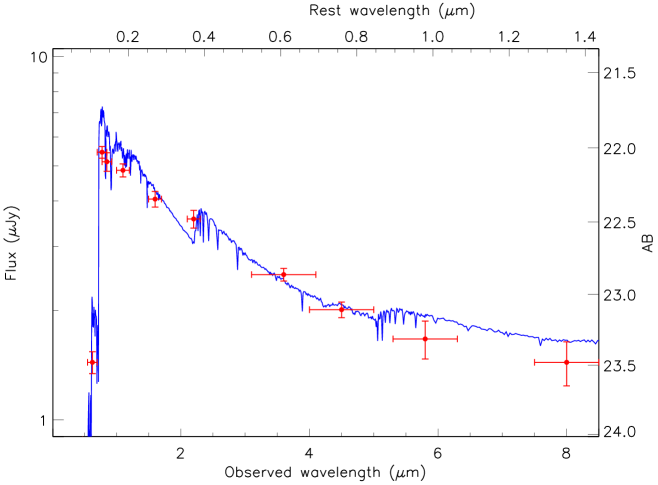
In Table 1 we give the observed photometry of the galaxy from the HST ACS & NICMOS and Spitzer IRAC imaging and in Fig. 3 we show the observed photometry with the best fit model SED overlaid (see § 3.2). We note that the large error-bars (particularly at 5.8 and 8.0m) reflect the uncertainty in recovering the photometry from the arc after modeling and removing the foreground elliptical galaxy which dominates the light, particularly at the reddest wavelengths. We also note that there is MIPS 24m coverage of this cluster with a bright source at the position of the galaxy. However, due to the blending with the foreground lensing galaxy (located 6′′ East), it is not possible to reliably deblend the photometry from the elliptical galaxy.
2.2 Spectroscopic Imaging

Three dimensional spectroscopic imaging observations around the redshifted [Oii]3726.2,3728.9Å emission line were taken with the Gemini-North Near-Infrared Integral Field Spectrometer (NIFS) between 2006 February 08 and 2006 February 09 during science verification time.
The Gemini-NIFS IFU uses an image slicer to take a 3.03.0′′ field and divides it into 29 slices of width 0.103′′. The dispersed spectra from the slices are reformatted on the detector to provide 2-dimensional spectro-imaging, in our case using the -band grism covering a wavelength range of 2.00–2.43 m. The observations were performed using an ABC configuration in which we chopped by 6′′ to blank sky to achieve sky subtraction. Individual exposures were 600 s and each observing block was 3.6 ks, which was repeated four times for resulting in an integration time of 14.4 ks (with a total of 9.6 ks on source and 4.8 ks on sky).
We reduced the data with the standard Gemini iraf nifs pipeline which includes extraction, sky subtraction, wavelength calibration, and flat-fielding. Residual OH sky emission lines were removed using the sky-subtraction techniques described in Davies (2007). To accurately align and mosaic the individual datacubes we created white light (wavelength collapsed) images around the redshifted [Oii] line from each observing block and centroid the galaxy within the data cube. These were then spatially aligned and co-added using an average with a 3 clipping threshold to remove remaining cosmetic defects and cosmic rays. Flux calibration was carried out by observing a bright A0V standard star (HIP 78017) at similar airmass to the target galaxy immediately after each observing block. From the reduced standard star cube, we measure a -band seeing of FWHM=0.45′′. We note that accounting for lensing amplification factor 12.52.0 (derived in §3) this corresponds to a source-plane FWHM of 0.6 kpc. The spectral resolution of the data (measured from the sky-lines at 2.2m) is =5300 which corresponds to =3Å or 25 km s-1. In all following sections, quoted line widths are deconvolved for the instrumental resolution.
3 Analysis
3.1 Lens modeling
We first estimate the amplification of the galaxy by making use of the updated gravitational lens model from Richard et al. (2008). Fig. 1 shows the cluster region around the lensed galaxy with the best-fit critical curve overlaid. Using the mapping between image and source-plane co-ordinates, we ray-trace the galaxy image and reconstruct the source-plane morphology, deriving a luminosity weighted magnification factor =12.52.0 (which corresponds to m=2.70.2 magnitudes). The error-bar on is derived by ray-tracing the family of acceptable gravitational lens models which adequately reproduce the multiply-imaged galaxies in the cluster.
Accounting for lensing amplification, the intrinsic magnitude of the galaxy is . For comparison, deep imaging surveys of Lyman-break galaxies at 5 have derived an of suggesting that the galaxy studied here is typical of the UV-continuum selected samples at this redshift (eg. Ouchi et al. 2004).
In Fig. 2 we show the reconstructed source-plane image of the galaxy which shows that the rest-frame UV/optical morphology is elongated, but is dominated by two star-forming regions separated by 4 kpc with at least four more lower-surface brightness regions within the galaxy and surrounded by a low surface brightness halo.
To estimate the size of the source-plane PSF in each band, we first measure the size of the PSF using the 19 star located 5′′ due south of the arc, which has a FWHM=0.10, 0.33, 0.30′′ in the observed -, - and -bands respectively. The two largest star-forming regions (at approximately [1.8,2.0] and [-1.0,-2.1] kpc in Fig. 2) have an -band FWHM which is marginally resolved (FWHM=0.170.03′′), but both are unresolved in and -bands. Since the lensing amplification of the source has a preferential direction, we reconstruct the source-plane image of the star at the locations of the brightest star-forming regions and find that the ACS PSF transforms to 0.060.014′′, (32085 pc). Both of the brightest two Hii regions are marginally resolved in the -band imaging (FWHM=0.170.03′′ and FWHM=0.150.04 for regions and in Fig. 1 respectively) corresponding to FWHM=500100 pc and FWHM=400150 pc (deconvolved for PSF). We note that the size of the largest of these two Hii regions is comparable to the size measured by Franx et al. (1997) (FWHM390 pc) from HST WFPC2 observations. In the - and -bands, the source-plane PSFs is approximately 800220 pc and 3001 kpc in the NIFS [Oii] emission line map. We therefore conservatively suggests sizes of FWHM500 and 400 pc in - and -bands respectively and 600 pc in the Oii emission line map for the two Hii regions, & respectively. We discuss the implications of these sizes in §3.6, but note that clearly higher spatial resolution IFU observations using laser-guide star AO would be very valuable to further constrain their sizes.

3.2 Stellar mass
Soifer et al. (1998) use optical and near-infrared photometry to estimate the stellar mass in this galaxy, deriving M⋆=2–16109M⊙. Here, we make use of the much deeper ACS/NICMOS and, particularly IRAC imaging in order to improve the estimate of the stellar mass. We infer the stellar mass of the galaxy by fitting the latest Charlot & Bruzual (2007) (hereafter CB07) stellar population synthesis models to the observed SED (which include an improved treatment of the thermally-pulsating asymptotic giant branch (TP-AGB) phase of stellar evolution). Following Stark et al. (2009), we allow 200 age steps from 105 to 109 yr (approximately logarithmically spaced), with a Salpeter (1955) initial mass function (IMF) and consider both a solar and sub-solar (0.2 Z⊙) metallicity. We fit both constant star-formation histories and exponentially decaying () models with -folding decay times of 100 Myr. We consider the effects of dust in the modeling by adopting the Calzetti et al. (1994) reddening law (using colour excesses of =0.0, 0.03, 0.05, 0.1, 0.3 & 1.0). The resulting template SEDs are convolved with the filter response curves, and by comparing the observed magnitudes and their associated errors, we compute a reduced value for each set of parameters (age, and normalistation). The 1 uncertainties are calculated from the parameter range which produce =1 with respect to the best fit SED (whilst marginalising over the other free parameters).
For consistency, we first model the -band galaxy photometry from Soifer et al. (1998), deriving acceptable solutions with =0.06–0.4, ages=1106-9 Myr and stellar masses of M⋆=1109–41010 M⊙ (which is consistent with Soifer et al. 1998). However, the much deeper HST ACS/NICMOS and Spitzer photometry ( & IRAC 3.6,4.5,5.8,8.0m) allows much better constraints to be derived, and we infer a best fit SED with an age of 147 Myr, an =0.050.05 and a stellar mass of =72108 M⊙, with a 0.2 Z⊙ metallicity template marginally prefered over solar metallicity (although formally the difference in is less than 1 between the two). We note that the constant star-formation and models provide equally good fits to the data, with stellar masses which vary by 5%. We also attempt fits excluding the IRAC 5.8 & 8.0m photometry, but the resulting stellar mass and age agree within the 1 errors. We note that the stellar mass derived here is significantly lower (at least a factor 3) than that derived by Soifer et al. 1998, which most likely arises due to the improved photometric constraints and very young age as suggested by the IRAC photometry.
3.3 Star-formation rate and dynamics
Next we use the spatially resolved [Oii]3726.8,3728.9 emission line maps from our NIFS IFU observation to estimate the distribution of star-formation and dynamics within the galaxy. As Fig. 1 shows, the nebular line emission is clearly patchy, and dominated by the brightest regions seen in the ACS and NICMOS imaging. Collapsing the brightest regions within the galaxy we find that the integrated [Oii] emission line flux is =1.50.310. Accounting for an amplification factor (=12.52.0) and using the conversion between [Oii] emission line flux and star-formation rate from Kennicutt (1998) we derive an intrinsic star-formation rate of =428 M⊙ yr-1 (uncorrected for reddening). This star-formation rate is consistent with the 3 upper-limit of SFR80 M⊙ yr-1 (corrected for lensing) from SCUBA 850m imaging (Knudsen et al., 2008). We note that if the star-formation rate derived from the [Oii] emission line flux (=428 M⊙ yr-1) has been sustained, then it takes just 15 Myr to build a stellar mass of M⋆=7108 M⊙, suggesting the current burst may be the first major episode of star-formation within this galaxy (which is also consistent with the young SED). It is also useful to note that the starburst intensity (SFR/area) for the galaxy (S41011 L⊙ kpc-2) is comparable with local- (eg. Meurer et al. 1997) and high redshift- (eg. Giavalisco et al. 1996; Steidel et al. 1996) galaxies, suggesting the same mechanisms may limit the starburst intensity at 5 as those at lower redshifts.
We also use the spatially resolved [Oii] emission line doublet from the NIFS IFU observations to investigate the dynamics of the galaxy. By collapsing the velocity field from the brightest regions within the datacube we derive a peak-to-peak velocity gradient of =18020 km s-1 across 4 kpc in projection (Fig. 5). If these dynamics reflect virialised motion within a bound system, then we estimate a dynamical mass of Mdyn(2 kpc)=31109csc2(i) M⊙. Adopting a canonical inclination of 30∘ suggests a dynamical mass of M1010M⊙. Alternatively, the dynamical mass can also be estimated via the velocity dispersion using the relation Mdyn=. The factor depends on the galaxy mass distribution and velocity field, and ranges from C1 to 5 (depending on the mass density profile, velocity anisotropy and relative contribution to from random motion, rotation and assumption of spherical or disk-like system; see Erb et al. (2006) for a detailed discussion). Adopting =3.4 (such that a direct comparison to star-forming galaxies at =2–3 can be made; Erb et al. 2006), we derive a dynamical mass of M M⊙. This dynamical mass is approximately 6-10 smaller than the median Lyman-break galaxy mass at 3 for which masses have been measured using similar techniques (eg. Erb et al. 2006; Förster Schreiber et al. 2006; Law et al. 2009), but comparable to that of the only other star-forming galaxy at these redshifts with measured nebular emission line dynamics (RCS0224-002 arc at z=4.88; Swinbank et al. 2007). We also note that the inferred dynamical mass is much larger than the stellar mass. If the central regions are baryon dominated, this may suggest that the gas reservoir makes up 75–90% of the baryons. Clearly observations of the cold molecular gas (such as the redshifted CO(1-0) or CO(3-2)) would be required to test this.
Next, we investigate the properties of individual star-forming regions within the galaxy. In Fig. 4 we show the extracted the spectra from the strongest line emitting regions from the galaxy. The two largest star-forming regions in Fig 1 have velocity dispersions of =8615 and =8015 km s-1. Taken with their sizes derived above we derive masses of star-forming regions of order 6–9108 M⊙ (we note that in calculating these masses, we have used the same value of as above for simplicity), and star-formation rates of SFR0=121 and SFR4=61 M⊙yr-1 respectively suggesting that up to half of the total star-formation is occurring within two dense regions and outside the nuclear regions.
Table 1.
Observed Aperture Photometry for MS 1358+62arc
| Filter | mag (AB) |
|---|---|
| 26.5 | |
| 23.500.08 | |
| 22.050.05 | |
| 22.120.05 | |
| 22.180.08 | |
| 22.380.08 | |
| 22.520.20 | |
| 3.6 m | 22.900.10 |
| 4.5 m | 23.140.10 |
| 5.8 m | 23.430.25 |
| 8.0 m | 23.500.25 |
Note. – To convert to intrinsic magnitudes (corrected for the lensing amplification factor ) add 2.7 mags.
3.4 Comparison with rest-frame UV
Franx et al. (1997) discuss the morphology and rest-frame UV spectral properties of this galaxy in detail. In particular the UV-ISM absorption lines show velocity variations on the order of 200 km s-1 along the arc with the Siii1260 line systematically blue-shifted with respect to the Ly emission, and an asymmetric Ly emission line with a red tail. As discussed by Franx et al. (1997) these spectral features are naturally explained by an outflow model, in which the blue side of the Ly line has been absorbed by outflowing neutral Hi. The description of the line profile is very typical of the emission profiles seen in other Lyman-break galaxies. Indeed, velocity offsets between the nebular emission lines (such as H) and UV-ISM emission/absorption lines (such as Ly and Siii1260) are now common in high-redshift star-forming galaxies, and are usually interpreted as evidence for large-scale starburst driven outflow (Erb et al., 2003; Teplitz et al., 2000; Pettini et al., 2002b). Such a model provides a good description of the integrated properties of high-redshift galaxies and more detailed observations of local starbursts (eg. Pettini et al. 2002b; Shapley et al. 2003; Tenorio-Tagle et al. 1999; Heckman et al. 2000; Grimes et al. 2006). In this model, the Ly emission comes from photons emitted from the star-forming regions. To reach the observer these must pass through part of the foreground (blue shifted) shell. This absorption causes the peak emission wavelength to appear redshifted relative to the nebular emission lines. In addition, photons may be scattered or emitted from the receding shell. Photons that are either created on the inner surface of the shell (e.g. by UV irradiation from the starburst), or multiply scattered within the receding shell will acquire the mean velocity of the outflow and will be seen as redshifted by the observer (see the discussion of Hansen & Oh 2006).
With the systemic velocity of the galaxy measured from the [Oii] emission, we can compare the nebular emission line velocity gradient seen in this galaxy with those observed in Ly emission and UV-ISM lines, as well as crudely estimating the energetics of the outflow. Using the systemic redshift measured from the [Oii] emission line doublet (4.92960.0002) the Ly appears systematically redshifted from the systemic redshift by 100–200 km s-1 across the 4 kpc extent of the galaxy (Fig. 5). Moreover, the UV-ISM absorption lines are also correspondingly blue shifted by 200100 km s-1. This is typical of high-redshift, star-forming galaxies. However, strikingly, the velocity gradient in the nebular emission is mirrored in both the Ly and UV-ISM lines. The fact that the velocity structure of the outflow follows that seen in the nebular emission suggests the outflow has yet to decouple from the galaxy. Indeed, assuming that the outflow is no larger than the spatial extent of the stellar component of the galaxy (2 kpc), then for a constant velocity of 150 km s-1 it takes just 15 Myr to travel 2 kpc. This suggests that the young outflows from individual Hii regions have not yet merged to form a superwind surrounding the galaxy.
To test whether a young outflow is energetically feasibly, first we de-redshift the rest-frame UV spectrum using the systemic redshift. In Fig. 4 we show the region around the Ly emission in the rest-frame, clearly showing the asymmetric profile. A single Gaussian profile fit suggests a velocity offset from the systemic redshift of 200 km s-1. However, a much better fit (25) is obtained by modeling the emission line with an underlying Gaussian profile (fixed in wavelength at 1215.67Å ) with an Voigt profile absorber in the blue wing. In this fit, the emission line width and intensity of the underlying Gaussian profile are allowed to vary, as are the velocity, impact parameter () and column density () of the Voigt profile. The best fit model has a Voigt profile centered -300100 km s-1 from the systemic with km s-1 and 1017 cm-2. Allowing the centroid of the underlying Gaussian emission line profile to vary, the column density increases to 1018 cm-2 and 120 km s-1 with an underlying Gaussian profile with centroid km s-1 from that predicted from the [Oii] emission (we note that the improvement in between the two fits is and so indistinguishable, although fixing the underlying Gaussian profile at the systemic redshift is more physical). We caution that both of these column densities are near the flat part of the curve of growth causing degeneracies between NH and and so come with considerable uncertainty. However, we can at least test whether such a value is reasonable using the UV absorption lines and assuming an ionisation state for the ISM. Using the rest-frame UV spectroscopy we measure (rest-frame) equivalent widths of (Siii1260.4)=0.300.07Å (Oi1302.1)=1.690.07Å (Cii1334.5)=0.320.07Å (Siiv1393.4)=0.240.06Å and (Siiv1402.8)=0.290.06Å. Since we can not constrain the ionisation state or metallicity of the galaxy (we only have one transition from each species), we adopt a simple approach and assume that the ionisation and metallicity are comparable to that of cB58 at which has an abundance of solar (Pettini et al., 2002a). Assuming =-4.86 for Siii1260.4 and an equivalent width of (Siii1260.4)=0.300.07Å (which corresponds to a column density of 21013 cm-2) we derive a hydrogen column density of 21017 cm-2. Although we caution this estimate comes with considerable uncertainty, the column density estimated from the Ly line profile, or crudely using the UV ISM absorption lines appear, at least, to be consistent within a factor 4.
Although there are uncertainties in the column density of the outflowing shell, it is interesting to consider the energetics. For a normal stellar initial mass function, supernovae provide 1049 erg per solar mass of stars (eg., Benson et al. 2003), thus for a galaxy with a star-formation rate of SFR=427, 51050 erg are available per year. We estimate the distance of the shell from the galaxy by assuming that the linear size of the region covered by the swept up shell is no larger than the spatial extent as the galaxy (which seems reasonable given the velocity structure of the outflow appears to follow the nebular emission line velocity). As noted, at a velocity of it takes 15 Myr to travel out to a distance of 2 kpc; within this time, supernovae will provide a total energy of E51057 erg. Clearly there are a number of uncertainties in this estimate: not least that the outflow may have decelerated from an initial higher velocity which would reduce the time-scale. Nevertheless, we can estimate the mass of the outflow via: where is the column density, is the area of the cone and is the atomic mass of Hydrogen. Adopting the value of the observed column density derived above (cm-2) and that the outflowing material is uniform over an area of 10 kpc2, the total mass of the outflow is , where is the neutral Hi fraction. The kinetic energy of the outflow is then erg. Thus, the outflow is easily energetically feasible even if the neutral fraction is as low as 0.01%. The low inferred mass loading and kinetic energy in the shell is in stark contrast to the =4.88 galaxy behind the lensing cluster RCS0224-002 in which similar observations suggest a large scale, bi-polar outflow surrounds the galaxy (Swinbank et al., 2007). In this galaxy, the outflow has a high mass loading (comparable or greater than the star-formation rate) and appears to be located 30 kpc from the galaxy, escaping at a speed of up to 500 km s-1. The strong contrast between the two galaxies so far studied at these early times therefore suggests strong diversity in the outflow energetics of young galaxies at high-redshift, clearly illustrating the need for more targets and follow-up to test the ubiquity and impact of outflows at these early times.

3.5 Comparison of Age and Mass Estimates
It is useful to compare the various stellar and dynamical mass and age estimates, since these reflect the build up of stellar mass in this system. First, the stellar mass estimated from the rest-frame UV–near-infrared SED of the galaxy is much smaller than the dynamical mass estimated from the dynamics. Similar results have been found in the 2–3 population. Erb et al. (2006) find 10% of star-forming systems with stellar masses which are approximately 10% of the dynamical mass. These systems also tend to be the youngest; 20 Myr (e.g. HDF-BX1397 is an excellent example). Thus, although the stellar mass estimate appears small compared to the dynamical mass (possibly suggesting a large gas reservoir makes up the rest of the baryonic material), the galaxy does not appear to be at odds with comparable observations of the galaxy population at 2–3.
It is also interesting to note that the age estimated from the SED (15 Myr) is comparable to that derived from the instantaneous star-formation rate (at a SFR of 42 M⊙ yr-1 it takes just 17 Myr to build a stellar mass of 7108 M⊙). Finally, the dynamical age of the outflow (15 Myr) is young, and consistent with a scenario in which a starburst wind is in the process of accelerating material from the galaxy into the halo and/or IGM. Together, these mass and age estimated are all suggestive of a young galaxy experiencing its first major epoch of mass assembly.
3.6 Properties of the Largest Star-Forming Regions
Owing to the magnification of the galaxy, the source-plane resolution of the optical and near-infrared imaging we are also able to estimate the masses, sizes and luminosities of the brightest star-forming (Hii) regions within the galaxy to test whether the physical conditions for star-formation at are very different to galaxies today. Using the results from § 3.1 we estimate the brightest star-forming regions within the galaxy have diameters of order 300–400 pc from the HST and NIFS observations. Using the velocity dispersions measured from the IFU observations this suggests dynamical masses of 6–9108 M⊙ each and mass densities of 3000 M⊙ pc-2. In Fig. 6 we show the correlation between size and mass of Hii regions (and starburst complexes) in local galaxies. Clearly, the size density of the brightest star-forming regions in MS 1358+62 arc are consistent with the most massive clusters seen in star-forming galaxies. Next we compare the luminosities and sizes of the brightest Hii regions to those locally. In Fig. 7 we show the correlation between size and luminosity of local Hii regions (Kennicutt, 1988; Gonzalez Delgado & Perez, 1997; Kennicutt et al., 2003; Lee et al., 2007) and show the position of the two brightest star-forming regions from MS 1358+62 arc. As Fig. 7 shows, the two brightest Hii regions appear to have star-formation activity which is substantially higher (at a fixed size) than those typically derived from local star-forming galaxies.
However, before we interpret this offset in detail, there are two caveats which must be considered. We first note that this comparison relies on a conversion between [Oii] (in the arc) and H locally. However, as Kewley et al. (2004) point out, the conversion between the star-formation rate derived from H and [Oii] never varies by more than a factor of two, even for extreme ranges in metallicity and reddening. Indeed, targeting the nebular emission line ratios of 25 lensed galaxies, Richard et al. (2009 in prep) (see also Pettini et al. 2001) derive a median H/[Oii] emission line flux ratio of H/[Oii]=2.50.8 (median redshift of this sample 2.40.4), which is slightly larger, but consistent with the values locally (H/[Oii]=1.80.5; Kewley et al. 2004). Thus it seems unlikely that there is a factor 100 increase in the [Oii]/H emission line ratio between and .
Second, we caution that the isophotes used to extract Hii regions sizes and luminosities are very different at 0 compared to those at (even accounting for lensing). Hence, to test whether we can reliably compare Hii region sizes and luminosities at high-redshift to those locally, we make use of the extensive H narrow-band imaging of local galaxies, in particular from SINGS (Kennicutt et al., 2003) and 11 HUGS (Lee et al., 2007). Using 175 H narrow-band images from these samples we test the effect of redshifting the galaxy images and re-extracting the size–luminosity relation. First, we use the the H narrow-band imaging and construct the size–luminosity relation for local galaxies using isophotes ranging from 110-18 to 110-15 erg cm-2 s-1 sq-arcsec. We find that, as the isophotal flux is increased, the lower-luminosity Hii regions fall below the detection threshold, whilst only the cores of the higher luminosity Hii regions are identified. This results in the local relation remaining in tact, with fewer Hii regions identified. In Fig. 7 we show a vector (labeled ’A’) which shows the typical direction a Hii regions follow as the extraction isophote is increased.
Next, we test the effect of artificially redshifting the imaging from a spatial resolution of 10 pc (0.5′′ at 5 Mpc) to a resolution of 200 pc and extract the Hii regions at a fixed isophote. This binning has the effect of merging Hii regions, increasing both the size and luminosity and in Fig. 7 we show vector ’B’ which denotes the track which Hii regions follow as the resolution is decreased.
The simulations show that essentially the size–luminosity relation does not systematically shift as the images are redshifted, and we therefore feel confident that any offset we measure in the size–luminosity relation likely reflects a real difference their properties (see also Melnick et al. 2000.) We note that it is entirely possible that the star-forming regions in the galaxy represent an amalgamation of multiple Hii regions. However, these simple simulations suggest that they will remain over-luminous at a fixed size.
Next, we examine the implication of identifying Hii regions at which are significantly more luminous than those found locally. At a fixed size of 400 pc, local Hii regions have star-formation rates of order SFR=0.1 M⊙ yr-1, thus the star-forming regions observed in the 4.92 galaxy appear to be substantially more luminous than those in local galaxies. However, at a fixed size, offsets of (up to) two orders of magnitude in luminosities are observed in the most luminous nearby Hii regions and starburst galaxies (eg. Wilson & Matthews 1995; English & Freeman 2003; Vanzi et al. 2008; Bastian et al. 2006). For example, 30 Doradus has a star-formation rate of 0.15 M⊙ yr-1 and a size of 200 pc whilst the giant Hii region in the starburst galaxy II Zw 40 has a star-formation rate of 1 M⊙ yr-1 within 400 pc (eg. Wilson & Matthews 1995; English & Freeman 2003; Vanzi et al. 2008), although both of these systems are low metallicity. However, observations of massive star-clusters in NGC 4038/39 (the Antennae) also indicate young (5 Myr) clusters with star-formation rates much higher than expected for typical star-forming galaxies (Bastian et al., 2006). Thus the Hii regions within this galaxy appear to be scaled up versions of the most extreme Hii regions observed in the local Universe. It is unclear whether this is due to the starburst mode, or low metallicity, although it is interesting to note that the most recent models of galaxy formation suggest that star-formation at high redshift may be driven by strongly unstable and fragmenting disks (eg. Dekel et al. 2009) resulting in localised starbursts. Thus, the intense star-formation observed in this galaxy will significantly effect the surrounding ISM both in distributing metals and in adding turbulence.


4 Discussion & Conclusions
After correcting for lensing magnification factor 12.52.0, the rest-frame UV/optical morphology appears extended over 4 kpc, but is dominated by approximately five star-forming regions. In the source plane the galaxy has an -band magnitude consistent with L∗ LBGs at z5, and an intrinsic star-formation rate of SFR428 M⊙ yr-1. Using rest-frame UV-to--band SED we derive stellar mass of M(72)108M⊙, which is consistent with estimates of the stellar masses of LBGs at this epoch (Verma et al., 2007; Stark et al., 2009; McLure et al., 2009). The SED is also consistent with being dominated by a young stellar population of age of 147 Myr. Indeed, with a star-formation rate of 42 M⊙ yr-1, it takes just 17 Myr to build this stellar mass. Together, this suggests this galaxy is in the first major epoch of mass assembly.
The source-plane morphology is clumpy with at least five star-forming regions, separated by up to 4 kpc in projection. The brightest regions are not centrally concentrated, and the galaxy shows no signs of a central component. Using the spatially resolved spectroscopy around the [Oii] emission, we derive a velocity gradient of =18020 km s-1 across 4 kpc in projection, suggesting a dynamical mass of Mdyn=31109M⊙csc2(i) M⊙. We also derive a specific star-formation rate (SFR/M⋆) of SSFR=2.40.510-8 yr-1, consistent with the most actively star-forming, low mass galaxies at these early times (Feulner et al., 2005).
Using the source-plane images and [Oii] emission line maps, we measure sizes and masses for the two brightest star-forming regions, deriving masses of Mcl=6–9108 M⊙ and individual star-formation rates of SFR10 M⊙ yr-1. A comparison to local Hii regions/populations shows that these are comparably massive and dense as those found in local star-forming galaxies. However, the implied star-formation rate individually for these Hii regions is 100 brighter that found at a fixed size. Such high star-formation rates (at a fixed size) have been observed locally: e.g. 30 Doradus and II Zw 40 both have star-formation rates which are 100 larger than expected given their sizes. Thus, the Hii regions within this galaxy appear to be scaled up versions of the most extreme regions observed in the local Universe, yet observed when the Universe was 1 Gyr old. Could the increased luminosity within Hii regions reflect real difference in the mode of star-formation within massive star-forming complexes? Murray (2009) suggest that young, massive (107 M⊙) star-forming clusters are optically thick to far-infrared radiation resulting in high gas temperatures, and hence in higher Jeans masses. Indeed, for a star cluster with mass 108 M⊙ (as observed in this galaxy) the predicted Jeans mass is 12 M⊙. This ’top-heavy’ IMF has the effect of increasing the fraction of OB stars per Hii region and hence increases the light-to-mass ratio (see the discussion in Murray 2009). However, since no compelling evidence for evolution in the IMF has yet been found at either low (or high) redshift, we view this scenario as suggestive, at best. Nevertheless, clearly spatially resolved spectroscopy of the nebular emission lines on scales comparable to Hii regions would provide crucial diagnostics of the physics of star-formation in the young Universe. Indeed, this intense star-formation will significantly effect the surrounding ISM both in distributing metals and in adding turbulence. As such, the mechanical energy input might explain the higher turbulent speeds (hence large v/ values) observed in primitive disks (e.g. Stark et al., 2008; Law et al., 2009; Forster Schreiber et al., 2009; Genzel et al., 2008; Lehnert et al., 2009).
Finally, we compare the nebular emission line dynamics with spatially resolved Ly and rest-frame UV-ISM lines and find that this galaxy is surrounded by a galactic scale outflow. The velocity gradient observed in the nebular emission is mirrored (but systematically offset) in the Ly emission and UV-ISM absorption across 4 kpc, suggesting that the outflow is young (15 Myr) and has yet to decouple from the star-forming regions and escape from the galaxy disk. Although crude, the estimated mass loading in the outflow is very small, and the kinetic energy provided by SNe from the observed star-formation rate is easily enough to drive the wind.
Overall, these observations provide unique insights into the distribution of star-formation, dynamics, interaction between star-formation and outflow energetics and even properties of the largest Hii regions within a young galaxy seen less than 1 Gyr after the big-bang on scales of just 200 pc. The combination of the large number of high-redshift gravitationally lensed galaxies identified by HST and adaptive optics assisted integral field spectrographs on eight and ten meter telescopes should finally begin to make such critical observational studies common-place, testing the route by why early systems assemble their stellar mass, their mode of star-formation and how they ultimately develop into galaxies like the Milky-Way.
acknowledgments
We gratefully acknowledge an anonymous referee for a very constructive report which significantly improved the content and clarity of this paper. We also gratefully acknowledge the Gemini staff for granting SV time for these observations. We would like to thank Janice Lee for very useful discussions and for allowing us to use the 11 HUGS narrow-band imaging prior to publication and Marijn Franx for useful discussions and providing us with the rest-frame UV spectroscopy. AMS gratefully acknowledges a Sir Norman Lockyer Royal Astronomical Society Fellowship and a Royal Society travel grant and DPS acknowledges an STFC fellowship. The Gemini observations were carried out as part of program GN-2006-SV-130, based on observations obtained at the Gemini Observatory, which is operated by the Association of Universities for Research in Astronomy, Inc., under a cooperative agreement with the NSF on behalf of the Gemini partnership: the National Science Foundation (United States), the Particle Physics and Astronomy Research Council (United Kingdom), the National Research Council (Canada), CONICYT (Chile), the Australian Research Council (Australia), CNPq (Brazil) and CONICET (Argentina).
References
- Balogh et al. (2001) Balogh, M. L., Pearce, F. R., Bower, R. G., & Kay, S. T. 2001, MNRAS, 326, 1228
- Bastian et al. (2006) Bastian, N., Emsellem, E., Kissler-Patig, M., & Maraston, C. 2006, A&AP, 445, 471
- Beckwith et al. (2006) Beckwith, S. V. W., Stiavelli, M., Koekemoer, A. M., Caldwell, J. A. R., Ferguson, H. C., Hook, R., Lucas, R. A., & Bergeron et al. 2006, AJ, 132, 1729
- Benson et al. (2003) Benson, A. J., Bower, R. G., Frenk, C. S., Lacey, C. G., Baugh, C. M., & Cole, S. 2003, ApJ, 599, 38
- Bertin & Arnouts (1996) Bertin, E. & Arnouts, S. 1996, AAPS, 117, 393
- Bournaud & Elmegreen (2009) Bournaud, F. & Elmegreen, B. G. 2009, ApJL, 694, L158
- Bouwens et al. (2007) Bouwens, R. J., Illingworth, G. D., Franx, M., & Ford, H. 2007, ApJ, 670, 928
- Bower et al. (2006) Bower, R. G., Benson, A. J., Malbon, R., Helly, J. C., Frenk, C. S., Baugh, C. M., Cole, S., & Lacey, C. G. 2006, MNRAS, 659
- Bower et al. (2004) Bower, R. G., Morris, S. L., Bacon, R., Wilman, R. J., Sullivan, M., Chapman, S., Davies, R. L., de Zeeuw, P. T., & Emsellem, E. 2004, MNRAS, 351, 63
- Calzetti et al. (1994) Calzetti, D., Kinney, A. L., & Storchi-Bergmann, T. 1994, ApJ, 429, 582
- Conselice et al. (2008) Conselice, C. J., Rajgor, S., & Myers, R. 2008, MNRAS, 386, 909
- Croton et al. (2006) Croton, D. J., Springel, V., White, S. D. M., De Lucia, G., Frenk, C. S., Gao, L., Jenkins, A., Kauffmann, G., Navarro, J. F., & Yoshida, N. 2006, MNRAS, 365, 11
- Davé (2008) Davé, R. 2008, MNRAS, 385, 147
- Davies (2007) Davies, R. I. 2007, MNRAS, 375, 1099
- Dekel et al. (2009) Dekel, A., Birnboim, Y., Engel, G., Freundlich, J., Goerdt, T., Mumcuoglu, M., & Neistein, E. et al. 2009, Nature, 457, 451
- English & Freeman (2003) English, J. & Freeman, K. C. 2003, AJ, 125, 1124
- Erb et al. (2003) Erb, D. K., Shapley, A. E., Steidel, C. C., Pettini, M., Adelberger, K. L., Hunt, M. P., Moorwood, A. F. M., & Cuby, J. 2003, ApJ, 591, 101
- Erb et al. (2006) Erb, D. K., Steidel, C. C., Shapley, A. E., Pettini, M., Reddy, N. A., & Adelberger, K. L. 2006, ApJ, 646, 107
- Evstigneeva et al. (2007) Evstigneeva, E. A., Gregg, M. D., Drinkwater, M. J., & Hilker, M. 2007, AJ, 133, 1722
- Feulner et al. (2005) Feulner, G., Gabasch, A., Salvato, M., Drory, N., Hopp, U., & Bender, R. 2005, ApJL, 633, L9
- Forster Schreiber et al. (2009) Forster Schreiber, N. M., Genzel, R., Bouche, N., Cresci, G., Davies, R., Buschkamp, P., Shapiro, K., & Tacconi, L. J. 2009, ArXiv e-prints
- Förster Schreiber et al. (2006) Förster Schreiber, N. M., Genzel, R., Lehnert, M. D., Bouché, N., Verma, A., Erb, D. K., & Shapley, A.E. et al. 2006, ApJ, 645, 1062
- Franx et al. (1997) Franx, M., Illingworth, G. D., Kelson, D. D., van Dokkum, P. G., & Tran, K. 1997, ApJL, 486, L75
- Fuentes-Masip et al. (2000) Fuentes-Masip, O., Muñoz-Tuñón, C., Castañeda, H. O., & Tenorio-Tagle, G. 2000, AJ, 120, 752
- Genzel et al. (2008) Genzel, R., Burkert, A., Bouché, N., Cresci, G., Förster Schreiber, N. M., Shapley, A., Shapiro, K., Tacconi, L. J., & Buschkamp, P. 2008, ApJ, 687, 59
- Genzel et al. (2006) Genzel, R., Tacconi, L. J., Eisenhauer, F., Förster Schreiber, N. M., Cimatti, A., Daddi, E., Bouché, N., & Davies, R., et al. 2006, Nature, 442, 786
- Giavalisco et al. (2004) Giavalisco, M., Ferguson, H. C., Dickinson, M., Alexander, D. M., Bauer, F. E., Bergeron, J., & Biagetti, C. et al. 2004, ApJL, 600, L93
- Giavalisco et al. (1996) Giavalisco, M., Steidel, C. C., & Macchetto, F. D. 1996, ApJ, 470, 189
- Gonzalez Delgado & Perez (1997) Gonzalez Delgado, R. M. & Perez, E. 1997, APJS, 108, 199
- Grimes et al. (2006) Grimes, J. P., Heckman, T., Hoopes, C., Strickland, D., Aloisi, A., Meurer, G., & Ptak, A. 2006, ApJ, 648, 310
- Haşegan et al. (2005) Haşegan, M., Jordán, A., Côté, P., Djorgovski, S. G., McLaughlin, D. E., Blakeslee, J. P., Mei, S., & West, M. J et al. 2005, ApJ, 627, 203
- Hansen & Oh (2006) Hansen, M. & Oh, S. P. 2006, MNRAS, 367, 979
- Harris (1996) Harris, W. E. 1996, AJ, 112, 1487
- Heckman et al. (2000) Heckman, T. M., Lehnert, M. D., Strickland, D. K., & Armus, L. 2000, APJS, 129, 493
- Hilker et al. (2007) Hilker, M., Baumgardt, H., Infante, L., Drinkwater, M., Evstigneeva, E., & Gregg, M. 2007, A&AP, 463, 119
- Jedrzejewski et al. (1987) Jedrzejewski, R. I., Davies, R. L., & Illingworth, G. D. 1987, AJ, 94, 1508
- Kennicutt (1998) Kennicutt, R. C. 1998, ARAA, 36, 189
- Kennicutt (1988) Kennicutt, Jr., R. C. 1988, ApJ, 334, 144
- Kennicutt et al. (2003) Kennicutt, Jr., R. C., Armus, L., Bendo, G., Calzetti, D., Dale, D. A., Draine, B. T., Engelbracht, C. W., & Gordon, K. D. et al. 2003, PASP, 115, 928
- Kewley et al. (2004) Kewley, L. J., Geller, M. J., & Jansen, R. A. 2004, AJ, 127, 2002
- Knudsen et al. (2008) Knudsen, K. K., van der Werf, P. P., & Kneib, J.-P. 2008, MNRAS, 384, 1611
- Law et al. (2007) Law, D. R., Steidel, C. C., Erb, D. K., Larkin, J. E., Pettini, M., Shapley, A. E., & Wright, S. A. 2007, ApJ, 669, 929
- Law et al. (2009) —. 2009, ApJ, 697, 2057
- Lee et al. (2007) Lee, J. C., Kennicutt, R. C., Funes, José G., S. J., Sakai, S., & Akiyama, S. 2007, ApJL, 671, L113
- Lehnert et al. (2009) Lehnert, M. D., Nesvadba, N. P. H., Tiran, L. L., Matteo, P. D., van Driel, W., Douglas, L. S., Chemin, L., & Bournaud, F. 2009, ApJ, 699, 1660
- Martin (2005) Martin, C. L. 2005, ApJ, 621, 227
- McCrady & Graham (2007) McCrady, N. & Graham, J. R. 2007, ApJ, 663, 844
- McLure et al. (2009) McLure, R. J., Cirasuolo, M., Dunlop, J. S., Foucaud, S., & Almaini, O. 2009, MNRAS, 395, 2196
- Melnick et al. (2000) Melnick, J., Terlevich, R., & Terlevich, E. 2000, MNRAS, 311, 629
- Meurer et al. (1997) Meurer, G. R., Heckman, T. M., Lehnert, M. D., Leitherer, C., & Lowenthal, J. 1997, AJ, 114, 54
- Mo & White (2002) Mo, H. J. & White, S. D. M. 2002, MNRAS, 336, 112
- Murray (2009) Murray, N. 2009, ApJ, 691, 946
- Nesvadba et al. (2006) Nesvadba, N. P. H., Lehnert, M. D., Eisenhauer, F., Genzel, R., Seitz, S., Davies, R. I., Saglia, R. P., & Lutz, D. et al. 2006, ApJ, 650, 661
- Okamoto et al. (2005) Okamoto, T., Eke, V. R., Frenk, C. S., & Jenkins, A. 2005, MNRAS, 363, 1299
- Ouchi et al. (2004) Ouchi, M., Shimasaku, K., Okamura, S., Furusawa, H., Kashikawa, N., Ota, K., Doi, M., & Hamabe, M. 2004, ApJ, 611, 685
- Pettini et al. (2002a) Pettini, M., Rix, S. A., Steidel, C. C., Adelberger, K. L., Hunt, M. P., & Shapley, A. E. 2002a, ApJ, 569, 742
- Pettini et al. (2002b) Pettini, M., Rix, S. A., Steidel, C. C., Hunt, M. P., Shapley, A. E., & Adelberger, K. L. 2002b, APSS, 281, 461
- Pettini et al. (2001) Pettini, M., Shapley, A. E., Steidel, C. C., Cuby, J., Dickinson, M., Moorwood, A. F. M., Adelberger, K. L., & Giavalisco, M. 2001, ApJ, 554, 981
- Pryor & Meylan (1993) Pryor, C. & Meylan, G. 1993, in Astronomical Society of the Pacific Conference Series, Vol. 50, Structure and Dynamics of Globular Clusters, ed. S. G. Djorgovski & G. Meylan, 357–+
- Richard et al. (2008) Richard, J., Stark, D. P., Ellis, R. S., George, M. R., Egami, E., Kneib, J.-P., & Smith, G. P. 2008, ApJ, 685, 705
- Salpeter (1955) Salpeter, E. E. 1955, ApJ, 121, 161
- Salucci et al. (2007) Salucci, P., Swinbank, A. M., Lapi, A., Yegorova, I., Bower, R. G., Smail, I., & Smith, G. P. 2007, MNRAS, 382, 652
- Shapley et al. (2003) Shapley, A. E., Steidel, C. C., Pettini, M., & Adelberger, K. L. 2003, ApJ, 588, 65
- Soifer et al. (1998) Soifer, B. T., Neugebauer, G., Franx, M., Matthews, K., & Illingworth, G. D. 1998, ApJL, 501, L171+
- Stark et al. (2009) Stark, D. P., Ellis, R. S., Bunker, A., Bundy, K., Targett, T., Benson, A., & Lacy, M. 2009, ApJ, 697, 1493
- Stark et al. (2008) Stark, D. P., Swinbank, A. M., Ellis, R. S., Dye, S., Smail, I. R., & Richard, J. 2008, Nature, 455, 775
- Steidel et al. (1996) Steidel, C. C., Giavalisco, M., Pettini, M., Dickinson, M., & Adelberger, K. L. 1996, ApJL, 462, L17+
- Swinbank et al. (2006a) Swinbank, A. M., Bower, R. G., Smith, G. P., Smail, I., Kneib, J.-P., Ellis, R. S., Stark, D. P., & Bunker, A. J. 2006a, MNRAS, 368, 1631
- Swinbank et al. (2007) Swinbank, A. M., Bower, R. G., Smith, G. P., Wilman, R. J., Smail, I., Ellis, R. S., Morris, S. L., & Kneib, J.-P. 2007, MNRAS, 376, 479
- Swinbank et al. (2006b) Swinbank, A. M., Chapman, S. C., Smail, I., Lindner, C., Borys, C., Blain, A. W., Ivison, R. J., & Lewis, G. F. 2006b, MNRAS, 371, 465
- Swinbank et al. (2003) Swinbank, A. M., Smith, J., Bower, R. G., Bunker, A., Smail, I., Ellis, R. S., Smith, G. P., & Kneib, J. P., et al. 2003, ApJ, 598, 162
- Tenorio-Tagle et al. (1999) Tenorio-Tagle, G., Silich, S. A., Kunth, D., Terlevich, E., & Terlevich, R. 1999, MNRAS, 309, 332
- Teplitz et al. (2000) Teplitz, H. I., McLean, I. S., Becklin, E. E., Figer, D. F., Gilbert, A. M., Graham, J. R., Larkin, J. E., Levenson, N. A., & Wilcox, M. K. 2000, ApJL, 533, L65
- Vanzi et al. (2008) Vanzi, L., Cresci, G., Telles, E., & Melnick, J. 2008, A&AP, 486, 393
- Verma et al. (2007) Verma, A., Lehnert, M. D., Förster Schreiber, N. M., Bremer, M. N., & Douglas, L. 2007, MNRAS, 377, 1024
- White & Rees (1978) White, S. D. M. & Rees, M. J. 1978, MNRAS, 183, 341
- Wilman et al. (2005) Wilman, R. J., Gerssen, J., Bower, R. G., Morris, S. L., Bacon, R., de Zeeuw, P. T., & Davies, R. L. 2005, Nature, 436, 227
- Wilson & Matthews (1995) Wilson, C. D. & Matthews, B. C. 1995, ApJ, 455, 125
- Yoshida et al. (2006) Yoshida, M., Shimasaku, K., Kashikawa, N., Ouchi, M., Okamura, S., Ajiki, M., Akiyama, M., & Ando, H. et al. 2006, ApJ, 653, 988