INTEGRAL and Swift/XRT observations of IGR J19405-3016
Abstract
Aims. IGR J19405-3016 is reported in the 3rd IBIS catalog as one of its lowest significance sources ( 4.6 under an exposure of about 371 ks). This leads to a caveat in multi-wavelength studies, although the source was identified in the optical as a Seyfert 1. The currently available INTEGRAL data on the source have increased to an exposure time of 1400 ks, which stimulates us to investigate the reality of this source again by using all the available data from INTEGRAL and Swift/XRT.
Methods. We analyzed all available observations carried out by the International Gamma-Ray Astrophysics Laboratory (INTEGRAL) on IGR J19405-3016. The data were processed by using the latest version OSA 7.0. In addition, we analyzed all the available Swift/XRT data on this source.
Results. We find that IGR J19405-3016 has a detection significance of 9.4 in the 20-60 keV band during the observational period between March 2003 and March 2008. This confirms a real source detection reported previously. The source position and error location are therefore updated. The source is found to be constant over years at the hard X-rays. We analyzed the Swift/XRT observations on IGR J19405-3016 as well, and find that the spectrum can be fitted with a simple power law model. Over the three XRT observations, the source flux varied by up to 39% from the average, and the spectrum is generally soft. The combined XRT/ISGRI spectrum is well fitted with a simple power law model (photon index 2.110.03) with a column density fixed at 8.731020 atoms/cm2. Such a photon index is consistent with the mean value 1.98 (dispersion 0.27) obtained from Swift/BAT AGN samples at 14-195 keV. The spectral slope of IGR J19405-3016 is softer than the average spectral slope found elsewhere. A similar discrepancy is found with other results regarding Seyfert 1 AGNs. A possible explanation for this simple spectral description may be that the low level of the column density allows for the ‘true’ spectrum to appear at soft X-rays as well.
Key Words.:
X-rays: individual: IGR J19405-30161 Introduction
Four hundred twenty-one sources are listed in the 3rd IBIS/ISGRI catalog (Bird et al. 2007). Among them, 171 are Galactic accreting systems, 122 extragalactic objects, and 113 are sources of unknown nature. Most of the unclassified sources were identified through optical and near-infrared spectroscopy (Masetti et al. 2004, 2006a, 2006b, 2006c, 2006d, 2008, 2009; Chaty et al. 2008; Nespoli et al. 2008). For the newly identified sources, about 55% are AGNs (almost equally divided into Seyfert 1s and 2s), 32% are X-ray binaries, and 12% are CVs (Masetti et al. 2009). The optical identifications are performed by first searching in the error location of INTEGRAL/ISGRI for a possible counterpart at the soft X-ray observations and, accordingly, the error location can be largely improved to a level that allows for looking into optical data for the final identification. IGR J19405-3016 is one of the INTEGRAL weakly identified sources studied by Masetti et al. (2008) in their most recent optical identification campaign.
IGR J19405-3016 was first reported as a low-significance source in the 3rd IBIS/ISGRI catalog (Bird et al. 2007). The source was detected at 4.6 level under an exposure of 371 ks in the energy band 20-40 keV. The lowest significance for a source in Bird’s catalog is 4.5 . Therefore, IGR J19405-3016 is among the few sources that were reported by INTEGRAL/ISGRI with the lowest significances. Bird et al. (2007) point out that the catalog sources detected with significance above 5 have a probability of less than 1 percent of being spurious, and detections with lower significance have a higher probability of being unreal. Accordingly, although a Seyfert 1.2 was found as an optical counterpart around IGR J19405-3016 by Masetti et al. (2008), a caveat was claimed therein in the sense that the hard X-ray detection itself may be spurious, and hence the proposed optical identification may not correspond to an actual counterpart (Masetti et al. 2008).
After the discovery of the source by INTEGRAL, Swift/XRT detected a source at soft X-rays within the IBIS error location (Landi et al. 2007a). The XRT observation locates the source at RA(J2000) = 19h 40m 15.15s and Dec(J2000) = -30d 15m 48.5s, with a 3.5 arcsecond uncertainty at 90% confidence level. The X-ray spectrum is modeled with an unabsorbed power law with a photon index 2.1 (Landi et al. 2007a). Given that an additional exposure will lead to a large increment in source significance and that the currently available INTEGRAL observations around IGR J19405-3016 have been accumulated to roughly 1400 ks, it is appropriate to re-investigate the hard X-ray properties of IGR J19405-3016. Also, after the report of Landi et al. (2007a), further Swift/XRT observations (roughly 1.6 ks more) were available in 2008, which allow for further investigation on the source at soft X-rays. In this paper we report the results of our INTEGRAL and Swift/XRT analyses on IGR J19405-3016.
2 Observations and data analysis
INTEGRAL (Winkler et al. 2003) is a 15 keV - 10 MeV -ray mission. The main instruments are the Imager on Board the INTEGRAL Satellite (IBIS, 15 keV - 10 MeV; Ubertini et al. 2003) and the SPectrometer onboard INTEGRAL (SPI, 20 keV - 8 MeV; Vedrenne et al. 2003). They are supplemented by the Joint European X-ray Monitor (JEM-X, 3-35 keV) (Lund et al. 2003) and the Optical Monitor Camera (OMC, V, 500-600 nm) (Mas-Hesse et al. 2003). At the lower energies (15 keV - 1 MeV), the CdTe array ISGRI (Lebrun et al. 2003) of IBIS has a better continuum sensitivity than SPI. The satellite was launched in October 2002 into an elliptical orbit with a period of 3 days. Due to the coded-mask design of the detectors, the satellite normally operates in dithering mode, which suppresses the systematic effects on spatial and temporal backgrounds.
The INTEGRAL observations were carried out in the so-called individual SCience Windows (SCWs), with a typical time duration of about 2000 seconds each. Only IBIS/ISGRI public data were taken into account, because the source is too weak to be detected by JEMX and SPI. The available INTEGRAL observations, when IGR J19405-3016 fell into the 50 coded field of view of ISGRI (offset angle less than 10 degrees), comprised about 566 SCWs, adding up to a total exposure time of 1400 ks (until March 22, 2008). IGR J19405-3016 therefore had roughly 1000 ks of exposure more than used in the previous report (Bird et al. 2007). The details of the analyzed INTEGRAL observations on IGR J19405-3016, including the exposure and the time periods, are summarized in Table 1. Most of these observations were carried out in the 5x5 dithering mode. We subdivided the data into 4 groups according to the observational sequence. The other observational modes of the selected data are staring mode and Hexagonal mode, the sum of which comprise only 5.6% of the whole data. Data from these two modes can just as well be used to produce a mosaic map without introducing any systematic errors. This has been confirmed through our consulting the INTEGRAL help desk. The data reduction was performed by using the standard Online Science Analysis (OSA) software version 7.0, the latest released version. The results were obtained by running the pipeline from the flowchart to the image level and the spectrum level. The flux and the detection significance were derived in the mosaic map at the source position revised in this work.
Swift (Gehrels et al. 2004) is a -ray burst explorer launched November 20, 2004. It carries three co-aligned detectors: the Burst Alert Telescope (BAT, Barthelmy et al. 2005), the X-Ray Telescope (XRT, Burrows et al. 2005), and the Ultraviolet/Optical Telescope (UVOT, Roming et al. 2005). We took only Swift/XRT data into account, because BAT data were not available. The XRT uses a grazing incidence Wolter I telescope to focus X-rays onto a state-of-the-art CCD. XRT has an effective area of 110 cm2, an FOV of 23.6 arcminutes, an angular resolution (half-power diameter) of 15 arcseconds, and it operates in the 0.2-10 keV energy range, providing the possibility of extending the investigation on the source to soft X-rays.
There are three Swift snapshots available for IGR J19405-3016, each one with an exposure over 1 ks. The observations were carried out in the photon-counting mode, with exposures of 7.6 ks (ID 00036657004, on July 31, 2007), 5.9 ks (ID 00036657005, on August 7, 2007) and 1.6 ks (ID 00036657005, on June 7, 2008), respectively. The first two observations were reported in Landi et al. (2007a). See details in Table 2. We analyzed the Swift/XRT 0.3-7 keV data by using the latest released analysis software, provided in HEAsoft version 6.4. The XRT data reduction follows those described in Landi et al. (2007b). Here the source events were extracted within a circular region of radius 40 pixels, centered on the source position. A radius of 20 pixels (corresponds to 47 arcseconds) encloses about 90 percent of the PSF at 1.5 keV (Capalbi et al. 2005). A larger radius extracts more source counts, hence improves the statistics in spectral fittings. The spectra were fitted with XSPEC v12.3.1 (Dorman & Arnaud 2001) and the model parameters estimated at 90 confidence level.
3 Results
3.1 INTEGRAL
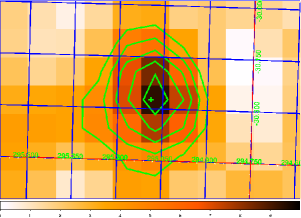
The imaging analyses show that the best source detection, 9.4 at 20-60 keV (Fig. 1), was derived in the mosaic map of all data. The source is not detectable at lower energies by JEMX or at higher energies by SPI. Such a detection is much more significant than the previous report of a 4.5 signal with an exposure of 371 ks, at 20-40 keV (Bird et al. 2007). The source flux is about 1.400.15 mCrab in the 20-60 keV band over the period 2003-2008. Under such a high-significance detection at 20-60 keV, the source position is improved to RA/Dec (J2000) = 295.0895∘/-30.2732∘, with a radius of 3.4 arcminutes in error circle ( 90 confidence level), also improved from the previous report of 5.4 arcminutes (Bird et al. 2007).
We also investigated the source detection in individual observational groups as listed in Table 1, in the 20-60 keV band. The source is detected in Revs. 0056-0244 (MJD=52729-53291) with a significance of 4.9 and a flux of 1.50.3 mCrab; in Revs. 0258-0371 (MJD=53332-53672) with a significance of 3.5 and a flux of 1.40.4 mCrab and Revs. 0416-0498 (MJD=53805-54050) with a significance of 7.8 and a flux of 1.50.2 mCrab. One sees that the source is detectable in each observational group and the flux remains constant at about 1.5 mCrab level over years at hard X-rays. The ISGRI data after Revs. 0498 consist of only 16 scws (Revs.543-664), which are about 17 ks exposure in total. The source was not detected with this exposure, and we have a 2- flux upper limit of 3.3 mCrab at 20-60 keV. If, during Revs. 543-664, the source kept at the same flux level as that of the previous revolutions, it would have only been ’clearly detected’ at 1- level. See details for the results in Table 1. The source is detected in the 4 adjacent energy bands of 20-25, 25-30, 30-40, and 40-60 keV, with detection significances of 4.0, 5.4, 6.1, and 4.2 , respectively, by combining all the ISGRI data. If there is a constant source at hard X-rays, an exposure of 1400 ks can improve the detection significance by a factor of 1.95 with respect to the previous report (Bird et al. 2007), which means a detection significance of 9 , similar to what we obtain from the summed data. In short, all results derived by us indicate a real and steady source.
3.2 Swift/XRT
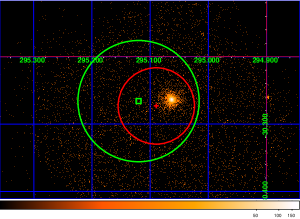
The Swift/XRT imaging analysis shows a single source detected at soft X-rays within the error location of IGR J19405-3016. Figure 2 is the Swift/XRT image produced by combining the three XRT observations to show the most accurate location of the source at soft X-rays. The position is obtained as RA(J2000) = 19h 40m 15.00s and Dec(J2000) = -30d 15m 48.6s, with an error radius of 3.5 arcseconds at 90% confidence level, which is consistent with the report in Landi et al. (2007a). Over plotted are the positions of IGR J19405-3016, as derived in Bird et al. (2007) and in the present work, and their error circles. It is obvious that the revised position and improved error circle are more indicative of the correlation between the soft X-ray source detected with XRT and the hard X-ray source IGR J19504-3016.
To look into the properties of the XRT source at soft X-rays, we carried out the spectral analysis of the three XRT observations. We find that data from each of the three observations can be fitted by using a simple power law model. The data in ID 00036657004 and ID 00036657005 need an additional component of absorption, with a column density derived as 5-6 1020 atoms/cm2, but this is not necessary for the data from observation ID 00036657006, probably due to a low exposure of only 1.6 ks. The source was clearly detected in XRT observation of 2008 June as well. The relatively low flux level and low exposure in this observation led to larger errors in model parameters. The reduced were derived with values of 1.0. The column density as measured directly from the XRT spectra of IGR J19405-3016 is rather low: a value around 61020atoms/cm2 can be even comparable to the Galactic column density obtained with the web version (9.151020atoms/cm2)111http://heasarc.gsfc.nasa.gov/cgi-bin/Tools/W3nh/w3nh.pl and from Dickey Lockman (1990) (8.731020atoms/cm2), measured 0.4 deg away from IGR J19405-3016. We therefore fix the column density at 8.731020atoms/cm2 and fit again the XRT data with a power law model. We have the fittings with the reduced derived around 1.1 (see Table 2). We find that the XRT fluxes in these snapshots can vary up to 39% with respect to the average at soft X-rays. The overall spectrum is relatively soft irrespective of the change in flux. The summed XRT data can be well-fitted by using a simple power law model, with a reduced 1.13 for 198 dof222degrees of freefom. This suggests that the spectral evolution, if any, should be not very strong over the three XRT snapshots. See Table 2 for details of the spectral results.
3.3 Combined XRT/ISGRI spectrum
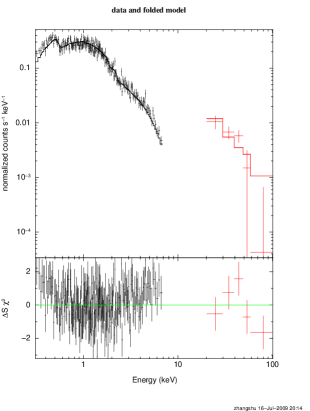
The summed XRT spectrum is combined with the ISGRI spectrum extracted from the all INTEGRAL observations. The joint spectrum can be fitted with a model of simple power law plus fixed absorption (reduced 1.14 for 202 dof) (Fig. 3). The photon index and normalization were derived as 2.110.03 and 4.700.1010-3 ph cm-2 s-1 keV-1, respectively. A constant is introduced to account for the difference in normalization between Swift/XRT and INTEGRAL/ISGRI and the sporadic snapshots of XRT observations, and is derived as 2.19, which is slightly more than unity. Such deviation can be ascribed to flux variability at soft X-rays observed in the sporadic snapshots of XRT.
4 Discussion and summary
As listed in the 3rd IBIS catalog (Bird et al. 2007), IGR J19405-3016 belongs to a group of sources with significance less than 5 . About 10-20 percent of them might result from false detections (Bird et al. 2007). By taking the currently available INTEGRAL observations, the exposure of which is roughly a factor of four more than used in the 3rd IBIS catalog (Bird et al. 2007), we find IGR J19405-3016 at a significance level of 9.4 at 20-60 keV in the sum of the observations between March 2003 and March 2008. The source is consistently detected at significance level 4 , in the three observational groups covering a time period of almost 5 years and in the adjacent four energy bands between 20-60 keV. We therefore confirm the detection of a real source in a previous report (Bird et al. 2007). Hence the caveat mentioned in Masetti et al. (2008) in optical identification of IGR J19405-3016 has disappeared. A similar result is shown as well in Beckmann et al. (2009), where a significance of 11.8 was reported for IGR J19405-3016 in 18-60 keV. Given the distance of a redshift z=0.052 (Masetti et al. 2008), the source luminosity is estimated as 2.51044 ergs/s (1-100 keV, use =70 km/s/Mpc, =0, =0.73). Our analysis shows that the source was rather stable over 5 years at energies above 20 keV. The source location and error circle are updated accordingly, which are more indicative of a source observed by Swift/XRT at soft X-rays as its real counterpart.
At soft X-rays we find that IGR J19405-3016 has a relatively soft spectrum and the XRT flux can vary up to 39% with respect to the average at soft X-rays. Given the low sensitivity of ISGRI (about 4-5 mCrab for individual SCW) and low average flux level at 20 keV (1.5 mCrab for IGR J19405-3016), such a variability at hard X-rays cannot be studied because of the lack of sufficient signal-to-noise ratio in the ISGRI data, although short variability cannot be excluded. In Table 1 one sees that the source is stable on a long time scale at hard X-rays. It has been reported several times that, for Seyfert 1, their fluxes can be less variable at hard X-rays than at soft X-rays (Beckmann et al. 2007; Molina et al. 2009; Gliozzi et al. 2003). A possible explanation for this is that the large number of the scatterings of the soft X-rays in the corona region can let the variability be washed out at hard X-rays. Such an idea was proposed in Gliozzi et al. (2003), but so far the detailed modelings are not yet available.
The combined XRT/ISGRI energy spectrum is well-fitted using a model of simple power law plus fixed absorption component. The spectral index falls into the range of the spectral index of the AGN measured by Swift/BAT at 14-195 keV band (Tueller et al. 2008). The analysis of the first 9 months of the data of Swift/BAT survey of AGN resulted in 103 AGN being detected in 14-195 keV. The average spectral index of these samples is 1.98, with an rms of 0.27. For IGR J19405-3016, the spectral index of 2.110.03 is consistent with the media value from BAT. About 74 BAT AGNs have the archival spectrum at soft X-rays. A comparison of these samples between hard and soft X-rays shows that the BAT spectral slope is in general 0.23 steeper than in the soft X-rays (Tueller et al. 2008). A possible explanation for this could be that the spectrum is closer to the intrinsic one at hard X-rays than at soft X-rays due to the influence of the material local to AGN (Nandra et al. 1999; Tueller et al. 2008). The broad-band (1-100 keV) analysis of 36 Seyfert 1 AGNs, detected by INTEGRAL in the 20-40 keV band, presents a power law shape with an average photon index of 1.7 and a dispersion of 0.2 (Molina et al. 2009). The photon index of 2.110.03 derived for IGR J19405-3016 in 1-100 keV is thus slightly more than the result of Molina et al. (2009). A similar discrepancy is found with the results of Beckmann et al. (2009) regarding Seyfert 1 AGNs. The column density as measured in IGR J19405-3016 is rather low, and from the X-ray spectral data, there is no need to introduce a further absorption local to the AGN. A possible explanation for the derived spectral properties of IGR J19405-3016 may be that the low level of the column density allows for the ‘true’ spectrum to also be detected at soft X-rays, and thus the overall measured spectral shape of the source is actually the true one.
In summary, the most recent analysis carried out with the latest software releases confirms that the previous weak detection, hence the low-significance source IGR J19405-3016 as listed in Bird et al. (2007), is not spurious. As a result, the optical identification of a Seyfert 1.2 by Masetti et al. (2008) is strengthened. A spectral index 2.11 supplemented with a low absorption may indicate that the ‘true’ spectrum of IGR J19405-3016 extends back to soft X-rays.
| Revs. | Date | Expo. | SCW | Flux | Sig. |
|---|---|---|---|---|---|
| MJD | ks | mCrab | |||
| 0056-0244 | 52729-53291 | 262 | 146 | 1.50.3 | 4.9 |
| 0258-0371 | 53332-53672 | 218 | 129 | 1.40.4 | 3.5 |
| 0416-0498 | 53805-54050 | 879 | 275 | 1.50.2 | 7.8 |
| 0543-0664 | 54184-54547 | 17 | 16 | 3.3 | 0.0 |
| 0056-0664 | 52729-54547 | 1400 | 566 | 1.400.15 | 9.4 |
-
Note:
The flux and the significance are presented in the energy band 20-60 keV for the data in which the source was within an offset angle of 10 degrees. The error bars are 1 and the upper limit is 2 .
| Model | Observation (date, exposure,ID) | |||
|---|---|---|---|---|
| Par | 2007-07-31 | 2007-08-07 | 2008-06-07 | 2007-2008 |
| 7.6 ks | 5.9 ks | 1.6 ks | 15.1 ks | |
| 0036657004 | 0036657005 | 0036657006 | all | |
| 2.070.05 | 2.110.04 | 2.19 | 2.110.03 | |
| N | 3.980.13 | 5.950.17 | 3.160.26 | 4.700.10 |
| flux | 1.69 | 2.440.07 | 1.190.10 | 1.940.04 |
| /dof | 1.11/95 | 1.12/104 | 1.16/15 | 1.13/198 |
-
Note:
The parameters (photon index) and N (Normalization at 1 keV, in units of 10-3 ph cm-2 s-1 keV-1) are the fit results at 0.3-7 keV, using a power law model. The column density is fixed at 8.731020 atoms/cm2. The /dof is shown as well for each fit. The flux is calculated in the 0.3–10 keV band, in units of 10-11 erg cm-2 s-1.
Acknowledgements.
This work was subsidized by the National Natural Science Foundation of China, the CAS key Project KJCX2-YW-T03, and the 973 Program 2009CB824800. J.-M. W. thanks the Natural Science Foundation of China for support via NSFC-10325313, 10521001, and 10733010. DFT acknowledges support by Spanish MEC grant AYA 2 006-00530.References
- Barthelmy et al. (2005) Barthelmy S.D., et al. 2005, Space Sci. Rev., 120, 143
- Beckmann et al. (2007) Beckmann V., Barthelmy S.D., Courvoisier T.J.-L., et al. 2007, A&A, 475, 827
- Beckmann et al. (2009) Beckmann V., Soldi S., Ricci C., et al. 2009, A&A, in press (astro-ph 0907.0654)
- Bird et al. (2007) Bird A.J., et al. 2007, ApJS, 170, 175
- Burrows et al. (2005) Burrows D.N., et al. 2005, Space Sci. Rev., 120, 165
- Capalbi et al. (2005) Capalbi M., Perri M., Saija B., et al. 2005, “The SWIFT XRT Data Reduction Guide”
- Chaty et al. (2008) Chaty S., Rahoui F., Foellmi C., et al. 2008, A&A, 484, 783
- Dickey & Lockman (1990) Dickey J.M., & Lockman F.J. 1990, ARAA, 28, 215
- Dorman & Arnaud (2001) Dorman B., & Arnaud K.A. 2001, “Redesign and reimplementation of XSPEC, in Astronomical Data Analysis Software and Systems X”, ed. F.R. Harnden Jr., F.A. Primini, & H.E. Payne, ASP Conf.Ser. (San Francisco: ASP), 238, 415
- Gehrels et al. (2004) Gehrels N., et al. 2004, ApJ, 611, 1005
- Gliozzi et al. (2003) Gliozzi M., Sambruna A.M., & Eracleous M. 2003, ApJ, 584, 176
- Lebrun et al. (2003) Lebrun F., Leray J.P., Lavocat P., et al. 2003, A&A, 411, L141
- Landi et al. (2007a) Landi R., Masetti N., & Stephen J. B., et al. 2007a, ATel, 1288
- Landi et al. (2007b) Landi R., Masetti N., & Morelli L., et al. 2007b, ApJ, 669, 109
- Lund et al. (2003) Lund N., Budtz-Jorgensen C., Westergaard N.J., et al. 2003, A&A, 411, L231
- Masetti et al. (2004) Masetti N., Palazzi E., Bassani L., et al. 2004, A&A, 426, L41
- Masetti et al. (2006a) Masetti N., Mason E., Bassani L., et al. 2006a, A&A, 448, 547
- Masetti et al. (2006b) Masetti N., Pretorius M.L., Palazzi E., et al. 2006b, A&A, 449, 1139
- Masetti et al. (2006c) Masetti N., Bassani L., Bazzano A., et al. 2006c, A&A, 455, 11
- Masetti et al. (2006d) Masetti N., Morelli L., Palazzi E., et al. 2006d, A&A, 459, 21
- Masetti et al. (2008) Masetti N., Mason E., Morelli L., et al. 2008, A&A, 482, 113
- Masetti et al. (2009) Masetti N., Parisi P., Palazzi E., et al. 2009, A&A, 495, 121
- Mas-Hesse et al. (2003) Mas-Hesse J.M., Gimenez A., Culhane J.L., et al. 2003, A&A, 411, L261
- Molina et al. (2009) Molina M., Bassani L., Malizia A., et al. 2009, MNRAS, in press [arXiv:0906.2909]
- Nandra et al. (1999) Nandra K., George I.M., & Mushotzky R.F., et al. 1999, ApJL, 523, L17
- Nespoli et al. (2008) Nespoli E., Fabregat J., Mennickent R. E., 2008, A&A, 486, 911
- Roming et al. (2005) Roming P.W.A., et al. 2005, Space Sci. Rev., 120, 95
- Tueller et al. (2008) Tueller J., Mushotzky R.F., and Barthelmy S., et al. 2008, ApJ, 681, 113
- Ubertini et al. (2003) Ubertini P., Lebrun F., Cocco G., et al. 2003, A&A, 411, L131
- Vedrenne et al. (2003) Vedrenne G., Roques J.-P., Schonfelder V., et al. 2003, A&A, 411, L63
- Winkler et al. (2003) Winkler C., Courvoisier T.J.-L., Di Cocco G., et al. 2003, A&A, 411, L1