SDSS J092712.64+294344.0: recoiling black hole or merging galaxies
Abstract
We report long-slit spectroscopic observations of SDSS J092712294344 carried-out at the recently commissioned 2 m telescope in IUCAA Girawali Observatory, India. This AGN-like source is known to feature three sets of emission lines at = 0.6972, 0.7020 and 0.7128. Different scenarios such as a recoiling black hole after asymmetric emission of gravitational waves, binary black holes and possible merging systems are proposed for this object. We test these scenarios by comparing our spectra with that from the Sloan Digital Sky Survey (SDSS), obtained 4 years prior to our observations. Comparing the redshifts of [O iii]4960,5008 we put a 3 limit on the relative acceleration to be less than 32 km s-1 yr-1 between different emitting regions. Using the 2D spectra obtained at different position angles we show that the [O iii] line from the = 0.7128 component is extended beyond the spectral point spread function. We infer the linear extent of this line emitting region is 8 kpc. We also find a tentative evidence for an offset between the centroid of the [O iii]5008 line at = 0.7128 and the QSO trace when the slit is aligned at a position angle of 299∘. This corresponds to the = 0.7128 system being at an impact parameter of 1 kpc with respect to the = 0.6972 in the north west direction. Based on our observations we conclude that the binary black hole model is most unlikely. The spatial extent and the sizes are consistent with both black hole recoil and merging scenarios.
keywords:
galaxies: active – galaxies: individual (SDSS J092712.64294344.0) – quasars: emission lines1 Introduction
The availability of several thousands of QSO spectra in the Sloan Digital Sky Survey (SDSS) database has allowed astronomers to find various interesting and peculiar AGNs. In particular, the discovery of unresolved point sources with two sets of emission lines that are powered by AGN-like continuum sources [SDSS J092712294344 at (Komossa et al., 2008), SDSS J153636044127 at (Boroson & Lauer, 2009) and SDSS J105041345631 at (Shields et al., 2009b)] has opened up possibilities to study recoiling black holes and/or binary inspiralling super-massive black holes. In this paper we concentrate on the first object (i.e. SDSS J092712.64294344.0, hereafter J09272943). J09272943 is an unusual quasar with , identified by Komossa et al. (2008) during their search for active galactic nuclei with high [O iii] velocity shifts. There are two systems of emission lines identified in the SDSS spectrum with a velocity separation of about 2650 km s-1. One is referred as ‘red’ (with = 0.71279) and other as ‘blue’ (with = 0.69713). The red system consists of narrow emission lines (NELs) of [O iii]5008, [O ii]3727, [Ne iii]3869, [Ne v]3426 and narrow Balmer lines. The blue system shows classical Balmer and Mg ii broad emission lines (BELs), plus unusually broad NELs. The line ratios indicate AGN-like excitation in both systems. Shields et al. (2009a) reobserved this object with the Hobby-Eberly Telescope (HET) and reported a third redshifted set of narrow lines at . They also put a bound on the line of sight acceleration between the red and blue systems (i.e a 3 limit of km s-1yr -1).
Simulations of binary black hole mergers predict large recoil velocities (kicks) of the final merged black hole resulting from anisotropic emission of gravitational radiation (see for example, Campanelli et al., 2007a, b; Dain et al., 2008; González et al., 2007; Loeb, 2007; Tichy & Marronetti, 2007). In the discovery paper, Komossa et al. proposed J09272943 as a possible candidate for a super-massive black hole (with ) ejected at high speed from the host galactic nucleus by gravitational radiation recoil. However, Dotti & Volonteri (2009) and Bogdanović et al. (2009) have proposed an alternate hypothesis in which the observed configuration of emission lines originate from binary black holes. The main features of this model are the prediction of a detectable acceleration over a time-scale of years and sub-parsec scale sizes for the emitting regions. At the same time, Heckman et al. (2009) proposed that J09272943 could be a high redshift analog of NGC 1275 (also known as 3C 84 and Perseus A) where two sets of redshifted emission lines are seen due to the interactions between two galaxies in a cluster centre (Conselice et al., 2001). On similar lines, Shields et al. (2009a) have proposed the superposition hypothesis based on the third redshifted emission line component and a possible presence of substantial cluster apparently containing J09272943. Subsequent detailed multiband photometric studies do not substantiate the presence of a massive cluster at the redshift of J09272943 (see Decarli et al., 2009). However, it is still possible that J09272943 is part of a massive cluster with low luminous matter to dark matter mass ratio.
The absence of observable change in the redshifts of the emission lines and/or a clear proof of the line emitting gas spread over kilo-parsec scales will clearly challenge the binary black hole scenario and favour the other two alternatives. This paper aims at constraining both the acceleration and the spatial extent of the emitting regions using long-slit spectroscopy observations.
| Date | Total exposure time1 | Position Angle2 |
|---|---|---|
| (min) | (degrees) | |
| 01/12/2008 | 120 | 66 |
| 01/12/2008 | 90 | 202 |
| 01/12/2008 | 90 | 299 |
| 31/01/2009 | 120 | 100 |
1 Individual exposures are of 30 min duration.
2 Angle measured in the clockwise direction with respect to south. In IGO images, south is at the top and west is at the right hand side.
2 Observations and Data Reduction
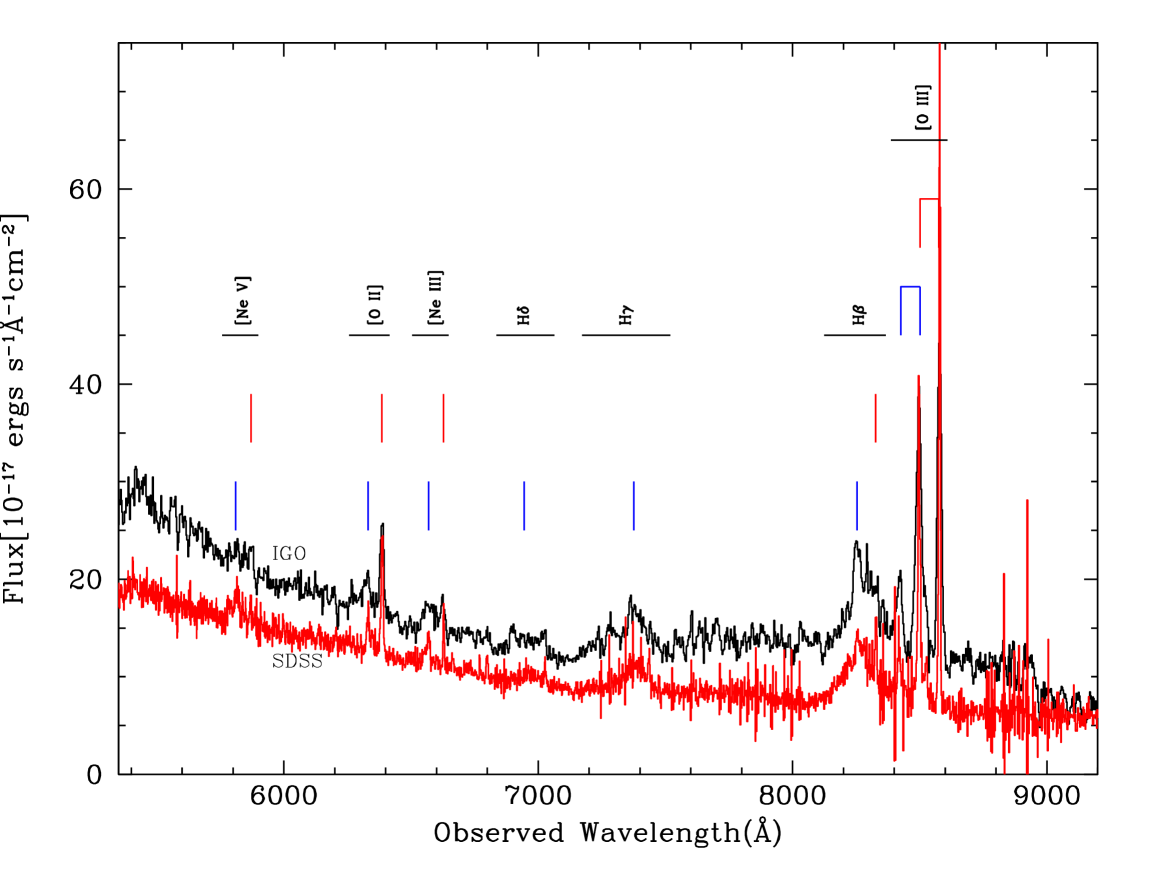
We observed J09272943 using the 2 metre telescope at IUCAA Girawali Observatory (IGO) in India near Pune. Long-slit spectra covering the wavelength range 3700 to 9200 Å were obtained using the GR5 grism of the IUCAA Faint Object Spectrograph (IFOSC) and a slit width of 1.5”. A typical seeing of 1.2 to 1.3” was measured from FWHM of the images taken during the nights. The observations were carried out on 01/12/2008 and 31/01/2009 for 4 different position angles of the slit. The detailed log of our observations is summarised in Table 1. The raw CCD frames were cleaned using standard IRAF111IRAF is distributed by the National Optical Astronomy Observatories, which are operated by the Association of Universities for Research in Astronomy, Inc., under cooperative agreement with the National Science Foundation. procedures. We use halogen flats for flat fielding the frames. Since at Å simple flat fielding does not remove the fringes, the QSO was moved along the slit for different exposures of a same position angle. We subsequently removed fringing by subtracting one frame from the other taken on the same night. The same procedure was applied to standard stars as well.
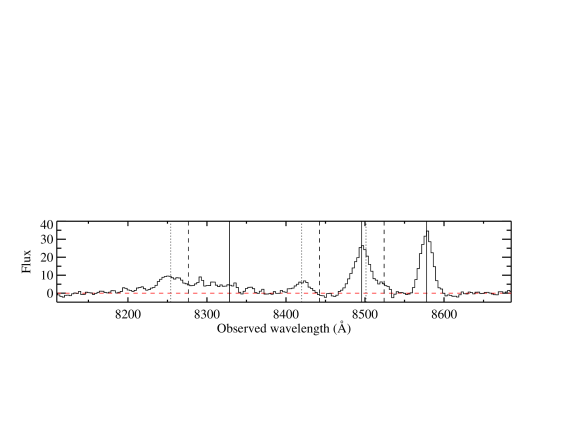
We then extracted the one dimensional spectrum from individual frames using the IRAF task “doslit”. Wavelength calibration of the spectra was performed using Helium Neon lamps. Wavelengths were converted to the vacuum-heliocentric rest frame and individual spectra were scaled within a sliding window and coadded using 1/ weighting in each pixel. The error spectrum was computed taking into account proper error propagation during the combining process. The achieved spectral resolution is R 300 and the continuum signal-to-noise ratio in the combined spectrum varies between 20 and 40 per pixel. The final combined 1D spectrum together with the SDSS spectrum are shown in Fig. 1.
In order to extract the spatial information from our observations, we model the observed individual 2D spectra in the wavelength range 8100-8700 Å with the sum of the QSO continuum and the [O iii] emission lines. The aim is to study the centroid shift of the emission lines with respect to the centre of the trace and the extent (FWHM) of the emission lines compared to that of the trace in the regions free from emission lines. We subtract the sky from each science frame using the mean sky spectrum extracted from the spatial bins on either side of the QSO trace.
3 Analysis and Results
| Line | Redshift | ||
|---|---|---|---|
| SDSS | IGO | (km s-1) | |
| [O iii]5008 | 0.71275(1) | 0.71275(2) | 04 |
| [O ii]3727 | 0.71285(5) | 0.71268(6) | 3014 |
| [O iii]5008 | 0.70203(14) | 0.70203(10) | 030 |
| [O iii]4960 | 0.69724(10) | 0.69745(9) | 3725 |
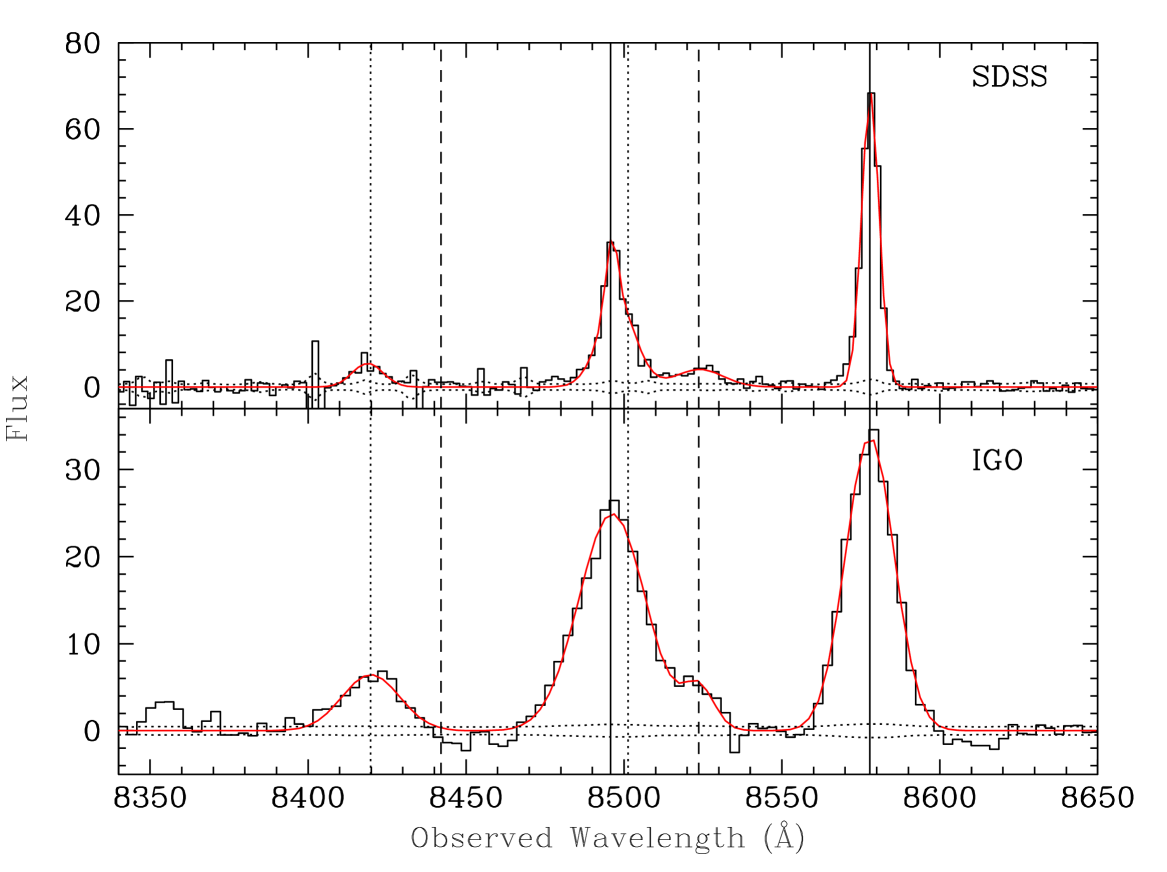
The SDSS observations were carried out on January 19th, 2005. Our observations were taken after a time interval of 4 years. In the rest frame of the object, this corresponds to an elapsed time of 2.35 years. Even though our spectrum covers a wide wavelength range we mainly concentrate on the [O iii] emission lines as they are the strongest ones seen in the spectrum. We fit the [O iii] lines with Gaussians using standard minimisation techniques. The Gaussian fits to IGO and SDSS 1D-spectra are shown in Fig. 2 and the corresponding redshifts are given in Table 2. For individual lines our measurement of the redshift matches well with that from the SDSS spectrum within errors. Using [O iii]5008 of the red system and [O iii]4960 line of the blue system we estimate the 3 limit on the acceleration at the redshift of the QSO to be less than 32 km s-1 yr-1. This is also consistent with the redshift of the red component measured using the [O ii]3727 line.
Note that this is very much comparable to the constraint obtained by Shields et al. (2009a) using [O ii] and [Ne iii] lines. However, it seems that Shields et al.’s values are not computed for the rest-frame elapsed time at the redshift of the QSO and their actual value may be higher by a factor 1.7 (i.e. a 3 limit of 41 km s-1yr-1). Note that the constraint we get is a factor 3 less than the acceleration predicted by Bogdanović et al. (2009). Our good S/N spectrum also confirms the third redshift found by Shields et al. (2009a) at = 0.70280.0002. Using the SDSS spectrum we find that emission from this system does not show any detectable acceleration.
Shields et al. (2009a), suggested that the presence of stellar Calcium H and K lines at redshift, , would undermine the recoil hypothesis. These lines are not detected in our IGO spectrum. We place a 3 upper limit on the rest equivalent width of 0.4 Å for the Ca ii3934 line. However, this is not stringent enough to detect this line with the equivalent width ( 0.2 Å) as seen in the SDSS QSO composite spectrum (Vanden Berk et al., 2001).
| Position | FWHM (arcsec) | Shift (arcsec)3 | |||
|---|---|---|---|---|---|
| Angle (∘) | Trace | L | L | Lb | Lr |
| 66 | 1.31(0.04) | 1.55(0.09) | 1.75(0.07) | 0.06(0.13) | 0.11(0.04) |
| 100 | 1.65(0.23) | 1.72(0.45) | 2.10(0.09) | 0.00(0.08) | 0.13(0.04) |
| 202 | 1.29(0.04) | 1.21(0.09) | 1.70(0.10) | 0.02(0.03) | 0.05(0.04) |
| 299 | 1.30(0.03) | 1.36(0.20) | 1.80(0.08) | 0.10(0.05) | 0.19(0.02) |
1 [O iii]4960 blue system
2 [O iii]5008 red system
3 In the ccd image 1 pixel corresponds to 0.34”.
 |
 |
 |
 |
 |
Next we perform a 2D spectral analysis. We assume the flux perpendicular to the dispersion axis (avoiding the pixels with emission lines) to distribute like a Gaussian around the central pixel (i.e. the spectral PSF is assumed to be Gaussian). The continuum flux along the dispersion axis is approximated with a lower order polynomial. As the wavelength range considered is very small we use a single FWHM for the spectral PSF. In addition to this, the unblended [O iii] lines (i.e. [O iii]5008 of the blue system: and [O iii]4960 of the red system: ) are fitted with 2D Gaussians, using an IDL code based on MPFIT (Markwardt, 2009) which performs -minimisation by applying the Levenberg-Marquart technique.
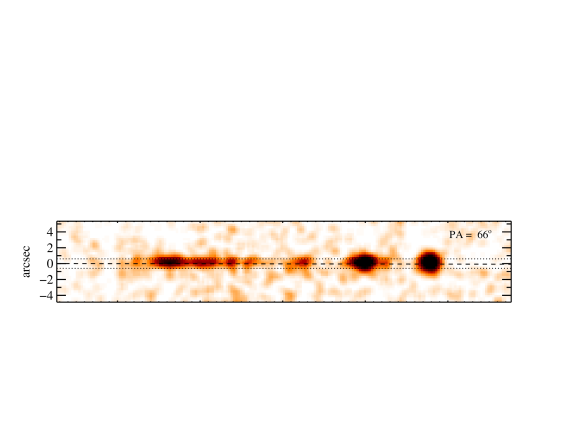
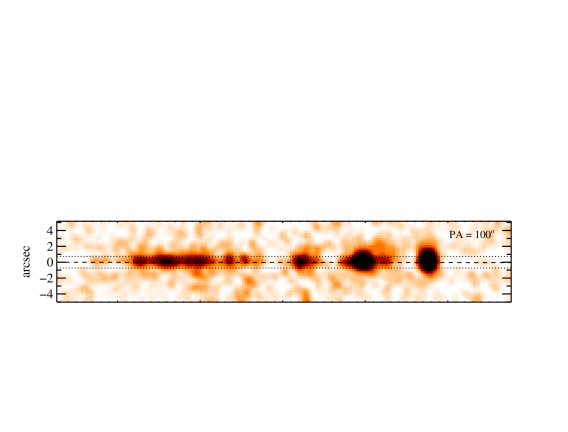
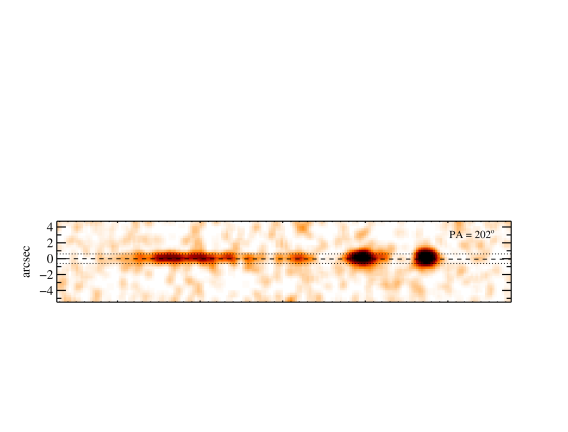
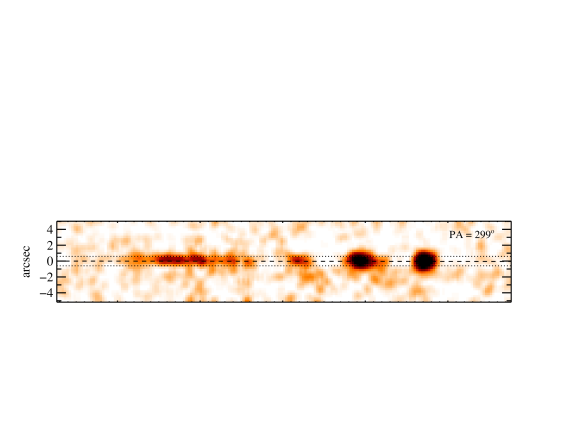
Two dimensional spectra taken at different position angles of the slit after removing the QSO continuum and the background light are shown in the top four panels of Fig. 3. The long dashed line shows the centre of the trace and dotted lines mark the FWHM of the spectral point spread function.
The results of the 2D analysis of the data are summarised in Table 3. The first column in this table gives the position angle. The Gaussian FWHM in the spatial direction for the trace and the two unblended emission lines are listed in the next three columns.
From Table 3 it is clear that the [O iii]5008 line of the red component (i.e Lr) has FWHM that is consistently higher () than the FWHM of the trace. Deconvolving from the spectral PSF (as obtained from the FWHM of the QSO trace), this gives the physical extent of the emitting region FWHM. At z0.7, 1.2” corresponds to a physical extent of 8.4 kpc for a flat universe with = 0.73, = 0.27 and km s-1 Mpc-1 (Komatsu et al., 2009). The FWHM of the [O iii]4960 line of blue component (Lb) is similar to that of the trace. This is consistent with the line emission being unresolved.
The last two entries in Table 3 give the relative spatial shift of the emission line centroids to that of the continuum. It is clear that we see the maximum deviation of the emission line centroids for the position angle 299∘. In particular Lr is shifted by 0.190.02 arcsec from the quasar trace. The shift is confirmed by nearly the opposite value for PA=100∘ while such shifts are not seen in other position angles. The small error is the reflection of the fact that the shift is consistently seen in all the individual exposures. We also note a shift (0.100.05 arcsec) for Lb with respect to the trace for PA=299∘. This is probably not statistically significant as we do not see any shift in the spectrum taken with PA=100∘.
Thus we conclude that our observations provide a tentative evidence of the gas associated with the red component having a projected separation of kpc from the quasar. This can be easily tested either with direct imaging using HST or repeating the same exercise with narrower slit under good seeing conditions.
4 Discussions
We report the analysis of long-slit spectroscopic observations of J09272943. Comparing our extracted 1D spectrum with the SDSS spectrum, obtained 4 years before, we place a 3 constraint on the acceleration between the red and blue component to be less than 32 km s-1yr-1. This is a factor 3 smaller than the one expected for the binary black hole model (Bogdanović et al., 2009). However, this alone could not rule out the binary black hole model but rather tightens the constraints on the orbital parameters (see Shields et al., 2009a). Moreover one of the directly testable predictions of this model is the compact sizes (sub-parsec scale) of the emitting regions (Dotti & Volonteri, 2009). Here we show that the [O iii] emission from the red component originates from an extended region of size 8 kpc. This observation probably rules out the binary black hole model for J09272944.
In the frame work of recoil model with maximally spinning holes we expect the maximum possible kick of 4000 km s-1(Campanelli et al., 2007a). The extended emission from the red component can be understood in this model as an effect of photoionisation by the accretion disc emission associated with the recoiling black hole. Off centred emissions are also expected in these models (see Haehnelt et al., 2006; Loeb, 2007; Guedes et al., 2009). Thus extended [O iii] emission from the red component or the slight offset we found for this emission with respect to the QSO trace alone can not rule out the recoiling black hole scenario.
Heckman et al. (2009) proposed that J09272943 could be a high redshift analog of NGC 1275. Based on a simple model of in-falling gas photoionised by the QSO continuum, Heckman et al. suggested that the observed emission lines could be produced by a gas of density 300 cm-3 at a distance of 8 kpc from the QSO with a projected area of 12 kpc2. The extent of the gas we find ( kpc) for the red component is consistent with Heckman et al.’s simple picture. However we wish to point out that in the case of NGC 1275, 21-cm and X-ray absorption is seen at the higher redshift suggesting the in-falling gas is in between us and the continuum source (De Young et al., 1973). In their calculation, Heckman et al. consider (H) that will be optically thick to Lyman continuum radiation. Such gas is also expected to produce Mg ii absorption if the in-falling gas is well aligned with the QSO. In the SDSS spectrum we do not detect any Mg ii absorption. However, detailed photoionisation modelling is needed to rule out the in falling gas model based on the absence of Mg ii absorption.
Our observations confirm the [O iii]5008 from = 0.7028 reported by Shields et al. (2009a). To explain the three redshifted emission lines, Shields et al. (2009a) proposed a hypothesis in which different emission components originate from a chance alignment of galaxies that are part of a massive cluster.
However there is no clear indication of J09272943 residing in the centre of a galaxy cluster (see Decarli et al., 2009). In the recoil models this third emission line component has to come from the unbound gas that got kicked also with the black hole. Future deep observations under better seeing conditions are needed to provide a strong constraint on the spatial extent of the third system.
5 Acknowledgements
We wish to acknowledge the IUCAA/IGO staff for their support during our observations. We thank K. Subramanian and P. Petitjean for useful comments on the manuscript. We thank Prof. Shyam Tandon for helping us to solve various technical issues related to the IFOSC data reduction. MV gratefully acknowledges University Grants Commission (UGC), INDIA, for support through RFSMS Scheme and IUCAA for hospitality, where most of this work was done. PN acknowledges support from the french Ministry of European and Foreign Affairs.
References
- Bogdanović et al. (2009) Bogdanović, T., Eracleous, M., & Sigurdsson, S., 2009, ApJ, 697, 288
- Boroson & Lauer (2009) Boroson, T. A. & Lauer, T. R., 2009, Nature, 458, 53
- Campanelli et al. (2007a) Campanelli, M., Lousto, C., Zlochower, Y., & Merritt, D., 2007a, ApJ, 659, L5
- Campanelli et al. (2007b) Campanelli, M., Lousto, C. O., Zlochower, Y., & Merritt, D., 2007b, Phys. Rev. Lett., 98, 231102
- Conselice et al. (2001) Conselice, C. J., Gallagher, III, J. S., & Wyse, R. F. G., 2001, AJ, 122, 2281
- Dain et al. (2008) Dain, S., Lousto, C. O., & Zlochower, Y., 2008, Phys. Rev. D, 78, 024039
- De Young et al. (1973) De Young, D. S., Roberts, M. S., & Saslaw, W. C., 1973, ApJ, 185, 809
- Decarli et al. (2009) Decarli, R., Reynolds, M. T., & Dotti, M., 2009, MNRAS, 397, 458
- Dotti & Volonteri (2009) Dotti, M. & Volonteri, M., 2009, in Bulletin of the American Astronomical Society, Vol. 41, Bulletin of the American Astronomical Society, p. 385
- González et al. (2007) González, J. A., Hannam, M., Sperhake, U., Brügmann, B., & Husa, S., 2007, Phys. Rev. Lett., 98, 231101
- Guedes et al. (2009) Guedes, J., Madau, P., Kuhlen, M., Diemand, J., & Zemp, M., 2009, ApJ, accepted [ArXiv:0907.0892]
- Haehnelt et al. (2006) Haehnelt, M. G., Davies, M. B., & Rees, M. J., 2006, MNRAS, 366, L22
- Heckman et al. (2009) Heckman, T. M., Krolik, J. H., Moran, S. M., Schnittman, J., & Gezari, S., 2009, ApJ, 695, 363
- Komatsu et al. (2009) Komatsu, E., Dunkley, J., Nolta, M. R., et al., 2009, ApJS, 180, 330
- Komossa et al. (2008) Komossa, S., Zhou, H., & Lu, H., 2008, ApJ, 678, L81
- Loeb (2007) Loeb, A., 2007, Phys. Rev. Lett., 99, 041103
- Markwardt (2009) Markwardt, C. B., 2009, ArXiv e-prints 0902.2850
- Shields et al. (2009a) Shields, G. A., Bonning, E. W., & Salviander, S., 2009a, ApJ, 696, 1367
- Shields et al. (2009b) Shields, G. A., Rosario, D. J., Smith, K. L., et al., 2009b, ApJ, submitted [ArXiv:0907.3470]
- Tichy & Marronetti (2007) Tichy, W. & Marronetti, P., 2007, Phys. Rev. D, 76, 061502
- Vanden Berk et al. (2001) Vanden Berk, D. E., Richards, G. T., Bauer, A., et al., 2001, AJ, 122, 549