A comparative study of Star Formation processes in different environments
Guillermo F. Hägele
Supervisor: Ángeles I. Díaz Beltrán
Co-Supervisor: Elena Terlevich
![[Uncaptioned image]](/html/0908.4285/assets/figures/escudo_uam.png)
Grupo de Astrofísica
Departamento de Física Teórica
Facultad de Ciencias
Universidad Autónoma de Madrid
A thesis submitted for the admission to the degree of Doctor en Ciencias
Físicas
2008
to Moni and Vale, my two own bright stars
Summary
Several aspects of the star formation processes can be studied from the conditions of the ionized gas that surround the young massive stars formed in the core of the giant molecular clouds in successive episodes. The emission and absorption lines present in their spectra can give us clues about the physical conditions of the gaseous media, such as metal abundances, temperatures and ionization degree, as well as information about the ages, masses and composition of the stellar populations and the properties of the ionizing stellar clusters. Nowadays, with the advent of modern telescopes and new instrumentation with greater capability to collect the information that arrives to us from celestial bodies, we are able to use and develop innovative techniques that allow us to study the star-forming regions in a way without precedent in the history of Astrophysics.
The present thesis deals with the study of two very different environments where star formation is taking place. One, associated with low metal irregular dwarf galaxies, called Hii galaxies, has low density gas of relatively high temperatures and shows evidence for at least one recent violent episode of star formation. In contrast, the second environment, associated with circumnuclear star-forming regions (CNSFRs) in ring patterns located in the central zones ( 1 kpc) of some early type barred spiral galaxies, has low temperature and relatively high density and metal rich gas. In Chapter §1 we give a brief summary of the general properties of these two different king of objects and the studies made on them.
In Chapter §2 we propose a methodology to perform a self-consistent analysis of the physical properties of the emitting gas of Hii galaxies, adequate to the data that can be obtained with XXI century technology. This methodology requires the production and calibration of empirical relations between the different line temperatures that should supersede currently used ones based on very simple, and poorly tested, photo-ionization model sequences.
As a first step to reach this goal, we have obtained simultaneous blue to far red longslit spectra with the double-arm spectrograph of the William Herschel Telescope (WHT) of three compact Hii galaxies selected from the Sloan Digital Sky Survey (SDSS) Data Release 2 (DR2) spectral catalog using the INAOE Virtual Observatory superserver. These spectra cover the range from 3200 to 10500 Å, including the Balmer jump, the [Oii] 3727,29 Å lines, the [Siii] 9069,9532 Å doublet as well as various weak auroral lines such as [Oiii] 4363 Å and [Siii] 6312 Å. In addition, we observed seven luminous Hii galaxies using the 3.5 m telescope at Calar Alto, obtaining high signal-to-noise spectrophotometric observations. We also used a double-arm spectrograph (TWIN) which provides spectra with a wide wavelength coverage, from 3400 to 10400 Å free of second order effects, of exactly the same region of a given galaxy.
The analysis of these observations allowed the design of a methodology to obtain accurate elemental abundances of oxygen, sulphur, nitrogen, neon, argon and iron in the ionized gas. For all the objects we have measured at least four line temperatures, T([Oiii]), T([Siii]), T([Oii]) and T([Sii]), and an electron density, N([Sii]), from the observed forbidden line ratios using a five-level atom approximation. For our best objects, errors of 1% in T([Oiii]), 3% in T([Oii]) and 5% in T([Siii]) were achieved. For three objects also measured the Balmer continuum temperature T(Bac). These measurements and a careful and realistic treatment of the observational errors yielded total oxygen abundances with accuracies between 5 and 9%. These accuracies are expected to improve as better calibrations based on more precise measurements, both on electron temperatures and densities, are produced.
For the objects observed with the WHT we have compared the measurements obtained for our spectra with those performed on the spectra downloaded from the SDSS DR3 finding a satisfactory agreement.
The ionization structure of the observed nebulae can be mapped by the derived oxygen and sulphur ionic ratios, on the one side, and the corresponding observed emission line ratios, on the other – the and ’ plots –. The combination of both is shown to provide a means to test photo-ionization model sequences currently applied to derive elemental abundances in Hii galaxies. The ionization structure found for the observed objects from the O/O and S/S ratios points to high values of the ionizing radiation, as traced by the values of the “softness parameter” which is less than one for all the objects. The use of line temperatures derived from T([Oiii]) based on current photo-ionization models yields for the two highest excitation objects much higher values of which would imply lower ionizing temperatures. This is however inconsistent with the ionization structure as probed by the measured emission line intensity ratios.
Finally, we have measured the T(Bac) for three of the Hii galaxies and computed temperature fluctuations. Only for one of the objects, the temperature fluctuation is significant and could lead to higher oxygen abundances by about 0.20 dex.
In Chapter §3 we present a study of the strong optical collisional emission lines of Ne and Ar in an heterogeneous sample of ionized gaseous nebulae for which it is possible to derive directly the electron temperature and hence the chemical abundances of neon and argon. We calculated, using a grid of photo-ionization models, new ionization correction factors for these two elements and we studied the behavior of the Ne/O and Ar/O abundance ratios with metallicity. We find a constant value for Ne/O, while there seems to be some evidence for the existence of negative radial gradients of Ar/O over the discs of some nearby spirals. We have studied the relation between the intensities of the emission lines of [Neiii] at 3869 Å and [Oiii] at 4959 Å and 5007 Å. This relation can be used in empirical calibrations and diagnostic ratios extending their applicability to bluer wavelengths and therefore to samples of objects at higher redshifts. Finally, we propose a new diagnostic tool using [Oii], [Neiii] and H emission lines to derive metallicities for galaxies at high z.
In Chapter §4 we present the measurements of gas and stellar velocity dispersions in 17 circumnuclear star-forming regions (CNSFRs) and the nuclei of three barred spiral galaxies: NGC 2903, NGC 3310 and NGC 3351 from high dispersion spectra. The stellar dispersions have been obtained from the Caii triplet (CaT) lines at 8494, 8542, 8662 Å, while the gas velocity dispersions have been measured by Gaussian fits to the H 4861 Å and to the [Oiii] 5007 Å lines.
The CNSFRs, with sizes of about 100 to 150 pc in diameter, are seen to be composed of several individual star clusters with sizes between 1.5 and 6.2 pc on Hubble Space Telescope (HST) images. Using the stellar velocity dispersions, we have derived dynamical masses for the entire star-forming complexes and for the individual star clusters. Values of the stellar velocity dispersions are between 31 and 73 km s. Dynamical masses for the whole CNSFRs are between 4.9 10 and 1.9 10 M and between 1.4 10 and 1.1 10 M for the individual star clusters.
We have found indications for the presence of two different kinematical components in the ionized gas of the regions. The narrow component of the two-component Gaussian fits seem to have a relatively constant value for all the studied CNSFRs, with estimated values close to 25 km s. This narrow component could be identified with ionized gas in a rotating disc, while the stars and the fraction of the gas (responsible for the broad component) related to the star-forming regions would be mostly supported by dynamical pressure. To disentangle the origin of these two components it will be necessary to map these regions with higher spectral and spatial resolution and much better signal-to-noise ratio in particular for the O lines.
The radial velocity curves of the central zones of the studied galaxies seem to have turnover points at the same positions as the star-forming ring, and the velocity distribution is consistent with that expected for this type of galaxies.
In Chapter §5 we present longslit observations in the optical and near infrared of 12 circumnuclear Hii regions in the early type spiral galaxies: NGC 2903, NGC 3351 and NGC 3504 with the aim of deriving their chemical abundances. Only for one of the regions, the [Siii] 6312 Å was detected providing, together with the nebular [Siii] lines at 9069, 9532 Å, a value of the electron temperature of T([Siii]) = 8400 K. A semi-empirical method for the derivation of abundances in the high metallicity regime is presented.
We obtain abundances which are comparable to those found in high metallicity disc Hii regions from direct measurements of electron temperatures and consistent with solar values within the errors. The region with the highest oxygen abundance is R3+R4 in NGC 3504, 12+log(O/H) = 8.85, about 1.6 solar if the solar oxygen abundance is set at the value derived by Asplund et al. (2005), 12+log(O/H) = 8.660.05. Region R7 in NGC 3351 has the lowest oxygen abundance of the sample, about 0.6 times solar. In all the observed CNSFR the O/H abundance is dominated by the O/H contribution, as is also the case for high metallicity disc Hii regions. For our observed regions, however also the S/S ratio is larger than one, contrary to what is found in high metallicity disc Hii regions for which, in general, the sulphur abundances are dominated by S/H.
The derived N/O ratios are in average larger than those found in high metallicity disc Hii regions and they do not seem to follow the trend of N/O vs. O/H which marks the secondary behavior of nitrogen. The S/O ratios span a very narrow range between 0.6 and 0.8 of the solar value.
As compared to high metallicity disc Hii regions, CNSFR show values of the O and the N2 parameters whose distributions are shifted to lower and higher values respectively, hence, even though their derived oxygen and sulphur abundances are similar, higher values would in principle be obtained for the CNSFR if pure empirical methods were used to estimate abundances. CNSFR also show lower ionization parameters than their disc counterparts, as derived from the [Sii]/[Siii] ratio. Their ionization structure also seems to be different with CNSFR showing radiation field properties more similar to Hii galaxies than to disc high metallicity Hii regions.
Large part of this thesis has been published in the Monthly Notices of the Royal Astronomical Society (MNRAS) research journal and in conference proceedings:
-
•
Almost all of Chapter §2 has been published in
The temperature and ionization structure of the emitting gas in HII galaxies: Implications for the accuracy of abundance determinations.
G. F. Hägele, E. Pérez-Montero, A. I. Díaz, E. Terlevich and R. Terlevich. 2006, MNRAS, 372, 293.Precision abundance analysis of bright HII galaxies.
G. F. Hägele, A. I. Díaz, E. Terlevich, R. Terlevich, E. Pérez-Montero and M. V. Cardaci. 2008, MNRAS, 383, 209.Proceedings:
“The ionization structure of HII galaxies”. G.F. Hägele, E. Pérez-Montero, A.I. Díaz, E. Terlevich and R. Terlevich. IV Workshop Estallidos de Formación Estelar en Galaxias: Una Aproximación Multifrecuencia, 2006 (CD-rom).
“On the accuracy in the derivation of elemental abundances in HII galaxies”. G. F. Hägele, A. I. Díaz, E. Pérez-Montero, E. Terlevich and R. Terlevich. “Galaxy Evolution Across the Hubble Time” proc. of the IAU Symp. #235 held during the IAU General Assembly in Prague, 2006, Cambridge University Press. Françoise Combes (Chief Editor) and Jan Palouš Eds., Pag. 103.
“On the accuracy in the derivation of elemental abundances of the emitting gas in HII galaxies”. G.F. Hägele, A.I. Díaz, E. Pérez-Montero, E. Terlevich and R. Terlevich. “Highlights of Spanish Astrophysics IV” Proceedings of the VII Scientific Meeting of the Spanish Astronomical Society (SEA) held in Barcelona, September 12-15, 2006, Springer. Eds.: F. Figueras, J.M. Girart, M. Hernanz, C. Jordi. (6 pag., CD-rom).
“Effects of the temperature structure on the derivation of abundances in HII galaxies”. G.F. Hägele, E. Pérez-Montero, A.I. Díaz, E. Terlevich and R. Terlevich. “From Stars to Galaxies: Building the pieces to build up the Universe”, 2007, 374, 143, Astronomical Society of the Pacific Conference Series. Antonella Vallenari, Rosaria Tantalo, Laura Portinari and Alessia Moretti Eds. (2 pag.).
“Precision abundance analysis of bright HII galaxies”. G.F. Hägele, A.I. Díaz, E. Terlevich, R. Terlevich, E. Pérez-Montero and M.V. Cardaci. “II Workshop ASTROCAM”, 2007, proceedings On-line.
-
•
Chapter §3 has been published in
Neon and Argon optical emission lines in ionized gaseous nebulae: Implications and applications.
E. Pérez-Montero, G. F. Hägele, T. Contini and A. I. Díaz. 2007, MNRAS, 381, 125. -
•
Part of Chapter §4 has been published in
Kinematics of gas and stars in the circumnuclear starforming ring of NGC 3351
G. F. Hägele, A. I. Díaz, M. V. Cardaci, E. Terlevich and R. Terlevich. 2007, MNRAS, 378, 163.Erratum: Kinematics of gas and stars in the circumnuclear starforming ring of NGC 3351
G. F. Hägele, A. I. Díaz, M. V. Cardaci, E. Terlevich and R. Terlevich. 2008, MNRAS, 385, 543.Proceedings:
“Velocity Dispersions in Circumnuclear Star Forming Regions”. G.F. Hägele, A.I. Díaz, E. Terlevich and R. Terlevich. The Many Scales in the Universe, JENAM 2004 Astrophysics Reviews, Springer, J.C. del Toro Iniesta, E.J. Alfaro, J.G. Gorgas, E. Salvador-Solé y H. Butcher Eds. (CD-rom).
“Kinematics of metal-rich circumnuclear regions from future 8M class observations”. E. Terlevich, G.F. Hägele, A.I. Díaz, R. Terlevich and M.V. Cardaci. “First Light Science with the GTC”, 2006, Revista Mexicana de Astronomía y Astrofísica (Serie de Conferencias), 29, Pag. 163. R. Guzmán, C. Packham, and J.M. Rodríguez-Espinoza Eds.
“Kinematics of the Circumnuclear Region of NGC 3351”. A.I. Díaz, G.F. Hägele, M.V. Cardaci, E. Terlevich and R. Terlevich. “Galaxy Evolution Across the Hubble Time” proc. of the IAU Symp. #235 held during the IAU General Assembly in Prague, 2006, Cambridge University Press. Françoise Combes (Chief Editor) and Jan Palouš Eds., Pag. 308.
“Kinematics of gas and stars in the circumnuclear starforming ring of NGC 3351”. G.F. Hägele, A.I. Díaz, M.V. Cardaci, E. Terlevich and R. Terlevich. “V Workshop Estallidos de Formación Estelar en Galaxias: Star Formation and Metallicity”, 2007 (CD-rom).
“Kinematics of gas and stars in circumnuclear star-forming regions of early type spirals”. G.F. Hägele, A.I. Díaz, M.V. Cardaci, E. Terlevich and R. Terlevich. “II Workshop ASTROCAM”, 2007, proceedings On-line.
“Kinematics of gas and stars in circumnuclear star-forming regions of early type spirals”. G.F. Hägele, A.I. Díaz, M.V. Cardaci, E. Terlevich and R. Terlevich. “Young massive star clusters: Initial conditions and environments”, 2008, Astrophysics & Space Science, E. Pérez, R. de Grijs and R. González-Delgado Eds (4 pág.).
-
•
Chapter §5 has been published in
The metal abundace of circumnuclear star forming regions in early type spirals. Spectrophotometric observations.
A. I. Díaz, E. Terlevich, M. Castellanos and G. F. Hägele. 2007, MNRAS, 382, 251.Proceedings:
“The metallicity of circumnuclear star forming regions”. A.I. Díaz, E. Terlevich, M. Castellanos and G.F. Hägele. “The Metal Rich Universe”, 2006, Cambridge University Press. (4 pag.; astro-ph/0610787).
“The Metal Abundances of Circumnuclear Star Forming Regions in Early Type Spirals”. E. Terlevich, A.I. Díaz, G.F. Hägele and M. Castellanos. “Galaxy Evolution Across the Hubble Time” proc. of the IAU Symp. #235 held during the IAU General Assembly in Prague, 2006, Cambridge University Press. Françoise Combes (Chief Editor) and Jan Palouš Eds., Pag. 336.
“A spectrophotometric study of the physical parameters of circumnuclear star forming regions”. G.F. Hägele, A.I. Díaz, M.V. Cardaci, E. Terlevich, R. Terlevich and M. Castellanos. “Highlights of Spanish Astrophysics IV” Proceedings of the VII Scientific Meeting of the Spanish Astronomical Society (SEA) held in Barcelona, September 12-15, 2006, Springer. Eds.: F. Figueras, J.M. Girart, M. Hernanz, C. Jordi. (4 pag., CD-rom).
“Spectroscopy of Circumnuclear Star Forming Regions in Early Type Spirals”. M.V. Cardaci, G.F. Hägele, A.I. Díaz, E. Terlevich, R. Terlevich and M. Castellanos. “From Stars to Galaxies: Building the pieces to build up the Universe”, 2007, Astronomical Society of the Pacific Conference Series, 374, 137. Antonella Vallenari, Rosaria Tantalo, Laura Portinari and Alessia Moretti Eds. (2 pag.).
“Physical Parameters in Circumnuclear Star Forming Regions”. G.F. Hägele, M.V. Cardaci, A.I. Díaz, E. Terlevich, R. Terlevich and M. Castellanos. “Massive Stars: Fundamental Parameters and Circumstellar Interactions”, 2007, Revista Mexicana de Astronomía y Astrofísica (Serie de Conferencias). P. Benaglia, G. Bosch and C.E. Cappa Eds. (1 pag.).
“Circumnuclear Regions of Star Formation in Early Type Galaxies”. A.I. Díaz, E. Terlevich, G.F. Hägele and M. Castellanos. “Pathways Through an Eclectic Universe”, 2007, Astronomical Society of the Pacific Conference Series. Johan Knapen, Terry Mahoney and Alexandre Vazdekis Eds. (4 pag.).
“Properties of the ionised gas of circumnuclear star-forming regions in early type spirals”. A.I. Díaz, G.F. Hägele, E. Terlevich and R. Terlevich. “Young massive star clusters: Initial conditions and environments”, 2008, Astrophysics & Space Science, E. Pérez, R. de Grijs and R. González-Delgado Eds. (6 pag.).
Resumen
Se pueden estudiar varios aspectos de los procesos de formación estelar a partir de las condiciones del gas ionizado que rodea a las estrellas masivas y jóvenes formadas en sucesivos episodios en los núcleos de nubes moleculares gigantes. Las líneas de emisión y absorción presentes en sus espectros pueden darnos pistas acerca de las condiciones físicas del medio gaseoso, tales como la abundancia de metales, temperaturas y grado de ionización, así como también información acerca de las edades, masas y composición química de las poblaciones estelares y las propiedades de los cúmulos estelares ionizantes. Hoy en día, con el advenimiento de los telescopios modernos y de nueva instrumentación con mayor capacidad para recolectar la información que nos llega de los cuerpos celestes, estamos en condiciones de utilizar y desarrollar técnicas innovadoras que nos permitan estudiar las regiones de formación estelar de una manera sin precedente en la historia de la Astrofísica.
La presente tesis trata del estudio de dos entornos muy diferentes donde está teniendo lugar formación estelar a gran escala. Uno, asociado con galaxias irregulares enenas de baja metalicidad, llamadas galaxias Hii, contiene gas de baja densidad, temperatura relativamente alta y muestra al menos un episodio de formación estelar violenta. Por el contrario, el segundo ambiente, asociado con regiones circunnucleares de formación estelar (CNSFRs) en patrones anulares localizados en las zonas centrales ( 1 kpc) de algunas galaxias espirales barradas de tipo temprano, contiene gas de temperatura baja y densidad relativamente alta, rico en metales. En el Capítulo §1 se da un breve resumen de las propiedades generales y de los estudios llevados a cabo en estas dos clases diferentes de objetos.
En el Capítulo §2 se propone una metodología para realizar un análisis autoconsistente de las propiedades físicas del gas emisor en galaxias Hii adecuado a los datos que se pueden obtener con la tecnología del siglo XXI. Esta metodología requiere la producción y la calibración de relaciones empíricas entre las diferentes temperaturas de línea que debería reemplazar los actualmente utilizados basados en secuencias de modelos de fotoionización excesivamente simples y pobremente contrastados.
Como primer paso para alcanzar esta meta hemos obtenido espectros de rendija larga simultáneos desde el azul hasta el rojo lejano con el espectrógrafo de doble brazo del telescopio William Herschel (WHT), de tres galaxias Hii compactas seleccionadas del catálogo espectral Sloan Digital Sky Survey (SDSS) Data Release 2 (DR2) utilizando el superservidor del observatorio virtual del INAOE. Estos espectros cubren el rango desde 3200 hasta 10500 Å, incluyendo el salto de Balmer, las líneas de [Oii] 3727,29 Å, el doblete [Siii] 9069,9532 Å como también varias líneas aurorales débiles tales como [Oiii] 4363 Å y [Siii] 6312 Å. Además, observamos siete galaxias Hii luminosas usando el telescopio de 3.5 m de Calar Alto, obteniendo observaciones espectrofotométricas con alta relación señal a ruido. Nuevamente, utilizamos un espectrografo de doble brazo (TWIN) que proporciona espectros con una cobertura amplia en longitud de onda, desde 3400 a 10400 Ålibre de efectos de segundo orden, de exactamente la misma región de una galaxia dada.
El análisis de estas observaciones nos ha permitido definir una metodología para obtener abundancias elementales precisas de oxígeno, azufre, nitrógeno, neón, argón y hierro en el gas ionizado. Para todos los objetos se han medido por lo menos cuatro temperaturas de línea: T([Oiii]), T([Siii]), T([Oii]) and T([Sii]), y una densidad electrónica, N([Sii]), a partir de los cocientes de las líneas prohibidas observadas, utilizando una aproximación del átomo de cinco niveles. Para nuestros mejores objetos, se han obtenido errores de 1% en T([Oiii]), 3% en T([Oii]) y 5% en T([Siii]). Para tres objetos se ha medido tambiénla temperatura del continuo de Balmer, T(Bac). Con estas medidas y un tratamiento cuidadoso y realista de los errores observacionales, se obtuvieron abundancias totales de oxígeno con uan precisión entre 5 y 9%. Se espera que estas precisiones mejoren cuando se produzcan mejores calibraciones basadas en medidas más precisas, tanto de temperaturas electrónicas como de densidades.
Para los objetos observados con el WHT, hemos comparado las medidas realizadas sobre nuestros espectros on las que hemos hecho sobre los descargados del SDSS DR3, encontando un acuerdo satisfactorio.
La estructura de ionización de una nebulosa puede trazarse mediante el cociente de las abundancias iónica de oxígeno y azufre, por un lado, y el correspondiente cociente de líneas de emisión observadas, por el otro – los gráficos de y ’ –. Se muestra que la combinación de ambos proporciona un modo de comprobar las secuencias de modelos de foto-ionización actualmente aplicadas para derivar abundancias elementales en galaxias Hii. La estructura de ionización encontrada para los objetos observados, a partir de los cocientes O/O y S/S, apunta hacia altos valores de la temperatura de la radiación ionizante, como se ve a partir de los valores del “parámetro de suavidad” (“softness parameter”) que es menor que uno para todos los objetos. El uso de temperaturas de línea derivadas a partir de T([Oiii]) basadas en modelos actuales de foto-ionización dan como resultado, para los dos objetos con mayor excitación, valores mucho mayores de que podrían implicar temperaturas de ionización menores. Sin embargo, como se comprueba a partir de las intensidades medidas de las líneas de emisión. esto es inconsistente con la estructura de ionización.
Finalmente, hemos medido T(Bac) para tres galaxias Hii y calculado las fluctuaciones de temperatura. Solamente para uno de los objetos la fluctuación de temperatura es significativa y puede dar como resultado abundancias de oxígeno mayores en aproximadamente 0.20 dex.
En el Capítulo §3 presentamos un estudio de las líneas de emisión colisionales intensas en el óptico de Ne y Ar en una muestra heterogénea de nebulosas gaseosas ionizadas para las cuales es posible derivar directamente la temperatura electrónica y por lo tanto las abundancias químicas de neón y argón. Se han calculado nuevos factores de corrección de ionización para estos dos elementos químicos utilizando un conjunto de modelos de foto-ionización y se ha estudiado el comportamiento de los cocientes de abundancias Ne/O y Ar/O con la metalicidad. Mientras que se ha encontrado un valor constante para Ne/O, parece haber alguna evidencia de la existencia de un gradiente radial negativo de Ar/O en los discos de algunas espirales cercanas. Se ha estudiado también la relación entre las intensidades de las líneas de emisión de [Neiii] a 3869 Å y [Oiii] a 4959 Å y 5007 Å. Esta relación puede utilizarse en calibraciones empíricas y diagramas de diagnóstico, extendiendo su aplicación a longitudes de onda más azules y por lo tanto a muestras de objetos con corrimientos hacia el rojo mayores. Finalmente, proponemos una nueva herramienta de diagnóstico utilizando las líneas de emisión de [Oii], [Neiii] y H para derivar metalicidades para galaxias a alto z.
En el Capítulo §4 presentamos medidas de la dispersión de velocidades en 17 regiones de formación estelar circunnucleares (CNSFRs) y los núcleos de tres galaxias espirales barradas: NGC 2903, NGC 3310 y NGC 3351 a partir de espectros de alta dispersión. Las dispersiones estelares han sido obtenidas de las líneas del triplete de Caii (CaT) a 8494, 8542, 8662 Å, mientras que las dispersiones de velocidades del gas han sido medidas mediante ajustes gaussianos a las líneas de H 4861 Å y de [Oiii] 5007 Å.
Las CNSFRs, con tamaños de alrededor de 100 a 150 pc en diametro, parecen estar compuestas por varios cúmulos estelares individuales con tamaños entre 1.5 y 6.2 pc medidos sobre imagenes del Telescopio Espacial Hubble (HST). Utilizando las dispersiones de velocidades estelares, hemos derivado las masas dinámicas para los complejos de formación estelar completos y para los cúmulos estelares individuales. Los valores de la dispersión de velocidades estelares están entre 31 y 73 km s. Las masas dinámicas para las CNSFRs completas están entre 4.9 10 y 1.9 10 M y entre 1.4 10 y 1.1 10 M para los cúmulos estelares individuales.
Hemos encontrado indicaciones de la presencia de dos componentes cinemáticas diferentes en el gas ionizado de las regiones. La componente estrecha proporcionada por el ajuste de dos-componentes gausianas, parece tener un valor relativamente constante para todas las CNSFRs estudiadas, con los valores estimados muy próximos a 25 km s. Esta componente estrecha podría identificarse con gas ionizado en un disco rotante, mientras que las estrellas y la fracción de gas (responsable de la componente ancha) relacionadas con las regiones de formación estelar, estarían mayormente soportadas por presión dinámica. Para distinguir el origen de estas dos componentes habrá que cartografiar estas regiones con alta resolución espectral y espacial con una relación señal-ruido mucho mayor, particularmente para las líneas de O.
Las curvas de velocidad radial de las zonas centrales de las galaxias estudiadas parecen tener máximos y mínimos relativos en la misma posición que el anillo de formación estelar, y la distribución de velocidades es consistente con la esperada para esta clase de galaxias.
En el Capítulo §5 se presentan observaciones de rendija larga en el óptico y en el infrarrojo cercano de 12 regiones Hii circunnucleares en las galaxias espirales de tipo temprano: NGC 2903, NGC 3351 and NGC 3504 con el propósito de derivar sus abundancias químicas. Sólo para una de las regiones, se detectó la línea [Siii] 6312 Å proporcionando, junto con las líneas nebulares de [Siii] en 9069, 9532 Å, un valor de la temperatura electrónica de T([Siii]) = 8400 K. Se presenta un método semi-empírico para la derivación de las abundancias en el régimen de alta metalicidad.
Usando este método, se han obtenido abundancias que son comparables con las encontradas en regiones Hii de disco de alta metalicidad, con medidas directas de temperaturas electrónicas y son consistentes con valores solares dentro de los errores. La región con la abundancia de oxígeno más alta es R3+R4 en NGC 3504, 12+log(O/H) = 8.85, alrededor de 1.6 veces solar si la abundancia de oxígeno solar se fija en el valor derivado por Asplund et al. (2005), 12+log(O/H) = 8.660.05. La región R7 en NGC 3351 tiene la abundancia de oxígeno más baja de la muestra, alrededor de 0.6 veces la solar. En todas las CNSFRs observadas la abundancia de O/H está dominada por la contribución de O/H, como es también el caso para las regiones Hii de disco de alta metalicidad. Sin embrago, para nuestras regiones observadas, también el cociente S/S es mayor que uno, contrario a lo que se encuentra en las regiones Hii de disco de alta metalicidad para las cuales, en general, la abundancia de azufre está dominada por S/H.
El cociente de N/O derivado para las CNSFR es en promedio mayor que los encontrados en las regiones Hii de disco de alta metalicidad y no parecen seguir la tendencia de N/O vs. O/H que marca el comportamiento secundario del nitrógeno. El cociente de S/O se comprende un rango muy estrecho entre 0.6 y 0.8 veces el valor solar.
Comparadas con las regiones Hii de disco de alta metalicidad, las CNSFRs muestran valores de los parámetros O y N2 cuyas distribuciones están desplazadas hacia valores más bajos y más altos respectivamente; por lo tanto, aunque sus abundancias derivadas de azufre y oxígeno son similares, se btendrían valores mayores para las CNSFRs si se utilizaran métodos puramente empíricos para estimar las abundancias. Las CNSFRs también muestran parámetros de ionización menores que los de sus contrapartidas de disco, como se deriva a partir del cociente [Sii]/[Siii]. Sus estructuras de ionización también parecen ser diferentes: las CNSFRs muestran propiedades del campo de radiación más similares a las galaxias Hiique a las regiones Hii de disco de alta metalicidad.
Gran parte de esta tesis ha sido publicada en la revista de investigación Monthly Notices of the Royal Astronomical Society (MNRAS) y en proceedings de conferencias:
-
•
Casi todo el Capítulo §2 ha sido publicado en
The temperature and ionization structure of the emitting gas in HII galaxies: Implications for the accuracy of abundance determinations.
G. F. Hägele, E. Pérez-Montero, A. I. Díaz, E. Terlevich and R. Terlevich. 2006, MNRAS, 372, 293.Precision abundance analysis of bright HII galaxies.
G. F. Hägele, A. I. Díaz, E. Terlevich, R. Terlevich, E. Pérez-Montero and M. V. Cardaci. 2008, MNRAS, 383, 209.Proceedings:
“The ionization structure of HII galaxies”. G.F. Hägele, E. Pérez-Montero, A.I. Díaz, E. Terlevich and R. Terlevich. IV Workshop Estallidos de Formación Estelar en Galaxias: Una Aproximación Multifrecuencia, 2006 (CD-rom).
“On the accuracy in the derivation of elemental abundances in HII galaxies”. G. F. Hägele, A. I. Díaz, E. Pérez-Montero, E. Terlevich and R. Terlevich. “Galaxy Evolution Across the Hubble Time” proc. of the IAU Symp. #235 held during the IAU General Assembly in Prague, 2006, Cambridge University Press. Françoise Combes (Chief Editor) and Jan Palouš Eds., Pag. 103.
“On the accuracy in the derivation of elemental abundances of the emitting gas in HII galaxies”. G.F. Hägele, A.I. Díaz, E. Pérez-Montero, E. Terlevich and R. Terlevich. “Highlights of Spanish Astrophysics IV” Proceedings of the VII Scientific Meeting of the Spanish Astronomical Society (SEA) held in Barcelona, September 12-15, 2006, Springer. Eds.: F. Figueras, J.M. Girart, M. Hernanz, C. Jordi. (6 pag., CD-rom).
“Effects of the temperature structure on the derivation of abundances in HII galaxies”. G.F. Hägele, E. Pérez-Montero, A.I. Díaz, E. Terlevich and R. Terlevich. “From Stars to Galaxies: Building the pieces to build up the Universe”, 2007, 374, 143, Astronomical Society of the Pacific Conference Series. Antonella Vallenari, Rosaria Tantalo, Laura Portinari and Alessia Moretti Eds. (2 pag.).
“Precision abundance analysis of bright HII galaxies”. G.F. Hägele, A.I. Díaz, E. Terlevich, R. Terlevich, E. Pérez-Montero and M.V. Cardaci. “II Workshop ASTROCAM”, 2007, proceedings On-line.
-
•
El Capítulo §3 ha sido publicado en
Neon and Argon optical emission lines in ionized gaseous nebulae: Implications and applications.
E. Pérez-Montero, G. F. Hägele, T. Contini and A. I. Díaz. 2007, MNRAS, 381, 125. -
•
Parte del Capítulo §4 ha sido publicado en
Kinematics of gas and stars in the circumnuclear starforming ring of NGC 3351
G. F. Hägele, A. I. Díaz, M. V. Cardaci, E. Terlevich and R. Terlevich. 2007, MNRAS, 378, 163.Erratum: Kinematics of gas and stars in the circumnuclear starforming ring of NGC 3351
G. F. Hägele, A. I. Díaz, M. V. Cardaci, E. Terlevich and R. Terlevich. 2008, MNRAS, 385, 543.Proceedings:
“Velocity Dispersions in Circumnuclear Star Forming Regions”. G.F. Hägele, A.I. Díaz, E. Terlevich and R. Terlevich. The Many Scales in the Universe, JENAM 2004 Astrophysics Reviews, Springer, J.C. del Toro Iniesta, E.J. Alfaro, J.G. Gorgas, E. Salvador-Solé y H. Butcher Eds. (CD-rom).
“Kinematics of metal-rich circumnuclear regions from future 8M class observations”. E. Terlevich, G.F. Hägele, A.I. Díaz, R. Terlevich and M.V. Cardaci. “First Light Science with the GTC”, 2006, Revista Mexicana de Astronomía y Astrofísica (Serie de Conferencias), 29, Pag. 163. R. Guzmán, C. Packham, and J.M. Rodríguez-Espinoza Eds.
“Kinematics of the Circumnuclear Region of NGC 3351”. A.I. Díaz, G.F. Hägele, M.V. Cardaci, E. Terlevich and R. Terlevich. “Galaxy Evolution Across the Hubble Time” proc. of the IAU Symp. #235 held during the IAU General Assembly in Prague, 2006, Cambridge University Press. Françoise Combes (Chief Editor) and Jan Palouš Eds., Pag. 308.
“Kinematics of gas and stars in the circumnuclear starforming ring of NGC 3351”. G.F. Hägele, A.I. Díaz, M.V. Cardaci, E. Terlevich and R. Terlevich. “V Workshop Estallidos de Formación Estelar en Galaxias: Star Formation and Metallicity”, 2007 (CD-rom).
“Kinematics of gas and stars in circumnuclear star-forming regions of early type spirals”. G.F. Hägele, A.I. Díaz, M.V. Cardaci, E. Terlevich and R. Terlevich. “II Workshop ASTROCAM”, 2007, proceedings On-line.
“Kinematics of gas and stars in circumnuclear star-forming regions of early type spirals”. G.F. Hägele, A.I. Díaz, M.V. Cardaci, E. Terlevich and R. Terlevich. “Young massive star clusters: Initial conditions and environments”, 2008, Astrophysics & Space Science, E. Pérez, R. de Grijs and R. González-Delgado Eds (4 pág.).
-
•
El Capítulo §5 ha sido publicado en
The metal abundace of circumnuclear star forming regions in early type spirals. Spectrophotometric observations.
A. I. Díaz, E. Terlevich, M. Castellanos and G. F. Hägele. 2007, MNRAS, 382, 251.Proceedings:
“The metallicity of circumnuclear star forming regions”. A.I. Díaz, E. Terlevich, M. Castellanos and G.F. Hägele. “The Metal Rich Universe”, 2006, Cambridge University Press. (4 pag.; astro-ph/0610787).
“The Metal Abundances of Circumnuclear Star Forming Regions in Early Type Spirals”. E. Terlevich, A.I. Díaz, G.F. Hägele and M. Castellanos. “Galaxy Evolution Across the Hubble Time” proc. of the IAU Symp. #235 held during the IAU General Assembly in Prague, 2006, Cambridge University Press. Françoise Combes (Chief Editor) and Jan Palouš Eds., Pag. 336.
“A spectrophotometric study of the physical parameters of circumnuclear star forming regions”. G.F. Hägele, A.I. Díaz, M.V. Cardaci, E. Terlevich, R. Terlevich and M. Castellanos. “Highlights of Spanish Astrophysics IV” Proceedings of the VII Scientific Meeting of the Spanish Astronomical Society (SEA) held in Barcelona, September 12-15, 2006, Springer. Eds.: F. Figueras, J.M. Girart, M. Hernanz, C. Jordi. (4 pag., CD-rom).
“Spectroscopy of Circumnuclear Star Forming Regions in Early Type Spirals”. M.V. Cardaci, G.F. Hägele, A.I. Díaz, E. Terlevich, R. Terlevich and M. Castellanos. “From Stars to Galaxies: Building the pieces to build up the Universe”, 2007, Astronomical Society of the Pacific Conference Series, 374, 137. Antonella Vallenari, Rosaria Tantalo, Laura Portinari and Alessia Moretti Eds. (2 pag.).
“Physical Parameters in Circumnuclear Star Forming Regions”. G.F. Hägele, M.V. Cardaci, A.I. Díaz, E. Terlevich, R. Terlevich and M. Castellanos. “Massive Stars: Fundamental Parameters and Circumstellar Interactions”, 2007, Revista Mexicana de Astronomía y Astrofísica (Serie de Conferencias). P. Benaglia, G. Bosch and C.E. Cappa Eds. (1 pag.).
“Circumnuclear Regions of Star Formation in Early Type Galaxies”. A.I. Díaz, E. Terlevich, G.F. Hägele and M. Castellanos. “Pathways Through an Eclectic Universe”, 2007, Astronomical Society of the Pacific Conference Series. Johan Knapen, Terry Mahoney and Alexandre Vazdekis Eds. (4 pag.).
“Properties of the ionised gas of circumnuclear star-forming regions in early type spirals”. A.I. Díaz, G.F. Hägele, E. Terlevich and R. Terlevich. “Young massive star clusters: Initial conditions and environments”, 2008, Astrophysics & Space Science, E. Pérez, R. de Grijs and R. González-Delgado Eds. (6 pag.).
Chapter 1 Introduction
1.1 Overview
Gas content, masses, bar structure, and dynamical environment can strongly influence the large-scale star formation rate (SFR) along the Hubble sequence [1998ARA&A..36..189K]. The variation of young stellar content and star formation activity is one of the most conspicuous characteristic along this sequence, and this variation in the young stellar population is part of the basis of the morphological classification made by [1926ApJ....64..321H]. The trend in SFRs and star formation histories along the Hubble sequence was confirmed from evolutionary synthesis models of galaxy colours by [1968ApJ...151..547T, 1972A&A....20..383T] and [1973ApJ...179..427S]. Later, the importance of the star formation bursting mode in the evolution of low-mass galaxies and interacting systems was studied by [1976PhDT.........6B, 1977ApJ...217..928H] and [1978ApJ...219...46L].
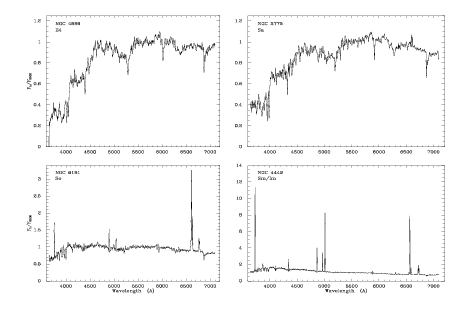
Due to their different average SFR, the integrated spectra of galaxies vary considerably along the Hubble sequence. In Figure 1.1 we show a comparison of the integrated spectra of one elliptical (E4), two spirals (Sa and Sc) and one Magellanic irregular galaxy from [1992ApJS...79..255K]. In these examples one can easily appreciate that they are broadly different. From ellipticals to irregulars, as SFR increases, there is a rise in the blue continuum, a gradual change in the dominant stellar composite spectrum in absorption (from K-giant to A-stars), and a dramatical increase in the strengths of the nebular emission lines [1998ARA&A..36..189K].
The main trends in SFRs and star formation histories along the Hubble sequence can be delineated from measurements of the integrated SFRs in hundreds of nearby galaxies [1998ARA&A..36..189K]. Large-scale star formation processes occur in two very different environments, in the extended discs of spiral and irregular galaxies and in compact, dense gas discs in the center of galaxies. The total star formation in the local universe has a very important contribution from these two mechanisms of stellar formation, which are traced at different wavelengths and follow completely different patterns along the Hubble sequence [1998ARA&A..36..189K].
1.1.1 Gas ionization, metallicity and massive star formation
The star formation processes depend strongly on the physical conditions of the media in which they take place. Among these conditions, the most important are the density of the molecular and gaseous material, its spatial distribution and its metallicity, conditions that restrict the effectiveness and the star formation rate, as well as its initial mass function. In particular, the metallicity is a key parameter that controls many aspects in the formation and evolution of stars and galaxies.
There are many processes that control the metallicity in a galaxy or a gaseous nebula, such as the galaxy formation and evolution, massive star formation, stellar winds, chemical yields, outflows and inflows, etc [2000A&ARv..10....1K].
Due to the nature of the galaxies (except for the nearest systems) almost all the information about their star formation properties is collected from integrated light measurements of the ultraviolet continuum, far-infrared and nebular emission recombination lines [1998ARA&A..36..189K]. In particular, the study of the gas ionized by the most massive stars can provide information about their masses, temperatures and evolutionary state. This in itself requires the use of photo-ionization, stellar atmosphere and stellar evolution models. The subsequent link between the massive star properties and those of the global star formation needs also the use of evolutionary synthesis models.
Photoionized gas shows a characteristic emission line spectrum and, in principle, the spectra of Hii galaxies, galactic Hii regions, giant extragalactic Hii regions (GEHRs), circumnuclear and even nuclear regions, can be analyzed in the same way. The emission line intensities are controlled by: the energy distribution of the ionizing photons, the spatial configuration of the ionized gas and its local properties, essentially its density and metal content. In fact, this last parameter conforms the appearance of the emission line spectra to such an extent that it imposes the methodology required for its analysis.
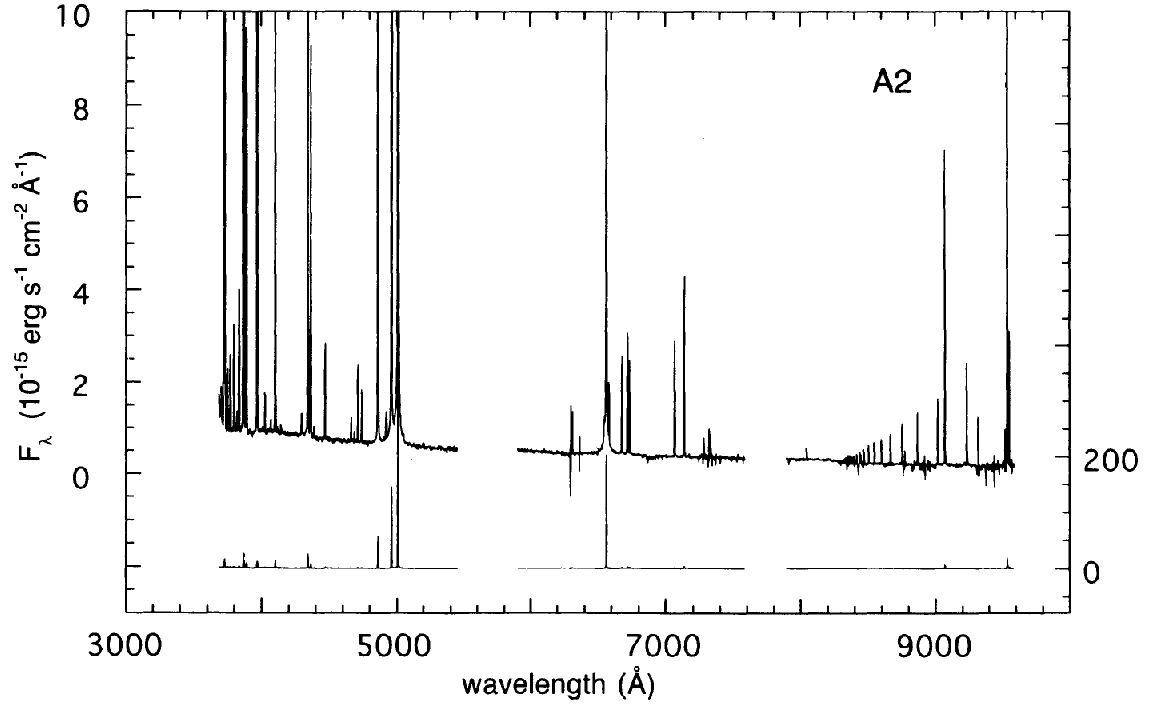
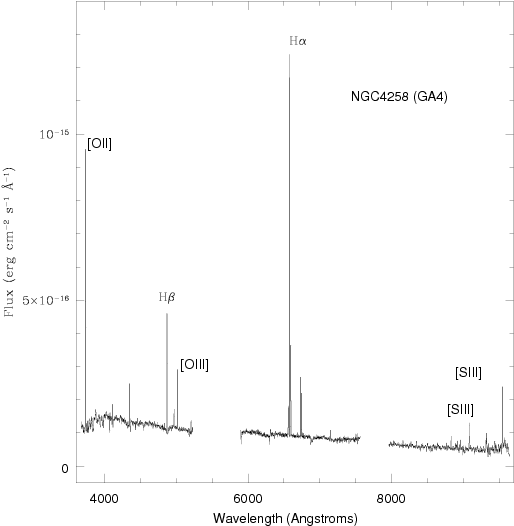
Figure 1.2 shows typical spectra of two Hii regions of widely different metallicities. The low metallicity one (upper panel), corresponding to knot A of NGC 2363 [1994ApJ...437..239G], shows very strong [Oii], [Oiii] lines, the Balmer and Paschen series are clearly visible and the weak auroral lines of [Oii] and [Sii] are detectable and measurable. This makes possible the application of what is called “the direct method” for abundance determination (see for example [1992MNRAS.255..325P]). The high metallicity spectrum (lower panel), corresponding to an Hii region (GA4) in the spiral disc of NGC 4258 (Díaz et al., 2000), looks very different. The high oxygen content provides a very efficient cooling of the region and therefore the emission lines are, in general, weaker. No intrinsically weak lines are detected and the “direct method” is not applicable.
The application of these different methodologies to the optical spectroscopic data through the years, which constitutes our main body of information about global star formation in galaxies, has produced a strongly biased view. Due both to selection effects and analysis requirements, most of the objects observed and analyzed are those that show oxygen emission lines near to their maximum intensity, which itself corresponds to a narrow range of abundances.
One of the main aims of this work is to enlarge our view by first obtaining a high quality set of data for low metallicity objects that allows to refine the “direct method” for abundance determination increasing its accuracy, and second obtaining a set of data on the highest abundance objects to allow the definition of an appropriate scheme for abundance determinations for these objects. Once this is made, the interpretation of the observed emission line spectra in terms of the properties of star formation can be made.
Hii galaxies and circumnuclear star-forming regions (CNSFRs) constitute two obvious samples to serve our purposes since they represent two extreme classes in metal content. Hii galaxies are among the lowest metallicity objects known, whereas CNSFRs have high metallicities, between solar and twice solar, as estimated from empirical calibrators (see for example [1991A&AS...91..285T] and [1998ApJ...498..541K]).
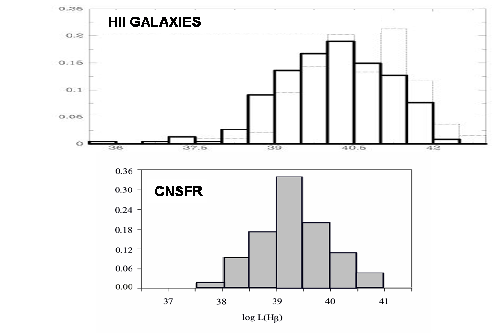
An interesting point in the comparison of the physical properties and the ionizing stellar populations of these two kinds of objects is their H luminosity distribution. In Figure 1.3 we show the histograms that represent these distributions for Hii galaxies [2006MNRAS.365..454H] and CNSFRs [tesismar] in the upper and lower panels respectively. The Hii galaxies are further split into those with a measurable [Oiii] 4363 Å auroral emission line (solid line) and those without (dashed line). We can see that the distributions differ and that the study of the star formation properties of only the first of them would already provide a biased view.
In relation to the CNSFRs, the distribution of the Hii galaxies peaks at greater values of the H luminosity and the width of the distribution in order of magnitude is also larger. Yet, there is a rather significant overlap which imply that, if the SFR is derived from the H luminosities [1989ApJ...344..685K], CNSFRs can form as many stars per year (the equivalent in M yr) as some Hii galaxies.
In what follows we describe some of the general properties of these objects which are relevant to our study.
1.1.2 Hii Galaxies: Star Formation in low metallicity environments
[1972ApJ...173...25S] reported the discovery of two extragalactic objects with very low metal abundances: IZw18 and IIZw40, two very well studied galaxies at present. They pointed out that these galaxies should be either young, in the sense that most of their star formation has occurred in recent times, or that the star formation in them should have occured in intense bursts which are separated by long quiescent periods, since their derived abundances are one order of magnitude lower than the solar value.
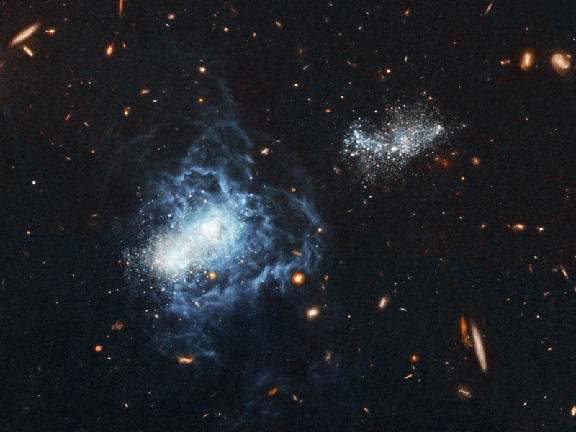
In Figure 1.4 we show a false colour image of IZw18 [1966ApJ...143..192Z]. It was once thought to be one of the youngest galaxies since its bright stars indicated an age of only 500 million years. The galaxy was also intriguing because it resembled galaxies forming in the very early universe although it is a nearby object (14.6 1.0 Mpc; [2000ApJ...529..786Mtot]) and is surrounded by galaxies that are significantly older. Relatively recent images of IZw18 by the HST have helped resolve this mystery, by discovering a population of old faint stars intertwined with the bright star population. Therefore, IZw18 is now thought to be just as old as its neighbours, roughly 10 years old, but with an intense episode of relatively new star formation [1999AJ....118..302A]. As was pointed out by Aloisi et al., the trigger for this recent episode of bright star formation is possibly the changing gravitational influence of the smaller companion galaxy of IZw18, visible at the upper right in the Figure.
IZw18 and IIZw40 are nowadays ascribed to the category of Hii galaxies. Hii galaxies are a subclass of Blue Compact Dwarf galaxies (BCDs) which show spectra with strong emission lines similar to those of GEHRs ([1970ApJ...162L.155S, 1980ApJ...240...41F]), have the lowest metal content of any star forming galaxy known, suggesting that they are among the youngest or less evolved galaxies [2007ApJ...654..226R, 1972ApJ...173...25S].
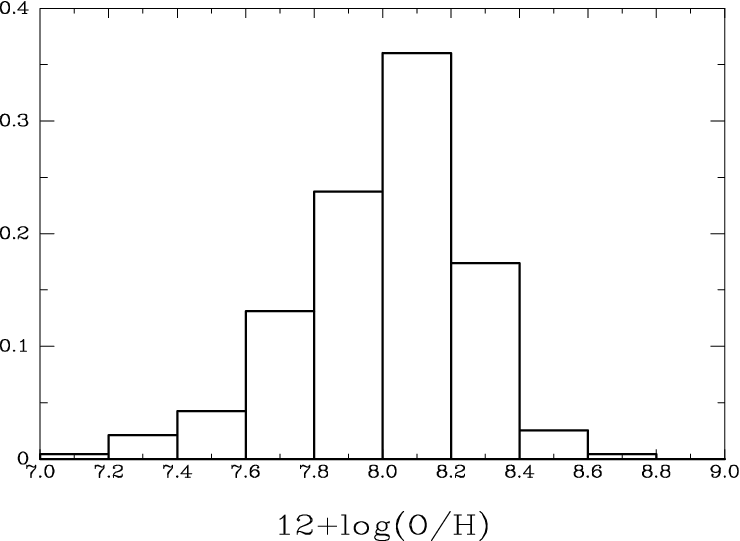
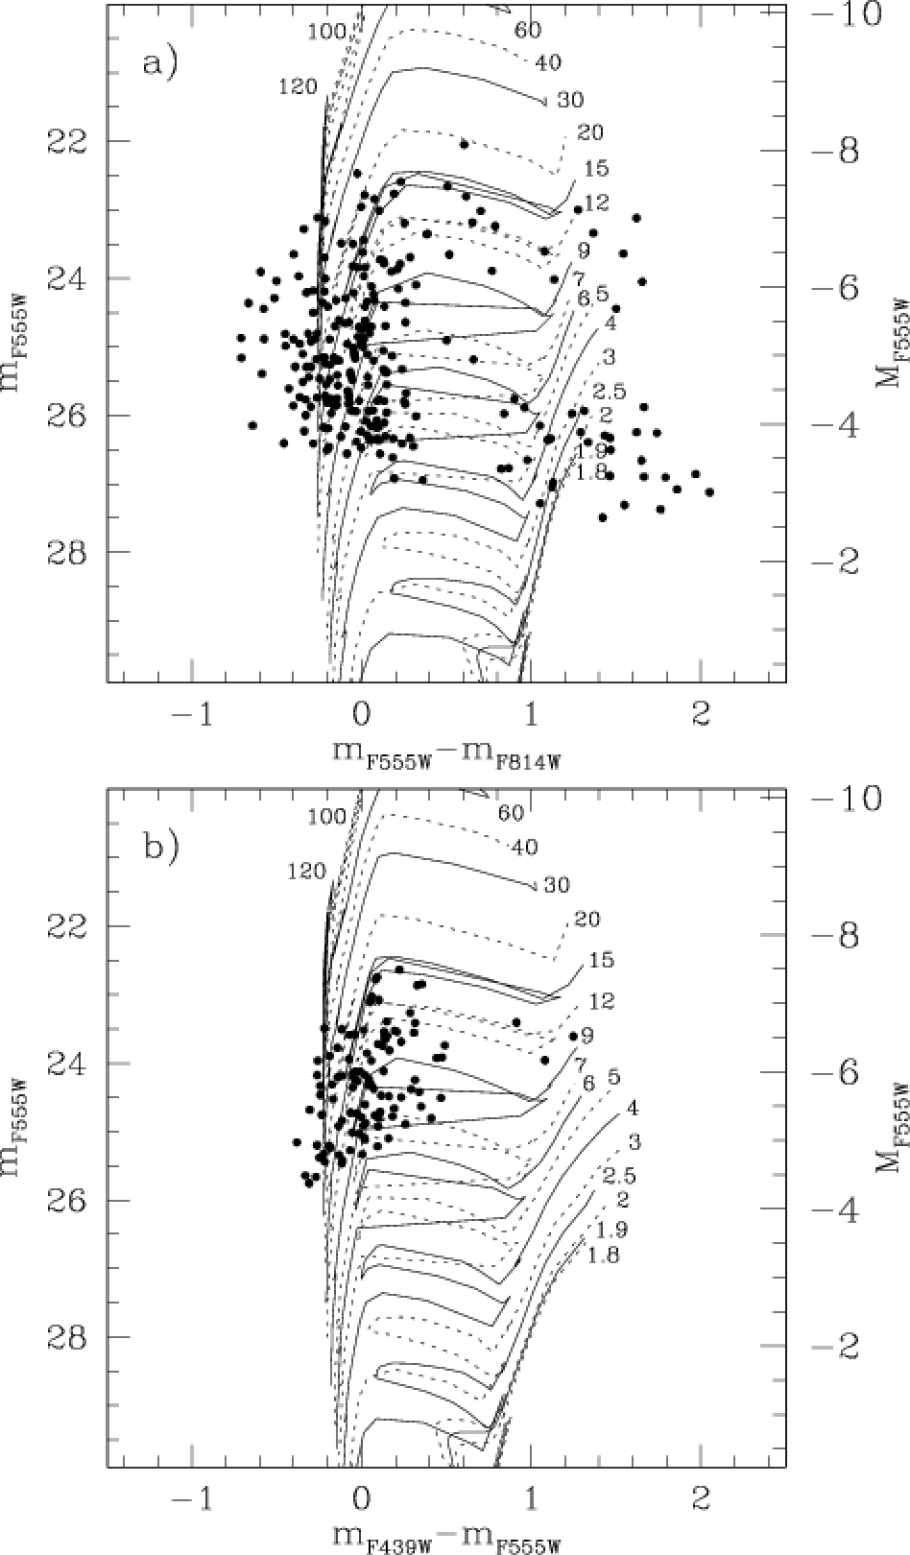
In general, BCDs are characterized by their compact aspect, very low metallicities, gas richness and blue colors [2000A&ARv..10....1K]. In Figure 1.5 we show the oxygen abundance distribution of a sample of Hii galaxies in the local Universe with measurements of the [Oiii] 4363 Å auroral emission line from [2006MNRAS.365..454H]. Although, as mentioned above, these properties have made of them good candidates to host their first episodes of star formation, recently the detection in most of them of low surface-brightness elliptical haloes, or the presence of stars belonging to older populations, have caused this interpretation to be reconsidered. Nowadays, only a few candidates remain controversial. There are several works in the literature whose main aim is to study the weight of these older stellar populations in BCDs and, hence, to find out the actual age and evolutionary status of these objects. Among these studies, in the sample of local objects, observations with enough spatial resolution to provide photometry of the individual stars have allowed, by means of colour-magnitude diagrams, to date some of the bursts (e.g. VIIZw403 by [1998ApJ...493L..23S]; IZw18 by [1999AJ....118..302A], see Figure 1.6). In all these works evidence for a stellar population older than 500 Myr has been found. Besides, old stellar low-surface brightness components have been detected in these local objects by studying the radial light distribution in the optical (e.g. [2003ApJS..147...29G]) and the near infrared (e.g. [2005A&A...429..115N]).
After the findings that a considerable number of the objects observed at intermediate and high redshifts seem to have properties similar to the Hii galaxies we know in the Local Universe, it has been suggested that these objects might have been very common in the past and some of them may have evolved to other kind of objects [1995ApJ...440L..49K].
1.1.3 Circumnuclear Regions: Star Formation in high metallicity environments
The gas flows in disc of spiral galaxies can be strongly perturbed by the presence of bars, although the total disc SFR does not appear to be significantly affected by them [1998ARA&A..36..189K]. These perturbations of the gas flow trigger nuclear star formation in the bulges of some barred spiral galaxies. There is only a modest effect of the spiral arm structure on the global SFR of spiral galaxies [1986ApJ...311..554E, 1986ApJ...311..548M, 1990ApJ...349..497C, 1992ApJ...385L..37K]. Grand-design spiral galaxies (those that have strong two-armed spiral patterns) show strong local enhancements of star formation in their arms, without a corresponding excess in their total SFRs. This suggests that the primary effect of the spiral density wave is to concentrate star formation in the arms, but not to increase the global efficiency [1998ARA&A..36..189K].
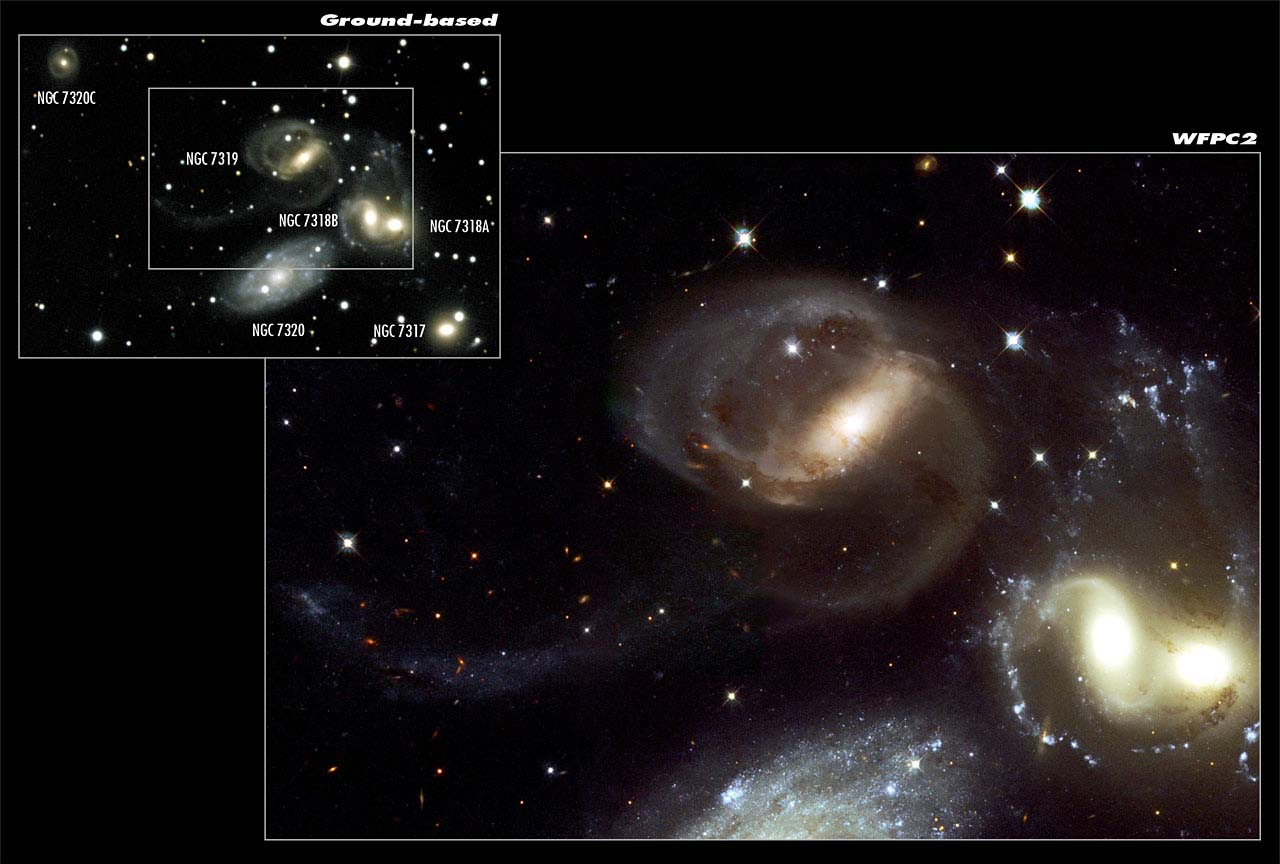
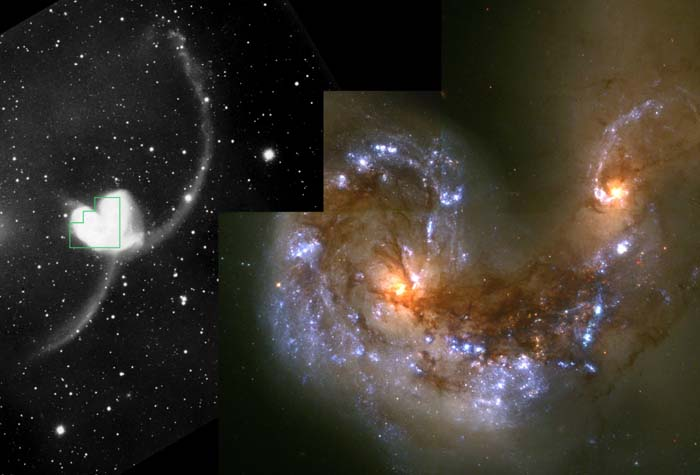
External environmental influences however, can have much stronger effects on the SFR, among them, the most important by far, are tidal interactions. There are several studies of these interactions, in particular on the global H and far-IR emission of these interacting and merging systems, which show a strong excess of star formation (see e.g. [1987AJ.....93.1011K, 1987ApJ...320...49B, 1988ApJ...335...74B, 1988ARA&A..26..343T, 1991ApJ...374..407X, 1995ApJ...450..547L, 1998AJ....115..938B, 2002ApJS..143...47D, 2003ApJS..148..353T, 2004A&A...425..813B, 2005AJ....130.2117S, 2006ApJ...642..158E, 2006AJ....132..197W, 2007AJ....134..527W]). The young extragalactic star clusters belonging to these systems have been the aim of different studies during the last decades (e.g. [1991MNRAS.253..245D, 1992AJ....103..691H, 1993AJ....106.1354W, 1999AJ....118.1551W, 1999AJ....118..752Z, 2005A&A...443...41M, 2005A&A...431..905B, 2006A&A...448..881B, 2007ApJ...664..284T, 2008arXiv0805.2559M]). The two most famous and emblematic examples of this phenomenon are the Stephan’s quintet (see [2001AJ....122..163G], and references therein) and the pair called the Antennae galaxies (see [1995AJ....109..960W], and references therein). In Figure 1.7 we show two spectacular images of them. The enhancement of the SFR is highly variable depending on the star formation conditions, the degree of enhancement ranging from zero in gas-poor galaxies to around 10-100 times in extreme cases [1998ARA&A..36..189K]. Much larger enhancements are often seen in the circumnuclear regions of strongly interacting and merging systems [1998ARA&A..36..189K, 1998ApJ...498..541K].
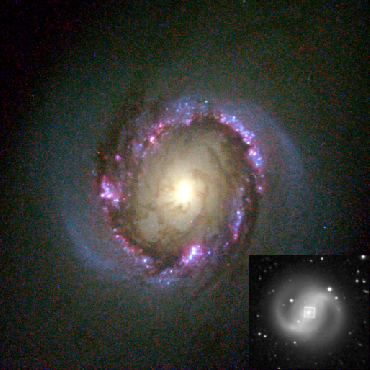
Yet, the bulges of some nearby, non-interacting, spiral galaxies show intense star-forming regions located in a roughly annular pattern around their nuclei. Figure 1.8 shows the central part of NGC 4314 in false colours with the central zone marked in a complete image of the galaxy from McDonald Observatory.
In the middle of last century, [1958PASP...70..364M] classified a total of 608 galaxies from plates obtained mainly by Edwin Hubble in the Mount Wilson-Palomar collection, using as the principal classification criterion the degree of central concentration of light of each galaxy. An apparent fairly common phenomenon in some types of galaxies was pointed out by Morgan: their nuclear regions can consist of an extremely brilliant, small nucleus superposed on a considerably fainter background (NGC 4051), or it may be made up of multiple “hot-spots” (NGC 5248, 1808, 4321, and 3351). Almost a decade later, [1965PASP...77..287S] suggested a relationship between the existence of a bar and the presence of abnormal features in their nuclei for a survey of 35 bright southern galaxies. Inspecting the Hubble plate collection at Pasadena, these authors extended the survey to the whole sky [1967PASP...79..152S]. They restricted their discussion to galaxies brighter than 11.0 total photographic magnitude [1963ApJS....8...31D] in order to include the southern objects previously studied by them. The final sample consisted of 136 galaxies, 20 of which were found to have peculiar nuclei, among them NGC 2903, 3310 and 3351, the galaxies studied in Chapter §4. They found that 14 % of these galaxies presented peculiar nuclei.
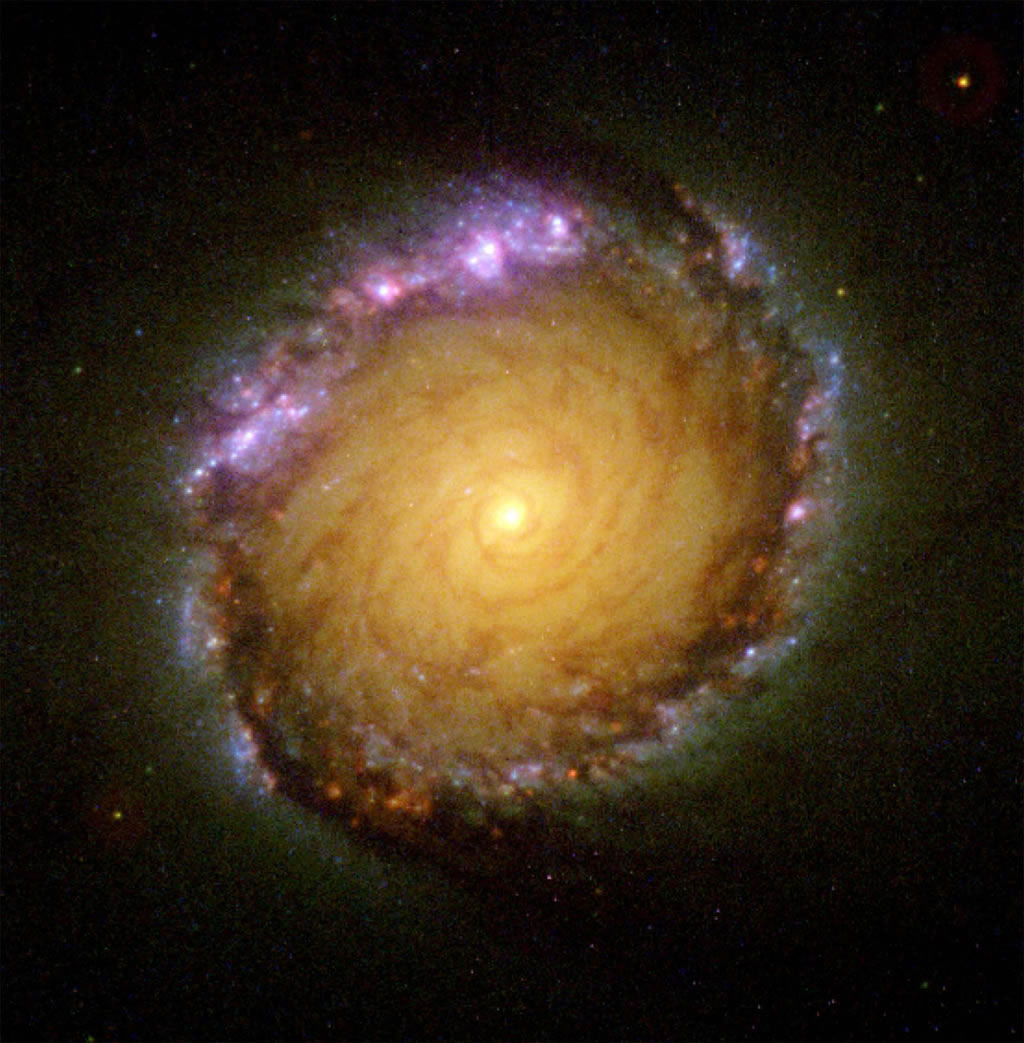
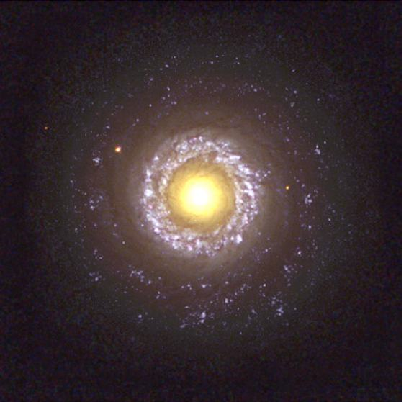

At optical wavelengths, these circumnuclear star-forming regions (CNSFRs) are easily observable rings. In Figure 1.9 we show two false colour images of the central zones of NGC 1512 and NGC 7742, upper and lower panels respectively, which display very nice ring patterns. In the ultraviolet (UV), massive stars dominate the observed circumnuclear emission even in the presence of an active nucleus [1998ApJ...505..174G, 2002ApJ...579..545C]. In Figure 1.10 we show the high-resolution (0.025 px) deep STIS ultraviolet image of the central zone of the spiral galaxy NGC 4303 from [2002ApJ...579..545C]. In this image we can observe in more detail the previously unresolved star forming knots (see the HST-WFPC2 data from [1997ApJ...484L..41C]), whose separation distances are less than 0.2 (15 pc at the adopted distance for this galaxy). As was pointed out by Colina et al., the UV-bright nucleus remains a compact source, showing properties very similar to the circumnuclear stellar clusters G and L.
CNSFRs are also present in galaxies with active nuclei. Cid Fernandes et al. [2001ApJ...558...81C], for a representative sample of 35 Seyfert 2 galaxies, find that about 40 per cent of them show unambiguous evidence of circumnuclear star formation within 300 pc of the nucleus and that these star-forming regions contribute about 30 to 50 per cent to the H total emission of the central zone.
The distinctive nature (with respect to the more extended star formation in discs) of the luminous nuclear star-forming regions was fully revealed with the opening of the mid- and far-IR spectral ranges (see for example [1972ApJ...176L..95R, 1973ApJ...182L..89H, 1978ApJ...220L..37R, 1980ApJ...235..392T]). In general, CNSFRs and giant Hii regions in the discs of galaxies are very much alike, although the former look more compact and show higher peak surface brightness [1989AJ.....97.1022K] than the latter. Their large H luminosities, typically higher than 10 erg s (see Figure 1.3), point to relatively massive star clusters as their ionization source, which minimizes the uncertainties due to small number statistics when applying population synthesis techniques (see e.g. [2002A&A...381...51C]). Added interest in the study of CNSFRs comes from the fact that they are in general of high metal abundance [2006astro.ph..0787D], therefore they provide clues for the understanding of star formation phenomena at large metallicities, and, being close to the nuclear regions, for the determination of metallicity gradients in spiral galaxies.
In Table LABEL:comparisonK we list a brief comparative summary between the characteristics of the more extended star forming discs of spiral galaxies and the circumnuclear star-forming regions (Table 1 of [1998ARA&A..36..189K]). This shows that these two kinds of objects differ in many aspects. The CNSFRs are specially distinctive in terms of the absolute range in SFRs, the much higher spatial concentration of gas and stars, its burst-like nature and its systematic variation with galaxy type [1998ARA&A..36..189K].
| Property | Spiral Discs | Circumnuclear Regions |
|---|---|---|
| Radius | 1 - 30 kpc | 0.2 - 2 kpc |
| SFR | 0 - 20 M yr | 0 - 1000 M yr |
| Bolometric Luminosity | 10 - 10 L | 10 - 10 L |
| Gas Mass | 10 - 10 M | 10 - 10 M |
| Star Formation Timescale | 1 - 50 Gyr | 0.1 - 1 Gyr |
| Gas Density | 1 - 100 M pc | 10 - 10 M pc |
| Optical Depth (0.5 m) | 0 - 2 | 1 - 1000 |
| SFR Density | 0 - 0.1 M yr kpc | 1 - 1000 M yr kpc |
| Dominant Mode | steady state | steady state burst |
| Type Dependence? | strong | weak/none |
| Bar Dependence? | weak/none | strong |
| Spiral Structure Dependence? | weak/none | weak/none |
| Interactions Dependence? | moderate | strong |
| Cluster Dependence? | moderate/weak | ? |
| Redshift Dependence? | strong | ? |
1.2 Main objectives of this work
Spectrophotometry of bright Hii galaxies in the Local Universe allows the determination of abundances from methods that rely on the measurement of emission line intensities and atomic physics (the “direct method” referred to above). In the case of more distant or intrinsically fainter galaxies, the low signal-to-noise obtained with current telescopes precludes the application of this method and empirical ones based on the strongest emission lines are required. The fundamental basis of these empirical methods is reasonably well understood (see e.g. [2005MNRAS.361.1063P]). The accuracy of the results however depends on the goodness of their calibration which in turn depends on a well sampled set of precisely derived abundances by the “direct method” so that interpolation procedures are reliable. Enlarging the calibration range is also important since, at any rate, empirically obtained relations should never be used outside their calibration validity range.
The precise derivation of elemental abundances however is not a straightforward matter. Firstly, accurate measurements of the emission lines are needed. Secondly, a certain knowledge of the ionization structure of the region is required in order to derive ionic abundances of the different elements and in some cases photo-ionization models are needed to correct for unseen ionization states. An accurate diagnostic requires the measurement of faint auroral lines covering a wide spectral range and their accurate (better than 5%) ratios to Balmer recombination lines. These faint lines are usually about 1% of the H intensity. The spectral range must include from the UV [Oii] 3727 Å doublet, to the near IR [Siii] 9069,9532 Å lines. This allows the derivation of the different line temperatures: T([Oii]), T([Sii]), T([Oiii]), T([Siii]), T([Nii]), needed in order to study the temperature and ionization structure of each Hii galaxy considered as a multizone ionized region.
-
One of the main objectives of this thesis has been to design a methodology to perform a self-consistent analysis of the emitting gas in Hii galaxies adequate to the data that can be obtained with the XXI century technology. This methodology requires the production and calibration of empirical relations between the different line temperatures that should replace the commonly used ones based on simplistic, and poorly contrasted, photo-ionization model sequences.
In many cases, CNSFRs show emission line spectra similar to those of disc Hii regions. However, they show a higher continuum from background stellar populations as expected from their circumnuclear location, often inside 500 pc from the galaxy centre. In early type spirals, CNSFRs are also expected to be amongst the highest metallicity regions as corresponds to their position near the galactic bulge. These facts taken together make the analysis of these regions complicated since, in general, their low excitation makes any temperature sensitive line too weak to be measured, particularly against a strong underlying stellar continuum. In fact, in most cases, the [Oiii] 5007 Å line, which is typically one hundred times more intense than the auroral [Oiii] 4363 Å one, can barely be seen.
Accurate measures of elemental abundances of high metallicity regions are crucial to obtain reliable calibrations of empirical abundance estimators, widely used but poorly constrained, whose choice can severely bias results obtained for quantities of the highest relevance for the study of galactic evolution like the luminosity-metallicity (L-Z) relation for galaxies. CNSFRs are also ideal cases to study the behavior of abundance estimators in the high metallicity regime.
-
A second objective has been to develop a semi-empirical method for the derivation of abundances in high metallicity Hii regions that can be applied to the CNSFRs of our study. Given the weakness of the oxygen emission lines in their spectra our study has been based mainly on the sulphur emission lines observed in the far red spectral region.
Although CNSFRs are very luminous, not much is known about their kinematics or dynamics for both the ionized gas and the stars. In fact, the most poorly known property of star forming clusters in galaxies is their mass.
There are different methods to estimate the mass of a stellar cluster. Classically one assumes that the system is virialized and determines the total mass inside a radius by applying the virial theorem to the observed velocity dispersion of the stars (). The stellar velocity dispersion is however hard to measure in young stellar clusters (a few million-years old) due to the shortage of prominent stellar absorption lines. The optical continuum between 3500 and 7000 Å shows very few lines since the light at these wavelengths is dominated by OB stars which have weak absorption lines at the same wavelengths of the nebular emission lines (Balmer H and Hei lines). A better situation is encountered at longer wavelengths (far red). There, the contamination due to nebular lines is much smaller and the stellar [Caii] absorption lines at 8498, 8542, 8662 Å (CaT), if present, can be used. The CaT lines in CNSFRs have previously been detected but at a spectral resolution below that required to measure accurately their velocity dispersions [tesisdiego].
-
A third objective of this work has been to measure the stellar velocity dispersions of selected CNSFRs from the CaT lines and derive their dynamical masses. The comparison of these masses with those inferred from the number of ionizing photons in the region will give an estimate of the contribution of the present star formation episode to the mass proceeding from previous stellar generations and will help to characterize the star formation history of these objects.
A comparison between the velocity dispersions of gas and stars in CNSFRs is also of the greatest importance for the interpretation of the motions of the gas in the clusters and the influence of their gravitational fields. Also, the investigation of the presence of gas infall or outflow in the central regions of the galaxies where CNSFRs reside is important.
-
To perform this comparison has been another objective of this work. For this, we have used high dispersion spectroscopic observations and analysis techniques that involve the simultaneous fit of different velocity components.
1.3 Structure of this thesis
This thesis is structured into two main parts. The first one is related to the sample Hii galaxies, and the second to the CNSFRs.
In Chapter §2 a methodology is proposed to perform a self-consistent analysis of the physical properties of the emitting gas of Hii galaxies, while Chapter §3 is focused on the study of the strong optical collisional emission lines of Ne and Ar in ionized gaseous nebulae for which new ionization correction factors for these two elements are calculated.
Chapters §4 and §5 deal with the study of star formation in circumnuclear regions. The former is dedicated to the study of the kinematical properties of gas and stars in a sample of CNSFRs, and the derivation of their dynamical masses, the masses and some properties of their ionizing stellar cluster, and the masses of the ionized gas, while the latter is devoted to the derivation of their chemical abundances by a semi-empirical method.
Finally, in the last Chapter of this thesis, §6, we present the general conclusions of this work and we list some of the future projects that stem from it.
Bibliography
- Abazajian et al., 2004 Abazajian, K., Adelman-McCarthy, J. K., Agüeros, M. A., Allam, S. S., Anderson, K., Anderson, S. F., Annis, J., Bahcall, N. A., Baldry, I. K., Bastian, S., and 143 coauthors: 2004, Astron. J. 128, 502
- Abazajian et al., 2005 Abazajian, K., Adelman-McCarthy, J. K., Agüeros, M. A., Allam, S. S., Anderson, K. S. J., Anderson, S. F., Annis, J., Bahcall, N. A., Baldry, I. K., Bastian, S., and 144 coauthors: 2005, Astron. J. 129, 1755
- Adelman-McCarthy et al., 2008 Adelman-McCarthy, J. K., Agüeros, M. A., Allam, S. S., Allende Prieto, C., Anderson, K. S. J., Anderson, S. F., Annis, J., Bahcall, N. A., Bailer-Jones, C. A. L., Baldry, I. K., and 153 coauthors: 2008, Astrophys. J., Suppl. Ser. 175, 297
- Adelman-McCarthy et al., 2006 Adelman-McCarthy, J. K., Agüeros, M. A., Allam, S. S., Anderson, K. S. J., Anderson, S. F., Annis, J., Bahcall, N. A., Baldry, I. K., Barentine, J. C., Berlind, A., and 131 coauthors: 2006, Astrophys. J., Suppl. Ser. 162, 38
- Allende-Prieto et al., 2001 Allende-Prieto, C., Lambert, D. L., and Asplund, M.: 2001, Astrophys. J. Letters 556, L63
- Alloin et al., 1979 Alloin, D., Collin-Souffrin, S., Joly, M., and Vigroux, L.: 1979, Astron. Astrophys. 78, 200
- Alloin and Nieto, 1982 Alloin, D. and Nieto, J.-L.: 1982, Astron. and Astrophys. Suppl. Sries 50, 491
- Aloisi et al., 1999 Aloisi, A., Tosi, M., and Greggio, L.: 1999, Astron. J. 118, 302
- Alonso-Herrero et al., 2001a Alonso-Herrero, A., Engelbracht, C. W., Rieke, M. J., Rieke, G. H., and Quillen, A. C.: 2001a, Astrophys. J. 546, 952
- Alonso-Herrero et al., 2000 Alonso-Herrero, A., Rieke, G. H., Rieke, M. J., and Scoville, N. Z.: 2000, Astrophys. J. 532, 845
- Alonso-Herrero et al., 2001b Alonso-Herrero, A., Ryder, S. D., and Knapen, J. H.: 2001b, Mon. Not. R. Astron. Soc. 322, 757
- Álvarez-Álvarez, 2002 Álvarez-Álvarez, M.: 2002, PhD Thesis, Universidad Autónoma de Madrid
- Arp and Sandage, 1985 Arp, H. and Sandage, A.: 1985, Astron. J. 90, 1163
- Asari et al., 2007 Asari, N. V., Cid Fernandes, R., Stasińska, G., Torres-Papaqui, J. P., Mateus, A., Sodré, L., Schoenell, W., and Gomes, J. M.: 2007, Mon. Not. R. Astron. Soc. 381, 263
- Asplund et al., 2005 Asplund, M., Grevesse, N., and Sauval, A. J.: 2005, in T. G. Barnes, III and F. N. Bash (eds.), Cosmic Abundances as Records of Stellar Evolution and Nucleosynthesis, Vol. 336 of Astronomical Society of the Pacific Conference Series, pp 25–+
- Athanassoula, 1992a Athanassoula, E.: 1992a, Mon. Not. R. Astron. Soc. 259, 328
- Athanassoula, 1992b Athanassoula, E.: 1992b, Mon. Not. R. Astron. Soc. 259, 345
- Badnell, 2006 Badnell, N. R.: 2006, Astron. Astrophys. 447, 389
- Bagnuolo, 1976 Bagnuolo, Jr., W. G.: 1976, Ph.D. thesis, AA(California Inst. of Tech., Pasadena.)
- Baldwin et al., 1981 Baldwin, J. A., Phillips, M. M., and Terlevich, R.: 1981, Publ. Astron. Soc. Pac. 93, 5
- Baldwin et al., 1982 Baldwin, J. A., Spinrad, H., and Terlevich, R.: 1982, Mon. Not. R. Astron. Soc. 198, 535
- Balick and Heckman, 1981 Balick, B. and Heckman, T.: 1981, Astron. Astrophys. 96, 271
- Balick and Sneden, 1976 Balick, B. and Sneden, C.: 1976, Astrophys. J. 208, 336
- Balzano, 1983 Balzano, V. A.: 1983, Astrophys. J. 268, 602
- Barker, 1980 Barker, T.: 1980, Astrophys. J. 240, 99
- Barmby et al., 2000 Barmby, P., Huchra, J. P., Brodie, J. P., Forbes, D. A., Schroder, L. L., and Grillmair, C. J.: 2000, Astron. J. 119, 727
- Barth et al., 1995 Barth, A. J., Ho, L. C., Filippenko, A. V., and Sargent, W. L.: 1995, Astron. J. 110, 1009
- Bastian et al., 2005 Bastian, N., Gieles, M., Lamers, H. J. G. L. M., Scheepmaker, R. A., and de Grijs, R.: 2005, Astron. Astrophys. 431, 905
- Bastian et al., 2006 Bastian, N., Saglia, R. P., Goudfrooij, P., Kissler-Patig, M., Maraston, C., Schweizer, F., and Zoccali, M.: 2006, Astron. Astrophys. 448, 881
- Benedict et al., 2002 Benedict, G. F., Howell, D. A., Jørgensen, I., Kenney, J. D. P., and Smith, B. J.: 2002, Astron. J. 123, 1411
- Benjamin et al., 1999 Benjamin, R. A., Skillman, E. D., and Smits, D. P.: 1999, Astrophys. J. 514, 307
- Binney and Tremaine, 1987 Binney, J. and Tremaine, S.: 1987, Galactic dynamics, Princeton, NJ, Princeton University Press, 1987, 747 p.
- Boer and Schulz, 1993 Boer, B. and Schulz, H.: 1993, Astron. Astrophys. 277, 397
- Bosch and Meza, 2001 Bosch, G. and Meza, A.: 2001, in Revista Mexicana de Astronomia y Astrofisica Conference Series, Vol. 11 of Revista Mexicana de Astronomia y Astrofisica, vol. 27, pp 29–+
- Bosch et al., 2001 Bosch, G., Selman, F., Melnick, J., and Terlevich, R.: 2001, Astron. Astrophys. 380, 137
- Bosch et al., 2008 Bosch, G., Terlevich, E., and Terlevich, R.: 2008, Mon. Not. R. Astron. Soc.(submitted)
- Bottinelli et al., 1984 Bottinelli, L., Gouguenheim, L., Paturel, G., and de Vaucouleurs, G.: 1984, Astron. and Astrophys. Suppl. Sries 56, 381
- Bournaud et al., 2004 Bournaud, F., Duc, P.-A., Amram, P., Combes, F., and Gach, J.-L.: 2004, Astron. Astrophys. 425, 813
- Bresolin, 2007 Bresolin, F.: 2007, Astrophys. J. 656, 186
- Bresolin et al., 2004 Bresolin, F., Garnett, D. R., and Kennicutt, Jr., R. C.: 2004, Astrophys. J. 615, 228
- Bresolin and Kennicutt, 1997 Bresolin, F. and Kennicutt, Jr., R. C.: 1997, Astron. J. 113, 975
- Bresolin et al., 1999 Bresolin, F., Kennicutt, Jr., R. C., and Garnett, D. R.: 1999, Astrophys. J. 510, 104
- Bresolin et al., 2005 Bresolin, F., Schaerer, D., González-Delgado, R. M., and Stasińska, G.: 2005, Astron. Astrophys. 441, 981
- Brocklehurst, 1971 Brocklehurst, M.: 1971, Mon. Not. R. Astron. Soc. 153, 471
- Bushouse, 1987 Bushouse, H. A.: 1987, Astrophys. J. 320, 49
- Bushouse et al., 1998 Bushouse, H. A., Telesco, C. M., and Werner, M. W.: 1998, Astron. J. 115, 938
- Bushouse et al., 1988 Bushouse, H. A., Werner, M. W., and Lamb, S. A.: 1988, Astrophys. J. 335, 74
- Butler and Zeippen, 1994 Butler, K. and Zeippen, C. J.: 1994, Astron. and Astrophys. Suppl. Sries 108, 1
- Carlson et al., 1998 Carlson, M. N., Holtzman, J. A., Watson, A. M., Grillmair, C. J., Mould, J. R., Ballester, G. E., Burrows, C. J., Clarke, J. T., Crisp, D., Evans, R. W., Gallagher, III, J. S., Griffiths, R. E., Hester, J. J., Hoessel, J. G., Scowen, P. A., Stapelfeldt, K. R., Trauger, J. T., and Westphal, J. A.: 1998, Astron. J. 115, 1778
- Castellanos et al., 2002 Castellanos, M., Díaz, A. I., and Terlevich, E.: 2002, Mon. Not. R. Astron. Soc. 329, 315
- Cepa and Beckman, 1990 Cepa, J. and Beckman, J. E.: 1990, Astrophys. J. 349, 497
- Cerviño et al., 2002 Cerviño, M., Valls-Gabaud, D., Luridiana, V., and Mas-Hesse, J. M.: 2002, Astron. Astrophys. 381, 51
- Cid Fernandes et al., 2007 Cid Fernandes, R., Asari, N. V., Sodré, L., Stasińska, G., Mateus, A., Torres-Papaqui, J. P., and Schoenell, W.: 2007, Mon. Not. R. Astron. Soc. 375, L16
- Cid Fernandes et al., 2001 Cid Fernandes, R., Heckman, T., Schmitt, H., Delgado, R. M. G., and Storchi-Bergmann, T.: 2001, Astrophys. J. 558, 81
- Cid Fernandes et al., 2005 Cid Fernandes, R., Mateus, A., Sodré, L., Stasińska, G., and Gomes, J. M.: 2005, Mon. Not. R. Astron. Soc. 358, 363
- Colina et al., 1997 Colina, L., García Vargas, M. L., Mas-Hesse, J. M., Alberdi, A., and Krabbe, A.: 1997, Astrophys. J. Letters 484, L41+
- Colina et al., 2002 Colina, L., González-Delgado, R., Mas-Hesse, J. M., and Leitherer, C.: 2002, Astrophys. J. 579, 545
- Combes and Gerin, 1985 Combes, F. and Gerin, M.: 1985, Astron. Astrophys. 150, 327
- Crockett et al., 2006 Crockett, N. R., Garnett, D. R., Massey, P., and Jacoby, G.: 2006, Astrophys. J. 637, 741
- de Robertis et al., 1987 de Robertis, M. M., Dufour, R. J., and Hunt, R. W.: 1987, Royal Astronomical Society of Canada, Journal 81, 195
- de Vaucouleurs, 1963 de Vaucouleurs, G.: 1963, Astrophys. J., Suppl. Ser. 8, 31
- de Vaucouleurs et al., 1991 de Vaucouleurs, G., de Vaucouleurs, A., Corwin, Jr., H. G., Buta, R. J., Paturel, G., and Fouque, P.: 1991, Third Reference Catalogue of Bright Galaxies, Volume 1-3, XII, 2069 pp. 7 figs.. Springer-Verlag Berlin Heidelberg New York
- Denicoló et al., 2002 Denicoló, G., Terlevich, R., and Terlevich, E.: 2002, Mon. Not. R. Astron. Soc. 330, 69
- Denicoló et al., 2002 Denicoló, G., Terlevich, R., and Terlevich, E.: 2002, Mon. Not. R. Astron. Soc. 330, 69
- Devereux, 1989 Devereux, N. A.: 1989, Astrophys. J. 346, 126
- Devereux et al., 1992 Devereux, N. A., Kenney, J. D., and Young, J. S.: 1992, Astron. J. 103, 784
- Díaz, 1989 Díaz, A. I.: 1989, in J. E. Beckman and B. E. J. Pagel (eds.), Evolutionary Phenomena in Galaxies, pp 377–397
- Díaz, 1988 Díaz, A. I.: 1988, Mon. Not. R. Astron. Soc. 231, 57
- Díaz, 1998 Díaz, A. I.: 1998, Astron. Astrophys. Suppl. Ser. 263, 143
- Díaz et al., 2000a Díaz, A. I., Álvarez-Álvarez, M., Terlevich, E., Terlevich, R., Portal, M. S., and Aretxaga, I.: 2000a, Mon. Not. R. Astron. Soc. 311, 120
- Díaz et al., 2000b Díaz, A. I., Castellanos, M., Terlevich, E., and Luisa García-Vargas, M.: 2000b, Mon. Not. R. Astron. Soc. 318, 462
- Díaz and Pérez-Montero, 2000 Díaz, A. I. and Pérez-Montero, E.: 2000, Mon. Not. R. Astron. Soc. 312, 130
- Díaz et al., 1985 Díaz, A. I., Pagel, B. E. J., and Wilson, I. R. G.: 1985, Mon. Not. R. Astron. Soc. 212, 737
- Díaz and Pérez-Montero, 1999 Díaz, A. I. and Pérez-Montero, E.: 1999, in J. R. Walsh and M. R. Rosa (eds.), Chemical Evolution from Zero to High Redshift, pp 134–+
- Díaz et al., 2006 Díaz, A. I., Terlevich, E., Castellanos, M., and Hägele, G. F.: 2006, astro-ph/0610787
- Díaz et al., 2007 Díaz, Á. I., Terlevich, E., Castellanos, M., and Hägele, G. F.: 2007, Mon. Not. R. Astron. Soc. 382, 251
- Díaz et al., 1987 Díaz, A. I., Terlevich, E., Pagel, B. E. J., Víilchez, J. M., and Edmunds, M. G.: 1987, Mon. Not. R. Astron. Soc. 226, 19
- Díaz et al., 1989 Díaz, A. I., Terlevich, E., and Terlevich, R.: 1989, Mon. Not. R. Astron. Soc. 239, 325
- Díaz et al., 1991 Díaz, A. I., Terlevich, E., Vílchez, J. M., Pagel, B. E. J., and Edmunds, M. G.: 1991, Mon. Not. R. Astron. Soc. 253, 245
- Díaz et al., 1999 Díaz, R., Carranza, G., Dottori, H., and Goldes, G.: 1999, Astrophys. J. 512, 623
- Dopita et al., 2002 Dopita, M. A., Pereira, M., Kewley, L. J., and Capaccioli, M.: 2002, Astrophys. J., Suppl. Ser. 143, 47
- Dors et al., 2008 Dors, Jr., O. L., Storchi-Bergmann, T., Riffel, R. A., and Schimdt, A. A.: 2008, astro-ph-0802.2070
- Drake and Testa, 2005 Drake, J. J. and Testa, P.: 2005, Nature 436, 525
- Ellison et al., 2001 Ellison, S. L., Yan, L., Hook, I. M., Pettini, M., Wall, J. V., and Shaver, P.: 2001, Astron. Astrophys. 379, 393
- Elmegreen and Elmegreen, 1986 Elmegreen, B. G. and Elmegreen, D. M.: 1986, Astrophys. J. 311, 554
- Elmegreen et al., 2002 Elmegreen, D. M., Chromey, F. R., McGrath, E. J., and Ostenson, J. M.: 2002, Astron. J. 123, 1381
- Elmegreen et al., 1997 Elmegreen, D. M., Chromey, F. R., Santos, M., and Marshall, D.: 1997, Astron. J. 114, 1850
- Elmegreen et al., 2006 Elmegreen, D. M., Elmegreen, B. G., Kaufman, M., Sheth, K., Struck, C., Thomasson, M., and Brinks, E.: 2006, Astrophys. J. 642, 158
- Elmegreen et al., 2001 Elmegreen, D. M., Kaufman, M., Elmegreen, B. G., Brinks, E., Struck, C., Klarić, M., and Thomasson, M.: 2001, Astron. J. 121, 182
- Elmegreen and Salzer, 1999 Elmegreen, D. M. and Salzer, J. J.: 1999, Astron. J. 117, 764
- Ercolano et al., 2007 Ercolano, B., Bastian, N., and Stasińska, G.: 2007, Mon. Not. R. Astron. Soc. 379, 945
- Esteban et al., 2004 Esteban, C., Peimbert, M., García-Rojas, J., Ruiz, M. T., Peimbert, A., and Rodríguez, M.: 2004, Mon. Not. R. Astron. Soc. 355, 229
- Falco et al., 1999 Falco, E. E., Kurtz, M. J., Geller, M. J., Huchra, J. P., Peters, J., Berlind, P., Mink, D. J., Tokarz, S. P., and Elwell, B.: 1999, Publ. Astron. Soc. Pac. 111, 438
- Ferland et al., 1998 Ferland, G. J., Korista, K. T., Verner, D. A., Ferguson, J. W., Kingdon, J. B., and Verner, E. M.: 1998, Publ. Astron. Soc. Pac. 110, 761
- French, 1980 French, H. B.: 1980, Astrophys. J. 240, 41
- Friedli and Benz, 1995 Friedli, D. and Benz, W.: 1995, Astron. Astrophys. 301, 649
- Galavis et al., 1995 Galavis, M. E., Mendoza, C., and Zeippen, C. J.: 1995, Astron. and Astrophys. Suppl. Sries 111, 347
- Gallagher et al., 2001 Gallagher, S. C., Charlton, J. C., Hunsberger, S. D., Zaritsky, D., and Whitmore, B. C.: 2001, Astron. J. 122, 163
- García-Rojas, 2006 García-Rojas, J.: 2006, PhD Thesis, Universidad de La Laguna
- García Vargas and Díaz, 1994 García Vargas, M. L. and Díaz, A. I.: 1994, Astrophys. J., Suppl. Ser. 91, 553
- García-Rojas and Esteban, 2007 García-Rojas, J. and Esteban, C.: 2007, Astrophys. J. 670, 457
- García-Rojas et al., 2005 García-Rojas, J., Esteban, C., Peimbert, A., Peimbert, M., Rodríguez, M., and Ruiz, M. T.: 2005, Mon. Not. R. Astron. Soc. 362, 301
- García-Rojas et al., 2006 García-Rojas, J., Esteban, C., Peimbert, M., Costado, M. T., Rodríguez, M., Peimbert, A., and Ruiz, M. T.: 2006, Mon. Not. R. Astron. Soc. 368, 253
- García-Rojas et al., 2004 García-Rojas, J., Esteban, C., Peimbert, M., Rodríguez, M., Ruiz, M. T., and Peimbert, A.: 2004, Astrophys. J., Suppl. Ser. 153, 501
- García-Vargas et al., 1995 García-Vargas, M. L., Bressan, A., and Díaz, A. I.: 1995, Astron. and Astrophys. Suppl. Sries 112, 35
- Garnett, 1992 Garnett, D. R.: 1992, Astron. J. 103, 1330
- Garnett, 2002 Garnett, D. R.: 2002, Astrophys. J. 581, 1019
- Garnett et al., 2004 Garnett, D. R., Kennicutt, Jr., R. C., and Bresolin, F.: 2004, Astrophys. J. Letters 607, L21
- Garnett et al., 1997 Garnett, D. R., Shields, G. A., Skillman, E. D., Sagan, S. P., and Dufour, R. J.: 1997, Astrophys. J. 489, 63
- Gil de Paz et al., 2003 Gil de Paz, A., Madore, B. F., and Pevunova, O.: 2003, Astrophys. J., Suppl. Ser. 147, 29
- González-Delgado et al., 2005 González-Delgado, R. M., Cerviño, M., Martins, L. P., Leitherer, C., and Hauschildt, P. H.: 2005, Mon. Not. R. Astron. Soc. 357, 945
- González-Delgado et al., 1998 González-Delgado, R. M., Heckman, T., Leitherer, C., Meurer, G., Krolik, J., Wilson, A. S., Kinney, A., and Koratkar, A.: 1998, Astrophys. J. 505, 174
- González-Delgado and Pérez, 1996 González-Delgado, R. M. and Pérez, E.: 1996, Mon. Not. R. Astron. Soc. 281, 781
- González-Delgado et al., 1995 González-Delgado, R. M., Pérez, E., Díaz, A. I., García-Vargas, M. L., Terlevich, E., and Vílchez, J. M.: 1995, Astrophys. J. 439, 604
- González-Delgado et al., 1994 González-Delgado, R. M., Pérez, E., Tenorio-Tagle, G., Vílchez, J. M., Terlevich, E., Terlevich, R., Telles, E., Rodríguez-Espinosa, J. M., Mas-Hesse, M., García-Vargas, M. L., Díaz, A. I., Cepa, J., and Castañeda, H.: 1994, Astrophys. J. 437, 239
- Graham and et al., 1997 Graham, J. A. and et al.: 1997, Astrophys. J. 477, 535
- Grevesse and Sauval, 1998 Grevesse, N. and Sauval, A. J.: 1998, Space Science Reviews 85, 161
- Groves et al., 2006 Groves, B. A., Heckman, T. M., and Kauffmann, G.: 2006, Mon. Not. R. Astron. Soc. 371, 1559
- Gu et al., 2006 Gu, Q., Melnick, J., Fernandes, R. C., Kunth, D., Terlevich, E., and Terlevich, R.: 2006, Mon. Not. R. Astron. Soc. 366, 480
- Guseva et al., 2007 Guseva, N. G., Izotov, Y. I., Papaderos, P., and Fricke, K. J.: 2007, Astron. Astrophys. 464, 885
- Guseva et al., 2000 Guseva, N. G., Izotov, Y. I., and Thuan, T. X.: 2000, Astrophys. J. 531, 776 (GIT00)
- Guseva et al., 2006 Guseva, N. G., Izotov, Y. I., and Thuan, T. X.: 2006, Astrophys. J. 644, 890
- Guseva et al., 2003a Guseva, N. G., Papaderos, P., Izotov, Y. I., Green, R. F., Fricke, K. J., Thuan, T. X., and Noeske, K. G.: 2003a, Astron. Astrophys. 407, 75
- Guseva et al., 2003b Guseva, N. G., Papaderos, P., Izotov, Y. I., Green, R. F., Fricke, K. J., Thuan, T. X., and Noeske, K. G.: 2003b, Astron. Astrophys. 407, 91
- Guseva et al., 2003c Guseva, N. G., Papaderos, P., Izotov, Y. I., Green, R. F., Fricke, K. J., Thuan, T. X., and Noeske, K. G.: 2003c, Astron. Astrophys. 407, 105
- Guzmán et al., 1998 Guzmán, R., Jangren, A., Koo, D. C., Bershady, M. A., and Simard, L.: 1998, Astrophys. J. Letters 495, L13+
- Guzmán et al., 1996 Guzmán, R., Koo, D. C., Faber, S. M., Illingworth, G. D., Takamiya, M., Kron, R. G., and Bershady, M. A.: 1996, Astrophys. J. Letters 460, L5+
- Hägele et al., 2007 Hägele, G. F., Díaz, A. I., Cardaci, M. V., Terlevich, E., and Terlevich, R.: 2007, Mon. Not. R. Astron. Soc. 378, 163
- Hägele et al., 2008 Hägele, G. F., Díaz, Á. I., Terlevich, E., Terlevich, R., Pérez-Montero, E., and Cardaci, M. V.: 2008, Mon. Not. R. Astron. Soc. 383, 209
- Hägele et al., 2006 Hägele, G. F., Pérez-Montero, E., Díaz, A. I., Terlevich, E., and Terlevich, R.: 2006, Mon. Not. R. Astron. Soc. 372, 293
- Harper and Low, 1973 Harper, Jr., D. A. and Low, F. J.: 1973, Astrophys. J. Letters 182, L89+
- Haynes et al., 1998 Haynes, M. P., van Zee, L., Hogg, D. E., Roberts, M. S., and Maddalena, R. J.: 1998, Astron. J. 115, 62
- Henry, 1989 Henry, R. B. C.: 1989, Mon. Not. R. Astron. Soc. 241, 453
- Ho and Filippenko, 1996a Ho, L. C. and Filippenko, A. V.: 1996a, Astrophys. J. Letters 466, L83+
- Ho and Filippenko, 1996b Ho, L. C. and Filippenko, A. V.: 1996b, Astrophys. J. 472, 600
- Ho et al., 1997 Ho, L. C., Filippenko, A. V., and Sargent, W. L. W.: 1997, Astrophys. J., Suppl. Ser. 112, 315
- Holtzman et al., 1992 Holtzman, J. A., Faber, S. M., Shaya, E. J., Lauer, T. R., Groth, J., Hunter, D. A., Baum, W. A., Ewald, S. P., Hester, J. J., Light, R. M., Lynds, C. R., O’Neil, Jr., E. J., and Westphal, J. A.: 1992, Astron. J. 103, 691
- Holweger, 2001 Holweger, H.: 2001, in R. F. Wimmer-Schweingruber (ed.), Joint SOHO/ACE workshop ”Solar and Galactic Composition”, Vol. 598 of American Institute of Physics Conference Series, pp 23–+
- Hoyos and Díaz, 2006 Hoyos, C. and Díaz, A. I.: 2006, Mon. Not. R. Astron. Soc. 365, 454
- Hubble, 1926 Hubble, E. P.: 1926, Astrophys. J. 64, 321
- Huchra, 1977 Huchra, J. P.: 1977, Astrophys. J. 217, 928
- Israelian and Rebolo, 2001 Israelian, G. and Rebolo, R.: 2001, Astrophys. J. Letters 557, L43
- Izotov et al., 1999 Izotov, Y. I., Chaffee, F. H., Foltz, C. B., Green, R. F., Guseva, N. G., and Thuan, T. X.: 1999, Astrophys. J. 527, 757
- Izotov et al., 2001a Izotov, Y. I., Chaffee, F. H., and Green, R. F.: 2001a, Astrophys. J. 562, 727
- Izotov et al., 2001b Izotov, Y. I., Chaffee, F. H., and Schaerer, D.: 2001b, Astron. Astrophys. 378, L45 (ICS01)
- Izotov et al., 1997a Izotov, Y. I., Lipovetsky, V. A., Chaffee, F. H., Foltz, C. B., Guseva, N. G., and Kniazev, A. Y.: 1997a, Astrophys. J. 476, 698
- Izotov et al., 2004a Izotov, Y. I., Papaderos, P., Guseva, N. G., Fricke, K. J., and Thuan, T. X.: 2004a, Astron. Astrophys. 421, 539
- Izotov et al., 2004b Izotov, Y. I., Stasińska, G., Guseva, N. G., and Thuan, T. X.: 2004b, Astron. Astrophys. 415, 87 (IT04)
- Izotov et al., 2006 Izotov, Y. I., Stasińska, G., Meynet, G., Guseva, N. G., and Thuan, T. X.: 2006, Astron. Astrophys. 448, 955
- Izotov and Thuan, 1998a Izotov, Y. I. and Thuan, T. X.: 1998a, Astrophys. J. 497, 227
- Izotov and Thuan, 1998b Izotov, Y. I. and Thuan, T. X.: 1998b, Astrophys. J. 500, 188 (IT98)
- Izotov and Thuan, 2004 Izotov, Y. I. and Thuan, T. X.: 2004, Astrophys. J. 602, 200
- Izotov et al., 1994 Izotov, Y. I., Thuan, T. X., and Lipovetsky, V. A.: 1994, Astrophys. J. 435, 647 (ITL94)
- Izotov et al., 1997b Izotov, Y. I., Thuan, T. X., and Lipovetsky, V. A.: 1997b, Astrophys. J., Suppl. Ser. 108, 1 (ITL97)
- Jamet et al., 2005 Jamet, L., Stasińska, G., Pérez, E., González-Delgado, R. M., and Vílchez, J. M.: 2005, Astron. Astrophys. 444, 723
- Jarrett et al., 2003 Jarrett, T. H., Chester, T., Cutri, R., Schneider, S. E., and Huchra, J. P.: 2003, Astron. J. 125, 525
- Jiménez-Benito et al., 2000 Jiménez-Benito, L., Díaz, A. I., Terlevich, R., and Terlevich, E.: 2000, Mon. Not. R. Astron. Soc. 317, 907
- Jogee et al., 2005 Jogee, S., Scoville, N., and Kenney, J. D. P.: 2005, Astrophys. J. 630, 837
- Kauffmann et al., 2003 Kauffmann, G., Heckman, T. M., Tremonti, C., Brinchmann, J., Charlot, S., White, S. D. M., Ridgway, S. E., Brinkmann, J., Fukugita, M., Hall, P. B., Ivezić, Ž., Richards, G. T., and Schneider, D. P.: 2003, Mon. Not. R. Astron. Soc. 346, 1055
- Kenney et al., 1992 Kenney, J. D. P., Wilson, C. D., Scoville, N. Z., Devereux, N. A., and Young, J. S.: 1992, Astrophys. J. Letters 395, L79
- Kennicutt et al., 2003 Kennicutt, R. C., Bresolin, F., and Garnett, D. R.: 2003, Astrophys. J. 591, 801(KBG03)
- Kennicutt, 1989 Kennicutt, Jr., R. C.: 1989, Astrophys. J. 344, 685
- Kennicutt, 1992 Kennicutt, Jr., R. C.: 1992, Astrophys. J., Suppl. Ser. 79, 255
- Kennicutt, 1998a Kennicutt, Jr., R. C.: 1998a, Ann. Rev. Astron. Astrophys. 36, 189
- Kennicutt, 1998b Kennicutt, Jr., R. C.: 1998b, Astrophys. J. 498, 541
- Kennicutt and Garnett, 1996 Kennicutt, Jr., R. C. and Garnett, D. R.: 1996, Astrophys. J. 456, 504
- Kennicutt et al., 1989 Kennicutt, Jr., R. C., Keel, W. C., and Blaha, C. A.: 1989, Astron. J. 97, 1022
- Kennicutt et al., 1987 Kennicutt, Jr., R. C., Roettiger, K. A., Keel, W. C., van der Hulst, J. M., and Hummel, E.: 1987, Astron. J. 93, 1011
- Kewley et al., 2001 Kewley, L. J., Dopita, M. A., Sutherland, R. S., Heisler, C. A., and Trevena, J.: 2001, Astrophys. J. 556, 121
- Kewley and Ellison, 2008 Kewley, L. J. and Ellison, S. L.: 2008, ArXiv e-prints 801
- Kingdon and Ferland, 1995 Kingdon, J. and Ferland, G. J.: 1995, Astrophys. J. 442, 714
- Knapen et al., 1992 Knapen, J. H., Beckman, J. E., Cepa, J., van der Hulst, T., and Rand, R. J.: 1992, Astrophys. J. Letters 385, L37
- Kniazev et al., 2003 Kniazev, A. Y., Grebel, E. K., Hao, L., Strauss, M. A., Brinkmann, J., and Fukugita, M.: 2003, Astrophys. J. Letters 593, L73
- Kniazev et al., 2004 Kniazev, A. Y., Pustilnik, S. A., Grebel, E. K., Lee, H., and Pramskij, A. G.: 2004, Astrophys. J., Suppl. Ser. 153, 429
- Kobulnicky et al., 1999 Kobulnicky, H. A., Kennicutt, Jr., R. C., and Pizagno, J. L.: 1999, Astrophys. J. 514, 544
- Koo et al., 1994 Koo, D. C., Bershady, M. A., Wirth, G. D., Stanford, S. A., and Majewski, S. R.: 1994, Astrophys. J. Letters 427, L9
- Koo et al., 1995 Koo, D. C., Guzmán, R., Faber, S. M., Illingworth, G. D., Bershady, M. A., Kron, R. G., and Takamiya, M.: 1995, Astrophys. J. Letters 440, L49
- Kouwenhoven and de Grijs, 2007 Kouwenhoven, M. B. N. and de Grijs, R.: 2007, astro-ph/0710.1207
- Kregel and Sancisi, 2001 Kregel, M. and Sancisi, R.: 2001, Astron. Astrophys. 376, 59
- Kroupa, 2002 Kroupa, P.: 2002, Science 295, 82
- Kunth and Östlin, 2000 Kunth, D. and Östlin, G.: 2000, Astron. Astrophys. Rev 10, 1
- Kunth and Sargent, 1983 Kunth, D. and Sargent, W. L. W.: 1983, Astrophys. J. 273, 81
- Kurtz and Mink, 1998 Kurtz, M. J. and Mink, D. J.: 1998, Publ. Astron. Soc. Pac. 110, 934
- Lamareille et al., 2004 Lamareille, F., Mouhcine, M., Contini, T., Lewis, I., and Maddox, S.: 2004, Mon. Not. R. Astron. Soc. 350, 396
- Larsen et al., 2001 Larsen, S. S., Brodie, J. P., Elmegreen, B. G., Efremov, Y. N., Hodge, P. W., and Richtler, T.: 2001, Astrophys. J. 556, 801
- Larsen et al., 2004 Larsen, S. S., Brodie, J. P., and Hunter, D. A.: 2004, Astron. J. 128, 2295
- Larson and Tinsley, 1978 Larson, R. B. and Tinsley, B. M.: 1978, Astrophys. J. 219, 46
- Lee et al., 2004 Lee, J. C., Salzer, J. J., and Melbourne, J.: 2004, Astrophys. J. 616, 752 (L04)
- Leitherer and Heckman, 1995 Leitherer, C. and Heckman, T. M.: 1995, Astrophys. J., Suppl. Ser. 96, 9
- Leitherer et al., 1992 Leitherer, C., Robert, C., and Drissen, L.: 1992, Astrophys. J. 401, 596
- Leitherer et al., 1999 Leitherer, C., Schaerer, D., Goldader, J. D., Delgado, R. M. G., Robert, C., Kune, D. F., de Mello, D. F., Devost, D., and Heckman, T. M.: 1999, Astrophys. J., Suppl. Ser. 123, 3
- Lennon and Burke, 1994 Lennon, D. J. and Burke, V. M.: 1994, Astron. and Astrophys. Suppl. Sries 103, 273
- Liu and Kennicutt, 1995 Liu, C. T. and Kennicutt, Jr., R. C.: 1995, Astrophys. J. 450, 547
- Liu, 2006 Liu, X.-W.: 2006, in M. J. Barlow and R. H. Méndez (eds.), Planetary Nebulae in our Galaxy and Beyond, Vol. 234 of IAU Symposium, pp 219–226
- Liu et al., 2006 Liu, X.-W., Barlow, M. J., Zhang, Y., Bastin, R. J., and Storey, P. J.: 2006, Mon. Not. R. Astron. Soc. 368, 1959
- Liu et al., 2001 Liu, X.-W., Luo, S.-G., Barlow, M. J., Danziger, I. J., and Storey, P. J.: 2001, Mon. Not. R. Astron. Soc. 327, 141
- Liu et al., 2000 Liu, X.-W., Storey, P. J., Barlow, M. J., Danziger, I. J., Cohen, M., and Bryce, M.: 2000, Mon. Not. R. Astron. Soc. 312, 585
- López, 2005a López, J.: 2005a, MSc Thesis, INAOE
- López, 2005b López, J.: 2005b, MSc Thesis, INAOE
- Luridiana et al., 2003 Luridiana, V., Peimbert, A., Peimbert, M., and Cerviño, M.: 2003, Astrophys. J. 592, 846
- Luridiana et al., 1999 Luridiana, V., Peimbert, M., and Leitherer, C.: 1999, Astrophys. J. 527, 110
- Macchetto et al., 1990 Macchetto, F., Colina, L., Golombek, D., Perryman, M. A. C., and di Serego Alighieri, S.: 1990, Astrophys. J. 356, 389
- Maoz et al., 2001 Maoz, D., Barth, A. J., Ho, L. C., Sternberg, A., and Filippenko, A. V.: 2001, Astron. J. 121, 3048
- Maoz et al., 1996 Maoz, D., Barth, A. J., Sternberg, A., Filippenko, A. V., Ho, L. C., Macchetto, F. D., Rix, H.-W., and Schneider, D. P.: 1996, Astron. J. 111, 2248
- Marconi et al., 2006 Marconi, A., Pastorini, G., Pacini, F., Axon, D. J., Capetti, A., Macchetto, D., Koekemoer, A. M., and Schreier, E. J.: 2006, Astron. Astrophys. 448, 921
- Mas-Hesse and Kunth, 1991 Mas-Hesse, J. M. and Kunth, D.: 1991, Astron. and Astrophys. Suppl. Sries 88, 399
- Mas-Hesse et al., 2003 Mas-Hesse, J. M., Kunth, D., Tenorio-Tagle, G., Leitherer, C., Terlevich, R. J., and Terlevich, E.: 2003, Astrophys. J. 598, 858
- Mateus et al., 2007 Mateus, A., Sodré, L., Cid Fernandes, R., and Stasińska, G.: 2007, Mon. Not. R. Astron. Soc. 374, 1457
- Mateus et al., 2006 Mateus, A., Sodré, L., Cid Fernandes, R., Stasińska, G., Schoenell, W., and Gomes, J. M.: 2006, Mon. Not. R. Astron. Soc. 370, 721
- McCall and Schmidt, 1986 McCall, M. L. and Schmidt, F. H.: 1986, Astrophys. J. 311, 548
- McCrady et al., 2003 McCrady, N., Gilbert, A. M., and Graham, J. R.: 2003, Astrophys. J. 596, 240
- McCrady and Graham, 2007 McCrady, N. and Graham, J. R.: 2007, Astrophys. J. 663, 844
- McGaugh, 1991 McGaugh, S. S.: 1991, Astrophys. J. 380, 140
- Melbourne et al., 2004 Melbourne, J., Phillips, A., Salzer, J. J., Gronwall, C., and Sarajedini, V. L.: 2004, Astron. J. 127, 686 (M04)
- Melnick et al., 1999 Melnick, J., Tenorio-Tagle, G., and Terlevich, R.: 1999, Mon. Not. R. Astron. Soc. 302, 677
- Melnick et al., 1985a Melnick, J., Terlevich, R., and Eggleton, P. P.: 1985a, Mon. Not. R. Astron. Soc. 216, 255
- Melnick et al., 1985b Melnick, J., Terlevich, R., and Moles, M.: 1985b, Revista Mexicana de Astronomia y Astrofisica 11, 91
- Melnick et al., 1988 Melnick, J., Terlevich, R., and Moles, M.: 1988, Mon. Not. R. Astron. Soc. 235, 297
- Melnick et al., 2000 Melnick, J., Terlevich, R., and Terlevich, E.: 2000, Mon. Not. R. Astron. Soc. 311
- Mengel et al., 2005 Mengel, S., Lehnert, M. D., Thatte, N., and Genzel, R.: 2005, Astron. Astrophys. 443, 41
- Mengel et al., 2008 Mengel, S., Lehnert, M. D., Thatte, N. A., Vacca, W. D., Whitmore, B., and Chandar, R.: 2008, ArXiv e-prints 805
- Meurer et al., 1995 Meurer, G. R., Heckman, T. M., Leitherer, C., Kinney, A., Robert, C., and Garnett, D. R.: 1995, Astron. J. 110, 2665
- Meynet et al., 1994 Meynet, G., Maeder, A., Schaller, G., Schaerer, D., and Charbonnel, C.: 1994, Astron. and Astrophys. Suppl. Sries 103, 97
- Miller et al., 1997 Miller, B. W., Whitmore, B. C., Schweizer, F., and Fall, S. M.: 1997, Astron. J. 114, 2381
- Miller and Mathews, 1972 Miller, J. S. and Mathews, W. G.: 1972, Astrophys. J. 172, 593
- Mollá et al., 2006 Mollá, M., Vílchez, J. M., Gavilán, M., and Díaz, A. I.: 2006, Mon. Not. R. Astron. Soc. 372, 1069
- Morgan, 1958 Morgan, W. W.: 1958, Publ. Astron. Soc. Pac. 70, 364
- Morisset et al., 2004 Morisset, C., Schaerer, D., Bouret, J.-C., and Martins, F.: 2004, Astron. Astrophys. 415, 577
- Mould et al., 2000 Mould, J. R., Huchra, J. P., Freedman, W. L., Kennicutt, Jr., R. C., Ferrarese, L., Ford, H. C., Gibson, B. K., Graham, J. A., Hughes, S. M. G., Illingworth, G. D., Kelson, D. D., Macri, L. M., Madore, B. F., Sakai, S., Sebo, K. M., Silbermann, N. A., and Stetson, P. B.: 2000, Astrophys. J. 529, 786
- Mulder and van Driel, 1996 Mulder, P. S. and van Driel, W.: 1996, Astron. Astrophys. 309, 403
- Mulder et al., 1995 Mulder, P. S., van Driel, W., and Braine, J.: 1995, Astron. Astrophys. 300, 687
- Nagao et al., 2006 Nagao, T., Maiolino, R., and Marconi, A.: 2006, Astron. Astrophys. 459, 85
- Nelson and Whittle, 1995 Nelson, C. H. and Whittle, M.: 1995, Astrophys. J., Suppl. Ser. 99, 67
- Noeske et al., 2005 Noeske, K. G., Papaderos, P., Cairós, L. M., and Fricke, K. J.: 2005, Astron. Astrophys. 429, 115
- Oke, 1990 Oke, J. B.: 1990, Astron. J. 99, 1621
- Oke and Gunn, 1983 Oke, J. B. and Gunn, J. E.: 1983, Astrophys. J. 266, 713
- Olive and Skillman, 2001 Olive, K. A. and Skillman, E. D.: 2001, New Astronomy 6, 119
- Olive and Skillman, 2004 Olive, K. A. and Skillman, E. D.: 2004, Astrophys. J. 617, 29
- Origlia et al., 2001 Origlia, L., Leitherer, C., Aloisi, A., Greggio, L., and Tosi, M.: 2001, Astron. J. 122, 815
- Origlia et al., 2004 Origlia, L., Ranalli, P., Comastri, A., and Maiolino, R.: 2004, Astrophys. J. 606, 862
- Osterbrock, 1989 Osterbrock, D. E.: 1989, Astrophysics of gaseous nebulae and active galactic nuclei, Mill Valley, CA, University Science Books
- Osterbrock et al., 1996 Osterbrock, D. E., Fulbright, J. P., Martel, A. R., Keane, M. J., Trager, S. C., and Basri, G.: 1996, Publ. Astron. Soc. Pac. 108, 277
- Östlin et al., 2004 Östlin, G., Cumming, R. J., Amram, P., Bergvall, N., Kunth, D., Márquez, I., Masegosa, J., and Zackrisson, E.: 2004, Astron. Astrophys. 419, L43
- Pagel et al., 1979 Pagel, B. E. J., Edmunds, M. G., Blackwell, D. E., Chun, M. S., and Smith, G.: 1979, Mon. Not. R. Astron. Soc. 189, 95
- Pagel et al., 1992 Pagel, B. E. J., Simonson, E. A., Terlevich, R. J., and Edmunds, M. G.: 1992, Mon. Not. R. Astron. Soc. 255, 325
- Palacios et al., 1997 Palacios, J., García-Vargas, M. L., Díaz, A., Terlevich, R., and Terlevich, E.: 1997, Astron. Astrophys. 323, 749
- Pasquali and Castangia, 2008 Pasquali, A. and Castangia, P.: 2008, Mon. Not. R. Astron. Soc. 385, 468
- Pastorini et al., 2007 Pastorini, G., Marconi, A., Capetti, A., Axon, D. J., Alonso-Herrero, A., Atkinson, J., Batcheldor, D., Carollo, C. M., Collett, J., Dressel, L., Hughes, M. A., Macchetto, D., Maciejewski, W., Sparks, W., and van der Marel, R.: 2007, Astron. Astrophys. 469, 405
- Pastoriza et al., 1993 Pastoriza, M. G., Dottori, H. A., Terlevich, E., Terlevich, R., and Diaz, A. I.: 1993, Mon. Not. R. Astron. Soc. 260, 177
- Pauldrach et al., 2001 Pauldrach, A. W. A., Hoffmann, T. L., and Lennon, M.: 2001, Astron. Astrophys. 375, 161
- Peimbert, 2003 Peimbert, A.: 2003, Astrophys. J. 584, 735
- Peimbert et al., 2002 Peimbert, A., Peimbert, M., and Luridiana, V.: 2002, Astrophys. J. 565, 668
- Peimbert et al., 2005 Peimbert, A., Peimbert, M., and Ruiz, M. T.: 2005, Astrophys. J. 634, 1056
- Peimbert, 1967 Peimbert, M.: 1967, Astrophys. J. 150, 825
- Peimbert, 1971 Peimbert, M.: 1971, Boletin de los Observatorios Tonantzintla y Tacubaya 6, 29
- Peimbert and Costero, 1969 Peimbert, M. and Costero, R.: 1969, Boletin de los Observatorios Tonantzintla y Tacubaya 5, 3
- Peimbert and Peimbert, 2003 Peimbert, M. and Peimbert, A.: 2003, in Revista Mexicana de Astronomia y Astrofisica Conference Series, Vol. 16, pp 113–116
- Peimbert and Peimbert, 2006 Peimbert, M. and Peimbert, A.: 2006, in M. J. Barlow and R. H. Méndez (eds.), Planetary Nebulae in our Galaxy and Beyond, Vol. 234 of IAU Symposium, pp 227–234
- Peimbert et al., 2007 Peimbert, M., Peimbert, A., Esteban, C., García-Rojas, J., Bresolin, F., Carigi, L., Ruiz, M. T., and López-Sánchez, A. R.: 2007, in Revista Mexicana de Astronomia y Astrofisica Conference Series, Vol. 29 of Revista Mexicana de Astronomia y Astrofisica Conference Series, pp 72–79
- Peimbert et al., 2000 Peimbert, M., Peimbert, A., and Ruiz, M. T.: 2000, Astrophys. J. 541, 688
- Peimbert et al., 2004 Peimbert, M., Peimbert, A., Ruiz, M. T., and Esteban, C.: 2004, Astrophys. J., Suppl. Ser. 150, 431
- Peimbert and Torres-Peimbert, 1992 Peimbert, M. and Torres-Peimbert, S.: 1992, Astron. Astrophys. 253, 349
- Pérez et al., 2000 Pérez, E., Márquez, I., Marrero, I., Durret, F., González Delgado, R. M., Masegosa, J., Maza, J., and Moles, M.: 2000, Astron. Astrophys. 353, 893
- Pérez-Montero and Díaz, 2003 Pérez-Montero, E. and Díaz, A. I.: 2003, Mon. Not. R. Astron. Soc. 346, 105 (PMD03)
- Pérez-Montero and Díaz, 2005 Pérez-Montero, E. and Díaz, A. I.: 2005, Mon. Not. R. Astron. Soc. 361, 1063
- Pérez-Montero and Díaz, 2007 Pérez-Montero, E. and Díaz, A. I.: 2007, Mon. Not. R. Astron. Soc. 377, 1195
- Pérez-Montero et al., 2006 Pérez-Montero, E., Díaz, A. I., Vílchez, J. M., and Kehrig, C.: 2006, Astron. Astrophys. 449, 193
- Pérez-Montero et al., 2007 Pérez-Montero, E., Hägele, G. F., Contini, T., and Díaz, Á. I.: 2007, Mon. Not. R. Astron. Soc. 381, 125
- Pérez-Olea, 1996 Pérez-Olea, D.: 1996, PhD Thesis, Universidad Autónoma de Madrid
- Pettini et al., 2001 Pettini, M., Shapley, A. E., Steidel, C. C., Cuby, J.-G., Dickinson, M., Moorwood, A. F. M., Adelberger, K. L., and Giavalisco, M.: 2001, Astrophys. J. 554, 981
- Pettini et al., 2000 Pettini, M., Steidel, C. C., Adelberger, K. L., Dickinson, M., and Giavalisco, M.: 2000, Astrophys. J. 528, 96
- Phillips et al., 1984 Phillips, M. M., Pagel, B. E. J., Edmunds, M. G., and Díaz, A.: 1984, Mon. Not. R. Astron. Soc. 210, 701
- Pilyugin, 2000 Pilyugin, L. S.: 2000, Astron. Astrophys. 362, 325
- Pilyugin, 2007 Pilyugin, L. S.: 2007, Mon. Not. R. Astron. Soc. 375, 685
- Pilyugin et al., 2006 Pilyugin, L. S., Thuan, T. X., and Vílchez, J. M.: 2006, Mon. Not. R. Astron. Soc. 367, 1139
- Pilyugin et al., 2004 Pilyugin, L. S., Vílchez, J. M., and Contini, T.: 2004, Astron. Astrophys. 425, 849
- Piner et al., 1995 Piner, B. G., Stone, J. M., and Teuben, P. J.: 1995, Astrophys. J. 449, 508
- Pizzella et al., 2004 Pizzella, A., Corsini, E. M., Vega Beltrán, J. C., and Bertola, F.: 2004, Astron. Astrophys. 424, 447
- Planesas et al., 1997 Planesas, P., Colina, L., and Pérez-Olea, D.: 1997, Astron. Astrophys. 325, 81
- Popescu and Hopp, 2000 Popescu, C. C. and Hopp, U.: 2000, Astron. and Astrophys. Suppl. Sries 142, 247
- Porter et al., 2005 Porter, R. L., Bauman, R. P., Ferland, G. J., and MacAdam, K. B.: 2005, Astrophys. J. Letters 622, L73
- Prada et al., 1994 Prada, F., Greve, A., and McKeith, C. D.: 1994, Astron. Astrophys. 288, 396
- Pradhan, 1976 Pradhan, A. K.: 1976, Mon. Not. R. Astron. Soc. 177, 31
- Puxley et al., 1990 Puxley, P. J., Hawarden, T. G., and Mountain, C. M.: 1990, Astrophys. J. 364, 77
- Ramsbottom et al., 1996 Ramsbottom, C. A., Bell, K. L., and Stafford, R. P.: 1996, Atomic Data and Nuclear Data Tables 63, 57
- Rieke and Lebofsky, 1978 Rieke, G. H. and Lebofsky, M. J.: 1978, Astrophys. J. Letters 220, L37
- Rieke et al., 1993 Rieke, G. H., Loken, K., Rieke, M. J., and Tamblyn, P.: 1993, Astrophys. J. 412, 99
- Rieke and Low, 1972 Rieke, G. H. and Low, F. J.: 1972, Astrophys. J. Letters 176, L95+
- Roberts et al., 1979 Roberts, Jr., W. W., Huntley, J. M., and van Albada, G. D.: 1979, Astrophys. J. 233, 67
- Rodríguez and Rubin, 2004 Rodríguez, M. and Rubin, R. H.: 2004, in IAU Symp. 217, Recycling Intergallactic and Interstellar Matter, ed. P. A. Duc, J. Braine, and E. Brinks (San Francisco: ASP), pp 188–+ (astro–ph/0312246)
- Rola et al., 1997 Rola, C. S., Terlevich, E., and Terlevich, R. J.: 1997, Mon. Not. R. Astron. Soc. 289, 419
- Rosa-González et al., 2007 Rosa-González, D., Schmitt, H. R., Terlevich, E., and Terlevich, R.: 2007, Astrophys. J. 654, 226
- Rubin et al., 2002 Rubin, R. H., Bhatt, N. J., Dufour, R. J., Buckalew, B. A., Barlow, M. J., Liu, X.-W., Storey, P. J., Balick, B., Ferland, G. J., Harrington, J. P., and Martin, P. G.: 2002, Mon. Not. R. Astron. Soc. 334, 777
- Rubin et al., 1975 Rubin, V. C., Peterson, C. J., and Ford, Jr., W. K.: 1975, Astrophys. J. 199, 39
- Ruiz et al., 2003 Ruiz, M. T., Peimbert, A., Peimbert, M., and Esteban, C.: 2003, Astrophys. J. 595, 247
- Sakamoto et al., 1999 Sakamoto, K., Okumura, S. K., Ishizuki, S., and Scoville, N. Z.: 1999, Astrophys. J. 525, 691
- Salpeter, 1955 Salpeter, E. E.: 1955, Astrophys. J. 121, 161
- Sánchez-Portal et al., 2000 Sánchez-Portal, M., Díaz, Á. I., Terlevich, R., Terlevich, E., Álvarez Álvarez, M., and Aretxaga, I.: 2000, Mon. Not. R. Astron. Soc. 312, 2
- Sargent, 1970 Sargent, W. L. W.: 1970, Astrophys. J. 160, 405
- Sargent and Searle, 1970 Sargent, W. L. W. and Searle, L.: 1970, Astrophys. J. Letters 162, L155+
- Schulte-Ladbeck et al., 1998 Schulte-Ladbeck, R. E., Crone, M. M., and Hopp, U.: 1998, Astrophys. J. Letters 493, L23+
- Searle and Sargent, 1972 Searle, L. and Sargent, W. L. W.: 1972, Astrophys. J. 173, 25
- Searle et al., 1973 Searle, L., Sargent, W. L. W., and Bagnuolo, W. G.: 1973, Astrophys. J. 179, 427
- Sérsic and Pastoriza, 1965 Sérsic, J. L. and Pastoriza, M.: 1965, Publ. Astron. Soc. Pac. 77, 287
- Sérsic and Pastoriza, 1967 Sérsic, J. L. and Pastoriza, M.: 1967, Publ. Astron. Soc. Pac. 79, 152
- Shaw and Dufour, 1995 Shaw, R. A. and Dufour, R. J.: 1995, Publ. Astron. Soc. Pac. 107, 896
- Sheth et al., 2005 Sheth, K., Vogel, S. N., Regan, M. W., Thornley, M. D., and Teuben, P. J.: 2005, Astrophys. J. 632, 217
- Shields and Kennicutt, 1995 Shields, J. C. and Kennicutt, Jr., R. C.: 1995, Astrophys. J. 454, 807
- Siegel et al., 2005 Siegel, E. R., Guzmán, R., Gallego, J. P., Orduña López, M., and Rodríguez-Hidalgo, P.: 2005, Mon. Not. R. Astron. Soc. 356, 1117
- Skillman and Kennicutt, 1993 Skillman, E. D. and Kennicutt, Jr., R. C.: 1993, Astrophys. J. 411, 655 (SK93)
- Skillman et al., 1994 Skillman, E. D., Televich, R. J., Kennicutt, Jr., R. C., Garnett, D. R., and Terlevich, E.: 1994, Astrophys. J. 431, 172 (S94)
- Smith et al., 2005 Smith, B. J., Struck, C., Appleton, P. N., Charmandaris, V., Reach, W., and Eitter, J. J.: 2005, Astron. J. 130, 2117
- Smith et al., 1996 Smith, D. A., Neff, S. G., Bothun, G. D., Fanelli, M. N., Offenberg, J. D., Waller, W. H., Bohlin, R. C., O’Connell, R. W., Roberts, M. S., Smith, A. M., and Stecher, T. P.: 1996, Astrophys. J. Letters 473, L21+
- Smith et al., 2002 Smith, L. J., Norris, R. P. F., and Crowther, P. A.: 2002, Mon. Not. R. Astron. Soc. 337, 1309
- Stasińska and Izotov, 2003 Stasińska, G. and Izotov, Y.: 2003, Astron. Astrophys. 397, 71
- Stasińska, 1978 Stasińska, G.: 1978, Astron. Astrophys. 66, 257
- Stasińska, 1980 Stasińska, G.: 1980, Astron. Astrophys. 84, 320
- Stasińska, 1990 Stasińska, G.: 1990, Astron. and Astrophys. Suppl. Sries 83, 501
- Stasińska, 2005 Stasińska, G.: 2005, Astron. Astrophys. 434, 507
- Stasińska, 2006 Stasińska, G.: 2006, Astron. Astrophys. 454, L127
- Stasińska and Leitherer, 1996 Stasińska, G. and Leitherer, C.: 1996, Astrophys. J., Suppl. Ser. 107, 661
- Stauffer, 1982 Stauffer, J. R.: 1982, Astrophys. J., Suppl. Ser. 50, 517
- Storey and Hummer, 1995 Storey, P. J. and Hummer, D. G.: 1995, Mon. Not. R. Astron. Soc. 272, 41
- Stoughton and et al., 2002 Stoughton, C. and et al.: 2002, Astron. J. 123, 485
- Swartz et al., 2006 Swartz, D. A., Yukita, M., Tennant, A. F., Soria, R., and Ghosh, K. K.: 2006, Astrophys. J. 647, 1030
- Tayal and Gupta, 1999 Tayal, S. S. and Gupta, G. P.: 1999, Astrophys. J. 526, 544
- Telesco, 1988 Telesco, C. M.: 1988, Ann. Rev. Astron. Astrophys. 26, 343
- Telesco and Decher, 1988 Telesco, C. M. and Decher, R.: 1988, Astrophys. J. 334, 573
- Telesco and Gatley, 1984 Telesco, C. M. and Gatley, I.: 1984, Astrophys. J. 284, 557
- Telesco and Harper, 1980 Telesco, C. M. and Harper, D. A.: 1980, Astrophys. J. 235, 392
- Telles et al., 1997 Telles, E., Melnick, J., and Terlevich, R.: 1997, Mon. Not. R. Astron. Soc. 288, 78
- Temporin et al., 2003 Temporin, S., Ciroi, S., Rafanelli, P., Radovich, M., Vennik, J., Richter, G. M., and Birkle, K.: 2003, Astrophys. J., Suppl. Ser. 148, 353
- Terlevich et al., 1990 Terlevich, E., Terlevich, R., Díaz, A. I., Pastoriza, M. G., and Dottori, H.: 1990, Mon. Not. R. Astron. Soc. 242, 48P
- Terlevich et al., 2003 Terlevich, E., Terlevich, R., and Melnick, J.: 2003, in J. M. Rodriguez-Espinoza, F. Garzon Lopez, and V. Melo Martin (eds.), Revista Mexicana de Astronomia y Astrofisica Conference Series, pp 213–215
- Terlevich et al., 1991 Terlevich, R., Melnick, J., Masegosa, J., Moles, M., and Copetti, M. V. F.: 1991, Astron. and Astrophys. Suppl. Sries 91, 285 (T91)
- Thronson and Greenhouse, 1988 Thronson, Jr., H. A. and Greenhouse, M. A.: 1988, Astrophys. J. 327, 671
- Tinsley, 1968 Tinsley, B. M.: 1968, Astrophys. J. 151, 547
- Tinsley, 1972 Tinsley, B. M.: 1972, Astron. Astrophys. 20, 383
- Tonry and Davis, 1979 Tonry, J. and Davis, M.: 1979, Astron. J. 84, 1511
- Trancho et al., 2007 Trancho, G., Bastian, N., Miller, B. W., and Schweizer, F.: 2007, Astrophys. J. 664, 284
- Tsamis et al., 2003 Tsamis, Y. G., Barlow, M. J., Liu, X.-W., Danziger, I. J., and Storey, P. J.: 2003, Mon. Not. R. Astron. Soc. 338, 687
- Tsamis and Péquignot, 2005 Tsamis, Y. G. and Péquignot, D.: 2005, Mon. Not. R. Astron. Soc. 364, 687
- Ugryumov et al., 2003 Ugryumov, A. V., Engels, D., Pustilnik, S. A., Kniazev, A. Y., Pramskij, A. G., and Hagen, H.-J.: 2003, Astron. Astrophys. 397, 463
- van der Kruit, 1976 van der Kruit, P. C.: 1976, Astron. Astrophys. 49, 161
- van der Kruit and de Bruyn, 1976 van der Kruit, P. C. and de Bruyn, A. G.: 1976, Astron. Astrophys. 48, 373
- van Zee, 2000 van Zee, L.: 2000, Astrophys. J. Letters 543, L31
- Vázquez and Leitherer, 2005 Vázquez, G. A. and Leitherer, C.: 2005, Astrophys. J. 621, 695
- Vermeij and van der Hulst, 2002 Vermeij, R. and van der Hulst, J. M.: 2002, Astron. Astrophys. 391, 1081
- Vílchez et al., 1988 Vílchez, J. M., Pagel, B. E. J., Díaz, A. I., Terlevich, E., and Edmunds, M. G.: 1988, Mon. Not. R. Astron. Soc. 235, 633
- Vila-Costas and Edmunds, 1992 Vila-Costas, M. B. and Edmunds, M. G.: 1992, Mon. Not. R. Astron. Soc. 259, 121
- Vílchez and Esteban, 1996 Vílchez, J. M. and Esteban, C.: 1996, Mon. Not. R. Astron. Soc. 280, 720
- Vílchez and Pagel, 1988 Vílchez, J. M. and Pagel, B. E. J.: 1988, Mon. Not. R. Astron. Soc. 231, 257
- Wang et al., 2004 Wang, W., Liu, X.-W., Zhang, Y., and Barlow, M. J.: 2004, Astron. Astrophys. 427, 873
- Weaver and Woosley, 1993 Weaver, T. A. and Woosley, S. E.: 1993, Phys. Rep. 227, 65
- Wesson et al., 2005 Wesson, R., Liu, X.-W., and Barlow, M. J.: 2005, Mon. Not. R. Astron. Soc. 362, 424
- Whitmore and Schweizer, 1995 Whitmore, B. C. and Schweizer, F.: 1995, Astron. J. 109, 960
- Whitmore et al., 1993 Whitmore, B. C., Schweizer, F., Leitherer, C., Borne, K., and Robert, C.: 1993, Astron. J. 106, 1354
- Whitmore et al., 1999 Whitmore, B. C., Zhang, Q., Leitherer, C., Fall, S. M., Schweizer, F., and Miller, B. W.: 1999, Astron. J. 118, 1551
- Woods and Geller, 2007 Woods, D. F. and Geller, M. J.: 2007, Astron. J. 134, 527
- Woods et al., 2006 Woods, D. F., Geller, M. J., and Barton, E. J.: 2006, Astron. J. 132, 197
- Xu and Sulentic, 1991 Xu, C. and Sulentic, J. W.: 1991, Astrophys. J. 374, 407
- Zaritsky et al., 1994 Zaritsky, D., Kennicutt, Jr., R. C., and Huchra, J. P.: 1994, Astrophys. J. 420, 87
- Zeippen, 1982 Zeippen, C. J.: 1982, Mon. Not. R. Astron. Soc. 198, 111
- Zeippen et al., 1987 Zeippen, C. J., Le Bourlot, J., and Butler, K.: 1987, Astron. Astrophys. 188, 251
- Zepf et al., 1999 Zepf, S. E., Ashman, K. M., English, J., Freeman, K. C., and Sharples, R. M.: 1999, Astron. J. 118, 752
- Zwicky, 1966 Zwicky, F.: 1966, Astrophys. J. 143, 192
Chapter 2 Star Formation in Hii Galaxies. Properties of the ionized gas
2.1 Introduction
Hii galaxies are low mass irregular galaxies with, at least, a recent episode of violent star formation (Melnick, Terlevich and Eggleton, 1985a; Melnick, Terlevich and Moles 1985b) concentrated in a few parsecs close to their cores. The ionizing fluxes originated by these young massive stars dominate the light of this subclass of Blue Compact Dwarf galaxies (BCDs) which show emission line spectra very similar to those of giant extragalactic Hii regions (GEHRs; Sargent and Searle, 1970; French 1980). Therefore, by applying the same measurement techniques as for Hii regions, we can derive the temperatures, densities and chemical composition of the interstellar gas in this type of generally metal-deficient galaxies [1991A&AS...91..285T, 2000A&ARv..10....1K, 2006MNRAS.365..454H]. In some cases, it is possible to detect in these objects, intermediate-to-old stellar populations which have a more uniform spatial distribution than the bright and young stellar populations associated with the ionizing clusters [1998ApJ...493L..23S]. This older population produces a characteristic spectrum with absorption features which mainly affect the hydrogen recombination emission lines [1988MNRAS.231...57D], that is the Balmer and Paschen series in the spectral range of our interest. In some cases, the underlying stellar absorptions can severely affect the ratios of Hi line pairs and hence the determination of the reddening constant [c(H)]. They must therefore be measured with special care (see discussion in §2.3).
A considerable number of the blue objects observed at intermediate redshifts seem to have properties (mass, R, velocity width of the emission lines) similar to local Hii galaxies [1994ApJ...427L...9K, 1995ApJ...440L..49K, 1996ApJ...460L...5G, 1998ApJ...495L..13G]. In particular, those with 65 km s follow the same relation as seen in Hii galaxies [2000MNRAS.311..629M, 2003ApJ...598..858M, 2003RMxAC..16..213T, 2005MNRAS.356.1117S]. Similar conclusion is drawn from recent studies on Lyman Break galaxies that also suggest that strong narrow emission line galaxies might have been very common in the past (e.g. Pettini et al., 2000; Pettini et al.,2001; Ellison et al., 2001). To detect possible evolutionary effects like systematic differences in their chemical composition, accurate and reliable methods for abundance determination are needed.
This is usually done by combining photo-ionization model results and observed emission line intensity ratios. There are several major problems with this approach that limit the confidence of present results. Among them: the effect of temperature structure in multiple-zone models [2003MNRAS.346..105P]; the presence of temperature fluctuations across the nebula [2003ApJ...584..735P]; collisional and density effects on ion temperatures [1999ApJ...527..110L, 2003MNRAS.346..105P]; the presence of neutral zones affecting the calculation of ionization correction factors (ICFs; Peimbert et al., 2002); the ionization structure not adequately reproduced by current models [2003MNRAS.346..105P]; ionization vs. matter bounded zones, affecting the low ionization lines formed in the outer parts of the ionized regions [2002MNRAS.329..315C]. On the other hand, the understanding of the age and evolutionary state of Hii galaxies require the use of self-consistent models for the ionizing stars and the ionized gas. However, model computed evolutionary sequences show important differences with observations [2003A&A...397...71S], including: (a) Heii is too strong in a substantial number of objects as compared to model predictions; (b) [Oiii]/H vs. [Oii]/H and [Oiii]/H vs. [Oi]/H are not well reproduced by evolutionary model sequences in the sense that predicted collisionally excited lines are too weak compared to observations; (c) there is a large spread in the [Nii]/[Oii] values (more than an order of magnitude) for galaxies with the same value of ([Oii]+[Oiii])/H in the metallicity range from 8 to 8.4 (see e.g. Pérez-Montero and Díaz, 2005).
Substantial progress toward solving the problems listed above has to come from the accurate measurement of weak emission lines which will allow to derive [Oii], [Sii] and [Siii] temperatures and densities allowing to constrain the ionization structure as well as Balmer and Paschen discontinuities which will provide crucial information about the actual values of temperature fluctuations. It is possible that these fluctuations produce the observed differences between the abundances relative to hydrogen derived from recombination lines (RLs) and collisionally excited lines (CELs) when a constant electron temperature is assumed [1967ApJ...150..825P, 1969BOTT....5....3P, 1971BOTT....6...29P]. These discrepancies have been observed in a good sample of objects, such as galactic Hii regions (e.g. Esteban et al., 2004; García-Rojas et al., 2005; García-Rojas et al., 2006; García-Rojas et al., 2007, and references therein), Hii regions in the Magellanic Clouds (e.g. Peimbert et al., 2000; Peimbert, 2003; Tsamis et al., 2003, and references therein), extragalactic Hii regions and star-forming galaxies (e.g. Peimbert and Peimbert, 2003; Peimbert et al., 2005; Guseva et al., 2006; Guseva et al., 2007; Bresolin, 2007; Peimbert et al., 2007; Kewley and Ellison, 2008, and references therein) and planetary nebulae (e.g. Rubin et al., 2002; Wesson et al., 2005; Liu et al., 2006; Liu, 2006; Peimbert and Peimbert, 2006, and references therein). Likewise, there are relatively recent theoretical works that study the possible causes of these discrepancies in abundance determinations using photo-ionization models of different complexity (e.g. Stasińska, 2005; Jamet et al., 2005; Tsamis and Péquignot, 2005; Ercolano et al., 2007, and references therein).
Spectrophotometry of bright Hii galaxies in the Local Universe allows the determination of abundances from methods that rely on the measurement of emission line intensities and atomic physics. This is referred to as the ”direct” method. In the case of more distant or intrinsically fainter galaxies, the low signal-to-noise obtained with current telescopes precludes the application of this method and empirical ones based on the strongest emission lines are required. The fundamental basis of these empirical methods is reasonably well understood (see e.g. Pérez-Montero and Díaz, 2005). The accuracy of the results however depends on the goodness of their calibration which in turn depends on a well sampled set of precisely derived abundances by the ”direct” method so that interpolation procedures are reliable. Enlarging the calibration range is also important since, at any rate, empirically obtained relations should never be used outside their calibration validity range.
The precise derivation of elemental abundances however is not a straightforward matter. Firstly, accurate measurements of the emission lines are needed. Secondly, a certain knowledge of the ionization structure of the region is required in order to derive ionic abundances of the different elements and in some cases photo-ionization models are needed to correct for unseen ionization states. An accurate diagnostic requires the measurement of faint auroral lines covering a wide spectral range and their accurate (better than 5%) ratios to Balmer recombination lines. These faint lines are usually about 1% of the H intensity. The spectral range must include from the UV [Oii] 3727,29 Å doublet, to the near IR [Siii] 9069,9532 Å lines. This allows the derivation of the different line temperatures: T([Oii]), T([Sii]), T([Oiii]), T([Siii]), T([Nii]), needed in order to study the temperature and ionization structure of each Hii galaxy considered as a multizone ionized region.
Unfortunately most of the available starburst and Hii galaxy spectra have only a restricted wavelength range (usually from about 3600 to 7000 Å), consequence of observations with single arm spectrographs, and do not have the adequate signal-to-noise ratio (S/N) to accurately measure the intensities of the weak diagnostic emission lines. Even the Sloan Digital Sky Survey (SDSS) spectra (Stoughton et al. 2002) do not cover simultaneously the [Oii] 3727,29 and the [Siii] 9069 Å lines, they only represent an average inside a 3 arcsec fibre and reach the required signal-to-noise ratio only for the brightest objects. We have therefore undertaken a project with the aim of obtaining a database of top quality line ratios for a sample that includes the best objects for the task. The data is collected using exclusively two arm spectrographs in order to guarantee both high quality spectrophotometry in the whole spectral range from 3500 to 10500 Å approximately, and good spectral and spatial resolution. In this way we are able to vastly improve constraints on the photo-ionization models including the mapping of the ionization structure and the measurement of temperature fluctuations about which very little is known.
It is important to realize that the combination of accurate spectrophotometry and wide spectral coverage cannot be achieved using single arm spectrographs where, in order to reach the necessary spectral resolution, the wavelength range must be split into several independent observations. In those cases, the quality of the spectrophotometry is at best doubtful mainly because the different spectral ranges are not observed simultaneously. This problem applies to both objects and calibrators. Furthermore one can never be sure of observing exactly the same region of the nebula in each spectral range. To avoid all these problems the use of double arm spectrographs is required.
In this chapter we present simultaneous blue and red observations of three Hii galaxies obtained with the ISIS double-beam spectrograph mounted on the 4.2m William Herschel Telescope (WHT) and seven galaxies observed with the double arm TWIN spectrograph at the 3.5m telescope of the Calar Alto Observatory at the Complejo Astronómico Hispano Alemán (CAHA). All of these objects were selected from the SDSS, and are of a sufficient quality as to allow the detection and measurement of several temperature sensitive lines and add to the still scarce base of precisely derived abundances. Moreover, in the case of the WHT observations we are able to measure the Balmer jump, and then we can estimate the temperature fluctuations. Details regarding the selection of the objects as well as the observations and data reduction are given in §2.2. Section §2.3 presents the results including line measuring techniques. The methodology for the derivation of gaseous physical conditions and elemental abundances is presented in Sections §2.4 and §2.5, respectively. Section §2.6 is devoted to the discussion of our results and finally, our conclusions are summarized in Section §2.7.
2.2 Observations and data reduction
2.2.1 Object selection
SDSS constitutes a very valuable base for statistical studies of the properties of galaxies. At this moment, the Sixth Data Release111http://www.sdss.org/dr6/ (DR6), the last one up to now, represents the completion of the SDSS-I project [2008ApJS..175..297A]. The DR6 contains five-band photometric data for about 2.8710 objects selected over 9583 and more than 1.27 million spectra of galaxies, quasars and stars selected from 7425 . The spectroscopic data have a resolution (R) of 1800-2100 covering a spectral range from 3800 to 9200 Å, with a single 3 arcsec diameter aperture. The SDSS data were reduced and flux-calibrated using automatic pipelines. However, when we selected our WHT objects on July 2004 and our CAHA objects on June 2006, the DR2222http://www.sdss.org/dr2/ [2004AJ....128..502A] and the DR4333http://www.sdss.org/dr4/ [2006ApJS..162...38A], respectively, were just available. All the SDSS data releases, contain the same type of objects observed in the same five photometric bands and using the same spectroscopic configuration. All the objects belonging to one data release are also included in the next ones, but some objects could have been re-calibrated or re-observed somehow.
Using the implementation of the SDSS database in the INAOE Virtual Observatory superserver444http://ov.inaoep.mx/, we selected the brightest nearby narrow emission line galaxies with very strong lines and large equivalent widths of the H line from the whole SDSS data release available when we plan each observing run. Specifically our selection criteria were:
-
-
H flux, F(H) 4 10 erg cm s
-
-
H equivalent width, EW(H) 50 Å
-
-
H width, 2.8 FWHM(H) 7 Å
-
-
redshift, z, 10 0.2
These preliminary lists were then processed using BPT (Baldwin, Phillips and Terlevich, 1981) diagnostic diagrams to remove AGN-like objects.
The final list obtained on July 2004 consisted of about 200 bonafide bright Hii galaxies. They show spectral properties indicating a wide range of gaseous abundances and ages of the underlying stellar populations (López, 2005). From this list, the final set was selected by further restricting the sample to the largest H flux and highest signal-to-noise ratio objects.
From the 10 brightest of the final set we selected three Hii galaxies to be observed in our one single night observing run. This final selection was made based on the relative positions of the sources in the sky allowing to optimize the observing time. Subsequently we have used the explore tool555http://cas.sdss.org/astro/en/tools/explore/ implemented in the DR3666http://www.sdss.org/dr3/ [2005AJ....129.1755A], which was available at the time of analysis, to extract again the three object SDSS spectra for comparison purposes.
On June 2006, the obtained list contains about 10500 Hii like objects [jesustesis]. Again, they show spectral properties indicating a wide range of gaseous abundances and ages of the underlying stellar populations. The objects with the highest (H) fluxes and equivalent widths observable from the Calar Alto Observatory at the epoch of observation were selected and for seven of them the corresponding data were secured.
For both observing runs, by an independent visual inspection of each object we have selected the final sample. In Figures 2.1 and 2.2 we show the false colour images of the observed objects used to select them. The journal of observations is given in Table 2.1 and some general characteristics of the objects from the SDSS web page are listed in Table 2.2. Column 3 of Table 2.1 gives the short name by which we will refer to the observed Hii galaxies in what follows.
| Object ID | spSpec SDSS | hereafter ID | Date | Exposure | Seeing |
|---|---|---|---|---|---|
| (sec) | () | ||||
| WHT objects | |||||
| SDSS J002101.03+005248.1 | spSpec-51900-0390-445 | SDSS J0021 | 2004 July 18 | 1 1200 + 2 2400 | 0.5-0.8 |
| SDSS J003218.60+150014.2 | spSpec-51817-0418-302 | SDSS J0032 | 2004 July 18 | 1 1200 + 2 2400 | 0.5-0.8 |
| SDSS J162410.11-002202.5 | spSpec-52000-0364-187 | SDSS J1624 | 2004 July 18 | 1 1200 + 3 1800 | 0.5-0.8 |
| CAHA objects | |||||
| SDSS J145506.06+380816.6 | spSpec-52790-1351-474 | SDSS J1455 | 2006 June 25 | 5 1800 | 0.9-1.2 |
| SDSS J150909.03+454308.8 | spSpec-52721-1050-274 | SDSS J1509 | 2006 June 23 | 4 1800 | 0.8-1.1 |
| SDSS J152817.18+395650.4 | spSpec-52765-1293-580 | SDSS J1528 | 2006 June 22 | 4 1800 | 0.8-1.2 |
| SDSS J154054.31+565138.9 | spSpec-52072-0617-464 | SDSS J1540 | 2006 June 24 | 6 1800 | 1.0-1.4 |
| SDSS J161623.53+470202.3 | spSpec-52377-0624-361 | SDSS J1616 | 2006 June 23 | 5 1800 | 0.8-1.1 |
| SDSS J165712.75+321141.4 | spSpec-52791-1176-591 | SDSS J1657 | 2006 June 25 | 5 1800 | 0.9-1.2 |
| SDSS J172906.56+565319.4 | spSpec-51818-0358-472 | SDSS J1729 | 2006 June 22 | 5 1800 | 0.8-1.1 |
| Object ID | RA | Dec | redshift | u | g | r | i | z |
| WHT objects | ||||||||
| SDSS J0021 | 00 21 0100 | 00 52 4810 | 0.098 | 17.56 | 17.35 | 17.51 | 16.98 | 17.45 |
| SDSS J0032 | 00 32 1860 | 15 00 1420 | 0.018 | 17.04 | 16.49 | 16.53 | 16.74 | 16.65 |
| SDSS J1624 | 16 24 1010 | -00 22 0250 | 0.031 | 17.07 | 16.46 | 16.91 | 16.80 | 16.74 |
| CAHA objects | ||||||||
| SDSS J1455 | 14 55 0606 | 38 08 1667 | 0.028 | 18.25 | 17.57 | 17.98 | 18.23 | 18.18 |
| SDSS J1509 | 15 09 0903 | 45 43 0888 | 0.048 | 18.57 | 17.72 | 18.19 | 17.87 | 17.94 |
| SDSS J1528 | 15 28 1718 | 39 56 5043 | 0.064 | 18.54 | 17.88 | 18.17 | 17.52 | 17.99 |
| SDSS J1540 | 15 40 5431 | 56 51 3898 | 0.011 | 19.11 | 18.91 | 18.97 | 19.53 | 19.46 |
| SDSS J1616 | 16 16 2353 | 47 02 0236 | 0.002 | 16.84 | 16.45 | 16.77 | 17.35 | 17.43 |
| SDSS J1657 | 16 57 1275 | 32 11 4142 | 0.038 | 17.63 | 17.03 | 17.27 | 17.15 | 17.15 |
| SDSS J1729 | 17 29 0656 | 56 53 1940 | 0.016 | 18.05 | 17.26 | 17.21 | 17.38 | 17.24 |
| http://cas.sdss.org/astro/en/tools/explore/obj.asp | ||||||||
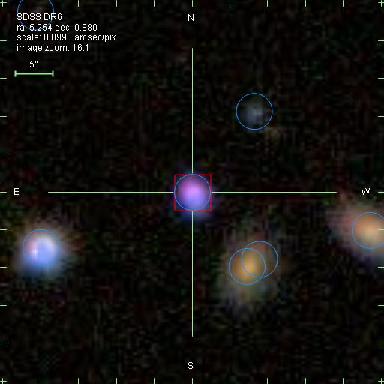
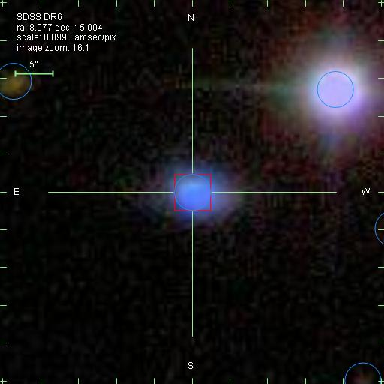
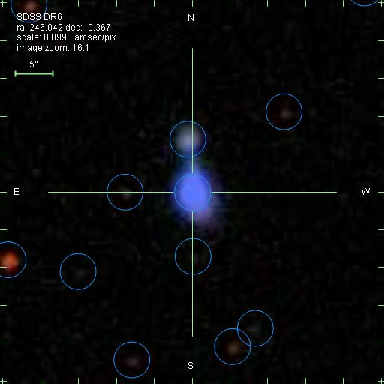
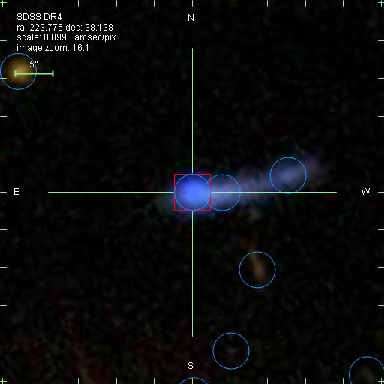
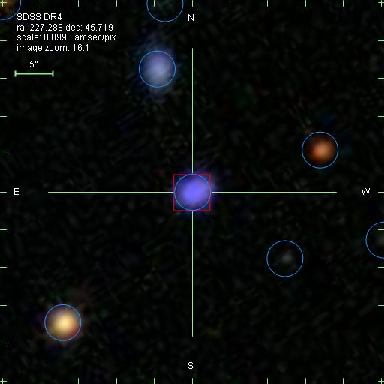
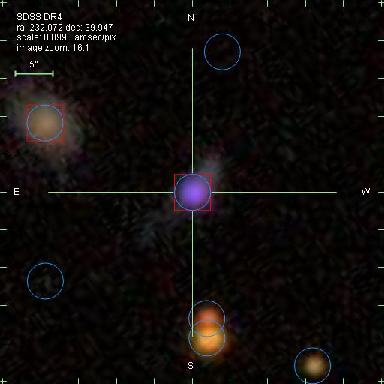
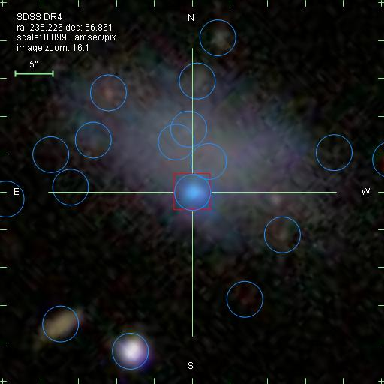
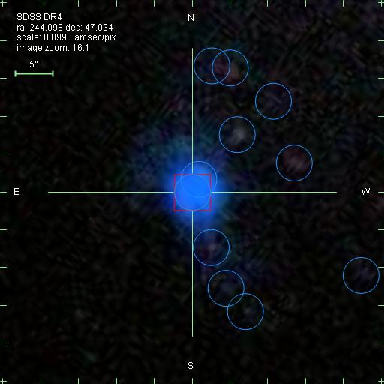
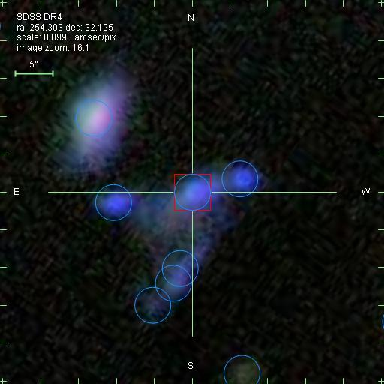
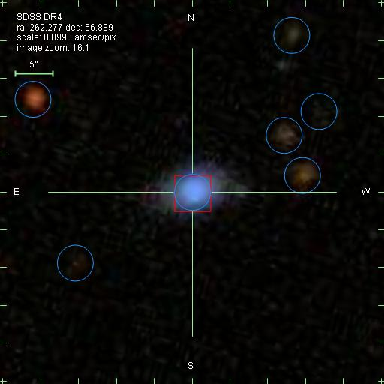
2.2.2 WHT observations
| Spectral range | Disp. | R | Spatial res. | |
| (Å) | (Å px) | ( px) | ||
| WHT - ISIS | ||||
| blue | 3200-5700 | 0.86 | 1780 | 0.2 |
| red | 5500-10550 | 1.64 | 1670 | 0.2 |
| CAHA - TWIN | ||||
| blue | 3400-5700 | 1.09 | 1420 | 0.56 |
| red | 5800-10400 | 2.42 | 1160 | 0.56 |
| R = / | ||||
The blue and red spectra were obtained simultaneously using the Intermediate dispersion Spectrograph and Imaging System (ISIS) double beam spectrograph mounted on the 4.2m William Herschel Telescope (WHT) of the Isaac Newton Group (ING) at the Roque de los Muchachos Observatory, on the Spanish island of La Palma. They were acquired on July the 18th 2004 during one single night observing run and under photometric conditions. EEV12 and Marconi2 detectors were attached to the blue and red arms of the spectrograph, respectively. The R300B grating was used in the blue covering the wavelength range 3200-5700 Å (centered at = 4450 Å), giving a spectral dispersion of 0.86 Å pixel. On the red arm, the R158R grating was mounted providing a spectral range from 5500 to 10550 Å ( = 8025 Å) and a spectral dispersion of 1.64 Å pixel. In order to reduce the readout noise of our images we have taken the observations with the ‘SLOW’ CCD speed. The pixel size for this set-up configuration is 0.2 arcsec for both spectral ranges. The slit width was 0.5 arcsec, which, combined with the spectral dispersions, yielded spectral resolutions of about 2.5 and 4.8 Å FWHM in the blue and red arms respectively. All observations were made at paralactic angle to avoid effects of differential refraction in the UV. The instrumental configuration, summarized in Table 2.3,was planned in order to cover the whole spectrum from 3200 to 10550 Å providing at the same time a moderate spectral resolution. This guarantees the simultaneous measurement of the Balmer discontinuity and the nebular lines of [Oii] 3727,29 and [Siii] 9069,9532 Å at both ends of the spectrum, in the very same region of the galaxy. A good signal-to-noise ratio was also required to allow the detection and measurement of weak lines such as [Oiii] 4363, [Sii] 4068, 6717 and 6731, and [Siii] 6312. The signal-to-noise ratios attained for each final WHT spectrum are given in the top part of Table 2.4.
Several bias and sky flat field frames were taken at the beginning and at the end of the night in both arms. In addition, two lamp flat fields and one calibration lamp exposure were performed at each telescope position. The calibration lamp used was CuNe+CuAr.
2.2.3 CAHA observations
Blue and red spectra were obtained simultaneously using the double beam Cassegrain Twin Spectrograph (TWIN) mounted on the 3.5m telescope of the Calar Alto Observatory at the Complejo Astronómico Hispano Alemán (CAHA), Spain. They were acquired in June 2006, during a four night observing run and under excellent seeing and photometric conditions. Site#22b and Site#20b, 2000 800 px 15 m, detectors were attached to the blue and red arms of the spectrograph, respectively. The T12 grating was used in the blue covering the wavelength range 3400-5700 Å (centered at = 4550 Å), giving a spectral dispersion of 1.09 Å pixel (R 4170). On the red arm, the T11 grating was mounted providing a spectral range from 5800 to 10400 Å ( = 8100 Å) and a spectral dispersion of 2.42 Å pixel (R 3350). The pixel size for this set-up configuration is 0.56 arcsec for both spectral ranges. The slit width was 1.2 arcsec, which, combined with the spectral dispersions, yielded spectral resolutions of about 3.2 and 7.0 Å FWHM in the blue and the red respectively. Again, all observations were made at paralactic angle to avoid effects of differential refraction in the UV. The instrumental configuration, summarized in the second part of Table 2.3, covers the whole spectrum from 3400 to 10400 Å (with a gap between 5700 and 5800 Å) providing at the same time a moderate spectral resolution. As in the case of the WHT data, this guarantees the simultaneous measurement of the nebular lines from [Oii] 3727,29 to [Siii] 9069,9532 Å at both ends of the spectrum, in the very same region of the galaxy, and a good signal-to-noise ratio was also required to allow the detection and measurement of the weak lines. The signal-to-noise ratios of the CAHA spectrum are given in the last part Table 2.4. Unfortunately, although the spectral range allowed the observation of the Balmer discontinuity, we do not have enough signal-to-noise ratio to measure this jump with acceptable accuracy.
Again, several bias and sky flat field frames were taken at the beginning and end of each night, and two lamp flat fields and one calibration lamp exposure were performed at each telescope position. In these cases the calibration lamp used was HeAr.
| Object ID | 5100-5200 | 6000-6100 | 4068 | 4363 | 5755 | 6312 | 7319 | 7330 |
| (continuum) | (continuum) | [Sii] | [Oiii] | [Nii] | [Siii] | [Oii] | [Oii] | |
| WHT - ISIS | ||||||||
| SDSS J0021 | 25 | 45 | 27 | 250 | 51 | 122 | 225 | 151 |
| SDSS J0032 | 30 | 35 | 46 | 170 | — | 181 | 175 | 134 |
| SDSS J1624 | 40 | 65 | 50 | 281 | 20 | 216 | 315 | 260 |
| CAHA - TWIN | ||||||||
| SDSS J1455 | 20 | 50 | 27 | 180 | — | 157 | 160 | 126 |
| SDSS J1509 | 15 | 40 | 25 | 40 | — | 95 | 99 | 82 |
| SDSS J1528 | 10 | 33 | 18 | 60 | — | 125 | 91 | 73 |
| SDSS J1540 | 10 | 35 | 15 | 24 | — | 92 | 78 | 62 |
| SDSS J1616 | 15 | 40 | 12 | 87 | — | 61 | 82 | 53 |
| SDSS J1657 | 15 | 35 | 21 | 64 | — | 107 | 67 | 47 |
| SDSS J1729 | 15 | 35 | 12 | 77 | 29 | 105 | 147 | 122 |
2.2.4 Data reduction
All the images were processed and analyzed with IRAF777IRAF: the Image Reduction and Analysis Facility is distributed by the National Optical Astronomy Observatories, which is operated by the Association of Universities for Research in Astronomy, Inc. (AURA) under cooperative agreement with the National Science Foundation (NSF). routines in the usual manner. The procedure includes the removal of cosmic rays, bias subtraction, division by a normalized flat field and wavelength calibration. Typical wavelength fits were performed using 30-35 lines in the blue and 20-25 lines in the red and polynomials of second to third order. These fits have been done at 117 different locations along the slit in each arm for the WHT-ISIS observations (beam size of 10 pixels) and at 80 different locations for the CAHA-Twin observations (beam size of 10 pixels) obtaining rms residuals between 0.1 and 0.2 pix for the WHT data and between 0.1 and 0.3 pix for the CAHA data.
In the last step, the spectra were corrected for atmospheric extinction and flux calibrated. For the blue WHT spectra, four standard star observations were used, allowing a good spectrophotometric calibration with an estimated accuracy of about 5%. Unfortunately, only one standard star could be used for the calibration of the red WHT spectra. Nevertheless, after flux calibration, in the overlapping region of the spectra taken with each arm, the agreement in the average continuum level was good. For the CAHA data, four standard star observations were performed each night at the same time for both arms, allowing a good spectrophotometric calibration with an estimated accuracy of about 3%, estimated from the differences between the different standard star flux calibration curves.
2.3 Results
The spectra of the observed Hii galaxies with some of the relevant identified emission lines are shown in Figures 2.3 and 2.4, WHT and CAHA data, respectively. The spectrum of each observed galaxy is split into two panels, with the blue part on the left-hand side and the red part on the right-hand side.
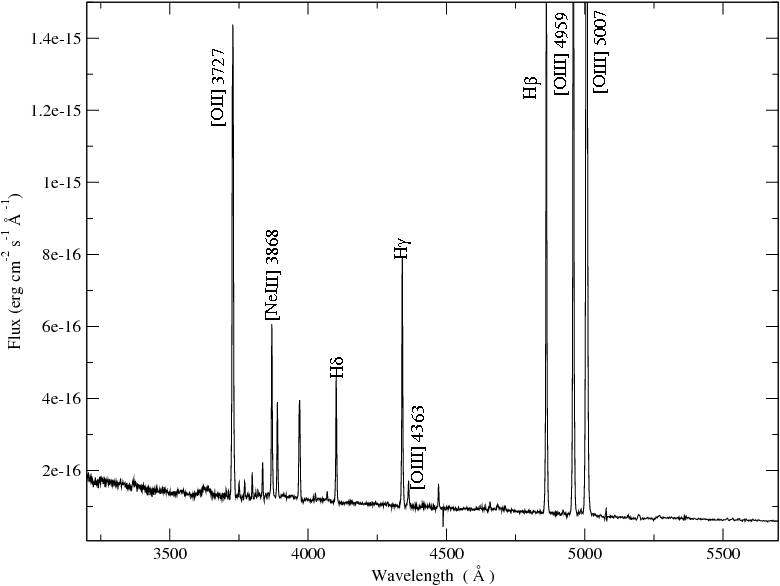
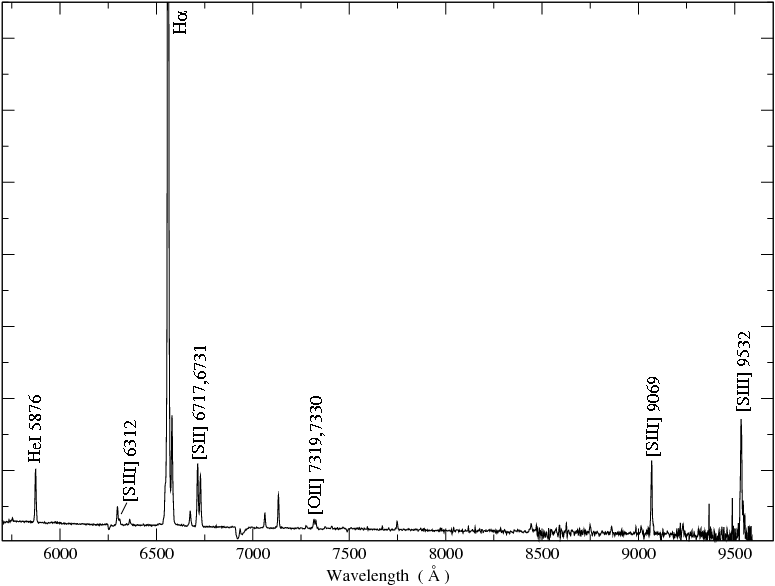
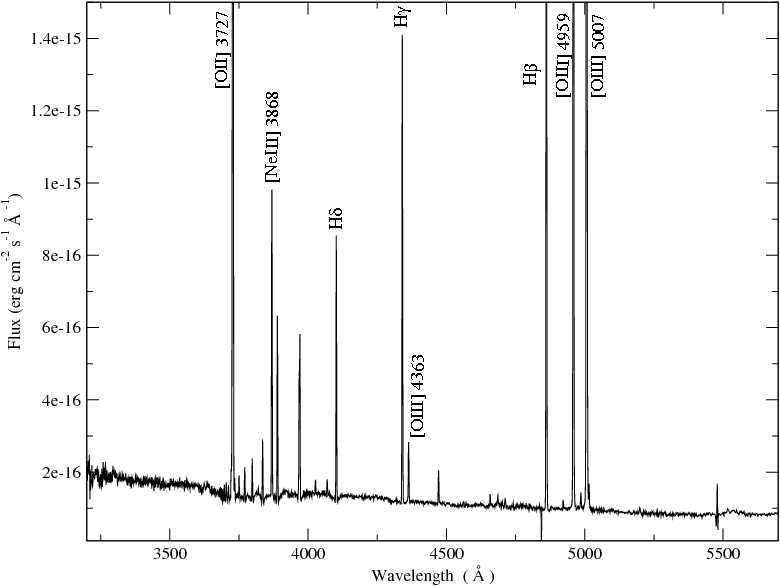
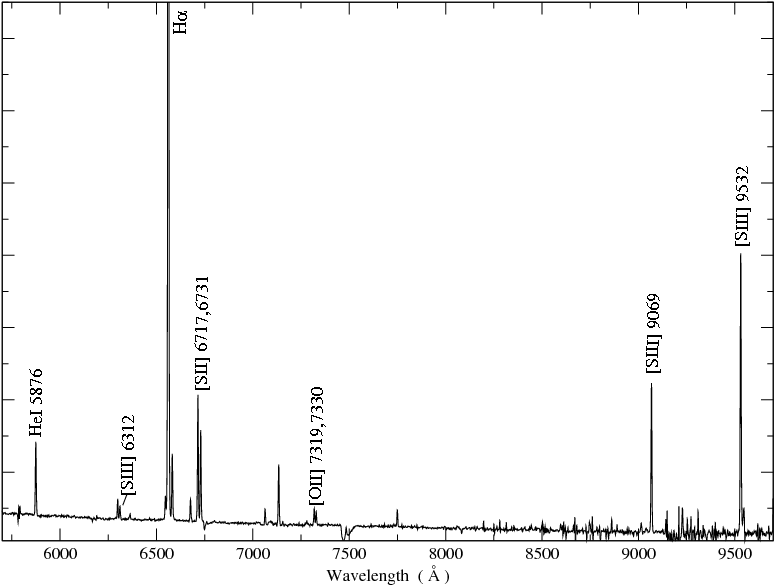
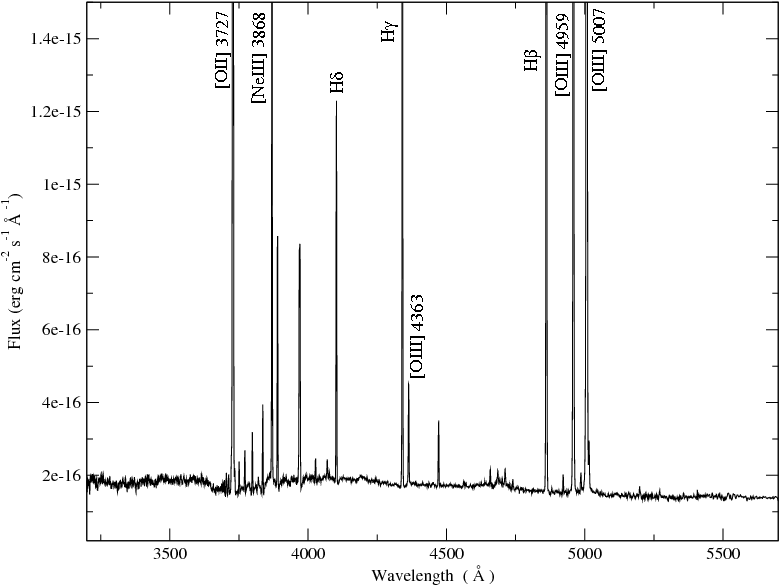
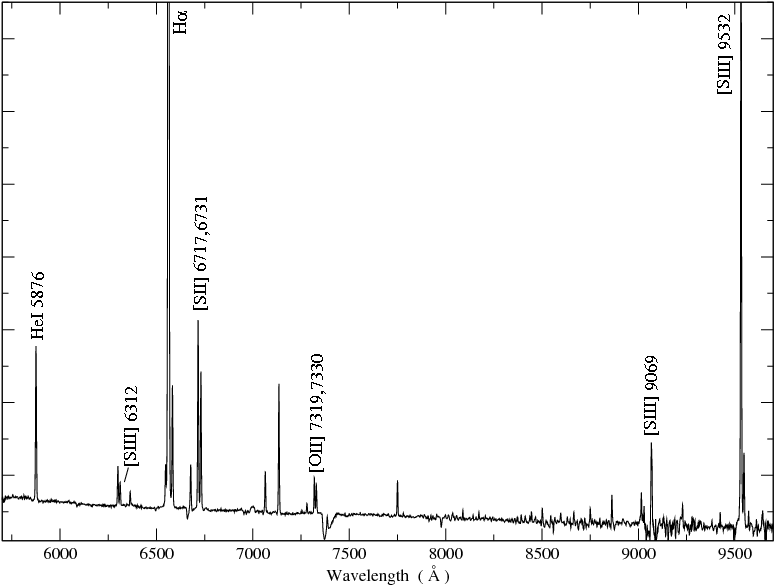
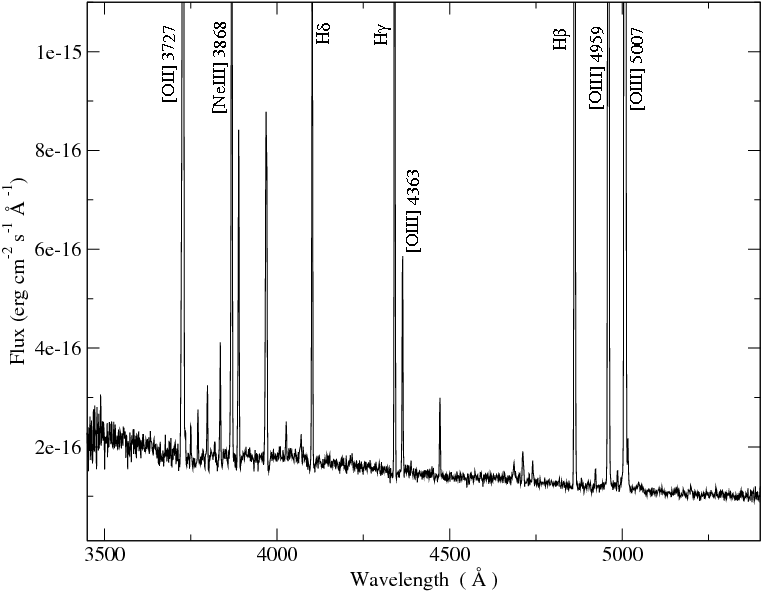
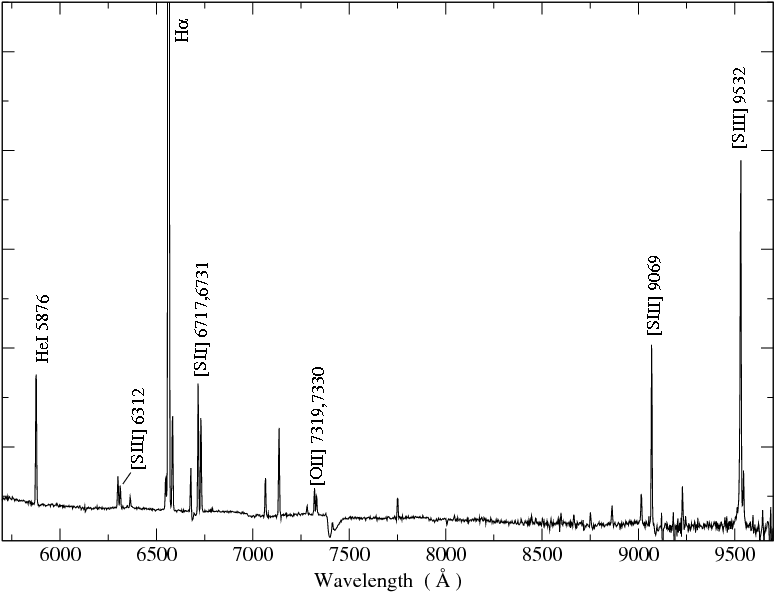
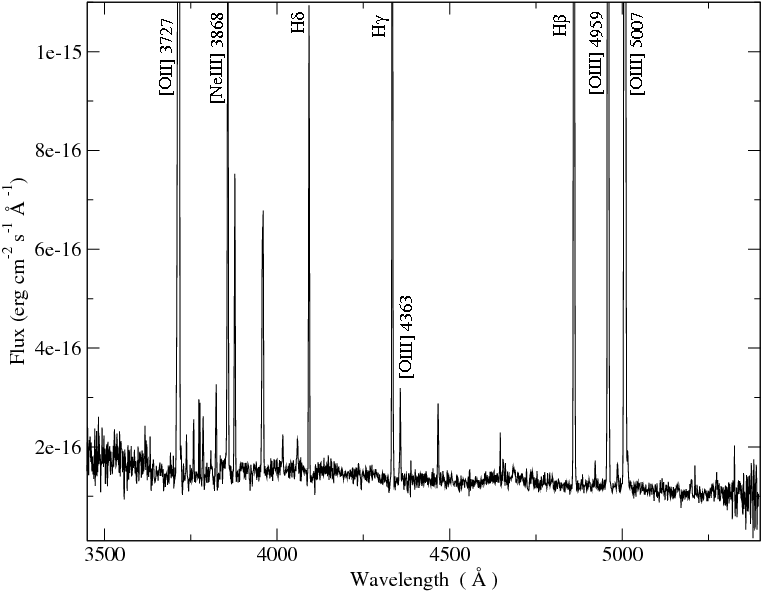
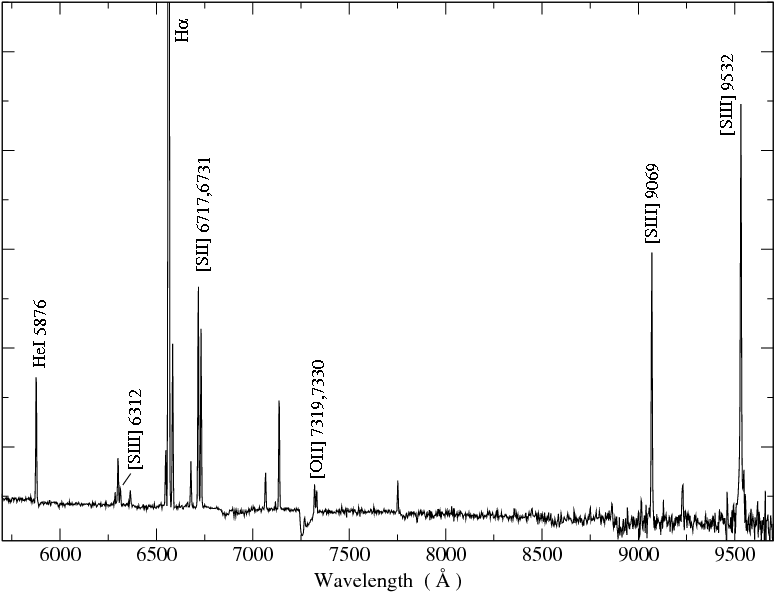
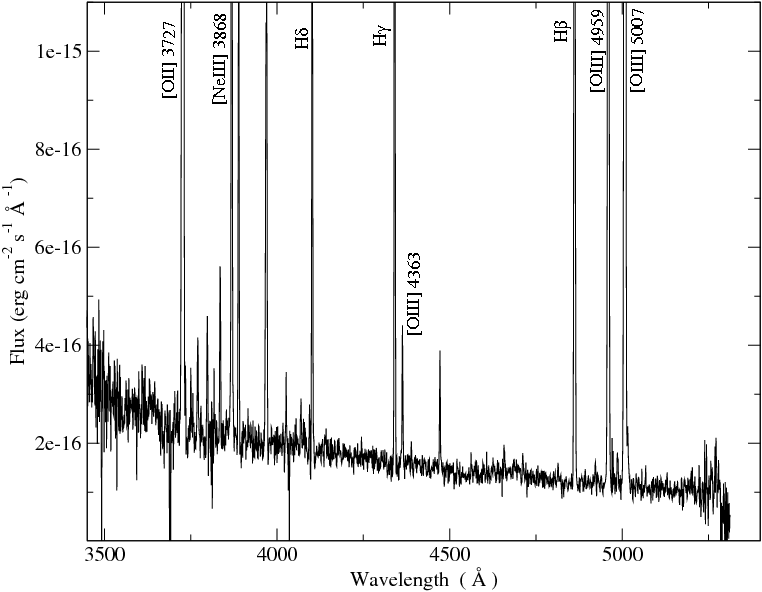
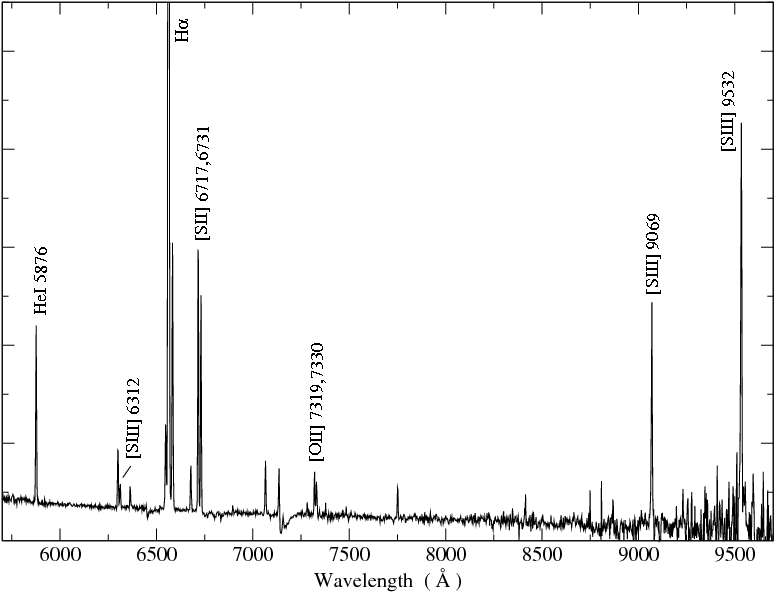
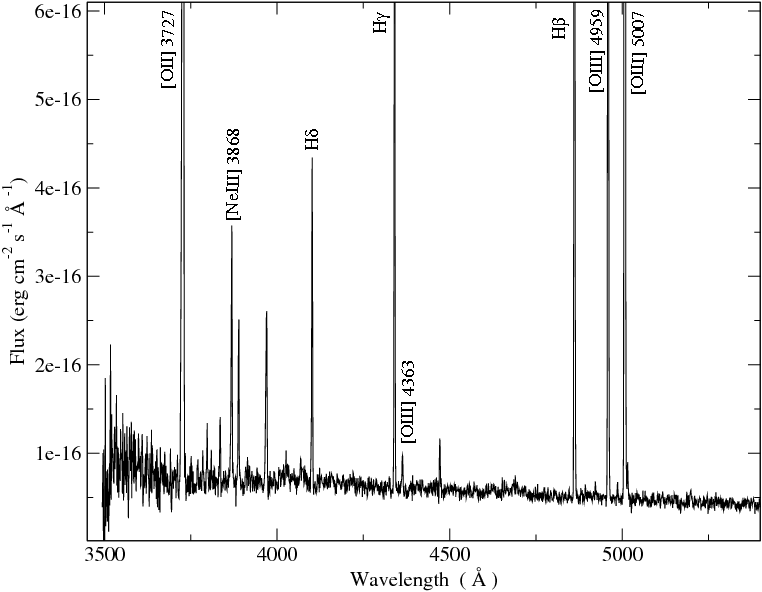
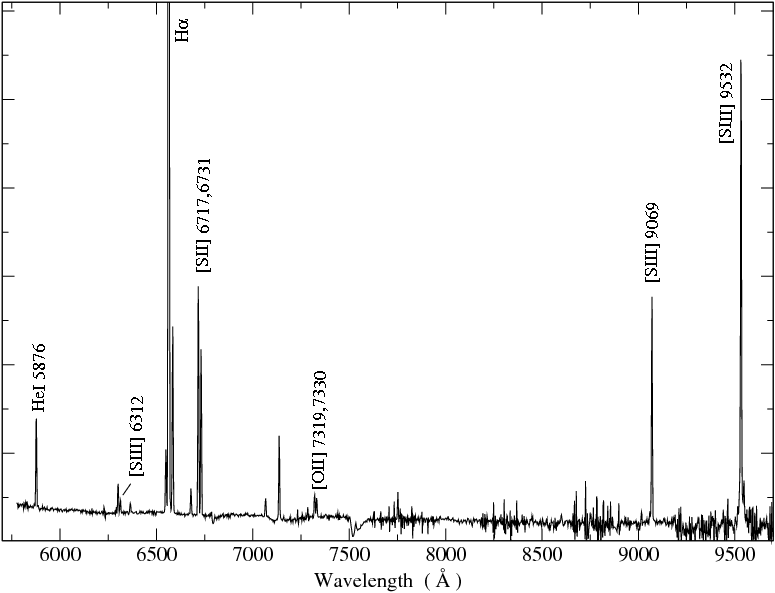
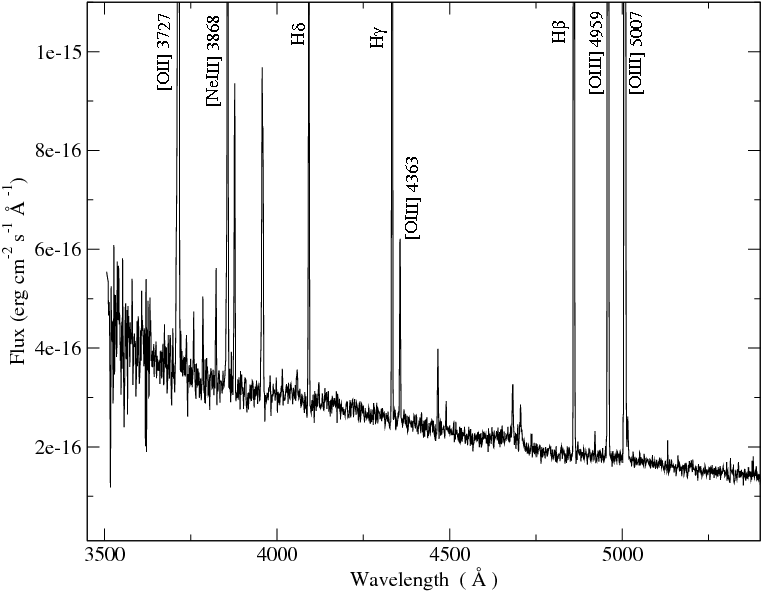
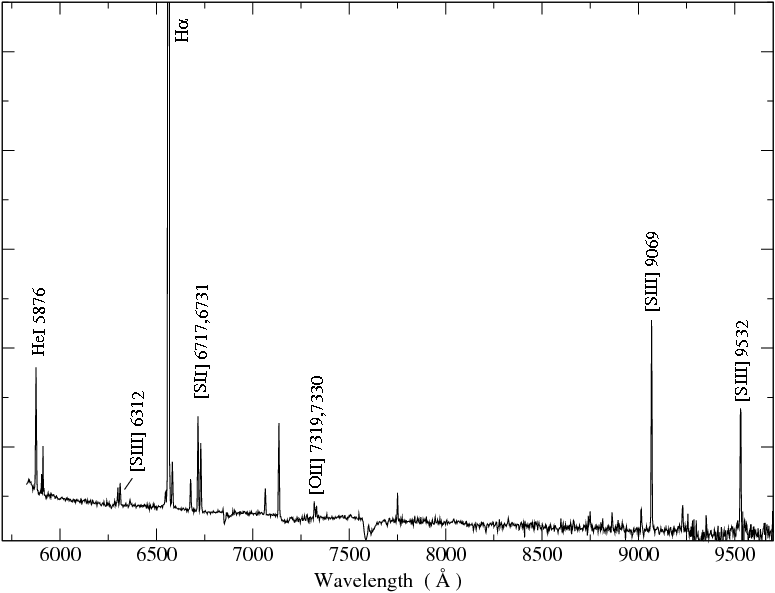
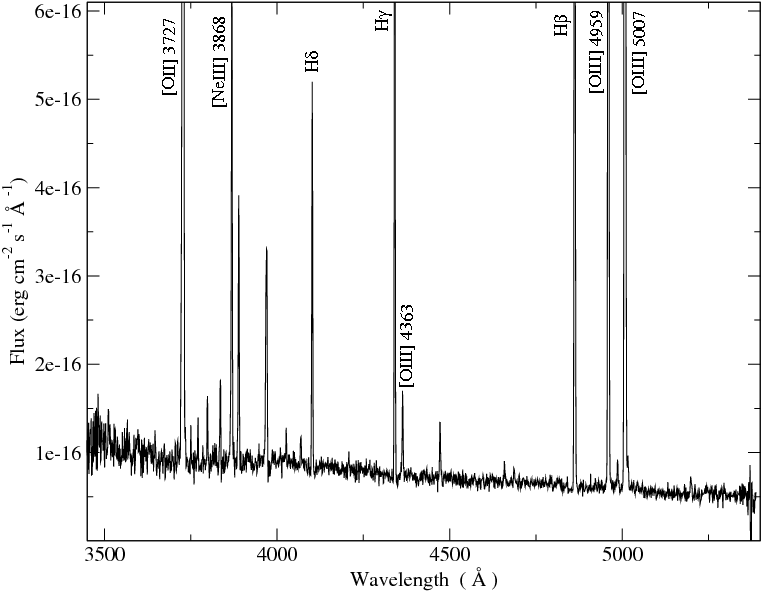
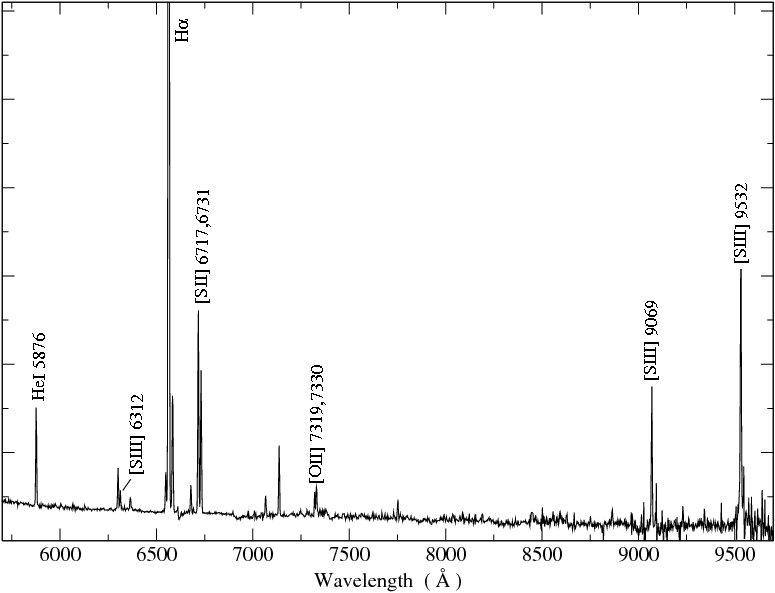
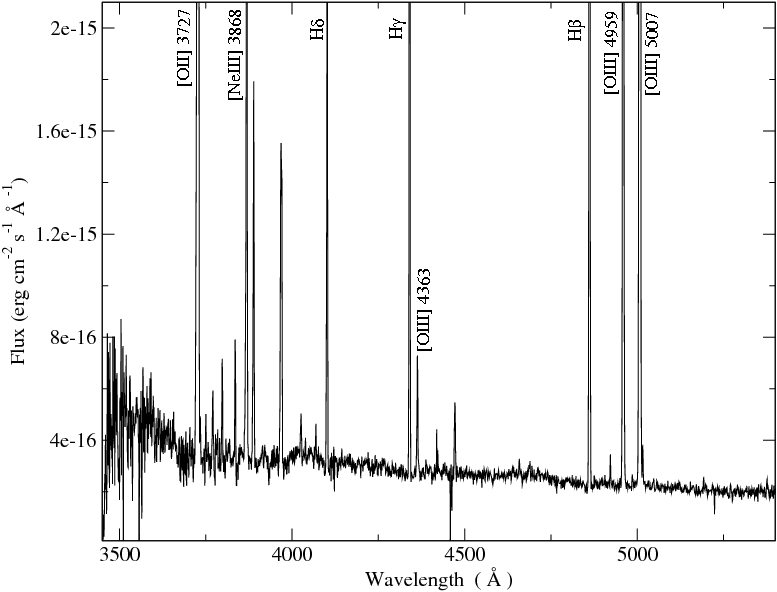
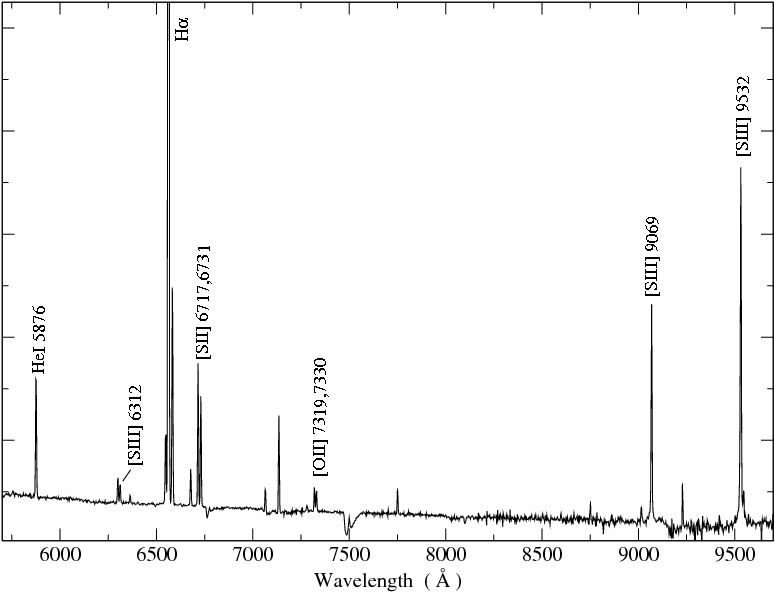
The emission line fluxes were measured using the SPLOT task of IRAF. We have used two different ways to integrate the flux of a given line: (1) in the case of an isolated line or two blended and unresolved lines the intensity was calculated integrating between two points given by the position of the local continuum placed by eye; (2) if two lines are blended, but they can be resolved, we have used a multiple Gaussian fit procedure to estimate individual fluxes. Following González-Delgado et al. [1994ApJ...437..239G], Catellanos, Díaz and Terlevich [2002MNRAS.329..315C] and Pérez-Montero and Díaz [2003MNRAS.346..105P], the statistical errors associated with the observed emission fluxes have been calculated using the expression
where is the error in the observed line flux, represents the standard deviation in a box near the measured emission line and stands for the error in the continuum placement, N is the number of pixels used in the measurement of the line flux, EW is the line equivalent width, and is the wavelength dispersion in angstroms per pixel.
There are several lines affected by bad pixels, internal reflections or charge transfer in the CCD, telluric emission lines or atmospheric absorption lines. These cause the errors to increase, and, in some cases, they are impossible to quantify. In these cases we do not include these lines in the Tables nore in our calculations, and these lines were excluded from any subsequent analysis. The only exception is the emission line [Siii] 9069 for the WHT object SDSS J1624 which is affected by the strong narrow water-vapor lines present in the 9300 - 9500 wavelength region [1985MNRAS.212..737D]. We have listed the value of the measurement of this line but all the physical parameters depending on its intensity were calculated using the theoretical ratio between this line and [Siii] 9532, I(9069) 2.44 I(9532) [1989agna.book.....O]. In the case of the CAHA object SDSS J1528, the [Ariii] 7136 is affected by a sky absorption band. Its observed flux has been scaled to that of the [Ariii] 7751 Å line according to the theoretical relation, [Ariii] 7136/[Ariii] 7751 = 4.17, derived from the IONIC task in the STSDAS package of IRAF for a wide temperature range, from 5000 to 50000 K. For the CAHA data of SDSS J1616 the [Siii] 9532 line is affected by strong narrow water-vapour lines and therefore its value has been set to its theoretical ratio to the weaker [Siii] 9069 Å line.
In some cases there is an observable line (e.g., [Cliii] 5517,5537, several carbon recombination lines, Balmer or Paschen lines) for which it is impossible to give a precise measurement. This might be due to a low signal to noise between the line and the surrounding continuum. This is also the case for the Balmer jump for the CAHA data and the Paschen jump in all the cases, that could not be measured even though it was observed, because it was very difficult to locate the continuum at both sides of the discontinuity with an acceptable accuracy.
The spectrum of SDSS J0021 presents very wide lines (FWHM 7.5 Å 340 km s for 6600 Å) for the expected velocity dispersion in a low mass galaxy of this type. This could be due to an intrinsic velocity dispersion in this object, the interaction with another unobservable object or a projection effect on the line of sight. There are Hii galaxies that in fact are multiple systems, with two or more components, despite their “a priory” assumption of compactness [1966ApJ...143..192Z, 1970ApJ...162L.155S]. In some cases, these systems show some evidence of interaction among their components [1997MNRAS.288...78T]. For instance, IIZw40, which was first classified as a compact emission line galaxy by Sargent [1970ApJ...160..405S], when observed with enough spatial resolution showed to be the merge of two separate subsystems [1982MNRAS.198..535B]. As a consequence, lines that should be resolved are blended in the spectrum of SDSS J0021. Such is the case of H and [Nii] 6548 Å emission lines. We have resorted to the theoretical ratio, I(6584) 3 I(6548), to decontaminate the observed flux of H by the emission of [Nii] 6548 and to derive the electron temperature of [Nii].
A conspicuous underlying stellar population is easily appreciable in the spectra by the presence of absorption features that depress the Balmer and Paschen emission lines. The upper panel of Figure 2.5 shows an example of this effect for the Balmer lines (H13 to H) on an enlargement of the spectrum of SDSS J0032, the object that presents the most prominent and appreciable absorption lines. A pseudo-continuum has been defined at the base of the hydrogen emission lines to measure the line intensities and minimize the errors introduced by the underlying population. The pseudo-continuum used to measure the line fluxes is also shown in the Figure. We can clearly see the wings of the absorption lines implying that, even though we have used a pseudo-continuum, there is an absorbed fraction of the emitted flux that we are not able to measure with an acceptable accuracy (see discussion in Díaz 1988). This fraction is not the same for all lines, nor are the ratios between the absorbed fractions and the emissions. In order to quantify the effect of the underlying absorption on the measured emission line intensities, we have performed a multi-Gaussian fit to the absorption and emission components seen in this galaxy. The fitting can be seen in the lower panel of Figure 2.5. The difference between the measurements of the absorption subtracted lines and the ones obtained with the use of the pseudo-continuum is, for all Balmer lines, within the observational errors and, in fact, the additional fractional error introduced by the subtraction of the absorption component is almost inappreciable for the stronger lines. In the other galaxies, the absorption wings in the Balmer lines are not prominent enough as to provide sensible results by the multi-Gaussian component fitting. Therefore, we have doubled the error derived using the expression for the statistical errors associated with the observed emission fluxes, (), as a conservative approach to include the uncertainties introduced by the presence of the underlying stellar population.
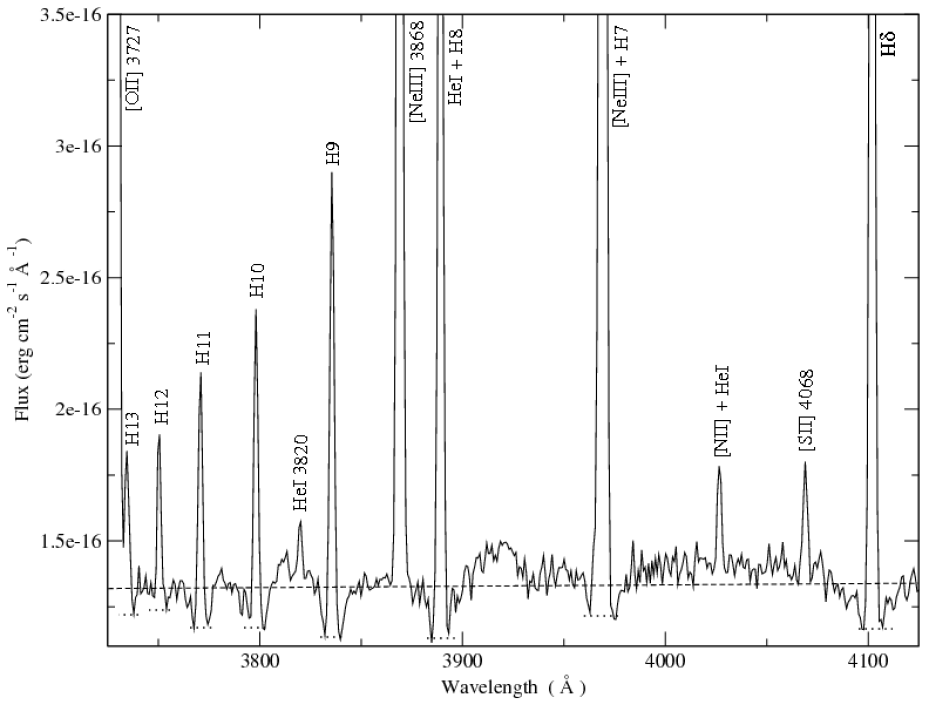
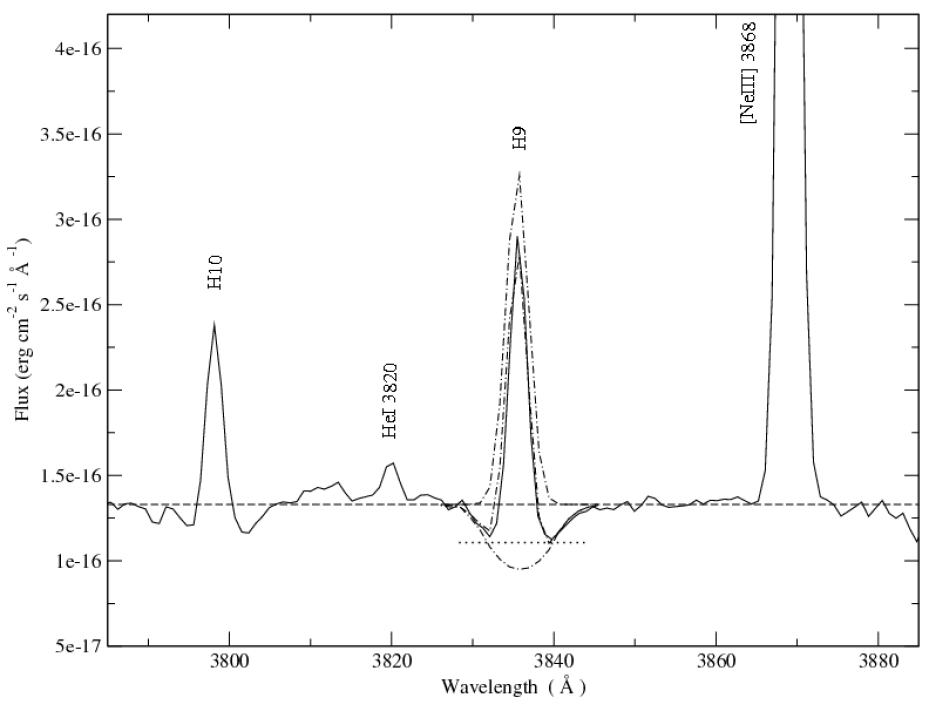
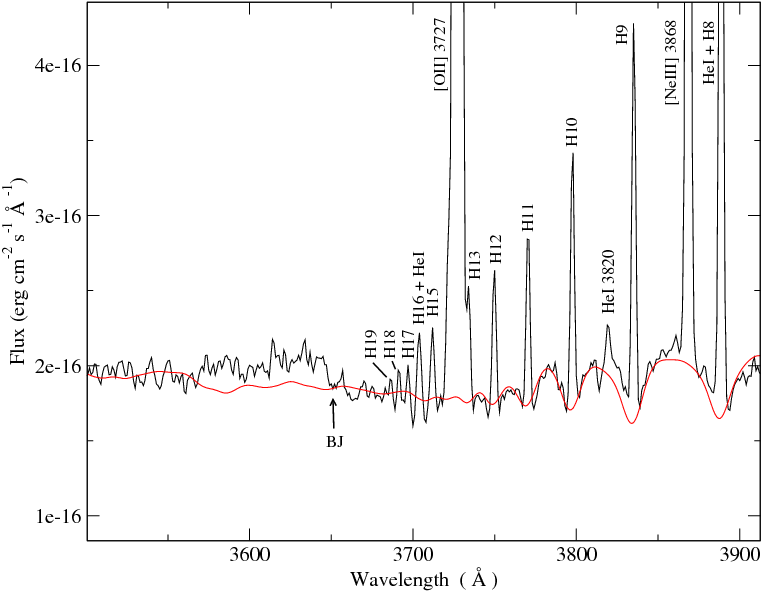
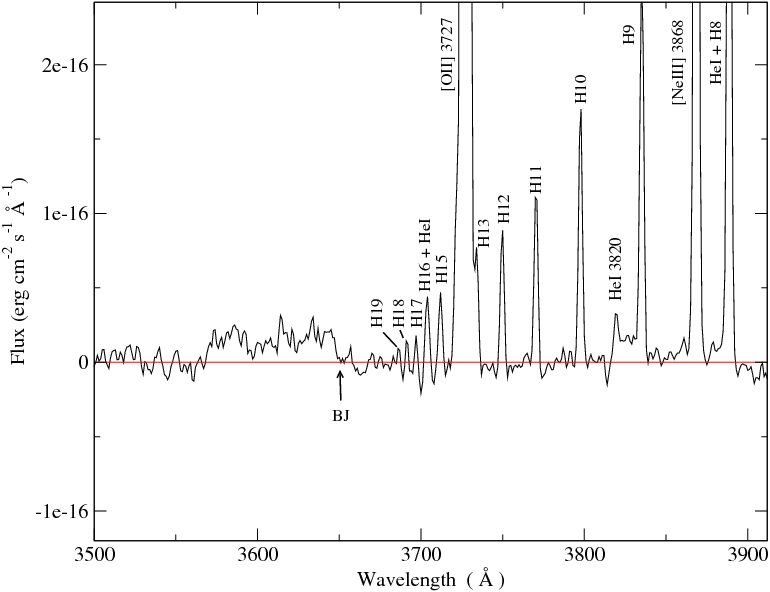
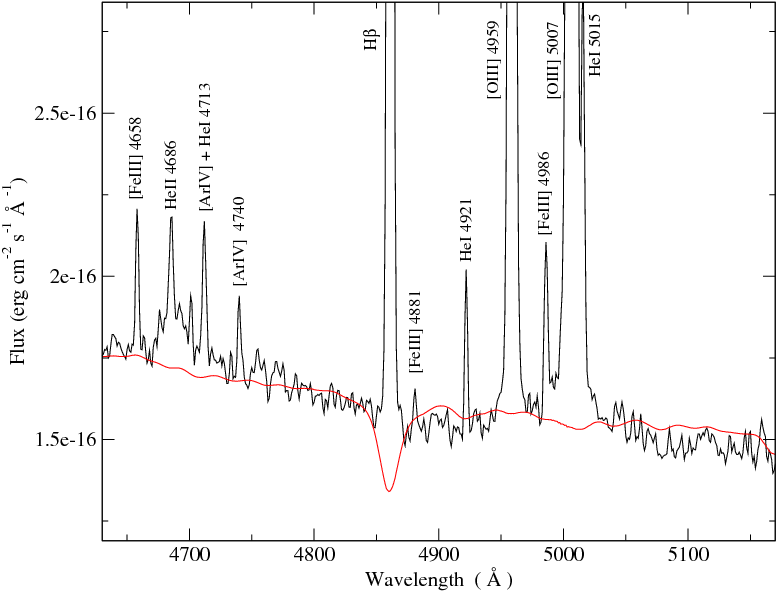
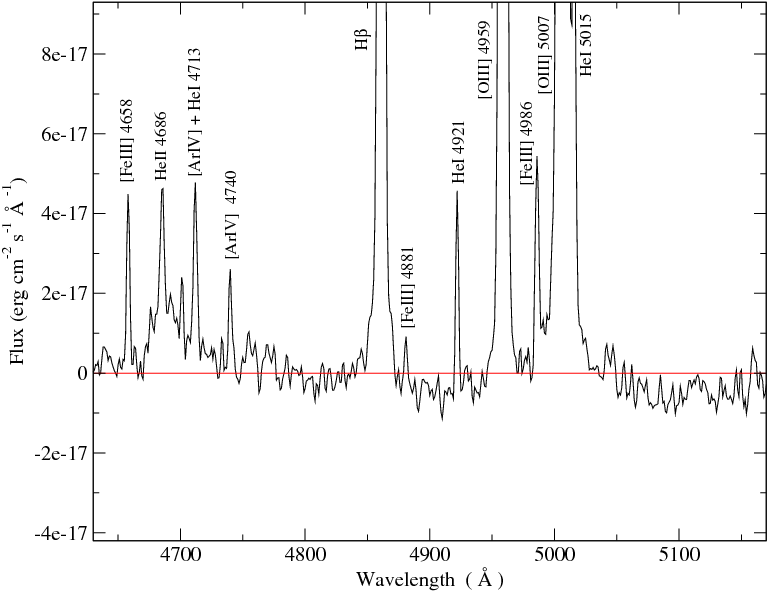
Another approach used to separate the emission spectra from the underlying stellar absorptions was to use spectral synthesis codes for the stellar population like STARLIGHT [2005MNRAS.358..363C]. In the upper panels of Figures 2.6 and 2.7 we show an enlargement of the spectrum of SDSS J1624 between 3500 and 3912 Å (around the Balmer jump and the high order Balmer series) and between 4630 and 5170 Å (around H), respectively, together with the spectral fitting (red lines) made using the STARLIGHT spectral synthesis code888available from www.starlight.ufsc.br, version 04 [2005MNRAS.358..363C]. The synthetic stellar population used in the fitting was obtained using Starburst99 [1999ApJS..123....3L, 2005ApJ...621..695V] with the Geneva stellar evolutionary tracks for continuous star formation with high mass loss [1994A&AS..103...97M], the Kroupa Initial Mass Function (IMF; [2002Sci...295...82K]) in two intervals (0.1-0.5 and 0.5-100 M) with different exponents (1.3 and 2.3, respectively), the theoretical wind model [1992ApJ...401..596L], with the model atmospheres from [2002MNRAS.337.1309S], and the stellar cluster metallicity being the closest to the nebular one. In the lower panels of those Figures we plot the subtraction of this fitting to the WHT spectrum in the same spectral ranges, and the solid red lines show the zero. In the case of the high Balmer series we can appreciate that small errors in the fit of the underlying stellar population could become a great unquantifiable error in the emission line fluxes. The wings of the H absorption line are over estimated, yielding an unreal excess in the emission line flux. Nevertheless, for the strongest emission lines the differences between the measurements made after the subtraction of the STARLIGHT fit and the ones made using our pseudo-continuum are well below the observational errors, giving almost the same result. It must be highlighted that in this type of objects the absorption lines, used to fit the underlying stellar populations, are mostly affected by the presence of emission lines. There are a few that are not affected, such as some calcium and magnesium absorption lines. To make the STARLIGHT fit it is necessary to mask the contaminated lines, thus the fit is based on the continuum shape and take into account only a few absorption lines. Hence, it is not surprising that the STARLIGHT results are not so good for this kind of objects.
It must be noted that the STARLIGHT methodology is very advantageous for statistical studies. Those studies only consider the results derived from the strongest emission lines [2005MNRAS.358..363C, 2006MNRAS.366..480G, 2006MNRAS.370..721M, 2007MNRAS.374.1457M, 2007MNRAS.375L..16C, 2007MNRAS.381..263A] which have small proportional errors. However, we must be careful when the aim of our work is the detailed and precise study of a reduced sample of objects because, as we saw, we can not quantify the error introduced by the fitting. Moreover, these errors are higher for the weakest lines, including the auroral ones.
The absorption features of the underlying stellar population may also affect the helium emission lines to some extent. However, these absorption lines are narrower than those of hydrogen (see, for example, González-Delgado et al., 2005). Therefore it is difficult to set adequate pseudo-continua at both sides of the lines to measure their fluxes.
The reddening coefficient [(H)] has been calculated assuming the galactic extinction law of Miller and Mathews [1972ApJ...172..593M] with =3.2 and obtained by performing a least square fit to the difference between the theoretical and observed Balmer and Paschen decrements vs. the reddening law whose slope is the logarithmic reddening at the H wavelength:
The theoretical Balmer line intensities have been computed using Storey and Hummer [1995MNRAS.272...41S] with an iterative method to estimate T (electronic temperature) and N (electronic density) in each case. As N introduces only a second order effect, for simplicity we assume N equal to N([Sii]). Due to the large error introduced by the presence of the underlying stellar population, only the four strongest Balmer emission lines (H, H, H and H) have been used.
In Tables LABEL:ratiostot_wht1 to LABEL:ratiostot_7, at the end of the present Chapter, we have listed the equivalent widths and the reddening corrected emission lines for each observed galaxy together with the reddening constant and its error taken as the uncertainties of the least square fit and the reddening corrected H intensity. Column 1 of each Table shows the wavelength and the name of the measured lines, as referred to in García-Rojas et al. [2004ApJS..153..501G]. The adopted reddening curve, , normalized to H, is given in column 2 of the Tables. The errors in the emission lines were obtained by propagating in quadrature the observational errors in the emission line fluxes and the reddening constant uncertainties. We have not taken into account errors in the theoretical intensities since they are much lower than the observational ones. Finally, the values listed in Column 5 of the Tables indicate the fractional error in the line intensities calculated as explained above.
A detailed comparison has been made between the results of measurements and data analysis as obtained from the SDSS spectra and the WHT ones, which have comparable S/N ratios. The equivalent widths and the reddening corrected emission lines for each SDSS spectrum of the observed WHT galaxy together with the reddening constant and its error are listed in Tables LABEL:ratiostot_wht1 to LABEL:ratiostot_wht3.
The relative errors in the emission lines vary from a few percent for the more intense nebular emission lines (e.g. [Oiii] 4959,5007, [Sii] 6717,6731 or the strongest Balmer emission lines) to 10-35 % for the weakest lines that have less contrast with the continuum noise (e.g. Hei 3820,7281, [Ariv] 4740 or Oi 8446). For the auroral lines, the fractional errors are between 3 and 10 %.
2.4 Physical conditions of the gas
2.4.1 Electron densities and temperatures from forbidden lines
The physical conditions of the ionized gas, including electron temperatures and electron density, have been derived from the emission line data using the same procedures as in Pérez-Montero and Díaz (2003), based on the five-level statistical equilibrium atom approximation in the task TEMDEN, of the software package IRAF [1987JRASC..81..195D, 1995PASP..107..896S]. The atomic coefficients used here are the same as in Pérez-Montero and Díaz (2003), except in the case of O for which we have used the transition probabilities from Zeippen [1982MNRAS.198..111Z] and the collision strengths from Pradham (1976), which offer more reliable nebular diagnostics results for this species [2004A&A...427..873W]. The references for the different ion atomic coefficients are given in Table 2.5. We have taken as sources of error the uncertainties associated with the measurement of the emission-line fluxes and the reddening correction, and we have propagated them through our calculations.
The electron density, N, has been derived from the [Sii] 6717 / 6731 Å line ratio, which is representative of the low-excitation zone of the ionized gas. In all the observed galaxies the electron densities have been found to be lower than 200 cm, well below the critical density for collisional de-excitation. We have tried to derive the electron densities from the [Ariv] 4713 / 4740 Å line ratio, by decontaminating the first one from the Hei contribution, but the derived density values had unacceptable errors due to their large and sensitive dependencies on the emission line intensities and the errors of the observed fluxes. Then, we were not able to estimate the density from line ratios representative of the higher ionization zones, hence we are not able to determine any existing distribution in density.
| Ion | references |
|---|---|
| Oii | Pradhan [1976MNRAS.177...31P] |
| Oiii, Nii | Lennon and Burke [1994AAS..103..273L] |
| Sii | Ramsbottom et al. [1996ADNDT..63...57R] |
| Siii | Tayal and Gupta [1999ApJ...526..544T] |
| Neiii | Butler and Zeippen [1994AAS..108....1B] |
| Ariii | Galavis et al. [1995A+AS..111..347G] |
| Ariv | Zeippen et al. [1987A+A...188..251Z] |
| ratios | |
|---|---|
| n([Sii]) | R = I(6717) / I(6731) |
| t([Oiii]) | R = (I(4959)+I(5007)) / I(4363) |
| t([Oii]) | R = I(3727) / (I(7319)+I(7330)) |
| t([Siii]) | R = (I(9069)+I(9532)) / I(6312) |
| t([Sii]) | R = (I(6717)+I(6731)) / (I(4068)+I(4074)) |
| t([Nii]) | R = (I(6548)+I(6584)) / I(5755) |
For all the objects we have derived the electron temperatures of [Oii], [Oiii], [Sii] and [Siii]. Only for three objects, SDSS J0021, SDSS J0032 and SDSS J1729, it was possible to derive T([Nii]) from the [Nii] line at 5755 Å. The emission-line ratios used to calculate the electron density and each temperature are summarized in Table 2.6. Adequate fitting functions have been derived from the TEMDEM task and are given below:
where
here is generally t([Oiii]), where t = 10 T, although an iterative process could be used to calculate it with t([Sii]) given that this temperature, like t([Oii]), a type np ion, is density dependent.
where n = 10 N and , 1 for N 1000 cm. The above expressions are valid in the temperature range between 7000 and 23000 K and the errors involved in the fittings are always lower than observational errors by factors between 5 and 10. In Figure 2.8 we show an example of the fits.
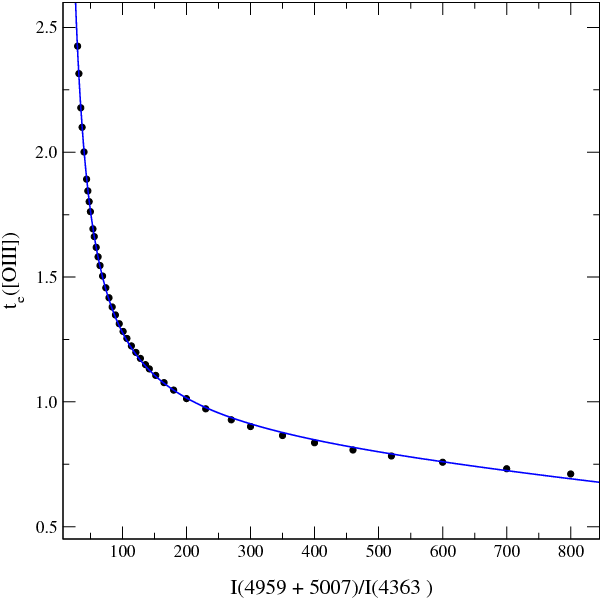
Both the [Oii] 7319,7330 Å and the [Nii] 5755 Å lines have a contribution by direct recombination which increases with temperature. Such emission, however, can be quantified and corrected for as:
where denotes the electron temperature in units of 10 K [2000MNRAS.312..585L]. Using the calculated [Oiii] electron temperatures, we have estimated these contributions to be less than 4 % in all cases and therefore we have not corrected for this effect, but we have included it as an additional source of error. In the worst cases this amounts to about 10 % of the total error. The expressions above, however, are valid only in the range of temperatures between 5000 and 10000 K in the case of [Oii] and between 5000 and 20000 K in the case of [Nii] according to the authors. While the [Oiii] temperatures found in our objects are inside the range of validity for [Nii], they are slightly over that range for [Oii]. At any rate, the relative contribution of recombination to collisional intensities decreases rapidly with increasing temperature, therefore for the high T values found in our objects this contribution is expected to be small.
| n([Sii]) | t([Oiii]) | t([Oii]) | t([Siii]) | t([Sii]) | t([Nii]) | |
| WHT - ISIS | ||||||
| SDSS J0021 | 120 68 | 1.25 0.02 | 1.03 0.02 | 1.31 0.05 | 0.86 0.06 | 1.19 0.05 |
| SDSS J0032 | 54: | 1.28 0.02 | 1.35 0.04 | 1.36 0.07 | 1.03 0.05 | — |
| SDSS J1624 | 58: | 1.24 0.01 | 1.31 0.03 | 1.26 0.04 | 1.04 0.07 | 1.42 0.08 |
| CAHA - TWIN | ||||||
| SDSS J1455 | 94 40 | 1.40 0.02 | 1.33 0.07 | 1.37 0.05 | 1.31 0.11 | — |
| SDSS J1509 | 85 45 | 1.09 0.01 | 1.18 0.05 | 1.02 0.04 | 0.89 0.07 | — |
| SDSS J1528 | 60: | 1.16 0.01 | 1.17 0.05 | 1.21 0.06 | 0.99 0.07 | — |
| SDSS J1540 | 47 38 | 1.13 0.02 | 1.15 0.06 | 0.97 0.04 | 0.85 0.05 | — |
| SDSS J1616 | 54: | 1.30 0.01 | 1.29 0.09 | 1.29 0.06 | 1.21 0.12 | — |
| SDSS J1657 | 30: | 1.23 0.02 | 1.33 0.07 | 1.45 0.08 | 0.88 0.05 | — |
| SDSS J1729 | 109 47 | 1.26 0.02 | 1.16 0.04 | 1.13 0.05 | 0.82 0.06 | 1.40 0.09 |
| densities in and temperatures in 10 K | ||||||
| SDSS J0021 | SDSS J0032 | SDSS J1624 | ||||
| WHT | SDSS | WHT | SDSS | WHT | SDSS | |
| n([Sii]) | 12068 | 7758 | 54: | 56: | 58: | 66: |
| t([Oiii]) | 1.250.02 | 1.130.02 | 1.280.02 | 1.280.03 | 1.240.01 | 1.160.01 |
| t([Oii]) | 1.030.02 | 1.050.02 | 1.350.04 | — | 1.310.03 | 1.230.03 |
| t([Oii]) | — | — | — | 1.36 | — | — |
| t([Siii]) | 1.310.05 | — | 1.360.07 | — | 1.260.04 | — |
| t([Siii]) | — | 1.02 | — | 1.21 | — | 1.06 |
| t([Sii]) | 0.860.06 | 0.760.06 | 1.030.05 | 0.920.06 | 1.040.07 | 1.020.09 |
| t([Nii]) | 1.190.05 | 1.360.06 | — | — | 1.420.08 | — |
| t([Nii]) | — | — | 1.35 | 1.36 | — | 1.23 |
| T(Bac) | 1.240.27 | — | 0.960.16 | — | 1.230.22 | — |
| T(H) | 1.240.31 | — | 1.020.20 | — | 1.240.26 | — |
| T(Heii) | 1.240.29 | — | 0.980.19 | — | 1.240.23 | — |
| densities in and temperatures in 10 K | ||||||
The derived electron densities and temperatures for the observed objects are given in Table 2.7 along with their corresponding errors. In Table 2.8 we have compared the values derived using the WHT and the SDSS data for the WHT objects. The derived electron densities and temperatures using the WHT data are listed in columns 2, 4 and 6 of that Table along with their corresponding errors, while the values derived using the SDSS data are listed in columns 3, 5, and 7.
2.4.2 Balmer temperature
The Balmer temperature depends on the value of the Balmer jump (BJ) in emission. To measure this value we have adjusted the continuum at both sides of the discontinuity ( = 3646 Å). Figure 2.9 shows an example of the procedure for SDSS J0032. The contribution of the underlying population (see Section 3) affect, among others, the hydrogen emission lines near the Balmer jump. The increase of the number of lines toward shorter wavelengths produces blends which tend to depress the continuum level to the right of the discontinuity and precludes the application of multi-Gaussian component fittings. We have taken special care in the definition of this continuum by using a long baseline and spectral windows free of absorption lines. The uncertainties due to the presence of the underlying stellar population (different possible continuum placements) have been included in the errors of the measurements of the discontinuities. They are actually smaller than the error introduced by the fitting of stellar templates. Once the Balmer jump is measured, the Balmer continuum temperature [T(Bac)] is determined from the ratio of the Balmer jump flux to the flux of the H11 Balmer emission line using equation (3) in Liu et al. [2001MNRAS.327..141L]:

where and are the ionic abundances of singly and doubly ionized helium, He/H and He/H (see §2.5), respectively, and BJ is in ergs cm s Å. We can only measure this discontinuity for the WHT objects due to the low signal-to-noise ratio of the continuum at both sides of the jump in the CAHA data. The derived values for T(Bac) are also listed in Table 2.8.
2.5 Chemical abundance derivation
We have derived the ionic chemical abundances of the different species using the strongest available emission lines detected in the analyzed spectra and the task IONIC of the STSDAS package in IRAF. This package is also based on the five-level statistical equilibrium atom approximation (de Robertis, Dufour and Hunt, 1987; Shaw and Dufour, 1995).
The total abundances have been derived by taking into account, when required, the unseen ionization stages of each element, using the appropriate ionization correction factor (ICF) for each species:
2.5.1 Ionic abundances
Helium
We have used the well detected and measured Hei 4471, 5876, 6678 and 7065 Å lines, to calculate the abundances of once ionized helium. For six of the objects (all the WHT and three of CAHA) also the Heii 4686 Å line was measured allowing the calculation of twice ionized He. The He lines arise mainly from pure recombination, although they could have some contribution from collisional excitation and be affected by self-absorption (see Olive and Skillman, 2001, 2004, for a complete treatment of these effects) . We have taken the electron temperature of [Oiii] as representative of the zone where the He emission arises since at any rate ratios of recombination lines are weakly sensitive to electron temperature. We have used the equations given by Olive and Skillman to derive the He/H value, using the theoretical emissivities scaled to H from Benjamin et al. [1999ApJ...514..307B] and the expressions for the collisional correction factors from Kingdon and Ferland [1995ApJ...442..714K]. We have not made, however, any corrections for fluorescence (three of the used helium lines have a small dependence with optical depth effects but the observed objects have low densities) nor for the presence of an underlying stellar population. The three WHT galaxies and four of the CAHA objects (SDSS J1509, SDSS J1540, SDSS J1616 and SDSS J1729) show in their spectra the signature of the presence of Wolf-Rayet (WR) stars by the blue ‘bump’ around 4600 Å, and three of them (SDSS J0032, SDSS J1624 and SDSS J1509) by the red ’bump’ around 5808 Å(see Figure 2.10). Therefore we have to be careful when measuring the emission line flux of Heii 4686 Å. To calculate the abundance of twice ionized helium we have used equation (9) from Kunth and Sargent [1983ApJ...273...81K]. The results obtained for each line and their corresponding errors are presented in Tables 2.5.1 and LABEL:absHeCAHA for the WHT and CAHA objects, respectively, along with the adopted value for He/H that is the average, weighted by the errors, of the different ionic abundances derived from each Hei emission line. This value is dubbed “adopted” in the Table.
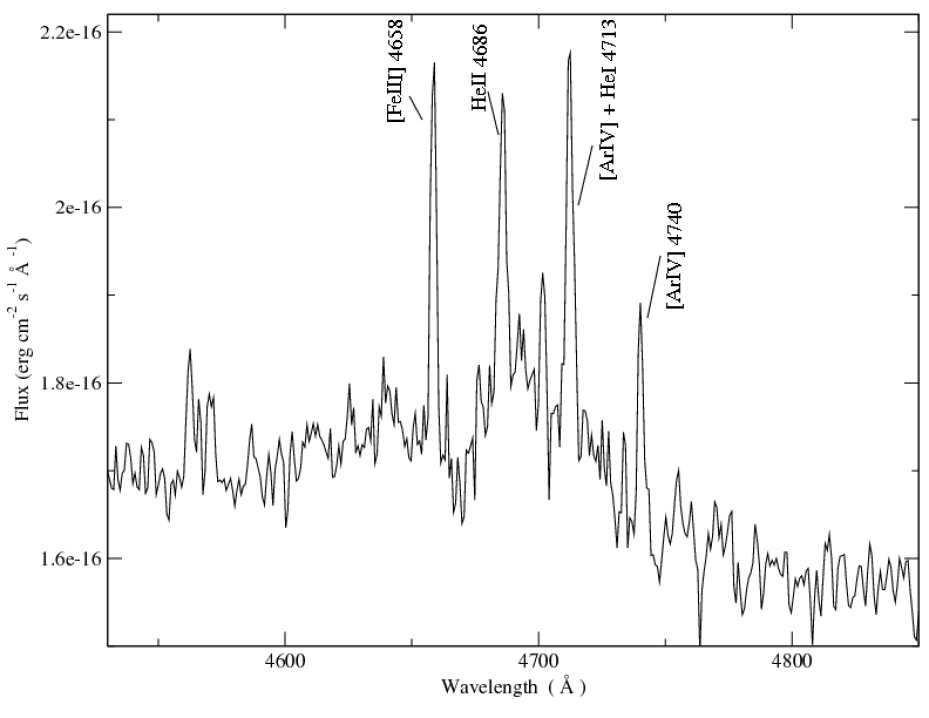
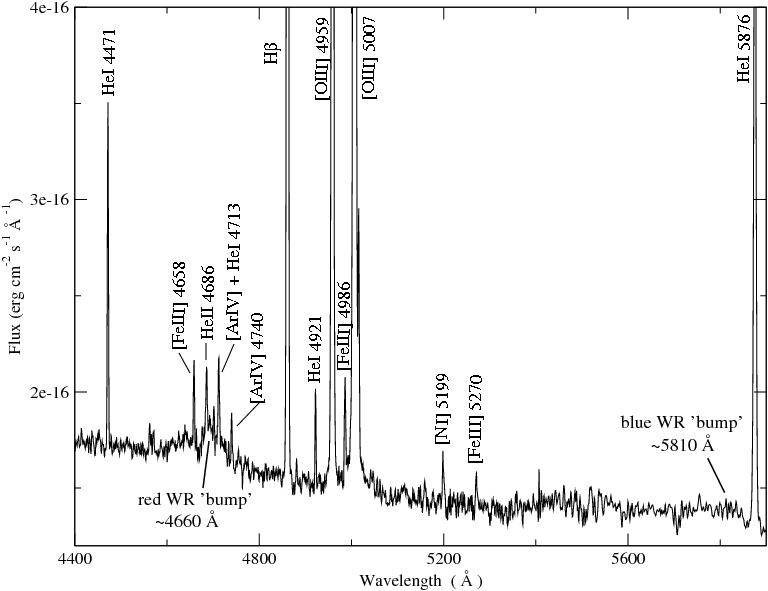
For the CAHA objects, observed in 2006, we have also calculated the average values of He/H from the Hei lines 4471, 5876, 6678, 7065 Å999Although measured, the Hei line at 3889 Å is a blend with H8 so we decided not to include it for this work. using Olive and Skillman (2004) minimization technique combined with the new He emissivities by Porter et al. (2005; hearafter P05) , in order to evaluate their effect on the derived values. We solved simultaneously for underlying stellar absorptions and optical depth. The values are shown in Table LABEL:absHeCAHA under P05. We found no significant differences for these objects in the Helium abundances obtained using the two different sets of He emissivities. On the other hand following this method is crucial when trying to determine He abundances to better than 2 percent (like e.g. for determining a value of the primordial He). We chose to wait for a complete error budget determination from the atomic physics parameters (Porter in preparation, private communication) before adopting the latter values for the He abundances.
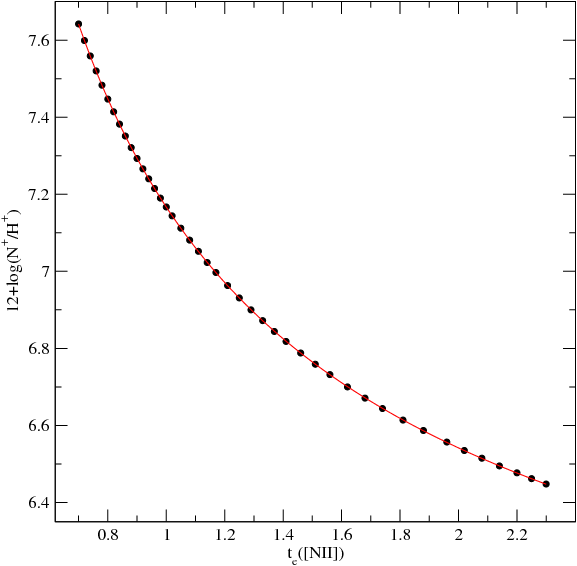
3.5.2 Behaviour of Ne/O and Ar/O with metallicity
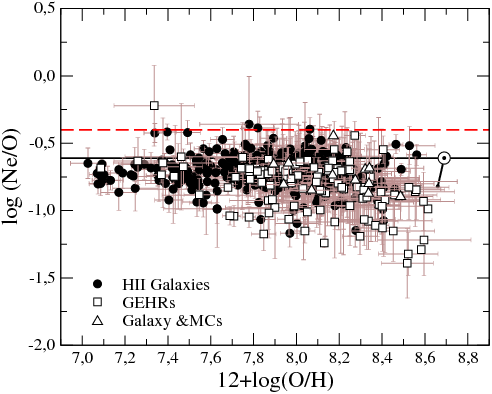
We have applied the ICF(Ne) derived from our set of photo-ionization models to a total sample of 578 Hii galaxies, 117 GEHRs and 12 Hii regions in our Galaxy and the Magellanic Clouds. In Figure 3.4, we represent the ratio of Ne/O as a function of the total oxygen abundance, and we compare the obtained values with the solar one, taking the solar oxygen abundance to be 12+log(O/H) = 8.69 [2001ApJ...556L..63A] and the solar neon abundance to be 12+log(Ne/H) = 8.08 [1998SSRv...85..161G]. Although there is a high dispersion, probably due to chemical inhomogeneities and different observational conditions, the values agree quite well with the assumption of a constant value of Ne/O, at least for low and intermediate metallicities. At higher metallicities, there is a slight decrease of Ne/O with O/H, perhaps due to the underestimate of the corresponding ICF in this regime, as pointed out by Izotov et al. (2006). Nevertheless, since we have not used additional X-ray sources in our models, this problem has to be further investigated. At this point, it is necessary to stress that all the results from photo-ionization models are in contradiction with Vermeij and Van der Hulst [2002A&A...391.1081V] who find Ne abundances even larger that those predicted by the classical approximation in a set of Hii regions in the Galaxy and the Magellanic Clouds from direct ISO observations of the emission lines of [Neii] and [Neiii] in the mid-infrared. Regarding the constant value of Ne/O, the average value of the sample, which is -0.72 0.13, is lower, although within the error, than our assumed solar one, but higher than the value reported by [2005ASPC..336...25A], connected to the value assumed here with a solid line in Figure 3.4 (log (Ne/O) = -0.82 in the photosphere). Nevertheless, all the derived values are far from the value found by [2005Natur.436..525D] using Chandra X-ray spectra in the coronae of 21 stars, which is log(Ne/O) -0.4. If this value is correct, then the neon abundances as derived from optical collisional lines are clearly underestimated.
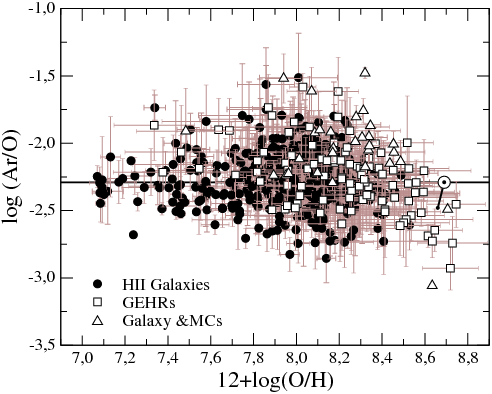
Regarding the relation between the Ar/O ratio and oxygen abundance, our results are shown in Figure 3.5. In order to calculate total argon chemical abundances we have used ICFs based on the O/O ratio for (Ar + Ar) (104 objects) and Ar (344 objects), and ICFs based on the S/(S+S) ratio for the SDSS galaxies from Izotov et al.(2006) which do not have observation of the [Oii] 3727 Å line but for which measurements of the [Siii] 9069 Å line exist: 44 galaxies in the case of (Ar + Ar) and 101 in the case of Ar. The value of Ar/O presents a larger dispersion than in the case of Ne/O, with an average value similar to the solar value from Allende-Prieto et al. (2001) and Grevesse and Sauval (1998), represented by the solar symbol in Figure 3.5 and slightly higher than the value from Asplund et al. (2005), connected to it with a solid line. The relation appears to be slightly different for Hii galaxies, whose behaviour is quite similar to that in the Ne/O diagram, and for Giant Extragalactic Hii regions, for which there exists a slight trend of decreasing Ar/O for increasing metallicities. A more careful analysis for individual disc galaxies, as can be seen in Figure 3.6, shows this trend more clearly, contrary to what is expected for the production of an alpha element like Ar. This is compatible with the existence of larger Ar/O at lower effective radius, since there is evidence of negative gradients of metallicity in all these galaxies (M101: Kennicutt and Garnett, 1996; M51: Díaz et al., 1991; M33 and NGC2403: Garnett et al., 1997). This result agrees quite well with that obtained for sulphur, both for Extragalactic Hii regions (Díaz et al., 1991; Pérez-Montero et al., 2006) and halo metal-poor stars (Israelian and Rebolo, 2001).
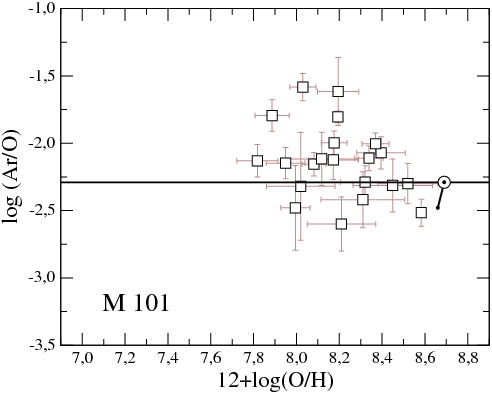
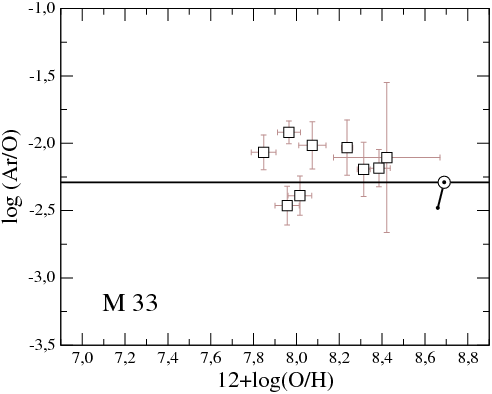
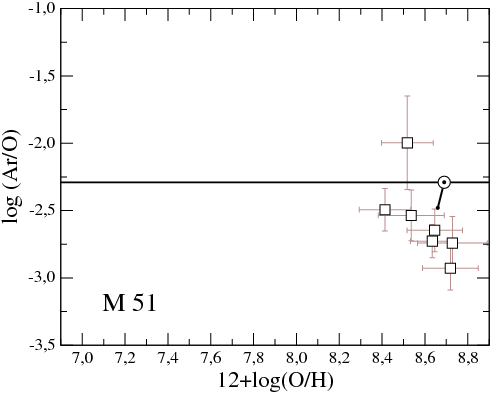
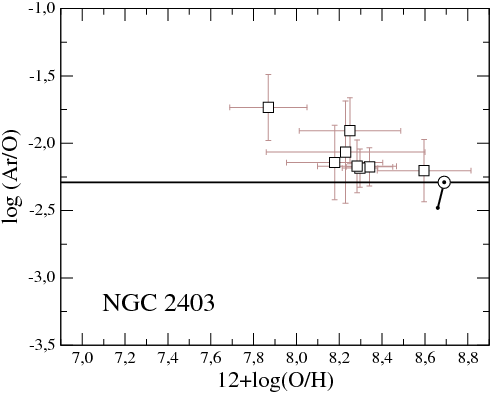
3.5.3 Empirical parameters based on Ne and Ar lines
Although the [Neiii] emission line at 3869 Å and the [Ariii] emission line at 7136 Å are fainter than the oxygen emission lines, which are commonly used in different empirical calibrations of chemical abundances, they can be useful to ascertain metallicities when these lines are not available, either because they shift out of the optical region due to the object redshift or because the instrumental configuration does not cover the blue-green region of the spectrum.
The empirical calibrators are commonly used in objects whose low signal-to-noise and/or high metallicities do not allow the accurate measurement of any of the auroral lines and, therefore, it is not possible to derive the electron temperature and the ionic chemical abundances from the strong collisional lines.
This is the case for the emission line ratio I([Neiii] 3869 Å)/I([Oii] 3727Å), proposed by Nagao et al. [2006A&A...459...85N] as an empirical calibrator useful for high-redshift galaxies (up to z=1.6 in the optical part of the spectrum) and relatively independent of reddening due to the proximity of the two lines. We show in Figure 3.7 the relation between this ratio and the oxygen abundance for the sample of objects described in Section §3.2. This Figure shows a very high dispersion in all the metallicity range, especially large in the high metallicity regime. This is confirmed by the objects in the Galaxy and the Magellanic Clouds compiled by Peimbert et al. [2007RMxAC..29...72P] for which a direct determination of the oxygen abundance by means of recombination lines (RLs) exists. The residuals between the direct determination of the oxygen abundance and those obtained from the relation based on the [Neiii]/[Oii] ratio are shown in the right panel of the same Figure. The standard deviation of these residuals in the whole metallicity regime reaches 0.83 dex.
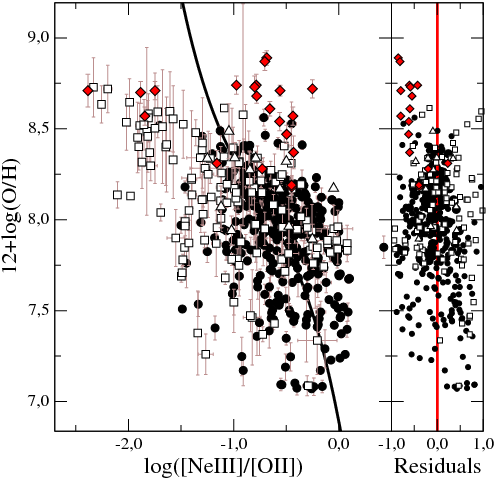
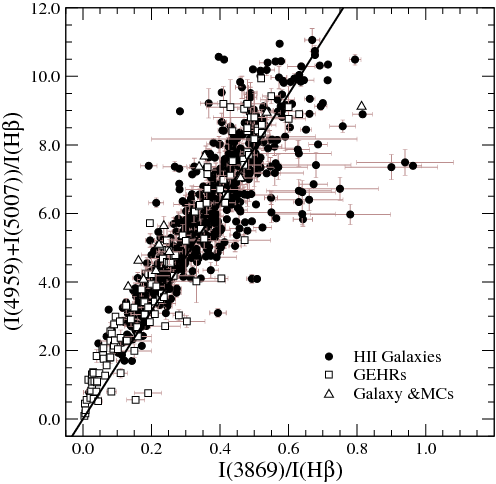
The reason for this huge dispersion can be found in the high dependence of the [Neiii]/[Oii] ratio on ionization parameter, as it is stressed by [2006A&A...459...85N]. This dependence however is due to the tight relation between the flux of [Neiii] and [Oiii] emission lines (see Figure 3.8), as a consequence of the quite similar ionization structure of O and Ne and the constant value of the Ne/O ratio. The best linear fit between the fluxes of the lines for this sample yields:
Although, there is a deviation from this trend for some Hii galaxies showing abnormally high values of the line of [Neiii] (e.g. UM382; Terlevich et al., 1991, HS1440+4302, HS1347+3811; Popescu and Hopp, 2000), most of the objects are quite close to this relation. Even for the objects with low intensities, which correspond to high metallicity/low excitation regions and for which the charge transfer reaction between O and H becomes more important, there exists a very good agreement with this linear fit. A possible cause to the deviation from this relation in some Hii galaxies comes from the fact that Ne has an ionization potential 5.85 eV larger than O and therefore is more sensitive to the stellar effective temperature, which is higher in these Hii galaxies. One of the consequences of this relation is that the [Neiii]/[Oii] ratio is, in fact, almost equivalent to [Oiii]/[Oii] which is highly dependent on ionization parameter and effective temperature (Pérez-Montero and Díaz, 2005) and presents a lower dependence on metallicity.
The relation between [Oiii] and [Neiii] can be used as well in all the other diagnostic ratios involving [Oiii] lines in a similar way. This is the case of the O parameter, also known as R, defined by [1979MNRAS.189...95P] as the relative sum of the strong lines of [Oii] at 3727 Å and [Oiii] at 4959 and 5007 Å in relation to H. The relation between this parameter and the oxygen abundance is widely used for objects at large redshifts due to the relatively blue wavelength and high intensities of the involved lines. There exist many different calibrations of this parameter, whose main drawbacks are well known: (i) its relation with metallicity is double-valued with increasing values of O for increasing values of metallicity in the low metallicity regime and decreasing values of O for increasing metallicity in the high metallicity regime, requiring external methods to distinguish the upper from the lower branch and with a high dispersion in the middle-range, that makes metallicities quite uncertain in the range 8.0 12+log(O/H) 8.4; (ii) the dependence of O on other functional parameters like ionization parameter or effective temperature. This is solved with the calibration of the parameter as a function of other quantities that reduce this dependence, as in the case of the [Oii]/[Oiii] ratio (Kobulnicky et al., 1999 from the models of McGaugh, 1991) or the P parameter [2000A&A...362..325P]; (iii) the lack of objects with directly derived abundances in the high metallicity regime makes the upper branch calibration to rely heavily on photo-ionization model results, which differ appreciably depending on the model atmospheres used [2004A&A...415..577M] and the chosen input conditions. Besides, these models predict higher metallicities than those derived from electron temperatures of [Nii] or [Siii] in inner disc regions (e.g. Bresolin, 2007), but not than those derived from oxygen recombination lines. The difficulties found to derive accurate metallicities using this calibration and, in general, all the other empirical relations, make them appropriate to study distributions of metallicity in a statistical way in large surveys of emission lines objects, but they do not offer reliable results for individual determinations.
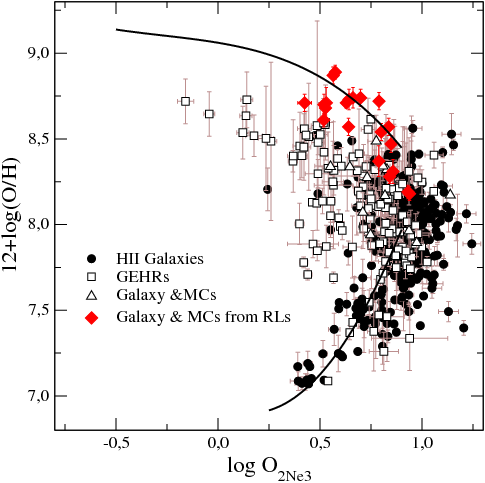
We can then define a proxy for the O parameter, using the relation between [Oiii] and [Neiii] lines, previously discussed:
that is shown in Figure 3.9 for the sample described in Section §3.2. We also show as a solid line the equivalent to the calibration of the O parameter based on the models of McGaugh (1991), for an average value of the ionization parameter (log([Oiii]/[Oii]) = 1). This calibration gives the lowest dispersion in relation with the sample of objects in both the lower and the upper branch (Pérez-Montero and Díaz, 2005). We also show the sample of objects with a direct determination of the oxygen abundances based on recombination lines (red diamonds) in order to illustrate how this parameter has the same problems described above for O. We can redefine the O parameter relative to the closest and brightest hydrogen recombination line, H. These lines are closer in wavelength, which makes its relation to be little reddening and flux calibration dependent, and useful to larger redshifts (up to z 1.3).
This parameter being equivalent to O suffers from its same problems, with the additional difficulty of being based on weaker lines and therefore, more difficult to measure with good signal-to-noise ratio. In addition, the hydrogen recombination line H in emission is more strongly affected by underlying stellar absorption and its measurement has to be carried out carefully (e.g. Hägele et al., 2006; see Chapter §2).
We show this parameter in Figure 3.10 for the sample of objects described in Section §3.2 and the sample of Hii regions with a determination of the oxygen abundance based on recombination lines. We show as well as a solid line the empirical calibration from McGaugh but in this case we take into account the factor H/H in the axis. As in the case of O, it is necessary to distinguish between the upper and lower branch to derive the oxygen abundance from it. In the case of O, this is usually done by means of the [Nii] lines, but they are not available in the blue part of the spectrum. Other possibility is using the [Neiii]/[Oii] ratio, although it is very uncertain. From Figure 3.7 we can see that while objects with log([Neiii]/[Oii]) -1.0 probably have high metallicities, the contrary is not true. The residuals of the oxygen abundances derived with these new parameters as a function of the abundances measured using the direct method for both the lower and the upper branches are shown in Figure 2.5.1. We can see that, as in the case of O, both the upper and lower branch calibrations show large differences with the derived metallicities in the turnover region (8.0 12+log(O/H) 8.4). The standard deviation of the residuals in the other ranges are quite similar to those obtained for the O parameter in Pérez-Montero and Díaz (2005) for the McGaugh calibration of the upper branch (0.20 dex for O and 0.18 dex for O in the 12+log(O/H) 8.4 range). The standard deviation of the residuals between the metallicities derived from the O parameter are 0.06 dex for both O and O parameters. However, in the low metallicity regime, 12+log(O/H) 8.0, the dispersion of the residuals relative to the direct method is 0.24 dex for the O parameter and 0.22 dex for the O parameter, much higher than the 0.13 dex calculated for the O parameter in Pérez-Montero and Díaz (2005). In this case the residuals between this calibration and those based on the neon emission line are 0.14 dex and 0.16 dex, respectively.
Among the other empirical calibrators based on Ne or Ar emission lines, we can analyze also the ArO parameter, defined by Stasińska [2006A&A...454L.127S] as the ratio of the fluxes of the emission lines of [Ariii] at 7136 Å and [Oiii] at 5007 Å. In Figure 3.12, we show the relation between the oxygen abundances and the logarithm of this parameter for the sample of objects described in Section §3.2 having a measurement of the [Ariii] line. The standard deviation of the residuals, which are shown in the right panel of the same Figure as a function of metallicity, gives a value of 0.35 dex. Besides, the behaviour of this parameter in the high metallicity regime is quite unclear due to the position of some of the objects with a direct determination of the oxygen abundance based on recombination lines, that show lower values of ArO than those expected for their metallicity.
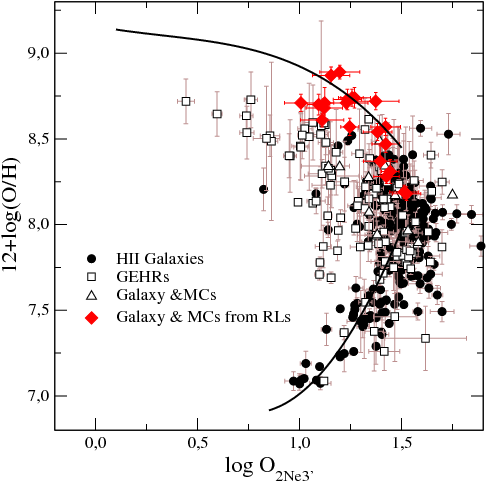
![[Uncaptioned image]](/html/0908.4285/assets/chapter3/o2ne3p_res.png)
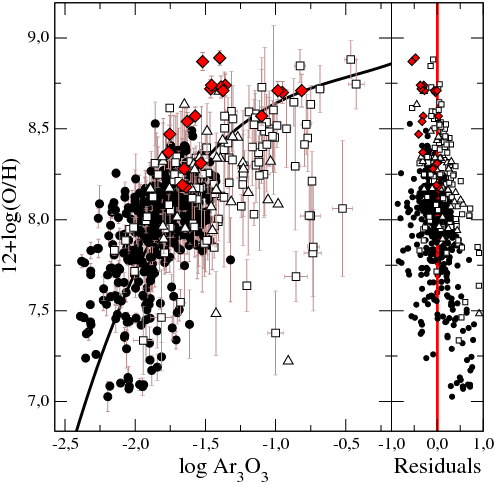
3.5.4 Diagnostic diagrams for emission-line objects
Strong lines are used also in emission-line-like objects to find out the nature of the main ionization mechanism: photo-ionization due to the absorption by the surrounding gas of UV photons emitted by massive stars, power law spectral energy distribution associated with active galactic nuclei or shock excitation. Since some of these diagnostic diagrams for the blue part of the spectrum use the emission lines of [Oiii] at 5007 and 4959 Å, we could use as well the [Neiii] 3869 Å emission line and the closest and brightest hydrogen recombination line to redefine these diagrams that would be useful up to larger redshifts and would also be less reddening dependent. This is the case of the relations proposed by [2004MNRAS.350..396L], as for instance the relation between ([Oiii] 5007 Å/H) and ([Oii] 3727 Å/H). Using the appropriate relations, the analytical expression proposed by these authors take the following expression:
In the upper panel of Figure 2.5.1 we show this diagram for the objects described in Section §3.2. Starbursts galaxies and star forming regions lie below the solid red line. This diagnostic ratio is, in fact, equivalent to the relation proposed by Rola et al. [1997MNRAS.289..419R] between ([Neiii] 3869 Å/H) and ([Oii] 3727 Å/H). The rate of coincidences between this diagnostic diagram and its predecessor based on [Oiii] lines reaches 83 %. This diagram can be used also to separate Seyfert 2 galaxies from LINERS using the theoretical expression proposed by Lamareille et al. [2004MNRAS.350..396L] adapted for [Neiii] and H:
![[Uncaptioned image]](/html/0908.4285/assets/chapter3/diagbluene2.png)
All the Hii galaxies which present abnormally high values of the emission line of [Neiii] shown in Figure 3.8 appear in this diagram in the Seyfert 2 zone, what is consistent with a possibly higher dependence of the [Neiii] line on stellar effective temperature, as it has been previously suggested. This is supported by the fact that none of these galaxies are classified as Seyfert 2 when other diagnostics diagrams, like [Sii]/H vs. [Oiii]/H or [Nii]/H vs. [Oiii]/H, are used.
The other blue diagnostic ratio proposed by Lamareille et al. [2004MNRAS.350..396L] is the relation ([Oiii] 4959+5007 Å)/([Oii] 3727 Å) versus O. The analytical expressions proposed by these authors for this diagram can be expressed in terms of [Neiii] and H adopting the form:
The diagram is shown in the lower panel of Figure 2.5.1 and, again, starbursts galaxies and star forming regions lie below this relation, which is shown as a solid line. Although the rate of coincidences between this relation and the one based on [Oii] and [Oiii] is very high (92 %), a larger number of objects is found lying on the AGN region as compared to other diagnostics which somewhat questions its application.
3.6 Summary and conclusions
We have performed an analysis of a large sample of emission line objects with a direct determination of the oxygen abundance, via the calculation of the electron temperature, and an accurate measurement of the emission lines of [Neiii] at 3869 Å and [Ariii] at 7136 Å. We have recalculated oxygen, neon and argon abundances taking into account the electron temperature most representative for each ionic species. The total chemical abundances have been calculated with the aid of new ionization correction factors for neon and argon based on a new grid of photo-ionization models computed using Cloudy v06.02 and WM-Basic stellar model atmospheres.
The new ICF for Ne yields lower abundances for low excitation objects in relation with the classical approximation O/O Ne/Ne, which does not take into account the charge transfer reaction between O and H. This new ICF agrees quite well with the fits proposed by Izotov et al. (2006) for the high and intermediate metallicity regime. Nevertheless, although we do not find any relevant dependence of this ICF on metallicity as we have not considered different X-ray sources in our models, there is some evidence of the underestimate of the ICF in the high metallicity regime. Firstly, the values found by Vermeij and Van der Hulst (2002) for a sample of Galactic Hii regions from the Ne emission lines in the mid-IR point to larger abundances of Ne in these objects. Secondly, the study of the Ne/O ratio as a function of metallicity shows lower values of Ne/O in the high metallicity regime. The average value of this ratio agrees better with the solar abundances than the values recently obtained from X-ray observations in stellar coronae (Drake and Testa, 2005).
Regarding Ar, we have obtained new ICFs for both Ar and Ar+Ar quite similar to the values found by Izotov et al. (2006) but, again, we do not find, any relevant dependence on metallicity. According to these new ICFs, the values proposed by Izotov et al. (1994) clearly overestimate the total abundances of Ar. We propose as well new ICFs based on the ratio S/(S+S), in order to calculate total Ar abundances using the red and far-IR wavelength range only. The study of the Ar/O ratio as a function of metallicity gives contradictory results for Hii galaxies and Giant Hii regions in spirals discs. For the first ones we find a constant value of the Ar/O ratio, in agreement with the expected results for the stellar production of this element. However, for GEHRs we find evidence for decreasing Ar/O with increasing metallicity. This result is found as well for the S/O ratio both in GEHRs (Díaz et al., 1991; Pérez-Montero et al., 2006) and halo massive stars of our Galaxy (Israelian and Rebolo, 2001). Taking into account that the ionization structure of Ar and S are quite similar and that they are produced in the same stellar cores it is not surprising that their ratios behave in similar ways.
We have studied some empirical parameters of metallicity based on Ne and Ar emission lines. This is the case of the [Neiii]/[Oii] ratio proposed by Nagao et al. (2006). We have shown that this parameter is indeed much more sensitive to ionization parameter and effective temperature than to metallicity due to the tight relation existing between [Neiii] and [Oiii] emission lines. This is due to the constant value of the Ne/O ratio and the identical ionization structures of Ne and O. In fact [Oiii] can be substituted by [Neiii] in empirical metallicity calibrations and diagnostic diagrams. This offers the possibility of extending the range of applicability of these relations to objects with higher redshift minimizing at the same time the effects of reddening corrections and flux calibration. We have then defined an abundance parameter O equivalent to the commonly used O but using the sum of the [Oii] and [Neiii] lines relative to H. Although this parameter has the same problems as O (double-valued, dependence on , calibration of the upper branch) it constitutes a new tool to derive oxygen abundances in large deep optical surveys of galaxies up to high redshifts ( 1.3). Using the same principle, we have defined new diagnostic methods based only on [Oii] and [Neiii], similar to those proposed by Rola et al. (1997), that could be used in the same surveys to separate star forming galaxies from active galactic nuclei. The results obtained from these diagrams are very similar to those obtained from the other ones in the blue part of the spectrum.
Bibliography
- 2004 Abazajian, K., Adelman-McCarthy, J. K., Agüeros, M. A., Allam, S. S., Anderson, K., Anderson, S. F., Annis, J., Bahcall, N. A., Baldry, I. K., Bastian, S., and 143 coauthors: 2004, Astron. J. 128, 502
- 2005 Abazajian, K., Adelman-McCarthy, J. K., Agüeros, M. A., Allam, S. S., Anderson, K. S. J., Anderson, S. F., Annis, J., Bahcall, N. A., Baldry, I. K., Bastian, S., and 144 coauthors: 2005, Astron. J. 129, 1755
- 2008 Adelman-McCarthy, J. K., Agüeros, M. A., Allam, S. S., Allende Prieto, C., Anderson, K. S. J., Anderson, S. F., Annis, J., Bahcall, N. A., Bailer-Jones, C. A. L., Baldry, I. K., and 153 coauthors: 2008, Astrophys. J., Suppl. Ser. 175, 297
- 2006 Adelman-McCarthy, J. K., Agüeros, M. A., Allam, S. S., Anderson, K. S. J., Anderson, S. F., Annis, J., Bahcall, N. A., Baldry, I. K., Barentine, J. C., Berlind, A., and 131 coauthors: 2006, Astrophys. J., Suppl. Ser. 162, 38
- 2001 Allende-Prieto, C., Lambert, D. L., and Asplund, M.: 2001, Astrophys. J. Letters 556, L63
- 1979 Alloin, D., Collin-Souffrin, S., Joly, M., and Vigroux, L.: 1979, Astron. Astrophys. 78, 200
- 1982 Alloin, D. and Nieto, J.-L.: 1982, Astron. and Astrophys. Suppl. Sries 50, 491
- 1999 Aloisi, A., Tosi, M., and Greggio, L.: 1999, Astron. J. 118, 302
- 2001a Alonso-Herrero, A., Engelbracht, C. W., Rieke, M. J., Rieke, G. H., and Quillen, A. C.: 2001a, Astrophys. J. 546, 952
- 2000 Alonso-Herrero, A., Rieke, G. H., Rieke, M. J., and Scoville, N. Z.: 2000, Astrophys. J. 532, 845
- 2001b Alonso-Herrero, A., Ryder, S. D., and Knapen, J. H.: 2001b, Mon. Not. R. Astron. Soc. 322, 757
- 2002 Álvarez-Álvarez, M.: 2002, PhD Thesis, Universidad Autónoma de Madrid
- 1985 Arp, H. and Sandage, A.: 1985, Astron. J. 90, 1163
- 2007 Asari, N. V., Cid Fernandes, R., Stasińska, G., Torres-Papaqui, J. P., Mateus, A., Sodré, L., Schoenell, W., and Gomes, J. M.: 2007, Mon. Not. R. Astron. Soc. 381, 263
- 2005 Asplund, M., Grevesse, N., and Sauval, A. J.: 2005, in T. G. Barnes, III and F. N. Bash (eds.), Cosmic Abundances as Records of Stellar Evolution and Nucleosynthesis, Vol. 336 of Astronomical Society of the Pacific Conference Series, pp 25–+
- 1992a Athanassoula, E.: 1992a, Mon. Not. R. Astron. Soc. 259, 328
- 1992b Athanassoula, E.: 1992b, Mon. Not. R. Astron. Soc. 259, 345
- 2006 Badnell, N. R.: 2006, Astron. Astrophys. 447, 389
- 1976 Bagnuolo, Jr., W. G.: 1976, Ph.D. thesis, AA(California Inst. of Tech., Pasadena.)
- 1981 Baldwin, J. A., Phillips, M. M., and Terlevich, R.: 1981, Publ. Astron. Soc. Pac. 93, 5
- 1982 Baldwin, J. A., Spinrad, H., and Terlevich, R.: 1982, Mon. Not. R. Astron. Soc. 198, 535
- 1981 Balick, B. and Heckman, T.: 1981, Astron. Astrophys. 96, 271
- 1976 Balick, B. and Sneden, C.: 1976, Astrophys. J. 208, 336
- 1983 Balzano, V. A.: 1983, Astrophys. J. 268, 602
- 1980 Barker, T.: 1980, Astrophys. J. 240, 99
- 2000 Barmby, P., Huchra, J. P., Brodie, J. P., Forbes, D. A., Schroder, L. L., and Grillmair, C. J.: 2000, Astron. J. 119, 727
- 1995 Barth, A. J., Ho, L. C., Filippenko, A. V., and Sargent, W. L.: 1995, Astron. J. 110, 1009
- 2005 Bastian, N., Gieles, M., Lamers, H. J. G. L. M., Scheepmaker, R. A., and de Grijs, R.: 2005, Astron. Astrophys. 431, 905
- 2006 Bastian, N., Saglia, R. P., Goudfrooij, P., Kissler-Patig, M., Maraston, C., Schweizer, F., and Zoccali, M.: 2006, Astron. Astrophys. 448, 881
- 2002 Benedict, G. F., Howell, D. A., Jørgensen, I., Kenney, J. D. P., and Smith, B. J.: 2002, Astron. J. 123, 1411
- 1999 Benjamin, R. A., Skillman, E. D., and Smits, D. P.: 1999, Astrophys. J. 514, 307
- 1987 Binney, J. and Tremaine, S.: 1987, Galactic dynamics, Princeton, NJ, Princeton University Press, 1987, 747 p.
- 1993 Boer, B. and Schulz, H.: 1993, Astron. Astrophys. 277, 397
- 2001 Bosch, G. and Meza, A.: 2001, in Revista Mexicana de Astronomia y Astrofisica Conference Series, Vol. 11 of Revista Mexicana de Astronomia y Astrofisica, vol. 27, pp 29–+
- 2001 Bosch, G., Selman, F., Melnick, J., and Terlevich, R.: 2001, Astron. Astrophys. 380, 137
- 2008 Bosch, G., Terlevich, E., and Terlevich, R.: 2008, Mon. Not. R. Astron. Soc.(submitted)
- 1984 Bottinelli, L., Gouguenheim, L., Paturel, G., and de Vaucouleurs, G.: 1984, Astron. and Astrophys. Suppl. Sries 56, 381
- 2004 Bournaud, F., Duc, P.-A., Amram, P., Combes, F., and Gach, J.-L.: 2004, Astron. Astrophys. 425, 813
- 2007 Bresolin, F.: 2007, Astrophys. J. 656, 186
- 2004 Bresolin, F., Garnett, D. R., and Kennicutt, Jr., R. C.: 2004, Astrophys. J. 615, 228
- 1997 Bresolin, F. and Kennicutt, Jr., R. C.: 1997, Astron. J. 113, 975
- 1999 Bresolin, F., Kennicutt, Jr., R. C., and Garnett, D. R.: 1999, Astrophys. J. 510, 104
- 2005 Bresolin, F., Schaerer, D., González-Delgado, R. M., and Stasińska, G.: 2005, Astron. Astrophys. 441, 981
- 1971 Brocklehurst, M.: 1971, Mon. Not. R. Astron. Soc. 153, 471
- 1987 Bushouse, H. A.: 1987, Astrophys. J. 320, 49
- 1998 Bushouse, H. A., Telesco, C. M., and Werner, M. W.: 1998, Astron. J. 115, 938
- 1988 Bushouse, H. A., Werner, M. W., and Lamb, S. A.: 1988, Astrophys. J. 335, 74
- 1994 Butler, K. and Zeippen, C. J.: 1994, Astron. and Astrophys. Suppl. Sries 108, 1
- 1998 Carlson, M. N., Holtzman, J. A., Watson, A. M., Grillmair, C. J., Mould, J. R., Ballester, G. E., Burrows, C. J., Clarke, J. T., Crisp, D., Evans, R. W., Gallagher, III, J. S., Griffiths, R. E., Hester, J. J., Hoessel, J. G., Scowen, P. A., Stapelfeldt, K. R., Trauger, J. T., and Westphal, J. A.: 1998, Astron. J. 115, 1778
- 2002 Castellanos, M., Díaz, A. I., and Terlevich, E.: 2002, Mon. Not. R. Astron. Soc. 329, 315
- 1990 Cepa, J. and Beckman, J. E.: 1990, Astrophys. J. 349, 497
- 2002 Cerviño, M., Valls-Gabaud, D., Luridiana, V., and Mas-Hesse, J. M.: 2002, Astron. Astrophys. 381, 51
- 2007 Cid Fernandes, R., Asari, N. V., Sodré, L., Stasińska, G., Mateus, A., Torres-Papaqui, J. P., and Schoenell, W.: 2007, Mon. Not. R. Astron. Soc. 375, L16
- 2001 Cid Fernandes, R., Heckman, T., Schmitt, H., Delgado, R. M. G., and Storchi-Bergmann, T.: 2001, Astrophys. J. 558, 81
- 2005 Cid Fernandes, R., Mateus, A., Sodré, L., Stasińska, G., and Gomes, J. M.: 2005, Mon. Not. R. Astron. Soc. 358, 363
- 1997 Colina, L., García Vargas, M. L., Mas-Hesse, J. M., Alberdi, A., and Krabbe, A.: 1997, Astrophys. J. Letters 484, L41+
- 2002 Colina, L., González-Delgado, R., Mas-Hesse, J. M., and Leitherer, C.: 2002, Astrophys. J. 579, 545
- 1985 Combes, F. and Gerin, M.: 1985, Astron. Astrophys. 150, 327
- 2006 Crockett, N. R., Garnett, D. R., Massey, P., and Jacoby, G.: 2006, Astrophys. J. 637, 741
- 1987 de Robertis, M. M., Dufour, R. J., and Hunt, R. W.: 1987, Royal Astronomical Society of Canada, Journal 81, 195
- 1963 de Vaucouleurs, G.: 1963, Astrophys. J., Suppl. Ser. 8, 31
- 1991 de Vaucouleurs, G., de Vaucouleurs, A., Corwin, Jr., H. G., Buta, R. J., Paturel, G., and Fouque, P.: 1991, Third Reference Catalogue of Bright Galaxies, Volume 1-3, XII, 2069 pp. 7 figs.. Springer-Verlag Berlin Heidelberg New York
- 2002 Denicoló, G., Terlevich, R., and Terlevich, E.: 2002, Mon. Not. R. Astron. Soc. 330, 69
- 2002 Denicoló, G., Terlevich, R., and Terlevich, E.: 2002, Mon. Not. R. Astron. Soc. 330, 69
- 1989 Devereux, N. A.: 1989, Astrophys. J. 346, 126
- 1992 Devereux, N. A., Kenney, J. D., and Young, J. S.: 1992, Astron. J. 103, 784
- 1989 Díaz, A. I.: 1989, in J. E. Beckman and B. E. J. Pagel (eds.), Evolutionary Phenomena in Galaxies, pp 377–397
- 1988 Díaz, A. I.: 1988, Mon. Not. R. Astron. Soc. 231, 57
- 1998 Díaz, A. I.: 1998, Astron. Astrophys. Suppl. Ser. 263, 143
- 2000a Díaz, A. I., Álvarez-Álvarez, M., Terlevich, E., Terlevich, R., Portal, M. S., and Aretxaga, I.: 2000a, Mon. Not. R. Astron. Soc. 311, 120
- 2000b Díaz, A. I., Castellanos, M., Terlevich, E., and Luisa García-Vargas, M.: 2000b, Mon. Not. R. Astron. Soc. 318, 462
- 2000 Díaz, A. I. and Pérez-Montero, E.: 2000, Mon. Not. R. Astron. Soc. 312, 130
- 1985 Díaz, A. I., Pagel, B. E. J., and Wilson, I. R. G.: 1985, Mon. Not. R. Astron. Soc. 212, 737
- 1999 Díaz, A. I. and Pérez-Montero, E.: 1999, in J. R. Walsh and M. R. Rosa (eds.), Chemical Evolution from Zero to High Redshift, pp 134–+
- 2006 Díaz, A. I., Terlevich, E., Castellanos, M., and Hägele, G. F.: 2006, astro-ph/0610787
- 2007 Díaz, Á. I., Terlevich, E., Castellanos, M., and Hägele, G. F.: 2007, Mon. Not. R. Astron. Soc. 382, 251
- 1987 Díaz, A. I., Terlevich, E., Pagel, B. E. J., Víilchez, J. M., and Edmunds, M. G.: 1987, Mon. Not. R. Astron. Soc. 226, 19
- 1989 Díaz, A. I., Terlevich, E., and Terlevich, R.: 1989, Mon. Not. R. Astron. Soc. 239, 325
- 1991 Díaz, A. I., Terlevich, E., Vílchez, J. M., Pagel, B. E. J., and Edmunds, M. G.: 1991, Mon. Not. R. Astron. Soc. 253, 245
- 1999 Díaz, R., Carranza, G., Dottori, H., and Goldes, G.: 1999, Astrophys. J. 512, 623
- 2002 Dopita, M. A., Pereira, M., Kewley, L. J., and Capaccioli, M.: 2002, Astrophys. J., Suppl. Ser. 143, 47
- 2008 Dors, Jr., O. L., Storchi-Bergmann, T., Riffel, R. A., and Schimdt, A. A.: 2008, astro-ph-0802.2070
- 2005 Drake, J. J. and Testa, P.: 2005, Nature 436, 525
- 2001 Ellison, S. L., Yan, L., Hook, I. M., Pettini, M., Wall, J. V., and Shaver, P.: 2001, Astron. Astrophys. 379, 393
- 1986 Elmegreen, B. G. and Elmegreen, D. M.: 1986, Astrophys. J. 311, 554
- 2002 Elmegreen, D. M., Chromey, F. R., McGrath, E. J., and Ostenson, J. M.: 2002, Astron. J. 123, 1381
- 1997 Elmegreen, D. M., Chromey, F. R., Santos, M., and Marshall, D.: 1997, Astron. J. 114, 1850
- 2006 Elmegreen, D. M., Elmegreen, B. G., Kaufman, M., Sheth, K., Struck, C., Thomasson, M., and Brinks, E.: 2006, Astrophys. J. 642, 158
- 2001 Elmegreen, D. M., Kaufman, M., Elmegreen, B. G., Brinks, E., Struck, C., Klarić, M., and Thomasson, M.: 2001, Astron. J. 121, 182
- 1999 Elmegreen, D. M. and Salzer, J. J.: 1999, Astron. J. 117, 764
- 2007 Ercolano, B., Bastian, N., and Stasińska, G.: 2007, Mon. Not. R. Astron. Soc. 379, 945
- 2004 Esteban, C., Peimbert, M., García-Rojas, J., Ruiz, M. T., Peimbert, A., and Rodríguez, M.: 2004, Mon. Not. R. Astron. Soc. 355, 229
- 1999 Falco, E. E., Kurtz, M. J., Geller, M. J., Huchra, J. P., Peters, J., Berlind, P., Mink, D. J., Tokarz, S. P., and Elwell, B.: 1999, Publ. Astron. Soc. Pac. 111, 438
- 1998 Ferland, G. J., Korista, K. T., Verner, D. A., Ferguson, J. W., Kingdon, J. B., and Verner, E. M.: 1998, Publ. Astron. Soc. Pac. 110, 761
- 1980 French, H. B.: 1980, Astrophys. J. 240, 41
- 1995 Friedli, D. and Benz, W.: 1995, Astron. Astrophys. 301, 649
- 1995 Galavis, M. E., Mendoza, C., and Zeippen, C. J.: 1995, Astron. and Astrophys. Suppl. Sries 111, 347
- 2001 Gallagher, S. C., Charlton, J. C., Hunsberger, S. D., Zaritsky, D., and Whitmore, B. C.: 2001, Astron. J. 122, 163
- 2006 García-Rojas, J.: 2006, PhD Thesis, Universidad de La Laguna
- 1994 García Vargas, M. L. and Díaz, A. I.: 1994, Astrophys. J., Suppl. Ser. 91, 553
- 2007 García-Rojas, J. and Esteban, C.: 2007, Astrophys. J. 670, 457
- 2005 García-Rojas, J., Esteban, C., Peimbert, A., Peimbert, M., Rodríguez, M., and Ruiz, M. T.: 2005, Mon. Not. R. Astron. Soc. 362, 301
- 2006 García-Rojas, J., Esteban, C., Peimbert, M., Costado, M. T., Rodríguez, M., Peimbert, A., and Ruiz, M. T.: 2006, Mon. Not. R. Astron. Soc. 368, 253
- 2004 García-Rojas, J., Esteban, C., Peimbert, M., Rodríguez, M., Ruiz, M. T., and Peimbert, A.: 2004, Astrophys. J., Suppl. Ser. 153, 501
- 1995 García-Vargas, M. L., Bressan, A., and Díaz, A. I.: 1995, Astron. and Astrophys. Suppl. Sries 112, 35
- 1992 Garnett, D. R.: 1992, Astron. J. 103, 1330
- 2002 Garnett, D. R.: 2002, Astrophys. J. 581, 1019
- 2004 Garnett, D. R., Kennicutt, Jr., R. C., and Bresolin, F.: 2004, Astrophys. J. Letters 607, L21
- 1997 Garnett, D. R., Shields, G. A., Skillman, E. D., Sagan, S. P., and Dufour, R. J.: 1997, Astrophys. J. 489, 63
- 2003 Gil de Paz, A., Madore, B. F., and Pevunova, O.: 2003, Astrophys. J., Suppl. Ser. 147, 29
- 2005 González-Delgado, R. M., Cerviño, M., Martins, L. P., Leitherer, C., and Hauschildt, P. H.: 2005, Mon. Not. R. Astron. Soc. 357, 945
- 1998 González-Delgado, R. M., Heckman, T., Leitherer, C., Meurer, G., Krolik, J., Wilson, A. S., Kinney, A., and Koratkar, A.: 1998, Astrophys. J. 505, 174
- 1996 González-Delgado, R. M. and Pérez, E.: 1996, Mon. Not. R. Astron. Soc. 281, 781
- 1995 González-Delgado, R. M., Pérez, E., Díaz, A. I., García-Vargas, M. L., Terlevich, E., and Vílchez, J. M.: 1995, Astrophys. J. 439, 604
- 1994 González-Delgado, R. M., Pérez, E., Tenorio-Tagle, G., Vílchez, J. M., Terlevich, E., Terlevich, R., Telles, E., Rodríguez-Espinosa, J. M., Mas-Hesse, M., García-Vargas, M. L., Díaz, A. I., Cepa, J., and Castañeda, H.: 1994, Astrophys. J. 437, 239
- 1997 Graham, J. A. and et al.: 1997, Astrophys. J. 477, 535
- 1998 Grevesse, N. and Sauval, A. J.: 1998, Space Science Reviews 85, 161
- 2006 Groves, B. A., Heckman, T. M., and Kauffmann, G.: 2006, Mon. Not. R. Astron. Soc. 371, 1559
- 2006 Gu, Q., Melnick, J., Fernandes, R. C., Kunth, D., Terlevich, E., and Terlevich, R.: 2006, Mon. Not. R. Astron. Soc. 366, 480
- 2007 Guseva, N. G., Izotov, Y. I., Papaderos, P., and Fricke, K. J.: 2007, Astron. Astrophys. 464, 885
- 2000 Guseva, N. G., Izotov, Y. I., and Thuan, T. X.: 2000, Astrophys. J. 531, 776 (GIT00)
- 2006 Guseva, N. G., Izotov, Y. I., and Thuan, T. X.: 2006, Astrophys. J. 644, 890
- 2003a Guseva, N. G., Papaderos, P., Izotov, Y. I., Green, R. F., Fricke, K. J., Thuan, T. X., and Noeske, K. G.: 2003a, Astron. Astrophys. 407, 75
- 2003b Guseva, N. G., Papaderos, P., Izotov, Y. I., Green, R. F., Fricke, K. J., Thuan, T. X., and Noeske, K. G.: 2003b, Astron. Astrophys. 407, 91
- 2003c Guseva, N. G., Papaderos, P., Izotov, Y. I., Green, R. F., Fricke, K. J., Thuan, T. X., and Noeske, K. G.: 2003c, Astron. Astrophys. 407, 105
- 1998 Guzmán, R., Jangren, A., Koo, D. C., Bershady, M. A., and Simard, L.: 1998, Astrophys. J. Letters 495, L13+
- 1996 Guzmán, R., Koo, D. C., Faber, S. M., Illingworth, G. D., Takamiya, M., Kron, R. G., and Bershady, M. A.: 1996, Astrophys. J. Letters 460, L5+
- 2007 Hägele, G. F., Díaz, A. I., Cardaci, M. V., Terlevich, E., and Terlevich, R.: 2007, Mon. Not. R. Astron. Soc. 378, 163
- 2008 Hägele, G. F., Díaz, Á. I., Terlevich, E., Terlevich, R., Pérez-Montero, E., and Cardaci, M. V.: 2008, Mon. Not. R. Astron. Soc. 383, 209
- 2006 Hägele, G. F., Pérez-Montero, E., Díaz, A. I., Terlevich, E., and Terlevich, R.: 2006, Mon. Not. R. Astron. Soc. 372, 293
- 1973 Harper, Jr., D. A. and Low, F. J.: 1973, Astrophys. J. Letters 182, L89+
- 1998 Haynes, M. P., van Zee, L., Hogg, D. E., Roberts, M. S., and Maddalena, R. J.: 1998, Astron. J. 115, 62
- 1989 Henry, R. B. C.: 1989, Mon. Not. R. Astron. Soc. 241, 453
- 1996a Ho, L. C. and Filippenko, A. V.: 1996a, Astrophys. J. Letters 466, L83+
- 1996b Ho, L. C. and Filippenko, A. V.: 1996b, Astrophys. J. 472, 600
- 1997 Ho, L. C., Filippenko, A. V., and Sargent, W. L. W.: 1997, Astrophys. J., Suppl. Ser. 112, 315
- 1992 Holtzman, J. A., Faber, S. M., Shaya, E. J., Lauer, T. R., Groth, J., Hunter, D. A., Baum, W. A., Ewald, S. P., Hester, J. J., Light, R. M., Lynds, C. R., O’Neil, Jr., E. J., and Westphal, J. A.: 1992, Astron. J. 103, 691
- 2001 Holweger, H.: 2001, in R. F. Wimmer-Schweingruber (ed.), Joint SOHO/ACE workshop ”Solar and Galactic Composition”, Vol. 598 of American Institute of Physics Conference Series, pp 23–+
- 2006 Hoyos, C. and Díaz, A. I.: 2006, Mon. Not. R. Astron. Soc. 365, 454
- 1926 Hubble, E. P.: 1926, Astrophys. J. 64, 321
- 1977 Huchra, J. P.: 1977, Astrophys. J. 217, 928
- 2001 Israelian, G. and Rebolo, R.: 2001, Astrophys. J. Letters 557, L43
- 1999 Izotov, Y. I., Chaffee, F. H., Foltz, C. B., Green, R. F., Guseva, N. G., and Thuan, T. X.: 1999, Astrophys. J. 527, 757
- 2001a Izotov, Y. I., Chaffee, F. H., and Green, R. F.: 2001a, Astrophys. J. 562, 727
- 2001b Izotov, Y. I., Chaffee, F. H., and Schaerer, D.: 2001b, Astron. Astrophys. 378, L45 (ICS01)
- 1997a Izotov, Y. I., Lipovetsky, V. A., Chaffee, F. H., Foltz, C. B., Guseva, N. G., and Kniazev, A. Y.: 1997a, Astrophys. J. 476, 698
- 2004a Izotov, Y. I., Papaderos, P., Guseva, N. G., Fricke, K. J., and Thuan, T. X.: 2004a, Astron. Astrophys. 421, 539
- 2004b Izotov, Y. I., Stasińska, G., Guseva, N. G., and Thuan, T. X.: 2004b, Astron. Astrophys. 415, 87 (IT04)
- 2006 Izotov, Y. I., Stasińska, G., Meynet, G., Guseva, N. G., and Thuan, T. X.: 2006, Astron. Astrophys. 448, 955
- 1998a Izotov, Y. I. and Thuan, T. X.: 1998a, Astrophys. J. 497, 227
- 1998b Izotov, Y. I. and Thuan, T. X.: 1998b, Astrophys. J. 500, 188 (IT98)
- 2004 Izotov, Y. I. and Thuan, T. X.: 2004, Astrophys. J. 602, 200
- 1994 Izotov, Y. I., Thuan, T. X., and Lipovetsky, V. A.: 1994, Astrophys. J. 435, 647 (ITL94)
- 1997b Izotov, Y. I., Thuan, T. X., and Lipovetsky, V. A.: 1997b, Astrophys. J., Suppl. Ser. 108, 1 (ITL97)
- 2005 Jamet, L., Stasińska, G., Pérez, E., González-Delgado, R. M., and Vílchez, J. M.: 2005, Astron. Astrophys. 444, 723
- 2003 Jarrett, T. H., Chester, T., Cutri, R., Schneider, S. E., and Huchra, J. P.: 2003, Astron. J. 125, 525
- 2000 Jiménez-Benito, L., Díaz, A. I., Terlevich, R., and Terlevich, E.: 2000, Mon. Not. R. Astron. Soc. 317, 907
- 2005 Jogee, S., Scoville, N., and Kenney, J. D. P.: 2005, Astrophys. J. 630, 837
- 2003 Kauffmann, G., Heckman, T. M., Tremonti, C., Brinchmann, J., Charlot, S., White, S. D. M., Ridgway, S. E., Brinkmann, J., Fukugita, M., Hall, P. B., Ivezić, Ž., Richards, G. T., and Schneider, D. P.: 2003, Mon. Not. R. Astron. Soc. 346, 1055
- 1992 Kenney, J. D. P., Wilson, C. D., Scoville, N. Z., Devereux, N. A., and Young, J. S.: 1992, Astrophys. J. Letters 395, L79
- 2003 Kennicutt, R. C., Bresolin, F., and Garnett, D. R.: 2003, Astrophys. J. 591, 801(KBG03)
- 1989 Kennicutt, Jr., R. C.: 1989, Astrophys. J. 344, 685
- 1992 Kennicutt, Jr., R. C.: 1992, Astrophys. J., Suppl. Ser. 79, 255
- 1998a Kennicutt, Jr., R. C.: 1998a, Ann. Rev. Astron. Astrophys. 36, 189
- 1998b Kennicutt, Jr., R. C.: 1998b, Astrophys. J. 498, 541
- 1996 Kennicutt, Jr., R. C. and Garnett, D. R.: 1996, Astrophys. J. 456, 504
- 1989 Kennicutt, Jr., R. C., Keel, W. C., and Blaha, C. A.: 1989, Astron. J. 97, 1022
- 1987 Kennicutt, Jr., R. C., Roettiger, K. A., Keel, W. C., van der Hulst, J. M., and Hummel, E.: 1987, Astron. J. 93, 1011
- 2001 Kewley, L. J., Dopita, M. A., Sutherland, R. S., Heisler, C. A., and Trevena, J.: 2001, Astrophys. J. 556, 121
- 2008 Kewley, L. J. and Ellison, S. L.: 2008, ArXiv e-prints 801
- 1995 Kingdon, J. and Ferland, G. J.: 1995, Astrophys. J. 442, 714
- 1992 Knapen, J. H., Beckman, J. E., Cepa, J., van der Hulst, T., and Rand, R. J.: 1992, Astrophys. J. Letters 385, L37
- 2003 Kniazev, A. Y., Grebel, E. K., Hao, L., Strauss, M. A., Brinkmann, J., and Fukugita, M.: 2003, Astrophys. J. Letters 593, L73
- 2004 Kniazev, A. Y., Pustilnik, S. A., Grebel, E. K., Lee, H., and Pramskij, A. G.: 2004, Astrophys. J., Suppl. Ser. 153, 429
- 1999 Kobulnicky, H. A., Kennicutt, Jr., R. C., and Pizagno, J. L.: 1999, Astrophys. J. 514, 544
- 1994 Koo, D. C., Bershady, M. A., Wirth, G. D., Stanford, S. A., and Majewski, S. R.: 1994, Astrophys. J. Letters 427, L9
- 1995 Koo, D. C., Guzmán, R., Faber, S. M., Illingworth, G. D., Bershady, M. A., Kron, R. G., and Takamiya, M.: 1995, Astrophys. J. Letters 440, L49
- 2007 Kouwenhoven, M. B. N. and de Grijs, R.: 2007, astro-ph/0710.1207
- 2001 Kregel, M. and Sancisi, R.: 2001, Astron. Astrophys. 376, 59
- 2002 Kroupa, P.: 2002, Science 295, 82
- 2000 Kunth, D. and Östlin, G.: 2000, Astron. Astrophys. Rev 10, 1
- 1983 Kunth, D. and Sargent, W. L. W.: 1983, Astrophys. J. 273, 81
- 1998 Kurtz, M. J. and Mink, D. J.: 1998, Publ. Astron. Soc. Pac. 110, 934
- 2004 Lamareille, F., Mouhcine, M., Contini, T., Lewis, I., and Maddox, S.: 2004, Mon. Not. R. Astron. Soc. 350, 396
- 2001 Larsen, S. S., Brodie, J. P., Elmegreen, B. G., Efremov, Y. N., Hodge, P. W., and Richtler, T.: 2001, Astrophys. J. 556, 801
- 2004 Larsen, S. S., Brodie, J. P., and Hunter, D. A.: 2004, Astron. J. 128, 2295
- 1978 Larson, R. B. and Tinsley, B. M.: 1978, Astrophys. J. 219, 46
- 2004 Lee, J. C., Salzer, J. J., and Melbourne, J.: 2004, Astrophys. J. 616, 752 (L04)
- 1995 Leitherer, C. and Heckman, T. M.: 1995, Astrophys. J., Suppl. Ser. 96, 9
- 1992 Leitherer, C., Robert, C., and Drissen, L.: 1992, Astrophys. J. 401, 596
- 1999 Leitherer, C., Schaerer, D., Goldader, J. D., Delgado, R. M. G., Robert, C., Kune, D. F., de Mello, D. F., Devost, D., and Heckman, T. M.: 1999, Astrophys. J., Suppl. Ser. 123, 3
- 1994 Lennon, D. J. and Burke, V. M.: 1994, Astron. and Astrophys. Suppl. Sries 103, 273
- 1995 Liu, C. T. and Kennicutt, Jr., R. C.: 1995, Astrophys. J. 450, 547
- 2006 Liu, X.-W.: 2006, in M. J. Barlow and R. H. Méndez (eds.), Planetary Nebulae in our Galaxy and Beyond, Vol. 234 of IAU Symposium, pp 219–226
- 2006 Liu, X.-W., Barlow, M. J., Zhang, Y., Bastin, R. J., and Storey, P. J.: 2006, Mon. Not. R. Astron. Soc. 368, 1959
- 2001 Liu, X.-W., Luo, S.-G., Barlow, M. J., Danziger, I. J., and Storey, P. J.: 2001, Mon. Not. R. Astron. Soc. 327, 141
- 2000 Liu, X.-W., Storey, P. J., Barlow, M. J., Danziger, I. J., Cohen, M., and Bryce, M.: 2000, Mon. Not. R. Astron. Soc. 312, 585
- 2005a López, J.: 2005a, MSc Thesis, INAOE
- 2005b López, J.: 2005b, MSc Thesis, INAOE
- 2003 Luridiana, V., Peimbert, A., Peimbert, M., and Cerviño, M.: 2003, Astrophys. J. 592, 846
- 1999 Luridiana, V., Peimbert, M., and Leitherer, C.: 1999, Astrophys. J. 527, 110
- 1990 Macchetto, F., Colina, L., Golombek, D., Perryman, M. A. C., and di Serego Alighieri, S.: 1990, Astrophys. J. 356, 389
- 2001 Maoz, D., Barth, A. J., Ho, L. C., Sternberg, A., and Filippenko, A. V.: 2001, Astron. J. 121, 3048
- 1996 Maoz, D., Barth, A. J., Sternberg, A., Filippenko, A. V., Ho, L. C., Macchetto, F. D., Rix, H.-W., and Schneider, D. P.: 1996, Astron. J. 111, 2248
- 2006 Marconi, A., Pastorini, G., Pacini, F., Axon, D. J., Capetti, A., Macchetto, D., Koekemoer, A. M., and Schreier, E. J.: 2006, Astron. Astrophys. 448, 921
- 1991 Mas-Hesse, J. M. and Kunth, D.: 1991, Astron. and Astrophys. Suppl. Sries 88, 399
- 2003 Mas-Hesse, J. M., Kunth, D., Tenorio-Tagle, G., Leitherer, C., Terlevich, R. J., and Terlevich, E.: 2003, Astrophys. J. 598, 858
- 2007 Mateus, A., Sodré, L., Cid Fernandes, R., and Stasińska, G.: 2007, Mon. Not. R. Astron. Soc. 374, 1457
- 2006 Mateus, A., Sodré, L., Cid Fernandes, R., Stasińska, G., Schoenell, W., and Gomes, J. M.: 2006, Mon. Not. R. Astron. Soc. 370, 721
- 1986 McCall, M. L. and Schmidt, F. H.: 1986, Astrophys. J. 311, 548
- 2003 McCrady, N., Gilbert, A. M., and Graham, J. R.: 2003, Astrophys. J. 596, 240
- 2007 McCrady, N. and Graham, J. R.: 2007, Astrophys. J. 663, 844
- 1991 McGaugh, S. S.: 1991, Astrophys. J. 380, 140
- 2004 Melbourne, J., Phillips, A., Salzer, J. J., Gronwall, C., and Sarajedini, V. L.: 2004, Astron. J. 127, 686 (M04)
- 1999 Melnick, J., Tenorio-Tagle, G., and Terlevich, R.: 1999, Mon. Not. R. Astron. Soc. 302, 677
- 1985a Melnick, J., Terlevich, R., and Eggleton, P. P.: 1985a, Mon. Not. R. Astron. Soc. 216, 255
- 1985b Melnick, J., Terlevich, R., and Moles, M.: 1985b, Revista Mexicana de Astronomia y Astrofisica 11, 91
- 1988 Melnick, J., Terlevich, R., and Moles, M.: 1988, Mon. Not. R. Astron. Soc. 235, 297
- 2000 Melnick, J., Terlevich, R., and Terlevich, E.: 2000, Mon. Not. R. Astron. Soc. 311
- 2005 Mengel, S., Lehnert, M. D., Thatte, N., and Genzel, R.: 2005, Astron. Astrophys. 443, 41
- 2008 Mengel, S., Lehnert, M. D., Thatte, N. A., Vacca, W. D., Whitmore, B., and Chandar, R.: 2008, ArXiv e-prints 805
- 1995 Meurer, G. R., Heckman, T. M., Leitherer, C., Kinney, A., Robert, C., and Garnett, D. R.: 1995, Astron. J. 110, 2665
- 1994 Meynet, G., Maeder, A., Schaller, G., Schaerer, D., and Charbonnel, C.: 1994, Astron. and Astrophys. Suppl. Sries 103, 97
- 1997 Miller, B. W., Whitmore, B. C., Schweizer, F., and Fall, S. M.: 1997, Astron. J. 114, 2381
- 1972 Miller, J. S. and Mathews, W. G.: 1972, Astrophys. J. 172, 593
- 2006 Mollá, M., Vílchez, J. M., Gavilán, M., and Díaz, A. I.: 2006, Mon. Not. R. Astron. Soc. 372, 1069
- 1958 Morgan, W. W.: 1958, Publ. Astron. Soc. Pac. 70, 364
- 2004 Morisset, C., Schaerer, D., Bouret, J.-C., and Martins, F.: 2004, Astron. Astrophys. 415, 577
- 2000 Mould, J. R., Huchra, J. P., Freedman, W. L., Kennicutt, Jr., R. C., Ferrarese, L., Ford, H. C., Gibson, B. K., Graham, J. A., Hughes, S. M. G., Illingworth, G. D., Kelson, D. D., Macri, L. M., Madore, B. F., Sakai, S., Sebo, K. M., Silbermann, N. A., and Stetson, P. B.: 2000, Astrophys. J. 529, 786
- 1996 Mulder, P. S. and van Driel, W.: 1996, Astron. Astrophys. 309, 403
- 1995 Mulder, P. S., van Driel, W., and Braine, J.: 1995, Astron. Astrophys. 300, 687
- 2006 Nagao, T., Maiolino, R., and Marconi, A.: 2006, Astron. Astrophys. 459, 85
- 1995 Nelson, C. H. and Whittle, M.: 1995, Astrophys. J., Suppl. Ser. 99, 67
- 2005 Noeske, K. G., Papaderos, P., Cairós, L. M., and Fricke, K. J.: 2005, Astron. Astrophys. 429, 115
- 1990 Oke, J. B.: 1990, Astron. J. 99, 1621
- 1983 Oke, J. B. and Gunn, J. E.: 1983, Astrophys. J. 266, 713
- 2001 Olive, K. A. and Skillman, E. D.: 2001, New Astronomy 6, 119
- 2004 Olive, K. A. and Skillman, E. D.: 2004, Astrophys. J. 617, 29
- 2001 Origlia, L., Leitherer, C., Aloisi, A., Greggio, L., and Tosi, M.: 2001, Astron. J. 122, 815
- 2004 Origlia, L., Ranalli, P., Comastri, A., and Maiolino, R.: 2004, Astrophys. J. 606, 862
- 1989 Osterbrock, D. E.: 1989, Astrophysics of gaseous nebulae and active galactic nuclei, Mill Valley, CA, University Science Books
- 1996 Osterbrock, D. E., Fulbright, J. P., Martel, A. R., Keane, M. J., Trager, S. C., and Basri, G.: 1996, Publ. Astron. Soc. Pac. 108, 277
- 2004 Östlin, G., Cumming, R. J., Amram, P., Bergvall, N., Kunth, D., Márquez, I., Masegosa, J., and Zackrisson, E.: 2004, Astron. Astrophys. 419, L43
- 1979 Pagel, B. E. J., Edmunds, M. G., Blackwell, D. E., Chun, M. S., and Smith, G.: 1979, Mon. Not. R. Astron. Soc. 189, 95
- 1992 Pagel, B. E. J., Simonson, E. A., Terlevich, R. J., and Edmunds, M. G.: 1992, Mon. Not. R. Astron. Soc. 255, 325
- 1997 Palacios, J., García-Vargas, M. L., Díaz, A., Terlevich, R., and Terlevich, E.: 1997, Astron. Astrophys. 323, 749
- 2008 Pasquali, A. and Castangia, P.: 2008, Mon. Not. R. Astron. Soc. 385, 468
- 2007 Pastorini, G., Marconi, A., Capetti, A., Axon, D. J., Alonso-Herrero, A., Atkinson, J., Batcheldor, D., Carollo, C. M., Collett, J., Dressel, L., Hughes, M. A., Macchetto, D., Maciejewski, W., Sparks, W., and van der Marel, R.: 2007, Astron. Astrophys. 469, 405
- 1993 Pastoriza, M. G., Dottori, H. A., Terlevich, E., Terlevich, R., and Diaz, A. I.: 1993, Mon. Not. R. Astron. Soc. 260, 177
- 2001 Pauldrach, A. W. A., Hoffmann, T. L., and Lennon, M.: 2001, Astron. Astrophys. 375, 161
- 2003 Peimbert, A.: 2003, Astrophys. J. 584, 735
- 2002 Peimbert, A., Peimbert, M., and Luridiana, V.: 2002, Astrophys. J. 565, 668
- 2005 Peimbert, A., Peimbert, M., and Ruiz, M. T.: 2005, Astrophys. J. 634, 1056
- 1967 Peimbert, M.: 1967, Astrophys. J. 150, 825
- 1971 Peimbert, M.: 1971, Boletin de los Observatorios Tonantzintla y Tacubaya 6, 29
- 1969 Peimbert, M. and Costero, R.: 1969, Boletin de los Observatorios Tonantzintla y Tacubaya 5, 3
- 2003 Peimbert, M. and Peimbert, A.: 2003, in Revista Mexicana de Astronomia y Astrofisica Conference Series, Vol. 16, pp 113–116
- 2006 Peimbert, M. and Peimbert, A.: 2006, in M. J. Barlow and R. H. Méndez (eds.), Planetary Nebulae in our Galaxy and Beyond, Vol. 234 of IAU Symposium, pp 227–234
- 2007 Peimbert, M., Peimbert, A., Esteban, C., García-Rojas, J., Bresolin, F., Carigi, L., Ruiz, M. T., and López-Sánchez, A. R.: 2007, in Revista Mexicana de Astronomia y Astrofisica Conference Series, Vol. 29 of Revista Mexicana de Astronomia y Astrofisica Conference Series, pp 72–79
- 2000 Peimbert, M., Peimbert, A., and Ruiz, M. T.: 2000, Astrophys. J. 541, 688
- 2004 Peimbert, M., Peimbert, A., Ruiz, M. T., and Esteban, C.: 2004, Astrophys. J., Suppl. Ser. 150, 431
- 1992 Peimbert, M. and Torres-Peimbert, S.: 1992, Astron. Astrophys. 253, 349
- 2000 Pérez, E., Márquez, I., Marrero, I., Durret, F., González Delgado, R. M., Masegosa, J., Maza, J., and Moles, M.: 2000, Astron. Astrophys. 353, 893
- 2003 Pérez-Montero, E. and Díaz, A. I.: 2003, Mon. Not. R. Astron. Soc. 346, 105 (PMD03)
- 2005 Pérez-Montero, E. and Díaz, A. I.: 2005, Mon. Not. R. Astron. Soc. 361, 1063
- 2007 Pérez-Montero, E. and Díaz, A. I.: 2007, Mon. Not. R. Astron. Soc. 377, 1195
- 2006 Pérez-Montero, E., Díaz, A. I., Vílchez, J. M., and Kehrig, C.: 2006, Astron. Astrophys. 449, 193
- 2007 Pérez-Montero, E., Hägele, G. F., Contini, T., and Díaz, Á. I.: 2007, Mon. Not. R. Astron. Soc. 381, 125
- 1996 Pérez-Olea, D.: 1996, PhD Thesis, Universidad Autónoma de Madrid
- 2001 Pettini, M., Shapley, A. E., Steidel, C. C., Cuby, J.-G., Dickinson, M., Moorwood, A. F. M., Adelberger, K. L., and Giavalisco, M.: 2001, Astrophys. J. 554, 981
- 2000 Pettini, M., Steidel, C. C., Adelberger, K. L., Dickinson, M., and Giavalisco, M.: 2000, Astrophys. J. 528, 96
- 1984 Phillips, M. M., Pagel, B. E. J., Edmunds, M. G., and Díaz, A.: 1984, Mon. Not. R. Astron. Soc. 210, 701
- 2000 Pilyugin, L. S.: 2000, Astron. Astrophys. 362, 325
- 2007 Pilyugin, L. S.: 2007, Mon. Not. R. Astron. Soc. 375, 685
- 2006 Pilyugin, L. S., Thuan, T. X., and Vílchez, J. M.: 2006, Mon. Not. R. Astron. Soc. 367, 1139
- 2004 Pilyugin, L. S., Vílchez, J. M., and Contini, T.: 2004, Astron. Astrophys. 425, 849
- 1995 Piner, B. G., Stone, J. M., and Teuben, P. J.: 1995, Astrophys. J. 449, 508
- 2004 Pizzella, A., Corsini, E. M., Vega Beltrán, J. C., and Bertola, F.: 2004, Astron. Astrophys. 424, 447
- 1997 Planesas, P., Colina, L., and Pérez-Olea, D.: 1997, Astron. Astrophys. 325, 81
- 2000 Popescu, C. C. and Hopp, U.: 2000, Astron. and Astrophys. Suppl. Sries 142, 247
- 2005 Porter, R. L., Bauman, R. P., Ferland, G. J., and MacAdam, K. B.: 2005, Astrophys. J. Letters 622, L73
- 1994 Prada, F., Greve, A., and McKeith, C. D.: 1994, Astron. Astrophys. 288, 396
- 1976 Pradhan, A. K.: 1976, Mon. Not. R. Astron. Soc. 177, 31
- 1990 Puxley, P. J., Hawarden, T. G., and Mountain, C. M.: 1990, Astrophys. J. 364, 77
- 1996 Ramsbottom, C. A., Bell, K. L., and Stafford, R. P.: 1996, Atomic Data and Nuclear Data Tables 63, 57
- 1978 Rieke, G. H. and Lebofsky, M. J.: 1978, Astrophys. J. Letters 220, L37
- 1993 Rieke, G. H., Loken, K., Rieke, M. J., and Tamblyn, P.: 1993, Astrophys. J. 412, 99
- 1972 Rieke, G. H. and Low, F. J.: 1972, Astrophys. J. Letters 176, L95+
- 1979 Roberts, Jr., W. W., Huntley, J. M., and van Albada, G. D.: 1979, Astrophys. J. 233, 67
- 2004 Rodríguez, M. and Rubin, R. H.: 2004, in IAU Symp. 217, Recycling Intergallactic and Interstellar Matter, ed. P. A. Duc, J. Braine, and E. Brinks (San Francisco: ASP), pp 188–+ (astro–ph/0312246)
- 1997 Rola, C. S., Terlevich, E., and Terlevich, R. J.: 1997, Mon. Not. R. Astron. Soc. 289, 419
- 2007 Rosa-González, D., Schmitt, H. R., Terlevich, E., and Terlevich, R.: 2007, Astrophys. J. 654, 226
- 2002 Rubin, R. H., Bhatt, N. J., Dufour, R. J., Buckalew, B. A., Barlow, M. J., Liu, X.-W., Storey, P. J., Balick, B., Ferland, G. J., Harrington, J. P., and Martin, P. G.: 2002, Mon. Not. R. Astron. Soc. 334, 777
- 1975 Rubin, V. C., Peterson, C. J., and Ford, Jr., W. K.: 1975, Astrophys. J. 199, 39
- 2003 Ruiz, M. T., Peimbert, A., Peimbert, M., and Esteban, C.: 2003, Astrophys. J. 595, 247
- 1999 Sakamoto, K., Okumura, S. K., Ishizuki, S., and Scoville, N. Z.: 1999, Astrophys. J. 525, 691
- 1955 Salpeter, E. E.: 1955, Astrophys. J. 121, 161
- 2000 Sánchez-Portal, M., Díaz, Á. I., Terlevich, R., Terlevich, E., Álvarez Álvarez, M., and Aretxaga, I.: 2000, Mon. Not. R. Astron. Soc. 312, 2
- 1970 Sargent, W. L. W.: 1970, Astrophys. J. 160, 405
- 1970 Sargent, W. L. W. and Searle, L.: 1970, Astrophys. J. Letters 162, L155+
- 1998 Schulte-Ladbeck, R. E., Crone, M. M., and Hopp, U.: 1998, Astrophys. J. Letters 493, L23+
- 1972 Searle, L. and Sargent, W. L. W.: 1972, Astrophys. J. 173, 25
- 1973 Searle, L., Sargent, W. L. W., and Bagnuolo, W. G.: 1973, Astrophys. J. 179, 427
- 1965 Sérsic, J. L. and Pastoriza, M.: 1965, Publ. Astron. Soc. Pac. 77, 287
- 1967 Sérsic, J. L. and Pastoriza, M.: 1967, Publ. Astron. Soc. Pac. 79, 152
- 1995 Shaw, R. A. and Dufour, R. J.: 1995, Publ. Astron. Soc. Pac. 107, 896
- 2005 Sheth, K., Vogel, S. N., Regan, M. W., Thornley, M. D., and Teuben, P. J.: 2005, Astrophys. J. 632, 217
- 1995 Shields, J. C. and Kennicutt, Jr., R. C.: 1995, Astrophys. J. 454, 807
- 2005 Siegel, E. R., Guzmán, R., Gallego, J. P., Orduña López, M., and Rodríguez-Hidalgo, P.: 2005, Mon. Not. R. Astron. Soc. 356, 1117
- 1993 Skillman, E. D. and Kennicutt, Jr., R. C.: 1993, Astrophys. J. 411, 655 (SK93)
- 1994 Skillman, E. D., Televich, R. J., Kennicutt, Jr., R. C., Garnett, D. R., and Terlevich, E.: 1994, Astrophys. J. 431, 172 (S94)
- 2005 Smith, B. J., Struck, C., Appleton, P. N., Charmandaris, V., Reach, W., and Eitter, J. J.: 2005, Astron. J. 130, 2117
- 1996 Smith, D. A., Neff, S. G., Bothun, G. D., Fanelli, M. N., Offenberg, J. D., Waller, W. H., Bohlin, R. C., O’Connell, R. W., Roberts, M. S., Smith, A. M., and Stecher, T. P.: 1996, Astrophys. J. Letters 473, L21+
- 2002 Smith, L. J., Norris, R. P. F., and Crowther, P. A.: 2002, Mon. Not. R. Astron. Soc. 337, 1309
- 2003 Stasińska, G. and Izotov, Y.: 2003, Astron. Astrophys. 397, 71
- 1978 Stasińska, G.: 1978, Astron. Astrophys. 66, 257
- 1980 Stasińska, G.: 1980, Astron. Astrophys. 84, 320
- 1990 Stasińska, G.: 1990, Astron. and Astrophys. Suppl. Sries 83, 501
- 2005 Stasińska, G.: 2005, Astron. Astrophys. 434, 507
- 2006 Stasińska, G.: 2006, Astron. Astrophys. 454, L127
- 1996 Stasińska, G. and Leitherer, C.: 1996, Astrophys. J., Suppl. Ser. 107, 661
- 1982 Stauffer, J. R.: 1982, Astrophys. J., Suppl. Ser. 50, 517
- 1995 Storey, P. J. and Hummer, D. G.: 1995, Mon. Not. R. Astron. Soc. 272, 41
- 2002 Stoughton, C. and et al.: 2002, Astron. J. 123, 485
- 2006 Swartz, D. A., Yukita, M., Tennant, A. F., Soria, R., and Ghosh, K. K.: 2006, Astrophys. J. 647, 1030
- 1999 Tayal, S. S. and Gupta, G. P.: 1999, Astrophys. J. 526, 544
- 1988 Telesco, C. M.: 1988, Ann. Rev. Astron. Astrophys. 26, 343
- 1988 Telesco, C. M. and Decher, R.: 1988, Astrophys. J. 334, 573
- 1984 Telesco, C. M. and Gatley, I.: 1984, Astrophys. J. 284, 557
- 1980 Telesco, C. M. and Harper, D. A.: 1980, Astrophys. J. 235, 392
- 1997 Telles, E., Melnick, J., and Terlevich, R.: 1997, Mon. Not. R. Astron. Soc. 288, 78
- 2003 Temporin, S., Ciroi, S., Rafanelli, P., Radovich, M., Vennik, J., Richter, G. M., and Birkle, K.: 2003, Astrophys. J., Suppl. Ser. 148, 353
- 1990 Terlevich, E., Terlevich, R., Díaz, A. I., Pastoriza, M. G., and Dottori, H.: 1990, Mon. Not. R. Astron. Soc. 242, 48P
- 2003 Terlevich, E., Terlevich, R., and Melnick, J.: 2003, in J. M. Rodriguez-Espinoza, F. Garzon Lopez, and V. Melo Martin (eds.), Revista Mexicana de Astronomia y Astrofisica Conference Series, pp 213–215
- 1991 Terlevich, R., Melnick, J., Masegosa, J., Moles, M., and Copetti, M. V. F.: 1991, Astron. and Astrophys. Suppl. Sries 91, 285 (T91)
- 1988 Thronson, Jr., H. A. and Greenhouse, M. A.: 1988, Astrophys. J. 327, 671
- 1968 Tinsley, B. M.: 1968, Astrophys. J. 151, 547
- 1972 Tinsley, B. M.: 1972, Astron. Astrophys. 20, 383
- 1979 Tonry, J. and Davis, M.: 1979, Astron. J. 84, 1511
- 2007 Trancho, G., Bastian, N., Miller, B. W., and Schweizer, F.: 2007, Astrophys. J. 664, 284
- 2003 Tsamis, Y. G., Barlow, M. J., Liu, X.-W., Danziger, I. J., and Storey, P. J.: 2003, Mon. Not. R. Astron. Soc. 338, 687
- 2005 Tsamis, Y. G. and Péquignot, D.: 2005, Mon. Not. R. Astron. Soc. 364, 687
- 2003 Ugryumov, A. V., Engels, D., Pustilnik, S. A., Kniazev, A. Y., Pramskij, A. G., and Hagen, H.-J.: 2003, Astron. Astrophys. 397, 463
- 1976 van der Kruit, P. C.: 1976, Astron. Astrophys. 49, 161
- 1976 van der Kruit, P. C. and de Bruyn, A. G.: 1976, Astron. Astrophys. 48, 373
- 2000 van Zee, L.: 2000, Astrophys. J. Letters 543, L31
- 2005 Vázquez, G. A. and Leitherer, C.: 2005, Astrophys. J. 621, 695
- 2002 Vermeij, R. and van der Hulst, J. M.: 2002, Astron. Astrophys. 391, 1081
- 1988 Vílchez, J. M., Pagel, B. E. J., Díaz, A. I., Terlevich, E., and Edmunds, M. G.: 1988, Mon. Not. R. Astron. Soc. 235, 633
- 1992 Vila-Costas, M. B. and Edmunds, M. G.: 1992, Mon. Not. R. Astron. Soc. 259, 121
- 1996 Vílchez, J. M. and Esteban, C.: 1996, Mon. Not. R. Astron. Soc. 280, 720
- 1988 Vílchez, J. M. and Pagel, B. E. J.: 1988, Mon. Not. R. Astron. Soc. 231, 257
- 2004 Wang, W., Liu, X.-W., Zhang, Y., and Barlow, M. J.: 2004, Astron. Astrophys. 427, 873
- 1993 Weaver, T. A. and Woosley, S. E.: 1993, Phys. Rep. 227, 65
- 2005 Wesson, R., Liu, X.-W., and Barlow, M. J.: 2005, Mon. Not. R. Astron. Soc. 362, 424
- 1995 Whitmore, B. C. and Schweizer, F.: 1995, Astron. J. 109, 960
- 1993 Whitmore, B. C., Schweizer, F., Leitherer, C., Borne, K., and Robert, C.: 1993, Astron. J. 106, 1354
- 1999 Whitmore, B. C., Zhang, Q., Leitherer, C., Fall, S. M., Schweizer, F., and Miller, B. W.: 1999, Astron. J. 118, 1551
- 2007 Woods, D. F. and Geller, M. J.: 2007, Astron. J. 134, 527
- 2006 Woods, D. F., Geller, M. J., and Barton, E. J.: 2006, Astron. J. 132, 197
- 1991 Xu, C. and Sulentic, J. W.: 1991, Astrophys. J. 374, 407
- 1994 Zaritsky, D., Kennicutt, Jr., R. C., and Huchra, J. P.: 1994, Astrophys. J. 420, 87
- 1982 Zeippen, C. J.: 1982, Mon. Not. R. Astron. Soc. 198, 111
- 1987 Zeippen, C. J., Le Bourlot, J., and Butler, K.: 1987, Astron. Astrophys. 188, 251
- 1999 Zepf, S. E., Ashman, K. M., English, J., Freeman, K. C., and Sharples, R. M.: 1999, Astron. J. 118, 752
- 1966 Zwicky, F.: 1966, Astrophys. J. 143, 192
Chapter 4 Star Formation in Circumnuclear Regions: On the derivation of dynamical masses of the stellar clusters
4.1 Introduction
The inner (1 Kpc) parts of some spiral galaxies show high star formation rates and this star formation is frequently arranged in a ring or pseudo-ring pattern around their nuclei. This fact seems to correlate with the presence of bars [1979ApJ...233...67R, 1995A&A...301..649F, 1999ApJ...525..691S, 2005ApJ...632..217S, 2005ApJ...630..837J] and, in fact, computer models which simulate the behaviour of gas in galactic potentials have shown that nuclear rings may appear as a consequence of matter infall owing to resonances present at the bar edges [1985A&A...150..327C, 1992MNRAS.259..328A].
These CNSFRs, with sizes going from a few tens to a few hundreds of parsecs (e.g. [2000MNRAS.311..120D]) seem to be made of several Hii regions ionized by luminous compact stellar clusters whose sizes, as measured from high spatial resolution Hubble Space Telescope (HST) images, are seen to be of only a few parsecs. Their masses, as derived with the use of population synthesis models in circumnuclear regions of different galaxies, suggest that these clusters are gravitationally bound and that they might evolve into globular cluster configurations [1996AJ....111.2248M]. The luminosities of CNSFRs are rather large with absolute visual magnitudes (M) between -12 and -17 and H luminosities between 2 10 and 7 10 erg s . These values are comparable to those shown by 30 Dor, the largest Hii region in the Large Magellanic Cloud (LMC), and overlap with those shown by Hii galaxies (Melnick et al., 1988; Díaz et al., 2000a; Hoyos and Díaz, 2006, and references therein).
Although these Hii regions are very luminous not much is known about their kinematics or dynamics for both the ionized gas and the stars. It could be said that the worst known parameter of these ionizing clusters is their mass. There are different methods to estimate the mass of a stellar cluster. Classically one assumes that the system is virialized and determines the total mass inside a radius by applying the virial theorem to the observed velocity dispersion of the stars (). The stellar velocity dispersion is however hard to measure in young stellar clusters (a few million-years old) due to the shortage of prominent stellar absorption lines. The optical continuum between 3500 and 7000 Å shows very few lines since the light at these wavelengths is dominated by OB stars which have weak absorption lines at the same wavelengths of the nebular emission lines (Balmer H and Hei lines). As pointed out by several authors (e.g. Ho and Filippenko 1996a), at longer wavelengths ( 8500 Å) the contamination due to nebular lines is much smaller and since red supergiant stars, if present, dominate the near-infrared (IR) light where the Caii 8498, 8542, 8662 Å triplet (CaT) lines are found, these should be easily observable allowing the determination of [1990MNRAS.242P..48T, 1994A&A...288..396P]. We have previously detected the CaT lines in CNSFRs but at a spectral resolution that was below that required to measure accurately their velocity dispersions (e.g. Terlevich et al., 1990).
These CNSFRs are also expected to be amongst the highest metallicity regions as corresponds to their position near the galactic center. These facts taken together make the analysis of these regions complicated since, in general, their low excitation makes any temperature sensitive line too weak to be measured, particularly against a strong underlying stellar continuum. In fact, in most cases, the [Oiii] 5007 Å line, which is typically one hundred times more intense than the auroral [Oiii] 4363 Å one, can be barely seen.
To analyze and derive the dynamical properties of the stars and gas in these type of regions we use high resolution spectra with two very narrow spectral ranges of the central zone of three early type barred spiral galaxies: NGC 2903, NGC 3310 and NGC 3351. In Section §4.2 we present the properties of the observed galaxies, and in the next one the details of the observations and the data reduction. §4.4 presents the results concerning the kinematics of gas and stars and the emission line ratios in each of the observed regions. In sections §4.5 and §4.6 we present the techniques used in the determination of their dynamical masses and in the derivation of the ionizing star cluster properties, respectively. Section 4.7 is devoted to the discussion of these results, and the summary and conclusions of this part of the work are presented in Section §4.8.
4.2 Properties of the observed galaxies
In this Chapter we present high-resolution far-red spectra (0.39 Å px 13.66 km s px at central wavelength, =8563 Å) and stellar velocity dispersion measurements () along the line of sight for several CNSFRs and the nuclei of the spiral galaxies NGC 2903, NGC 3310 and NGC 3351. We have also measured the ionized gas velocity dispersions () from high-resolution blue spectra (0.21 Å px 12.63 km s px at = 4989 Å) using Balmer H and [Oiii] emission lines. The comparison between and might throw some light on the yet unsolved issue about the validity of the gravitational hypothesis for the origin of the supersonic motions observed in the ionized gas in Giant Hii regions [1999MNRAS.302..677M].
NGC 2903 (UGC 5079; see Figure 4.1) is a well studied galaxy. The Paschen image obtained with the Hubble Space Telescope (HST) reveals the presence of a nuclear ring-like morphology with an apparent diameter of approximately 15 = 625 pc [2001MNRAS.322..757A]. This structure is also seen, though less prominent, in the H observations from Planesas et al. [1997A&A...325...81P]. A large number of stellar clusters are identified on high resolution infrared images in the K’ and H bands, which do not coincide spatially with the bright Hii regions. A possible interpretation of this is that the stellar clusters are the result of the evolution of giant Hii regions (e.g. [2001MNRAS.322..757A]). The global star formation rates in the nuclear ring, as derived from its H luminosity is found to be 0.1 M yr by [1997A&A...325...81P] and 0.7 M yr by [2001MNRAS.322..757A]. From CO emission observations, Planesas et al. derive a mass of molecular gas (H) of 1.8 10 M inside a circle 1 Kpc in diameter.
NGC 3310 (UGC 5786, Arp217; see Figure 4.2) is a starburst galaxy classified as a SAB(r)bc by [1991trcb.book.....D], with an inclination of the galactic disc of about i 40 [2000MNRAS.312....2S]. This is a good example of an overall low metallicity galaxy, with a high rate of star formation and very blue colours. This galaxy has a ring of star forming regions whose diameter ranges from 8 to 12 and shows two tightly wound spiral arms [2002AJ....123.1381E, 1976A&A....48..373V] filled with giant Hii regions. The ages indicated by the colours and magnitudes of the star formation regions are lower than 10 Myr [2002AJ....123.1381E]. From near-IR J and K photometry these authors derived an average age of 10 yr for the large scale “hot-spots” (star forming complexes). From the observed CaT line in the Jumbo Hii region [1990MNRAS.242P..48T] derived an age around 5 to 6 Myr. [2002AJ....123.1381E], comparing their data with Starburst99 models [1999ApJS..123....3L], estimated masses of the large “hot-spots” ranging from 10 to several times 10 M. They found 17 candidate super star clusters (SSCs) with absolute magnitudes between M = -11 to -15 mag, and with colours similar to those measured for SSCs in other galaxies (see for example [1995AJ....110.2665M, 1995AJ....110.1009B, 1996AJ....111.2248M, 1997AJ....114.2381M, 1998AJ....115.1778C, 2001AJ....121.3048M, 2001AJ....121..182E, 2001AJ....122..815O, 2001ApJ...556..801L, 2002ApJ...579..545C, 2003ApJ...596..240M, 2007ApJ...663..844M, 2008MNRAS.385..468P]).
NGC 3351 (M95, UGC 5850; see Figure 4.3) is another well known “hot-spot” galaxy [1967PASP...79..152S]. Early detailed studies of its nuclear regions [1982A&AS...50..491A] concluded that NGC 3351 harbours high-mass circumnuclear star formation. In fact, the star formation rate per unit area in the nuclear region is significantly increased over that observed in the disc [1992AJ....103..784D]. Elmegreen at al. [1997AJ....114.1850E] from near infrared photometry in the J and K bands derive a circumnuclear star formation rate of 0.38 M yr. Planesas et al. [1997A&A...325...81P], from the H emission, derive a total star formation rate for the circumnuclear region of 0.24 M yr and a mass of molecular gas of 3.5 10 M inside a circle of 1.4 Kpc in diameter, from CO emission observations.
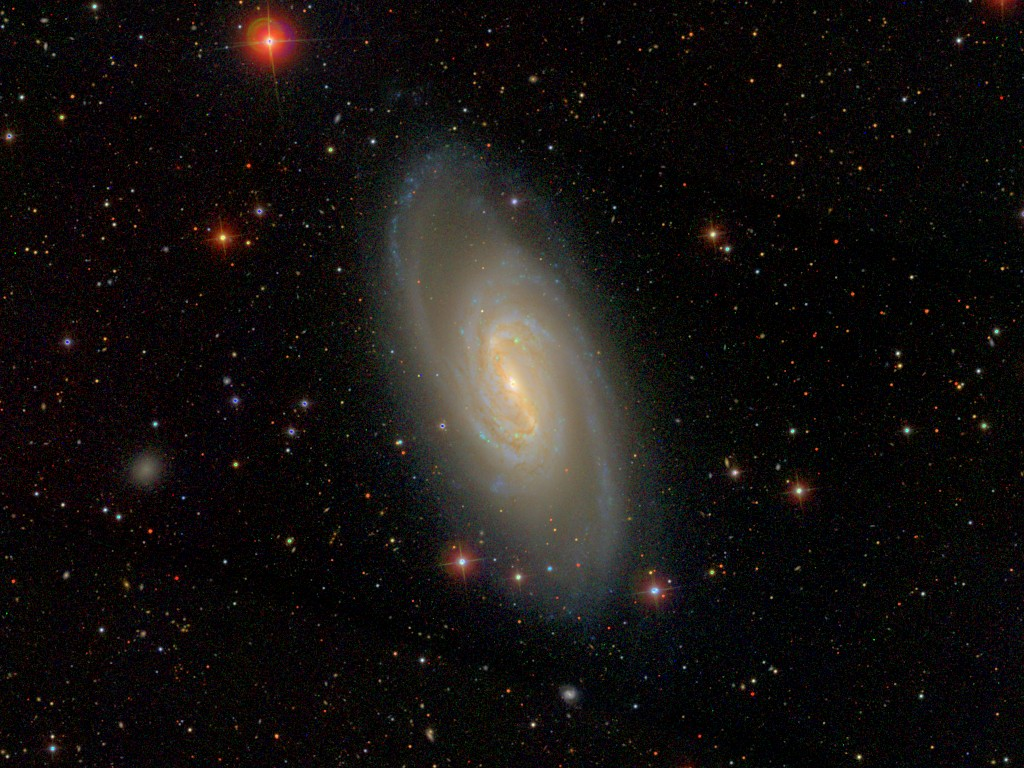
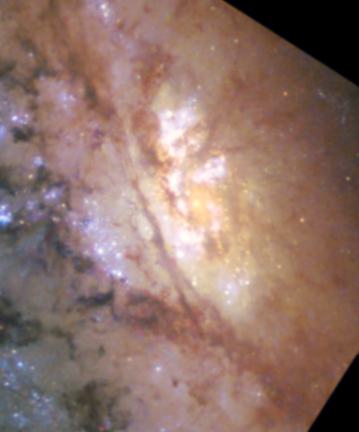
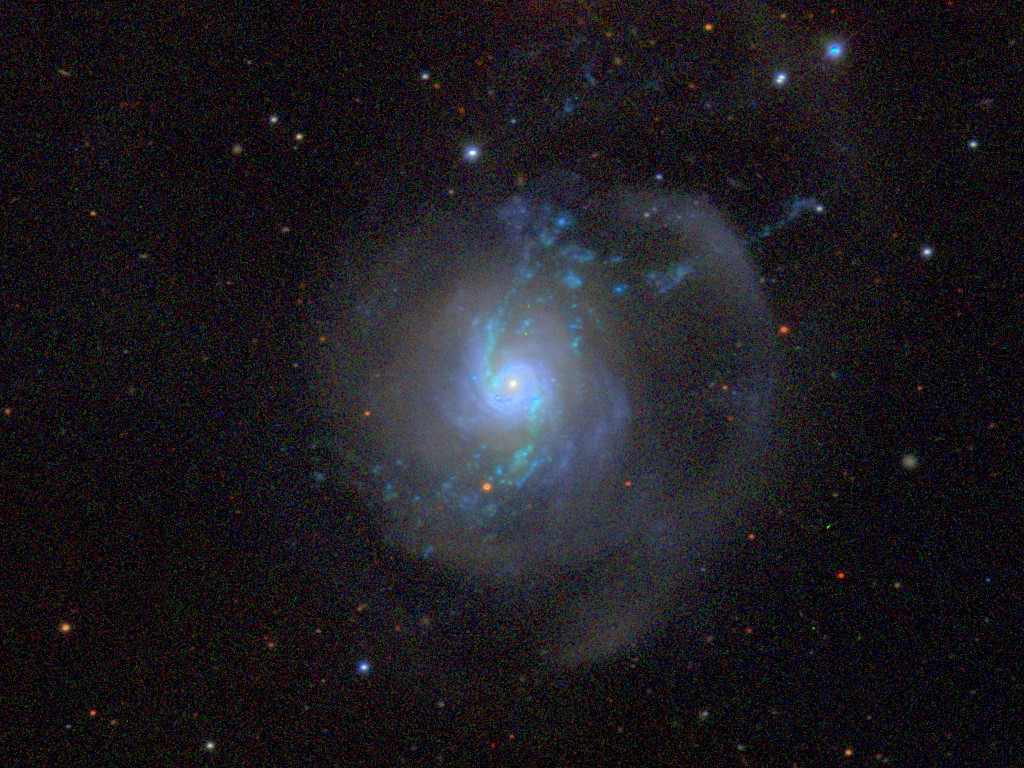
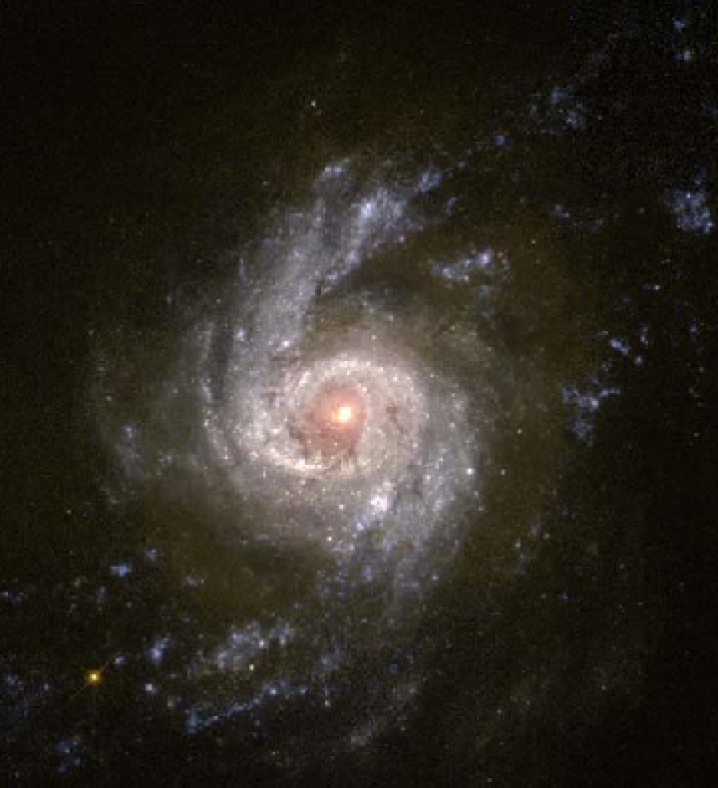
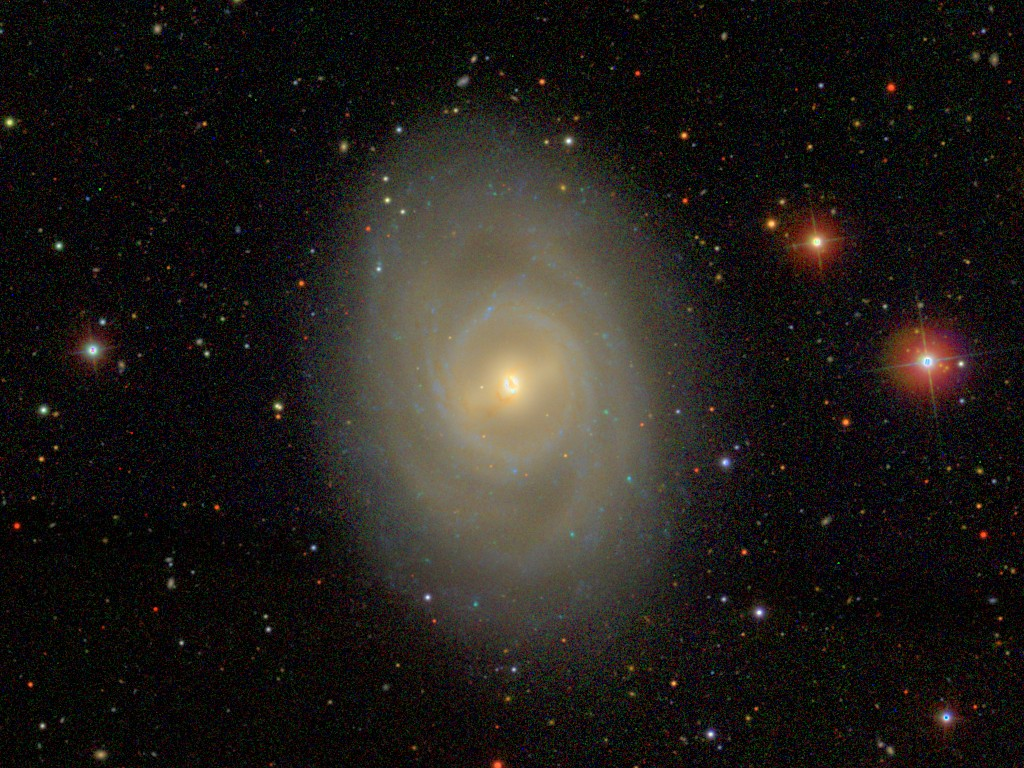
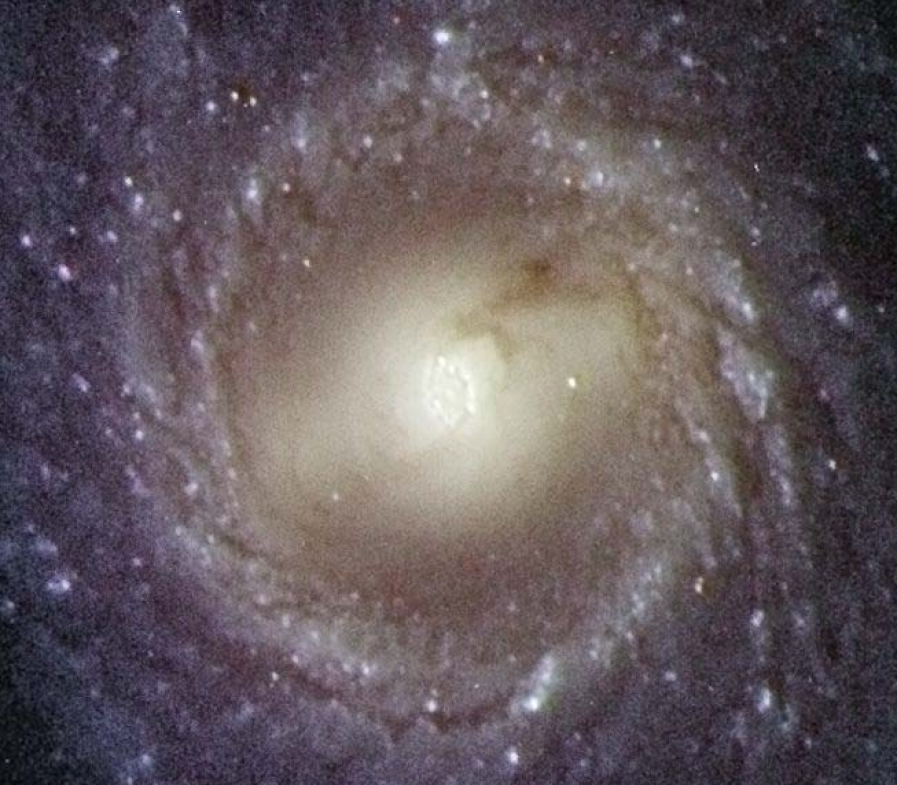
The main properties of these galaxies are given in Table 4.1.
| Property | NGC 2903 | NGC 3310 | NGC 3351 |
|---|---|---|---|
| R. A. (2000) | 09 32 10.1 | 10 38 45.9 | 10 43 57.7 |
| Dec (2000) | +21 30 03 | +53 30 12 | +11 42 14 |
| Morph. Type | SBbc | SABbc | SBb |
| Distance (Mpc) | 8.6 | 15 | 10 |
| pc/ | 42 | 73 | 49 |
| B (mag) | 9.7 | 11.2 | 10.1 |
| E(B-V)(mag) | 0.031 | 0.030 | 0.028 |
| [1991trcb.book.....D] | |||
| [1984AAS...56..381B] | |||
| Graham et al. (1997) | |||
4.3 Observations and data reduction
4.3.1 Observations
High resolution blue and far-red spectra were acquired as part of an observing run in 2000. They were obtained simultaneously using the blue and red arms of the Intermediate dispersion Spectrograph and Imaging System (ISIS) on the 4.2-m William Herschel Telescope (WHT) of the Isaac Newton Group (ING) at the Roque de los Muchachos Observatory on the Spanish island of La Palma. The H2400B and R1200R gratings were used to cover the wavelength ranges from 4779 to 5199 Å ( = 4989 Å) in the blue and from 8363 to 8763 Å ( = 8563 Å) in the red with spectral dispersions of 0.21 and 0.39 Å per pixel, equivalent to a spectral resolution (R = / ) of 23800 and 22000, respectively, and providing a comparable velocity resolution of about 13 km s. The CCD detectors EEV12 and TEK4 were used for the blue and red arms with a factor of 2 binning in both the “x” and “y” directions in the blue with spatial resolutions of 0.38 and 0.36 arcsec px for the blue and red configurations respectively. A slit width of 1 arcsec was used which, combined with the spectral dispersions, yielded spectral resolutions of about 0.4 and 0.7 Å FWHM in the blue and the red, respectively, measured on the sky lines. The spectral ranges and grating resolutions [spectral dispersion in Å px and full width at half-maximum (FWHM) in Å] attained are given in Table 4.2 containing the journal of observations.
| Date | Spectral range | Disp. | R | Spatial res. | PA | Exposure Time |
| (Å) | (Å px) | ( px) | () | (sec) | ||
| NGC 2903 | ||||||
| 2000 February 4 | 4779-5199 | 0.21 | 12500 | 0.38 | 50 | 3 1200 |
| 2000 February 4 | 8363-8763 | 0.39 | 12200 | 0.36 | 50 | 3 1200 |
| 2000 February 5 | 4779-5199 | 0.21 | 12500 | 0.38 | 345 | 3 1200 |
| 2000 February 5 | 8363-8763 | 0.39 | 12200 | 0.36 | 345 | 3 1200 |
| NGC 3310 | ||||||
| 2000 February 4 | 4779-5199 | 0.21 | 12500 | 0.38 | 52 | 3 1200 |
| 2000 February 4 | 8363-8763 | 0.39 | 12200 | 0.36 | 52 | 3 1200 |
| 2000 February 5 | 4779-5199 | 0.21 | 12500 | 0.38 | 100 | 4 1200 |
| 2000 February 5 | 8363-8763 | 0.39 | 12200 | 0.36 | 100 | 4 1200 |
| NGC 3351 | ||||||
| 2000 February 4 | 4779-5199 | 0.21 | 12500 | 0.38 | 355 | 4 1200 |
| 2000 February 4 | 8363-8763 | 0.39 | 12200 | 0.36 | 355 | 4 1200 |
| 2000 February 5 | 4779-5199 | 0.21 | 12500 | 0.38 | 45 | 3 1200 |
| 2000 February 5 | 8363-8763 | 0.39 | 12200 | 0.36 | 45 | 3 1200 |
| 2000 February 5 | 4779-5199 | 0.21 | 12500 | 0.38 | 310 | 3 1200 |
| 2000 February 5 | 8363-8763 | 0.39 | 12200 | 0.36 | 310 | 3 1200 |
| R = / | ||||||
In the cases of NGC 2903 and NGC 3310 two different slit positions were chosen in each case to observe 4 and 8 CNSFRs, respectively, which we have labelled S1 and S2 for each galaxy. Besides, for NGC 3310 we observed the conspicuous Jumbo region, labelled J, which is the same as R19 of [2000MNRAS.311..120D] and region A of [1993MNRAS.260..177P]. The name of this region, Jumbo, comes from the fact that it is 10 times more luminous than 30 Dor [1984ApJ...284..557T]. For the third galaxy, NGC 3351, three different slit positions (S1, S2 and S3) were chosen to observe 5 CNSFRs. In all the cases one of the slits passes across the nucleus.
Several bias and sky flat field frames were taken at the beginning and the end of each night in both arms. In addition, two lamp flat field and one calibration lamp exposure per each telescope position were performed. The calibration lamp used was CuNe+CuAr.
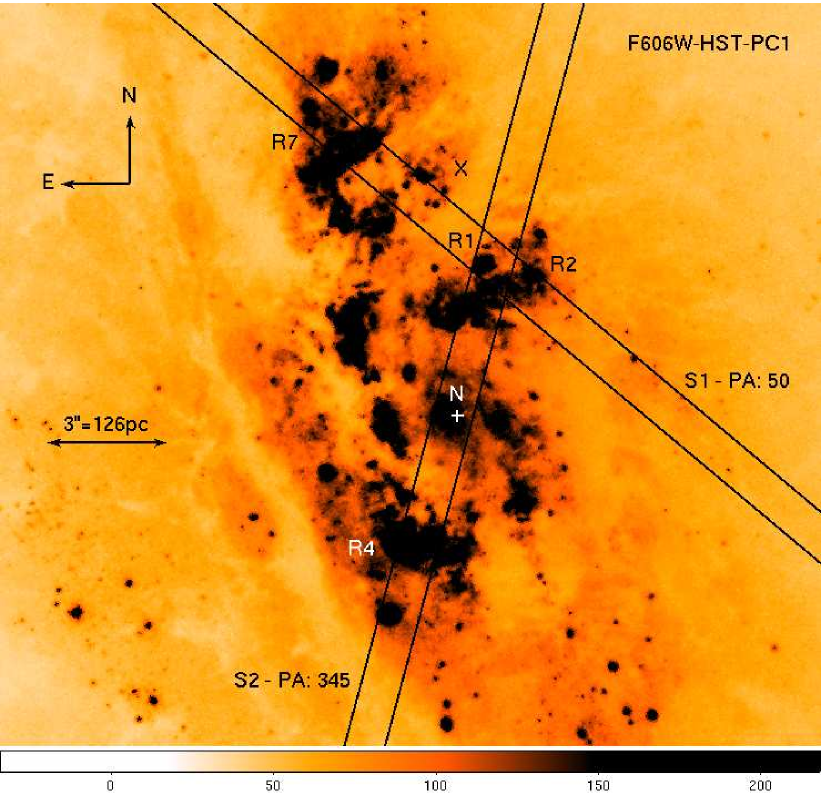
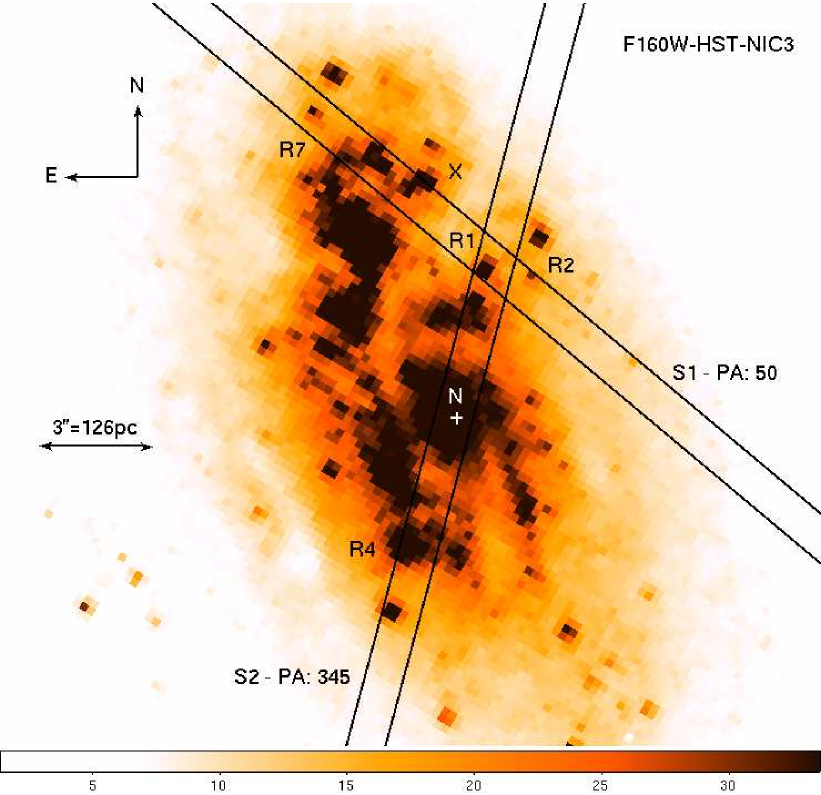
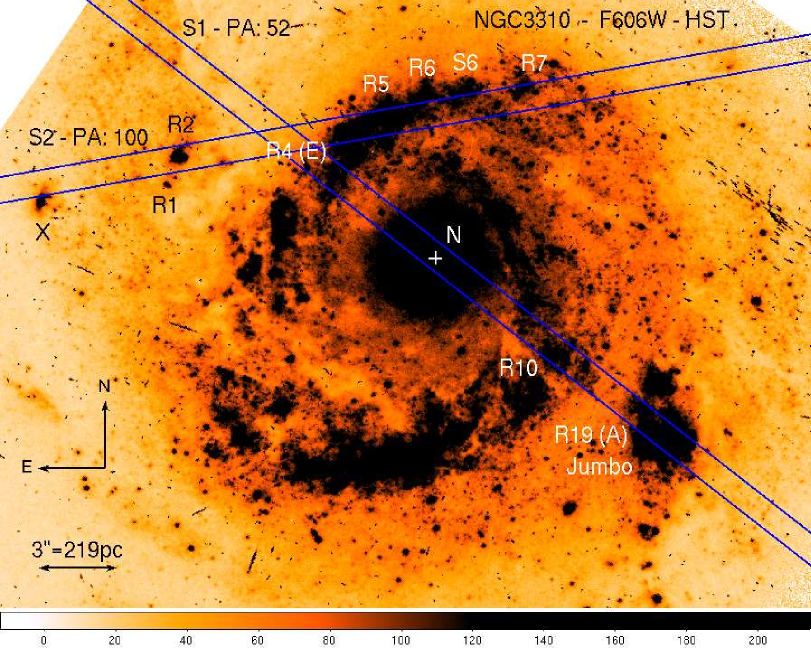
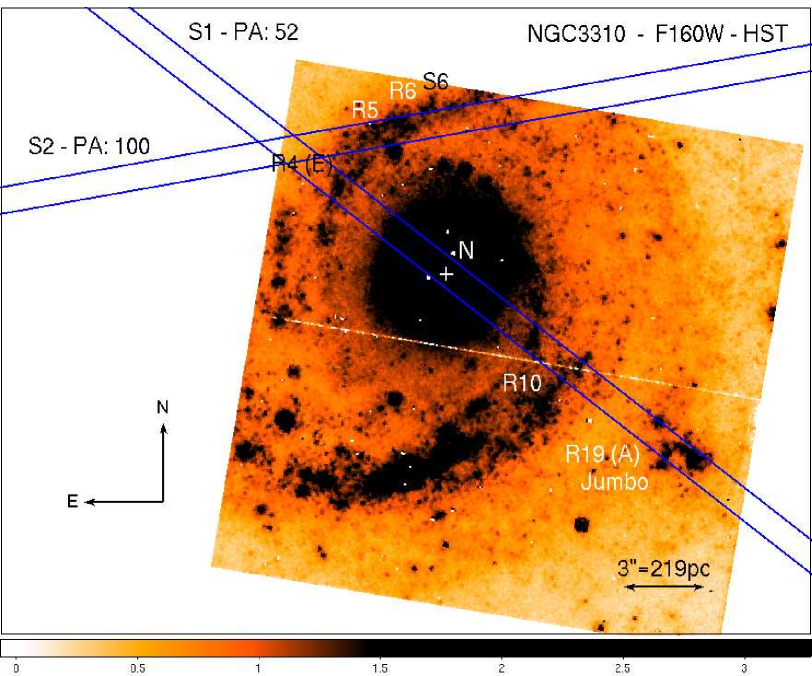
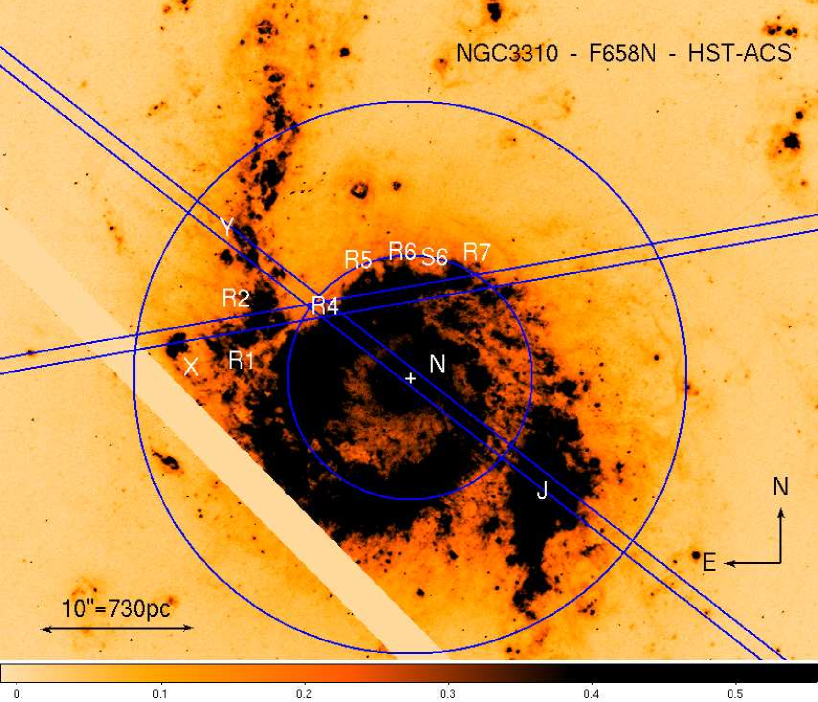
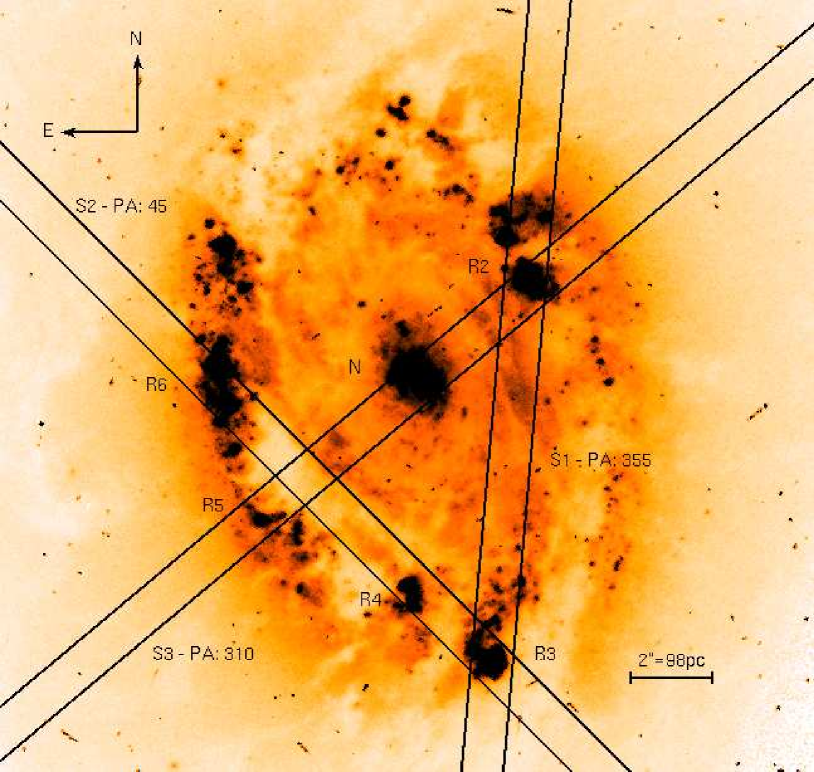
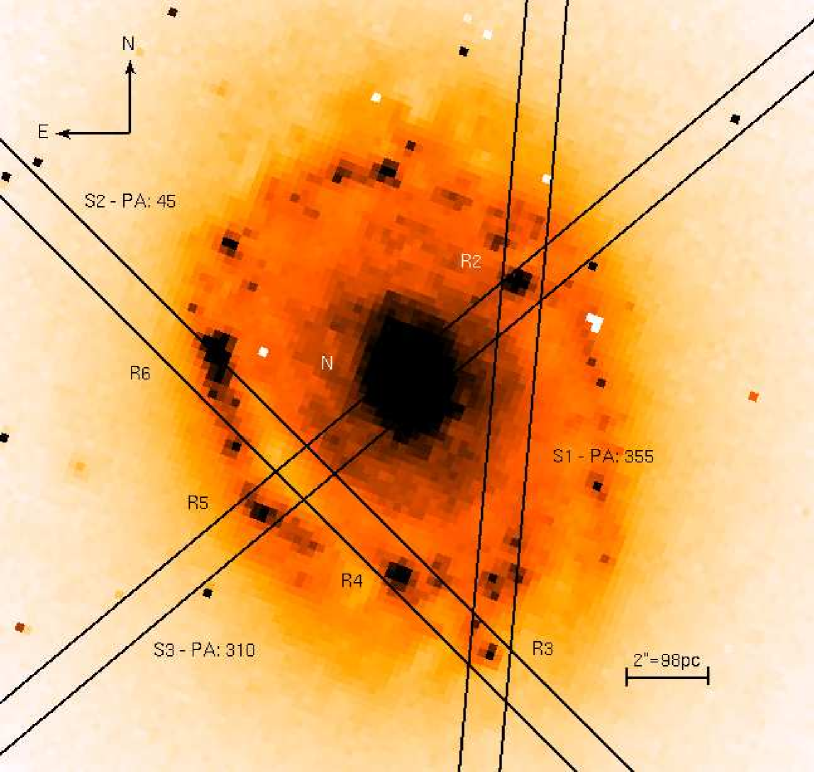
We have also downloaded two astrometrically and photometrically calibrated broad-band images of the central part of each observed galaxy from the Multimission Archive at Space Telescope111http://archive.stsci.edu/hst/wfpc2. The images were taken through the F606W (wide V) and the F160W (H) filters with the Wide Field and Planetary Camera 2 (WFPC2; PC1) and the Near-Infrared Camera and Multi-Object Spectrometer (NICMOS) 2 (NIC2; for NGC 3310) and 3 (NIC3; for NGC 2903 and NGC 3351), both cameras on-board the HST. They are displayed in Figures 4.4-4.7 and 4.9-4.10, with the slit positions overlaid and the CNSFRs and the nucleus labelled. In the case of NGC 3310 we also download the F658N narrow band image (equivalent to H filter at the NGC 3310 redshift) taken with the Advanced Camera for Surveys (ACS) of the HST (see Figure 4.8).
4.3.2 Data reduction
The data was processed and analyzed using IRAF222IRAF: the Image Reduction and Analysis Facility is distributed by the National Optical Astronomy Observatories, which is operated by the Association of Universities for Research in Astronomy, Inc. (AURA) under cooperative agreement with the National Science Foundation (NSF). routines in the usual manner. The procedure includes the removal of cosmic rays, bias subtraction, division by a normalized flat field and wavelength calibration. Wavelength fits were performed using 20-25 arc lines in the blue and 10-15 lines in the far-red by a polynomial of second to third order. These fits have been done at 50 and 60 locations along the slit in the blue and far-red, respectively, and they have yielded rms residuals between 0.1 and 0.2 px.
In the red, we also performed the wavelength calibration using sky lines following the work by [1996PASP..108..277O]. However, although more lines (20-25) were available for the calibration, the fits gave higher rms residuals, between 0.3 and 0.45 px since the low intensities of some of the lines did not allow a good Gaussian fit. We have therefore adopted the calibration made using only the arc lines.
Background subtraction was performed using the spectra at both ends of the slit. This background includes light from the disc and bulge of the galaxy. It was almost impossible to neatly subtract the background bright emission lines in the far-red spectra due to the non-uniform and extended nebular emission surrounding each cluster and the variation over time of the sky emission lines. It is worth noting that these spurious features do not affect the CaT absorption lines.
We have not corrected the spectra for atmospheric extinction or performed any flux calibration, since our purpose was to measure radial velocities and velocity dispersions.
In addition to the galaxy frames, observations of 11 template velocity stars were made (four during the first night and seven during the second) to provide good stellar reference frames in the same system as the galaxy spectra for the kinematic analysis in the far-red. They are late-type giant and supergiant stars which have strong CaT features (see [1989MNRAS.239..325D]). In Table 4.3 we list the spectral types and luminosity classes of the stars and the dates of observation.
| Star | ST - LC | date |
| HD71952 | K0 I | 04-02-2000 |
| HD129972 | G6 I | |
| HD134047 | G6 III | |
| HD144063 | G4 III | |
| HD16400 | G5 III | 05-02-2000 |
| HD22007 | G5 I | |
| HD22156 | G6 III | |
| HD92588 | K1 I | |
| HD102165 | F7 I | |
| HD115004 | G8 III | |
| HD116365 | K3 III |
4.4 Results
Figures 4.4-4.7 and 4.9-4.10 show the selected slits for each galaxy, superimposed on photometrically calibrated optical and infrared images of the circumnuclear region of these galaxies acquired with the Wide Field and Planetary Camera 2 (WFPC2; PC1) and the Near-Infrared Camera and Multi-Object Spectrometer (NICMOS) Camera 2 and 3 (NIC2 and NIC3) on board the HST. These images have been downloaded from the Multimission Archive at STScI (MAST)333http://archive.stsci.edu/hst/wfpc2. The optical image was obtained through the F606W (wide V) filter, and the near-IR one, through the F160W (H). For NGC 2903 and NGC 3351, the CNSFRs have been labelled following the same nomenclature as in [1997A&A...325...81P], and for NGC 3310 following [2000MNRAS.311..120D], with the nomenclature given by [1993MNRAS.260..177P] for the regions in common [E for R4 and A for R19 (the main knot of the Jumbo region)]. In both studies the regions observed are identified on the H maps. In Figures 4.4 and 4.5 the plus symbol represents the position of the nucleus as given by the Two Micron All Sky Survey Team, 2MASS Extended Objects - Final Release [2003AJ....125..525J]. In the case of NGC 3310, the position of the nucleus mark in Figures 4.6 and 4.7 is given by [1999PASP..111..438F].
Figures 2.5.1, 2.5.1 and 2.5.1 show the spatial profiles in the H and [Oiii] 5007 Å emission lines (upper and middle panels) and the far-red continuum (lower panel) along each slit position for each observed galaxy. For NGC 3310 (2.5.1) due to the presence of intense regions (J in the blue and the galaxy nucleus in the red range in the case of S1, and R5+R4 in the blue range for S2) the profile details are very difficult to appreciate, therefore we show some enlargements of these profiles in Figure 2.5.1. In all cases, the emission line profiles have been generated by collapsing 11 pixels of the spectra in the direction of the resolution at the central position of the lines in the rest frame, 4861 and 5007Å respectively, and are plotted as dashed lines. Continuum profiles were generated by collapsing 11 resolution pixels centred at 11 Å to the blue of each emission line and are plotted as dash-dotted lines. The difference between the two, shown by a solid line, corresponds to the pure emission. The far-red continuum has been generated by collapsing 11 pixels centered at 8620Å.
![[Uncaptioned image]](/html/0908.4285/assets/chapter4/perfil-s1-b-Hb+X.png)
![[Uncaptioned image]](/html/0908.4285/assets/chapter4/perfil-s1-b-OIII+X.png)
![[Uncaptioned image]](/html/0908.4285/assets/chapter4/perfil-2903-s2-b-OIII.png)
![[Uncaptioned image]](/html/0908.4285/assets/chapter4/perfil-s1-r-cont+X.png)
![[Uncaptioned image]](/html/0908.4285/assets/chapter4/perfil-2903-s2-r-cont.png)
![[Uncaptioned image]](/html/0908.4285/assets/chapter4/perfil-3310-s1-b-Hb.png)
![[Uncaptioned image]](/html/0908.4285/assets/chapter4/perfil-3310-s1-b-OIII.png)
![[Uncaptioned image]](/html/0908.4285/assets/chapter4/perfil-3310-s2-b-OIII.png)
![[Uncaptioned image]](/html/0908.4285/assets/chapter4/perfil-3310-s1-r-cont.png)
![[Uncaptioned image]](/html/0908.4285/assets/chapter4/perfil-3310-s2-r-cont.png)
![[Uncaptioned image]](/html/0908.4285/assets/chapter4/perfil-3310-s1-b-Hb-zoom.png)
![[Uncaptioned image]](/html/0908.4285/assets/chapter4/perfil-3310-s1-b-OIII-zoom.png)
![[Uncaptioned image]](/html/0908.4285/assets/chapter4/perfil-3310-s2-b-OIII-zoom.png)
![[Uncaptioned image]](/html/0908.4285/assets/chapter4/perfil-3310-s1-r-cont-zoom.png)
![[Uncaptioned image]](/html/0908.4285/assets/chapter4/perfil-3351-s1-b-Hb.png)
![[Uncaptioned image]](/html/0908.4285/assets/chapter4/perfil-3351-s1-b-OIII.png)
![[Uncaptioned image]](/html/0908.4285/assets/chapter4/perfil-3351-s2-b-OIII.png)
![[Uncaptioned image]](/html/0908.4285/assets/chapter4/perfil-3351-s1-r-cont.png)
![[Uncaptioned image]](/html/0908.4285/assets/chapter4/perfil-3351-s2-r-cont.png)
![[Uncaptioned image]](/html/0908.4285/assets/chapter4/perfil-3351-s3-b-OIII.png)
![[Uncaptioned image]](/html/0908.4285/assets/chapter4/perfil-3351-s3-r-cont.png)
The regions of the frames to be extracted into one-dimensional spectra corresponding to each of the identified CNSFRs, were selected on the continuum emission profiles both in the blue and in the red. These regions are marked by horizontal lines and labelled in the corresponding Figures. In the H profile of slit position S1 of NGC 2903, an almost pure emission knot between regions R1+R2 and R7 can be seen with a very weak continuum. We labelled this region as X. In the case of the [Oiii] 5007 Å emission line profile, the main contributor comes from the continuum since the actual emission line is very weak as expected for high metallicity Hii regions ([2007MNRAS.382..251D], see Chapter §5). For NGC 3310, we find another two pure emission knots, one for each slit position, labelled Y and X by us (see Figure 4.8), respectively. The former of these regions seems to be located at the tip of one vertical arm formed by pure emission regions, since it can be easily appreciable in the H image from the ACS but it is almost invisible in the WFPC2-PC1 V-band image (see Figures 4.6 and 4.8).
Spectra in slit position S1 of NGC 2903 and S2 of NGC 3310 are placed along the circumnuclear regions located to the North and North-East of the nuclei, and therefore any contribution from the underlying galaxy bulge is difficult to assess. This is also the case for slit positions S1 and S2 of NGC 3351. Slit position S2 of NGC 2903, S1 of NGC 3310 and S3 of NGC 3351 cross the galactic nuclei. This can be used to estimate the underlying bulge contribution. For the blue spectra the light from the underlying bulge is almost negligible amounting to, at most, 5 per cent at the H line for NGC 2903 and NGC 3351, and 10 per cent for NGC 3310. For the red spectra, the bulge contribution is more important. From Gaussian fits to the 8620 Å continuum profile of S2 in NGC 2903 we find that it amounts to about 15 per cent for the lowest surface brightness region, R1+R2. In the case of S1 in NGC 3310, the contribution of the underlying bulge is even more important, reaching 25 per cent for R4, the weakest region, and the one closest to the nucleus. From the red profile of slit position S3 of NGC 3351 we find that this contribution amounts to about 20 per cent for the lowest surface brightness region, R5.
On the other hand, the analysis of the broad near-IR HST-NICMOS images shown in Figures 4.5, 4.7 and 4.10 shows less contrast between the emission from the regions and the underlying bulge which is very close to the image background emission. In the case of NGC 2903, its contribution is about 25 per cent for the weak regions, R2 and R7 along position slit S1. We find a very similar behaviour for the central zone of NGC 3310, that is in very good agreement with the cluster identification made by [2002AJ....123.1381E] using the equivalent J and K-band HST-NICMOS images and the ground-based data from KPNO (J and K-bands). For NGC 3351, similar values to those derived from the profiles are found from inspection of the HST-NICMOS image.
![[Uncaptioned image]](/html/0908.4285/assets/chapter4/1dn_R1-2903-s1-b-rest.png)
![[Uncaptioned image]](/html/0908.4285/assets/chapter4/1dn_R2-2903-s2-b-rest.png)
![[Uncaptioned image]](/html/0908.4285/assets/chapter4/1dn_R2-2903-s2-r-rest.png)
![[Uncaptioned image]](/html/0908.4285/assets/chapter4/1dn_R4-2903-s2-b-rest.png)
![[Uncaptioned image]](/html/0908.4285/assets/chapter4/1dn_R4-2903-s2-r-rest.png)
![[Uncaptioned image]](/html/0908.4285/assets/chapter4/1dn_R7-2903-s1-b-rest.png)
![[Uncaptioned image]](/html/0908.4285/assets/chapter4/1dn_R7-2903-s1-r-rest.png)
![[Uncaptioned image]](/html/0908.4285/assets/chapter4/1dn_2-3310-s2-b-z.png)
![[Uncaptioned image]](/html/0908.4285/assets/chapter4/1dn_4-3310-s1-b-z.png)
![[Uncaptioned image]](/html/0908.4285/assets/chapter4/1dn_4-3310-s1-r-z.png)
![[Uncaptioned image]](/html/0908.4285/assets/chapter4/1dn_4-3310-s2-b-z.png)
![[Uncaptioned image]](/html/0908.4285/assets/chapter4/1dn_4-3310-s2-r-z.png)
![[Uncaptioned image]](/html/0908.4285/assets/chapter4/1dn_6-3310-s2-b-z.png)
![[Uncaptioned image]](/html/0908.4285/assets/chapter4/1dn_6-3310-s2-r-z.png)
![[Uncaptioned image]](/html/0908.4285/assets/chapter4/1dn_s6-3310-s2-b-z.png)
![[Uncaptioned image]](/html/0908.4285/assets/chapter4/1dn_7-3310-s2-b-z.png)
![[Uncaptioned image]](/html/0908.4285/assets/chapter4/1dn_7-3310-s2-r-z.png)
![[Uncaptioned image]](/html/0908.4285/assets/chapter4/1dn_10-3310-s1-b-z.png)
![[Uncaptioned image]](/html/0908.4285/assets/chapter4/1dn_10-3310-s1-r-z.png)
![[Uncaptioned image]](/html/0908.4285/assets/chapter4/1dn_R2-3351-s1-b-rest.png)
![[Uncaptioned image]](/html/0908.4285/assets/chapter4/1dn_R2-3351-s3-b-rest.png)
![[Uncaptioned image]](/html/0908.4285/assets/chapter4/1dn_R2-3351-s3-r-rest.png)
![[Uncaptioned image]](/html/0908.4285/assets/chapter4/1dn_R3-3351-s1-b-rest.png)
![[Uncaptioned image]](/html/0908.4285/assets/chapter4/1dn_R3-3351-s1-r-rest.png)
![[Uncaptioned image]](/html/0908.4285/assets/chapter4/1dn_R3-3351-s2-b-rest.png)
![[Uncaptioned image]](/html/0908.4285/assets/chapter4/1dn_R3-3351-s2-r-rest.png)
![[Uncaptioned image]](/html/0908.4285/assets/chapter4/1dn_R4-3351-s2-b-rest.png)
![[Uncaptioned image]](/html/0908.4285/assets/chapter4/1dn_R5-3351-s3-b-rest.png)
![[Uncaptioned image]](/html/0908.4285/assets/chapter4/1dn_R5-3351-s3-r-rest.png)
![[Uncaptioned image]](/html/0908.4285/assets/chapter4/1dn_R6-3351-s2-b-rest.png)
![[Uncaptioned image]](/html/0908.4285/assets/chapter4/1dn_R6-3351-s2-r-rest.png)
![[Uncaptioned image]](/html/0908.4285/assets/chapter4/1dn_N-2903-s2-b-rest.png)
![[Uncaptioned image]](/html/0908.4285/assets/chapter4/1dn_N-3310-s1-b-z.png)
![[Uncaptioned image]](/html/0908.4285/assets/chapter4/1dn_N-3310-s1-r-z.png)
![[Uncaptioned image]](/html/0908.4285/assets/chapter4/1dn_N-3351-s3-b-rest.png)
![[Uncaptioned image]](/html/0908.4285/assets/chapter4/1dn_N-3351-s3-r-rest.png)
![[Uncaptioned image]](/html/0908.4285/assets/chapter4/1dn_R1-2903-s1-b-rest-enlarg.png)
![[Uncaptioned image]](/html/0908.4285/assets/chapter4/1dn_R3-3351-s1-b-rest-enlarg.png)
![[Uncaptioned image]](/html/0908.4285/assets/chapter4/1dn_R6-3351-s2-b-rest-enlarg.png)
Figures 2.5.1, 2.5.1 and 2.5.1 show the spectra of the observed circumnuclear regions of NGC 2903, NGC 3310 and NGC 3351, respectively, split into two panels corresponding to the blue and the red spectral ranges. The spectra of the nuclei of these galaxies are shown in Figure 2.5.1. The blue spectra show the Balmer H recombination line and the collisionally excited [Oiii] lines at 4959, 5007 Å. For NGC 2903 and NGC 3351 we can appreciate that these forbidden lines are very weak (see Figure 2.5.1), and, in some cases, only the strongest 5007 Å is detected (right-hand panel of this figure). However, in the case of NGC 3310 they are very strong, due to the low abundance of the CNSFRs located in this galaxy, with values between 0.2-0.4 Z ([1993MNRAS.260..177P]; see Chapter §5). These low values of the abundances of these CNSFRs can be explained by the probably unusual interaction history of the galaxy [2002AJ....123.1381E, 2001A&A...376...59K, 1996A&A...309..403M, 1996ApJ...473L..21S, 1981A&A....96..271B], fuelling the ring with accreted neutral gas, as modeled by [1992MNRAS.259..345A] and [1995ApJ...449..508P]. The red spectra show the stellar Caii triplet lines in absorption (CaT) at 8498, 8542, 8662 Å. In some cases, for example R1+R2 of NGC 2903 or R3 in NGC 3351, these lines are contaminated by Paschen emission which occurs at wavelengths very close to those of the CaT lines. Other emission features, such as Oi 8446, [Clii] 8579, Pa 14 and [Feii] 8617 are also present. This is especially important in the case of NGC 3310. In Figure 2.5.1 we can easily appreciate, for example in R4+R5, the Paschen series from Pa13 to Pa22, as well as the previously mentioned lines of O, Cl and Fe. In all cases, a single Gaussian fit to the emission lines was performed and the lines were subsequently subtracted (see also [2004A&A...419L..43O]) after checking that the theoretically expected ratio between the Paschen lines was satisfied. The observed red spectra are plotted in the Figures with a dashed line. The solid line shows the subtracted spectra.
Figure 2.5.1 shows the spectra of the almost pure emission knot marked in the profiles of NGC 2903 and NGC 3310, and those of the Jumbo region. In all of these cases the blue range of the spectra presents very intense emission lines. In the case of region X in NGC 2903, in the red range we can appreciate a spectrum similar to those shown by the CNSFRs studied by Planesas et al. (1997). It could then correspond to another region with low continuum surface brightness, but with similar characteristics. For the regions of NGC 3310, the red spectral range presents a very weak and noisy continuum, and in the case of region X only noise is detected therefore no spectrum is shown in Figure 2.5.1. In the other two regions of this galaxy we can see a set of emission lines. The Jumbo region presents many strong lines, even He and Ni in emission. Due to the low signal-to-noise ratio of the continuum and the presence of the strong emission lines in these regions of NGC 3310, we could not obtain stellar spectra with enough signal in the CaT absorption feature to allow an accurate measurement of velocity dispersions. Regions X and Y seem to be pure emission knots.
![[Uncaptioned image]](/html/0908.4285/assets/chapter4/1dn_X-2903-s1-b-rest.png)
![[Uncaptioned image]](/html/0908.4285/assets/chapter4/1dn_J-3310-s1-b-z.png)
![[Uncaptioned image]](/html/0908.4285/assets/chapter4/1dn_J-3310-s1-r-z.png)
![[Uncaptioned image]](/html/0908.4285/assets/chapter4/1dn_X-3310-s2-b-z.png)
![[Uncaptioned image]](/html/0908.4285/assets/chapter4/1dn_Y-3310-s1-b-z.png)
![[Uncaptioned image]](/html/0908.4285/assets/chapter4/1dn_Y-3310-s1-r-z.png)
4.4.1 Kinematics of stars and ionized gas
Stellar analysis
Stellar radial velocities and velocity dispersions were obtained from the absorption CaT lines using the cross-correlation technique described in detail by [1979AJ.....84.1511T]. This method requires the comparison with a stellar template (which can be synthetic or observed) that represents the stellar population that best reproduces the conspicuous feature used to perform these measurements. An example of the red spectrum of a template star (HD116365) is shown in Figure 4.21 with the prominent features of CaT indicated. The line-of-sight velocity dispersions are calculated from the width of the primary peak of the cross-correlation function (CCF) after deconvolution of the instrumental profile. A filtering of high frequencies of the Fourier transform spectrum is usually included in this procedure to avoid noise contamination and a low frequency filtering is usually made to eliminate the residual continuum.

Minor changes/improvements with respect to the cross-correlation technique originally proposed by [1979AJ.....84.1511T] were introduced as described below. In order to apply this method, we have used XCSAO, an external package of IRAF within the RVSAO, which implements the cross-correlation method of Tonry and Davies and is a direct descendant of the system built by them [1998PASP..110..934K]. We used late-type giant and supergiant stars that have strong CaT absorption lines (Figure 4.21) as stellar velocity templates. We normalized the stellar spectra dividing by a fitted continuum and convolved each stellar spectrum template with a set of Gaussian functions of different simulating a wide range in velocity dispersions from 10 to 100 km s with a bin size of 5 km s. The obtained spectra are cross-correlated with the original template obtaining a relation between the width of the main peak of the cross-correlation and of the input Gaussian. This relation constitutes a correction curve for each template that is applied as described below to obtain the stellar velocity dispersion for each CNSFR as described in [1995ApJS...99...67N]. This procedure will allow us to correct for the known possible mismatches between template stars and the region composite spectrum. In Figure 4.22 we show an example of these correction curves, in particular for HD 144063, together with a linear fit to it.
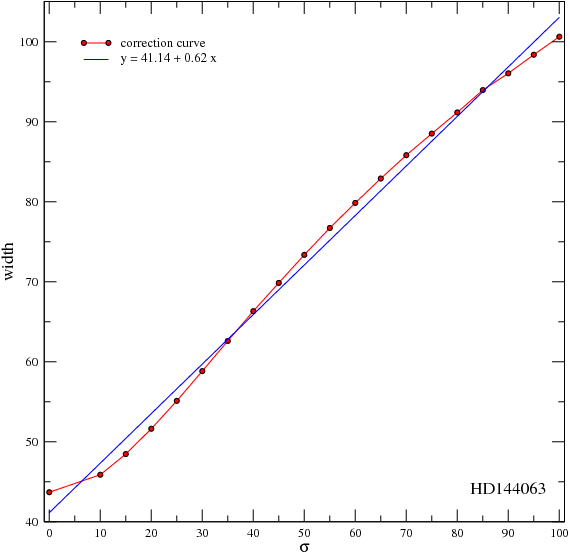
To determine the line-of-sight stellar velocity and velocity dispersion along each slit, extractions were made every two pixels for slit position S1 of each galaxy and every three pixels for slit position S2 of each galaxy and S3 of NGC 3351, with one pixel overlap between consecutive extractions in this latter case. In this way the S/N ratio and the spatial resolution were optimized.
The stellar velocity dispersion was estimated at the position of each CNSFR and the nuclei using apertures of five pixels in all cases, which correspond to 1.0 1.8 arcsec. A set of 11 templates of different spectral types and luminosity classes were used following [1995ApJS...99...67N] with the variation introduced by [1997A&A...323..749P] of using the individual stellar templates instead of an average. To measure the velocity dispersion in a galactic spectrum we have convolved it with each stellar template, correcting the width of the main peak of the CCF (see Figure 4.23) with the corresponding correction curve. Although the linear fits to the curves are very good approximations (see Figure 4.22), we used a linear interpolation between the two nearest values to estimate the corrected width. The of the stars () is the average of the values found for each stellar template and its error is given by the dispersion of the individual values of and the rms of the residuals of the wavelength fit. This procedure allows a more accurate estimate of [1997A&A...323..749P]. The radial velocities are the average of the radial velocities determined directly from the position of the main peak of the cross-correlation of each galaxy spectrum with each template in the rest frame.
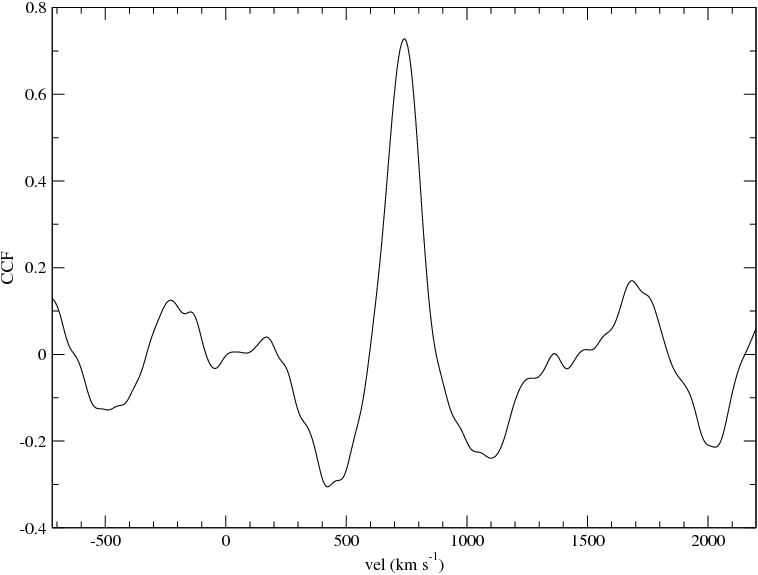
The stellar velocity dispersions are listed in column 3 of Table 4.4 along with their corresponding errors. For region X of NGC 2903 we estimated a stellar velocity dispersion, but in the cases of X, Y and the Jumbo region of NGC 3310 it could not be done due to the low signal-to-noise ratio of the continua and the CaT absorption features. For region R1+R2 of NGC 3310, we have a similar situation, the red continuum and the CaT features after the emission line subtractions has a low signal-to-noise ratio, although enough to try to give an estimate of the stellar velocity dispersion.
| 1 component | 2 components | ||||||||
| narrow | broad | ||||||||
| Region | Slit | (H) | ([Oiii]) | (H) | ([Oiii]) | (H) | ([Oiii]) | v | |
| NGC 2903 | |||||||||
| R1+R2 | S1 | 603 | 342 | 738 | 232 | 268 | 513 | 939 | 30 |
| R1+R2 | S2 | 643 | 352 | 719 | 272 | 277 | 534 | 9510 | 35 |
| R4 | S2 | 443 | 322 | 7610 | 202 | 359 | 474 | 898 | -10 |
| R7 | S1 | 373 | 324 | 5910 | 295 | 175 | 348 | 678 | 35 |
| N | S2 | 653 | 593 | 597 | 474 | 277 | 9913 | 8312 | 20 |
| X | S1 | 383 | 322 | 667 | 222 | 295 | 544 | 758 | 15 |
| NGC 3310 | |||||||||
| R1+R2 | S2 | 80: | 334 | 314 | 245 | 225 | 547 | 504 | -10 |
| R4 | S1 | 363 | 343 | 323 | 284 | 263 | 555 | 524 | 10 |
| R4+R5 | S2 | 383 | 274 | 223 | 224 | 183 | 465 | 402 | 15 |
| R6 | S2 | 355 | 303 | 283 | 233 | 213 | 547 | 563 | 0 |
| S6 | S2 | 314 | 273 | 263 | 203 | 193 | 474 | 473 | 10 |
| R7 | S2 | 445 | 215 | 174 | 184 | 143 | 414 | 363 | 0 |
| R10 | S1 | 393 | 383 | 403 | 262 | 263 | 542 | 594 | -20 |
| N | S1 | 733 | 553 | 663 | 353 | 353 | 733 | 834 | 20 |
| J | S1 | — | 342 | 302 | 252 | 222 | 613 | 573 | -25 |
| X | S2 | — | 224 | 183 | 184 | 143 | 405 | 303 | -5 |
| Y | S1 | — | 283 | 283 | 224 | 253 | 444 | 615 | 10 |
| NGC 3351 | |||||||||
| R2 | S1 | 501 | 261 | 727 | 173 | 214 | 453 | 745 | 0 |
| R2 | S3 | 516 | 293 | 699 | 162 | 235 | 432 | 768 | 0 |
| R3 | S1 | 555 | 351 | 677 | 253 | 284 | 594 | 714 | 0 |
| R3 | S2 | 597 | 395 | 707 | 243 | 246 | 593 | 749 | 0 |
| R4 | S2 | 664 | 374 | 768 | 293 | — | 654 | — | 0 |
| R5 | S3 | 474 | 342 | 567 | 30 | — | 76 | — | 0 |
| R6 | S2 | 396 | 296 | 467 | 163 | — | 464 | — | 0 |
| N | S3 | 671 | 533 | 736 | 415 | — | 677 | — | 0 |
| velocity dispersions in km s | |||||||||
Ionized gas analysis
The wavelength and the width of the H and [Oiii] 5007 Å emission lines were measured to determine both the radial velocities and the velocity dispersions of the ionized gas.
The velocity dispersion of the gas was estimated at the position of each CNSFR and the nuclei using five-pixel apertures, corresponding to 1.0 1.8 arcsec. Following [2000MNRAS.317..907J] we adjusted three different suitable continua chosen by visual inspection and fitted a single Gaussian to the whole line. Positions and widths of the emission lines are the average of the corresponding measurements and their errors are calculated as the dispersion of these measurements taking into account the rms of the residuals of the wavelength calibration. Thus, the error is associated with the continuum placement.
The velocity dispersions of the gas are calculated as
where and are the measured and instrumental dispersions respectively. was measured directly from the sky emission lines and is about 10.5 km s at 4861 Å.
Unexpectedly, the Gaussian fit just described revealed the presence of more than one component in the H lines. The optimal fit was found for two different components for all the regions. We used the widths of those components as an initial approximation to fit the [Oiii] lines which, due to their intrinsic weakness, show lower S/N ratio, and found them to provide also an optimal fit. In the case of the regions of NGC 3351, the radial velocities found for the narrow and broad components of both H and [Oiii], are the same within the errors. For this galaxy, we can make the multi Gaussian fit for the [Oiii] for regions R2 and R3 in the four analyzed spectra corresponding to two different slit positions. For the rest of the regions of NGC 3351 the two-component fit did not show any improvement over the single component one, probably due to the low S/N ratio. For the other two galaxies, NGC 2903 and NGC 3310, we find a different behaviour. The two components show different radial velocities (see Figures 2.5.1 and 2.5.1). The velocity shifts found reach 35 km s for NGC 2903 and 25 km s for NGC 3310. In the case of NGC 3351, the radial velocities found using this method are the same, within the errors, as those found by fitting a single component. Examples of the fits for H and [Oiii] 5007 Å can be seen in Figures 2.5.1, 2.5.1 and 2.5.1 for NGC 2903, NGC 3310 and NGC 3351, respectively.
![[Uncaptioned image]](/html/0908.4285/assets/chapter4/ngauss-OIII-R1-2903.png)
![[Uncaptioned image]](/html/0908.4285/assets/chapter4/ngauss-OIII-R4+R5-3310.png)
![[Uncaptioned image]](/html/0908.4285/assets/chapter4/ngauss-OIII-R2-3351.png)
For each CNSFR, the gas velocity dispersions for the H and [Oiii] 5007 Å lines derived using single and double line Gaussian fits, and their corresponding errors are listed in Table 4.4. Columns 4 and 5, labelled ‘One component’, give the results for the single Gaussian fit. Columns 6 and 7, and 8 and 9, labelled ‘Two components - Narrow’ and ‘Two components - Broad’ respectively, list the results for the two component fits. The last column of the table, labelled v, gives the velocity difference between the narrow and broad components. This is calculated as the average of shifts found in the H and [Oiii] fits. Taking into account the errors in the two component fits, the errors in these velocity differences vary from 10 to 15 km s.
As in the case of the stars, we determined the radial velocity of the gas in the line-of-sight along each slit, every two pixels for position S1 of each galaxy and every three pixels, with one pixel overlap for consecutive extractions, for position S2 of each galaxy and position S3 of NGC 3351. These spectra, however, do not have the required S/N ratio to allow an acceptable two-component fit, therefore a single-Gaussian component was used. The goodness of this procedure is discussed below.
4.4.2 Emission line ratios
We have used two different ways to integrate the intensity of a given line: (1) in the cases of a single Gaussian fit the emission line intensities were measured using the SPLOT task of IRAF. The positions of the local continua are placed by eye. For the H emission lines a conspicuous underlying stellar population is easily appreciable by the presence of absorption features that depress the lines (see discussion in [1988MNRAS.231...57D] and [2007MNRAS.382..251D]). Examples of this effect can be appreciated in Figure 2.5.1. We have then defined a pseudo-continuum at the base of the line to measure the line intensities and minimize the errors introduced by the underlying population ([2006MNRAS.372..293H] and [2008MNRAS.383..209H]; details in Chapter §2). (2) In the cases of a fit by two Gaussians the individual intensities of the narrow and broad components are estimated from the fitting parameters using the expression I = 1.0645 A FWHM (= A ), where I is the Gaussian intensity, A is the amplitude of the Gaussian and FWHM is the full width at half-maximum ( is the dispersion of the Gaussian). A pseudo-continuum for the H emission line was also defined in these cases.
Following [1994ApJ...437..239G], [2002MNRAS.329..315C] and [2003MNRAS.346..105P], the statistical errors associated with the observed emission fluxes have been calculated using the expression = N[1 + EW/(N)], where is the error in the observed line flux, represents the standard deviation in a box near the measured emission line and stands for the error in the continuum placement, N is the number of pixels used in the measurement of the line intensity, EW is the line equivalent width and is the wavelength dispersion in Å px. For the H emission line we have doubled the derived error, , in order to take into account the uncertainties introduced by the presence of the underlying stellar population [2006MNRAS.372..293H].
The logarithmic ratio between the emission line intensities of [Oiii] 5007 Å and H and their corresponding errors are presented in Table 4.5. We have also listed the logarithmic ratio between the emission line fluxes of [Nii] 6584 Å and H together with their corresponding errors from [2007MNRAS.382..251D] (see Chapter §5) for R1+R2 and R4 of NGC 2903 and all the CNSFRs and the nucleus of NGC 3351, and from [1997A&A...325...81P] for R7 and the nucleus of NGC 2903. For these last two objects, the [Nii] and H emission are derived from the H+[Nii] narrow band images. Planesas and collaborators estimated the relative contribution of the [Nii] 6548,6584 Å lines from the H and [Nii] 6584 Å equivalent width measurements made by [1982ApJS...50..517S]. The logarithmic ratios for R1+R2 and R4 of NGC 2903 derived using this procedure are similar (-0.64 0.04 and -0.65 0.04). For the X region we assumed a value of -0.38 (without error) for this ratio as given by Díaz et al. (2007; see Chapter §5) for the other CNSFRs of this galaxy. For NGC 3310, the values listed for R4, R4+R5, S6, J and the nucleus are from Pastoriza et al. (1993; S6 seems to be their region L). For the rest of the regions we used an extrapolation of the results given by them from the spatial profiles of these emission lines. They reported a constant value of 0.2 for the [Nii] / H ratio for the Hii regions in their slit positions 2 and 3, while this value changes from 0.2 to 0.5 along position 1 over the nucleus of the galaxy, being 0.23 and 0.27 for regions B and L, respectively. We adopt for R1+R2, R6, R7, R10, X and Y, a value of 0.2 without assigning any error to it.
| One component | Two components | ||||
| Narrow | Broad | ||||
| Region | Slit | log([Oiii]5007/H) | log([Oiii]5007/H) | log([Oiii]5007/H) | log([Nii]6584/H) |
| NGC 2903 | |||||
| R1+R2 | S1 | -1.030.05 | -1.640.09 | -0.760.10 | -0.370.01 |
| R1+R2 | S2 | -0.920.07 | -1.510.11 | -0.570.14 | |
| R4 | S2 | -0.780.11 | -1.010.10 | -0.710.15 | -0.380.01 |
| R7 | S1 | -0.780.10 | -1.790.12 | -0.400.18 | -0.660.04 |
| N | S2 | -0.500.07 | -0.920.10 | -0.230.18 | -0.680.04 |
| X | S1 | -0.930.06 | -1.450.09 | -0.770.11 | -0.38: |
| NGC 3310 | |||||
| R1+R2 | S2 | 0.420.01 | 0.390.01 | 0.450.03 | -0.70: |
| R4 | S1 | 0.280.01 | 0.280.01 | 0.280.04 | -0.690.01 |
| R4+R5 | S2 | 0.420.01 | 0.390.01 | 0.440.03 | -0.690.01 |
| R6 | S2 | 0.280.01 | 0.300.01 | 0.280.06 | -0.70: |
| S6 | S2 | 0.210.01 | 0.210.01 | 0.220.08 | -0.560.01 |
| R7 | S2 | 0.230.01 | 0.210.01 | 0.320.09 | -0.70: |
| R10 | S1 | 0.190.01 | 0.200.04 | 0.200.08 | -0.70: |
| N | S2 | 0.040.02 | -0.130.06 | 0.110.07 | -0.300.01 |
| J | S1 | 0.450.01 | 0.450.01 | 0.450.01 | -0.800.01 |
| X | S2 | 0.600.01 | 0.550.01 | 0.670.04 | -0.70: |
| Y | S1 | 0.280.01 | 0.430.01 | 0.000.04 | -0.70: |
| NGC 3351 | |||||
| R2 | S1 | -1.070.06 | -1.660.08 | -0.930.12 | -0.430.01 |
| R2 | S3 | -1.010.06 | -1.550.08 | -0.960.13 | |
| R3 | S1 | -1.100.06 | -1.570.07 | -0.930.10 | -0.420.01 |
| R3 | S2 | -1.000.06 | -1.520.09 | -0.890.10 | |
| R4 | S2 | -1.030.07 | — | — | -0.490.01 |
| R5 | S3 | -0.850.12 | — | — | -0.370.03 |
| R6 | S2 | -1.090.11 | — | — | -0.520.02 |
| N | S3 | -0.280.05 | — | — | |
| From Díaz et al. (2007; see Chapter §5). | |||||
| From Planesas et al. (1997). | |||||
| Assumed from the values given by Díaz et al. (2007; see Chapter §5) for the other | |||||
| CNSFRs of this galaxy. | |||||
| From Pastoriza et al. (1993). | |||||
4.5 Dynamical mass derivation
Two parameters are needed in order to determine the mass of a virialized stellar system, namely its velocity dispersion and its size.
Previously estimated radii (R) for the regions, such as those given by Planesas et al. (1997) for NGC 2903 and NGC 3351, by [2000MNRAS.311..120D] for NGC 3310 from H images, or by [1997ApJ...484L..41C] from UV Space Telescope Imaging Spectrograph (STIS)-HST images for those of NGC 3351 were defined to include the total integrated emission flux of the regions, and therefore they are not appropriate for calculating their dynamical masses, as what is needed for this is a measurement of the size of the mass distribution, i.e. the star-cluster size. This is traditionally done measuring the effective radius using images obtained in bands where the light is dominated by the stellar contribution and where the contamination by gaseous emission is either small or can be estimated and corrected.
![[Uncaptioned image]](/html/0908.4285/assets/x15.png)
[
Enlargements of the F606W image around regions R1 and R2 of NGC 2903 with the contours overlapped]Enlargements of the F606W image around regions R1 and R2 of NGC 2903 with the contours overlapped. The blue circles correspond to the adopted radius for each region and the red contours corresponding to the half light brightness are in red.
![[Uncaptioned image]](/html/0908.4285/assets/x16.png)
Idem as Figure 4.27 for region R4 of NGC 2903.
![[Uncaptioned image]](/html/0908.4285/assets/x17.png)
Idem as Figure 4.27 for region R7 of NGC 2903.
![[Uncaptioned image]](/html/0908.4285/assets/x18.png)
Idem as Figure 4.27 for the nucleus of NGC 2903.
![[Uncaptioned image]](/html/0908.4285/assets/x19.png)
Idem as Figure 4.27 for regions R1 and R2 of NGC 3310.
![[Uncaptioned image]](/html/0908.4285/assets/x20.png)
Idem as Figure 4.27 for regions R4 and R5 of NGC 3310.
![[Uncaptioned image]](/html/0908.4285/assets/x21.png)
Idem as Figure 4.27 for regions R6 and S6 of NGC 3310.
![[Uncaptioned image]](/html/0908.4285/assets/x22.png)
Idem as Figure 4.27 for region R7 of NGC 3310.
![[Uncaptioned image]](/html/0908.4285/assets/x23.png)
Idem as Figure 4.27 for region R10 of NGC 3310.
![[Uncaptioned image]](/html/0908.4285/assets/x24.png)
Idem as Figure 4.27 for the nucleus of NGC 3310.
![[Uncaptioned image]](/html/0908.4285/assets/x25.png)
Idem as Figure 4.27 for region R2 of NGC 3351.
![[Uncaptioned image]](/html/0908.4285/assets/x26.png)
Idem as Figure 4.27 for region R3 of NGC 3351.
![[Uncaptioned image]](/html/0908.4285/assets/x27.png)
Idem as Figure 4.27 for region R4 of NGC 3351.
![[Uncaptioned image]](/html/0908.4285/assets/x28.png)
Idem as Figure 4.27 for region R5 of NGC 3351.
![[Uncaptioned image]](/html/0908.4285/assets/x29.png)
Idem as Figure 4.27 for region R6 of NGC 3351.
![[Uncaptioned image]](/html/0908.4285/assets/x30.png)
Idem as Figure 4.27 for the nucleus of NGC 3351.
In order to determine the sizes of the stellar clusters within our observed CNSFRs, we have used the retrieved wide V HST images. Following [1996ApJ...466L..83H] we have defined the radius (R) of a given structure as in [1995AJ....110.2665M] assuming that they have an intrinsically circularly symmetric Gaussian profile. As we can see in Figures 4.27-4.42 this is a rather good approximation. We have determined the FWHM, , by superposing the contours in the F606W WFPC2-HST image and determining the half light strength between the peak of the intensity for each region and the galaxy background. We have fitted circular regions (blue circles in the Figures) to the intensity contours corresponding to this half light brightness distribution (red contours) of each single structure. Then, for this model, we take R as the half light radius, R = 0.5W. While [1995AJ....110.2665M] measured the sizes from an H image, we use the F606W (wide V) image dominated by the stellar continuum (although it contains the H emission line) and with the appropriate spatial resolution.
We find, as expected, that almost all of these regions are composed by more than one knot. Only R4 and R5 in NGC 3351 seem to have a unique principal knot, at least at the PC1 spatial resolution. In NGC 2903, regions R1 and R2 form an interrelated complex with two main structures: R1 and R2 surrounded by, at least, 31 secondary structures. R1 is resolved into two separate clusters, labelled R1a and R1b and shows other two associated knots, labelled R1c and R1d. R2 is made up of a main cluster, labelled R2, and four secondary ones labelled “a” to “d”. The rest of the knots can not be directly related to any of the two main structures, and have been labelled as R12 followed by a letter from “a” to “v”. The same criterion has been applied for regions R4 and R7 for which we find 28 and 27 individual clusters, respectively. On the other hand, the galaxy nucleus seems to be formed by one main structure with two small secondary ones to the South West, and some very weak knots which are difficult to appreciate in the picture. The secondary structures have been designated by Na and Nb. When we analyze the F606W-PC1 image of NGC 3310, we find another region very close to R6, not classified by [2000MNRAS.311..120D], probably due to the lower spatial resolution of the data used in that work, and labelled S6 by us, which seems to be coincident with knot L of [1993MNRAS.260..177P]. For all the regions of this galaxy we find a principal knot and several secondary knots with lower peak intensities, except for R1 and R2, which present only one and two secondary knots, respectively. The same criterion as for NGC 2903 has been applied to name the regions. For the other regions of NGC 3310, R4, R5, R6, S6, R7 and R10, we find 31, 8, 14, 9, 29 and 15 individual clusters, respectively. For the third galaxy, NGC 3351, apart from the single knots R4 and R5, and R2 formed by a principal and a secondary structure, we also find that the regions are composed by several individual small clusters, 7 and 18 for R3 and R6, respectively. In all cases the knots have been found with a detection level of 10 above the background. All these knots are within the radius of the regions defined by Planesas et al. (1997) for NGC 2903 and NGC 3351, and by [2000MNRAS.311..120D] for NGC 3310, except for S6. We have to remark that our search for knots has not been exhaustive since that is not the aim of this work. The radii of the single knots vary between 1.5 and 4.0 pc for NGC 2903, between 2.2 and 6.2 pc for NGC 3310, and between 1.7 and 4.9 pc for NGC 3351. Obviously, the spatial resolution and, at least, the estimates of the smaller radii depend on the distance to each galaxy.
Table LABEL:knots gives, for each identified knot, the position, as given by the astrometric calibration of the HST image; the radius of the circular region defined as described above together with its error; and the peak intensity in counts, as measured from the WFPC2 image. The nucleus of NGC 2903 is rather compact, but resolved, with a radius of 3.8 pc. For the nucleus of NGC 3310 and NGC 3351 we measure radii of 14.2 and 11.3 pc, respectively.
| Region | position | R | I | |
|---|---|---|---|---|
| (pc) | (counts) | |||
| NGC 2903 | ||||
| R1a | 9321006 | +21300686 | 1.60.1 | 4083 |
| R1b | 9321006 | +21300695 | 1.60.2 | 4015 |
| R1c | 9321007 | +21300710 | 1.50.1 | 363 |
| R1d | 9321005 | +21300708 | 2.10.1 | 254 |
| R2 | 9320998 | +21300665 | 1.90.1 | 2892 |
| R2a | 9320996 | +21300628 | 1.90.1 | 390 |
| R2b | 9320996 | +21300661 | 1.90.2 | 307 |
| R2c | 9320996 | +21300700 | 1.90.1 | 209 |
| R2d | 9320998 | +21300630 | 1.80.2 | 206 |
| R12a | 9320996 | +21300768 | 1.90.1 | 995 |
| R12b | 9321009 | +21300594 | 2.50.1 | 580 |
| R12c | 9321008 | +21300603 | 2.50.1 | 574 |
| R12d | 9321008 | +21300542 | 2.10.1 | 427 |
| R12e | 9321015 | +21300680 | 1.60.1 | 381 |
| R12f | 9321003 | +21300638 | 1.80.1 | 341 |
| R12g | 9321004 | +21300651 | 3.20.2 | 293 |
| R12h | 9321004 | +21300591 | 3.60.4 | 266 |
| R12i | 9321015 | +21300545 | 3.20.3 | 255 |
| R12j | 9321013 | +21300542 | 3.20.4 | 238 |
| R12k | 9321011 | +21300554 | 4.00.5 | 233 |
| R12l | 9321003 | +21300540 | 1.90.1 | 219 |
| R12m | 9321006 | +21300624 | 3.80.3 | 212 |
| R12n | 9321001 | +21300735 | 1.80.1 | 209 |
| R12o | 9321001 | +21300636 | 2.60.2 | 207 |
| R12p | 9321001 | +21300623 | 2.80.2 | 204 |
| R12q | 9321012 | +21300523 | 2.30.2 | 203 |
| R12r | 9321011 | +21300589 | 2.70.4 | 198 |
| R12s | 9321005 | +21300617 | 2.10.1 | 193 |
| R12t | 9321016 | +21300567 | 3.50.4 | 187 |
| R12u | 9321015 | +21300581 | 2.10.2 | 180 |
| R12v | 9321014 | +21300607 | 1.70.2 | 179 |
| R4 | 9321021 | +21295966 | 3.40.1 | 3772 |
| R4a | 9321008 | +21300041 | 1.90.2 | 727 |
| R4b | 9321015 | +21295923 | 1.70.2 | 711 |
| R4c | 9321012 | +21295945 | 1.90.1 | 703 |
| R4d | 9321011 | +21295943 | 2.70.2 | 673 |
| R4e | 9321021 | +21300093 | 3.40.4 | 476 |
| R4f | 9321014 | +21295988 | 2.90.1 | 429 |
| R4g | 9321017 | +21300005 | 2.90.4 | 310 |
| R4h | 9321016 | +21300035 | 1.50.2 | 279 |
| R4i | 9321021 | +21300009 | 2.00.3 | 274 |
| R4j | 9321018 | +21295954 | 2.40.2 | 271 |
| R4k | 9321027 | +21295899 | 2.00.2 | 253 |
| R4l | 9321010 | +21295978 | 2.10.3 | 246 |
| R4m | 9321014 | +21295952 | 2.20.3 | 245 |
| R4n | 9321009 | +21295986 | 1.50.3 | 240 |
| R4o | 9321018 | +21295970 | 2.30.3 | 237 |
| R4p | 9321016 | +21295910 | 1.60.2 | 236 |
| R4q | 9321025 | +21295892 | 2.70.3 | 228 |
| R4r | 9321010 | +21295971 | 1.70.2 | 227 |
| R4s | 9321021 | +21300018 | 2.70.3 | 216 |
| R4t | 9321008 | +21295983 | 1.80.2 | 208 |
| R4u | 9321011 | +21295894 | 2.40.3 | 198 |
| R4v | 9321020 | +21300037 | 2.10.3 | 196 |
| R4w | 9321023 | +21300067 | 2.00.2 | 195 |
| R4x | 9321022 | +21300117 | 3.20.4 | 194 |
| R4y | 9321012 | +21295882 | 1.90.3 | 187 |
| R4z | 9321019 | +21300025 | 2.00.3 | 180 |
| R4 | 9321024 | +21300043 | 2.00.3 | 173 |
| R7 | 9321038 | +21301093 | 2.70.1 | 984 |
| R7a | 9321032 | +21300974 | 2.70.2 | 715 |
| R7b | 9321027 | +21300999 | 3.40.1 | 579 |
| R7c | 9321034 | +21300965 | 2.70.3 | 520 |
| R7d | 9321039 | +21300917 | 2.60.2 | 470 |
| R7e | 9321026 | +21300956 | 1.50.2 | 283 |
| R7f | 9321035 | +21300903 | 4.00.5 | 270 |
| R7g | 9321029 | +21300964 | 2.50.2 | 259 |
| R7h | 9321029 | +21300976 | 2.20.2 | 252 |
| R7i | 9321037 | +21301054 | 2.30.1 | 248 |
| R7j | 9321031 | +21301024 | 2.60.2 | 246 |
| R7k | 9321030 | +21300980 | 2.60.3 | 234 |
| R7l | 9321034 | +21300921 | 3.20.5 | 231 |
| R7m | 9321026 | +21301019 | 2.80.2 | 230 |
| R7n | 9321035 | +21301006 | 2.10.3 | 227 |
| R7o | 9321033 | +21300947 | 2.10.2 | 226 |
| R7p | 9321033 | +21301025 | 1.90.1 | 225 |
| R7q | 9321032 | +21301056 | 1.70.1 | 222 |
| R7r | 9321032 | +21300935 | 1.90.2 | 217 |
| R7s | 9321036 | +21300927 | 3.80.5 | 215 |
| R7t | 9321034 | +21301035 | 2.10.4 | 212 |
| R7u | 9321038 | +21301057 | 2.90.4 | 209 |
| R7v | 9321039 | +21301060 | 2.20.2 | 208 |
| R7w | 9321034 | +21300886 | 1.90.2 | 208 |
| R7x | 9321032 | +21301004 | 2.40.2 | 207 |
| R7y | 9321034 | +21300895 | 1.70.1 | 206 |
| R7z | 9321028 | +21301030 | 2.20.1 | 204 |
| N | 9321014 | +21300304 | 3.80.1 | 870 |
| Na | 9321011 | +21300288 | 1.50.2 | 186 |
| Nb | 9321012 | +21300275 | 2.10.2 | 181 |
| NGC 3310 | ||||
| R1 | 103847070 | +53301446 | 4.60.3 | 322 |
| R1a | 103847032 | +53301474 | 2.60.2 | 179 |
| R2 | 103847026 | +53301555 | 4.70.2 | 1271 |
| R2a | 103846997 | +53301552 | 5.50.5 | 515 |
| R2b | 103847008 | +53301584 | 3.30.2 | 287 |
| R4 | 103846109 | +53301604 | 2.90.2 | 2409 |
| R4a | 103846198 | +53301701 | 3.10.2 | 1942 |
| R4b | 103846242 | +53301657 | 2.50.2 | 1038 |
| R4c | 103846311 | +53301566 | 2.40.2 | 584 |
| R4d | 103846115 | +53301625 | 4.10.2 | 494 |
| R4e | 103846319 | +53301667 | 4.20.3 | 489 |
| R4f | 103846188 | +53301659 | 4.20.2 | 403 |
| R4g | 103846264 | +53301781 | 2.90.2 | 391 |
| R4h | 103846210 | +53301647 | 2.80.4 | 336 |
| R4i | 103846353 | +53301468 | 4.20.2 | 304 |
| R4j | 103846274 | +53301636 | 3.00.3 | 284 |
| R4k | 103846107 | +53301556 | 2.70.2 | 271 |
| R4l | 103846258 | +53301530 | 3.40.5 | 268 |
| R4m | 103846513 | +53301502 | 2.80.3 | 259 |
| R4n | 103846316 | +53301766 | 3.40.3 | 250 |
| R4o | 103846236 | +53301569 | 3.10.2 | 241 |
| R4p | 103846327 | +53301482 | 2.40.2 | 241 |
| R4q | 103846352 | +53301453 | 3.10.4 | 227 |
| R4r | 103846200 | +53301677 | 3.10.3 | 216 |
| R4s | 103846279 | +53301672 | 2.70.3 | 212 |
| R4t | 103846123 | +53301640 | 2.90.4 | 206 |
| R4u | 103846350 | +53301493 | 3.80.4 | 206 |
| R4v | 103846347 | +53301514 | 4.00.4 | 205 |
| R4w | 103846291 | +53301618 | 2.90.4 | 204 |
| R4x | 103846308 | +53301519 | 3.10.3 | 201 |
| R4y | 103846313 | +53301620 | 2.90.4 | 194 |
| R4z | 103846366 | +53301481 | 3.50.3 | 191 |
| R4 | 103846282 | +53301648 | 3.30.4 | 187 |
| R4 | 103846296 | +53301504 | 3.70.3 | 183 |
| R4 | 103846140 | +53301619 | 3.70.3 | 166 |
| R4 | 103846136 | +53301594 | 2.60.3 | 166 |
| R5 | 103846111 | +53301703 | 3.40.3 | 606 |
| R5a | 103846119 | +53301742 | 3.10.4 | 370 |
| R5b | 103846094 | +53301726 | 3.60.4 | 313 |
| R5c | 103846104 | +53301779 | 6.20.6 | 262 |
| R5d | 103846153 | +53301708 | 3.60.3 | 244 |
| R5e | 103846071 | +53301697 | 3.70.2 | 222 |
| R5f | 103846054 | +53301748 | 3.00.2 | 206 |
| R5g | 103846083 | +53301671 | 3.20.3 | 193 |
| R6 | 103845935 | +53301820 | 3.40.2 | 378 |
| R6a | 103846009 | +53301783 | 2.20.3 | 342 |
| R6b | 103845879 | +53301769 | 3.90.2 | 260 |
| R6c | 103845972 | +53301751 | 2.70.2 | 258 |
| R6d | 103845907 | +53301788 | 4.20.3 | 242 |
| R6e | 103846005 | +53301746 | 3.90.4 | 221 |
| R6f | 103845952 | +53301844 | 3.70.2 | 215 |
| R6g | 103845907 | +53301699 | 3.40.4 | 170 |
| R6h | 103845948 | +53301794 | 3.10.3 | 168 |
| R6i | 103845965 | +53301775 | 2.50.2 | 168 |
| R6j | 103846007 | +53301694 | 4.00.5 | 165 |
| R6k | 103845988 | +53301728 | 3.10.2 | 160 |
| R6l | 103846001 | +53301719 | 3.70.4 | 156 |
| R6m | 103845967 | +53301712 | 4.20.5 | 146 |
| S6 | 103845748 | +53301842 | 4.20.2 | 544 |
| S6a | 103845768 | +53301800 | 5.50.2 | 385 |
| S6b | 103845700 | +53301826 | 2.60.3 | 237 |
| S6c | 103845711 | +53301814 | 3.40.3 | 204 |
| S6d | 103845813 | +53301786 | 2.70.3 | 180 |
| S6e | 103845770 | +53301828 | 3.00.2 | 174 |
| S6f | 103845842 | +53301800 | 3.60.2 | 173 |
| S6g | 103845801 | +53301802 | 2.90.3 | 172 |
| S6h | 103845738 | +53301798 | 2.80.3 | 166 |
| R7 | 103845270 | +53301818 | 3.10.2 | 639 |
| R7a | 103845520 | +53301824 | 5.30.2 | 599 |
| R7b | 103845537 | +53301816 | 3.50.3 | 449 |
| R7c | 103845390 | +53301914 | 4.80.2 | 390 |
| R7d | 103845633 | +53301757 | 3.00.2 | 275 |
| R7e | 103845527 | +53301886 | 2.40.3 | 273 |
| R7f | 103845466 | +53301803 | 3.90.2 | 264 |
| R7g | 103845607 | +53301705 | 4.50.2 | 231 |
| R7h | 103845613 | +53301921 | 3.90.2 | 209 |
| R7i | 103845394 | +53301751 | 3.00.2 | 201 |
| R7j | 103845638 | +53301745 | 4.00.5 | 200 |
| R7k | 103845313 | +53301700 | 3.40.3 | 198 |
| R7l | 103845371 | +53301753 | 4.10.3 | 191 |
| R7m | 103845603 | +53301839 | 3.00.3 | 190 |
| R7n | 103845363 | +53301710 | 3.40.3 | 180 |
| R7o | 103845549 | +53301787 | 3.90.5 | 179 |
| R7p | 103845461 | +53301884 | 3.20.2 | 177 |
| R7q | 103845494 | +53301698 | 3.80.3 | 170 |
| R7r | 103845533 | +53301682 | 3.90.3 | 168 |
| R7s | 103845576 | +53301810 | 4.00.2 | 165 |
| R7t | 103845422 | +53301827 | 2.40.3 | 162 |
| R7u | 103845306 | +53301708 | 3.70.4 | 160 |
| R7v | 103845364 | +53301899 | 3.70.3 | 157 |
| R7w | 103845423 | +53301919 | 3.90.2 | 154 |
| R7x | 103845447 | +53301824 | 3.50.2 | 152 |
| R7y | 103845550 | +53301696 | 3.90.3 | 147 |
| R7z | 103845476 | +53301834 | 3.30.4 | 145 |
| R7 | 103845543 | +53301870 | 4.70.6 | 143 |
| R7 | 103845545 | +53301899 | 3.40.4 | 138 |
| R10 | 103845309 | +53300814 | 3.10.2 | 354 |
| R10a | 103845335 | +53300759 | 5.10.5 | 303 |
| R10b | 103845420 | +53300806 | 3.80.2 | 270 |
| R10c | 103845343 | +53300773 | 3.50.3 | 260 |
| R10d | 103845338 | +53300784 | 4.10.4 | 251 |
| R10e | 103845307 | +53300828 | 2.80.3 | 235 |
| R10f | 103845298 | +53300841 | 2.80.4 | 222 |
| R10g | 103845393 | +53300784 | 4.40.6 | 200 |
| R10h | 103845254 | +53300738 | 4.10.3 | 199 |
| R10i | 103845395 | +53300770 | 4.70.5 | 182 |
| R10j | 103845371 | +53300815 | 4.00.5 | 177 |
| R10k | 103845421 | +53300827 | 3.80.3 | 177 |
| R10l | 103845408 | +53300780 | 3.90.3 | 173 |
| R10m | 103845374 | +53300786 | 3.10.3 | 169 |
| R10n | 103845424 | +53300790 | 3.10.4 | 168 |
| N | 103845893 | +53301147 | 14.21.0 | 3735 |
| Na | 103845970 | +53301085 | 5.80.6 | 370 |
| NGC 3351 | ||||
| R2 | 10435712 | +11420827 | 4.90.2 | 2531 |
| R2a | 10435712 | +11420853 | 2.50.2 | 956 |
| R3 | 10435716 | +11415902 | 3.90.2 | 2598 |
| R3a | 10435716 | +11415924 | 2.20.1 | 1852 |
| R3b | 10435718 | +11415893 | 2.00.3 | 1032 |
| R3c | 10435721 | +11415941 | 2.50.3 | 546 |
| R3d | 10435721 | +11415933 | 2.70.3 | 489 |
| R3e | 10435720 | +11415971 | 2.90.2 | 383 |
| R3f | 10435720 | +11415926 | 3.70.4 | 330 |
| R4 | 10435732 | +11420092 | 2.90.1 | 2581 |
| R5 | 10435755 | +11420250 | 3.20.1 | 973 |
| R6 | 10435760 | +11420521 | 2.70.1 | 2399 |
| R6a | 10435762 | +11420681 | 2.00.1 | 794 |
| R6b | 10435762 | +11420600 | 2.00.2 | 714 |
| R6c | 10435763 | +11420638 | 2.00.1 | 551 |
| R6d | 10435762 | +11420586 | 1.70.1 | 404 |
| R6e | 10435765 | +11420685 | 2.40.2 | 376 |
| R6f | 10435762 | +11420621 | 2.00.1 | 340 |
| R6g | 10435761 | +11420612 | 1.70.1 | 295 |
| R6h | 10435763 | +11420652 | 1.70.1 | 290 |
| R6i | 10435764 | +11420613 | 2.00.1 | 285 |
| R6j | 10435762 | +11420566 | 2.90.3 | 282 |
| R6k | 10435761 | +11420541 | 2.40.2 | 275 |
| R6l | 10435761 | +11420631 | 2.40.3 | 272 |
| R6m | 10435761 | +11420543 | 2.20.2 | 270 |
| R6n | 10435763 | +11420552 | 2.20.3 | 251 |
| R6o | 10435763 | +11420483 | 2.90.3 | 212 |
| R6p | 10435761 | +11420481 | 3.10.3 | 212 |
| R6q | 10435756 | +11420548 | 2.20.3 | 211 |
| N | 10435729 | +11420581 | 11.30.1 | 513 |
We have used the virial theorem to estimate upper limits to the dynamical masses (M) inside the half light radius (R) for each observed knot in the F606W WFPC2-HST image. In order to do this, we have assumed that the systems are spherically symmetric, gravitationally bound and have an isotropic velocity distribution [(total) = 3 ]. Then, the dynamical mass is given by M = 3 R/G (Ho and Filippenko 1996a,b).
It must be noted that we have measurements for the size of each knot (typically between 3 and 5 pc), but we do not have direct access to the stellar velocity dispersion of each individual clusters, since our spectroscopic measurements encompass a wider area (1.0 1.9 arcsec, which corresponds approximately to 42 76 pc for NGC 2903, 73 131 pc for NGC 3310, and 49 88 pc for NGC 3351) that includes the whole CNSFRs to which each group of knots belong. The use of these wider size scale velocity dispersion measurements to estimate the mass of each knot, leads us to overestimate the mass of the individual clusters, and hence of each CNSFR.
As we can not be sure that we are actually measuring their velocity dispersion, we prefer to say that our measurements of , and hence the dynamical masses, constitute upper limits. Although we are well aware of the difficulties, still we are confident that these upper limits are valid and important for comparison with the gas kinematical measurements.
The estimated dynamical masses and their corresponding errors for each knot are listed in Table LABEL:mass. For the regions that have been observed in more than one slit position, we list the derived values using the two different stellar velocity dispersions. The dynamical masses in the rows labelled “sum” have been found by adding the individual masses for each knot of the corresponding CNSFR, when there are more than one. We have taken the average of the R12sum estimated from slit positions S1 of NGC 2903 as the “adopted” dynamical mass for R12. The “adopted” dynamical mass for R2 in NGC 3351 is directly the sum of the dynamical masses of the two knots derived using the velocity dispersion estimated from S1, since the mass calculated from S3 is in agreement with the first one (see Table LABEL:mass) but it has a much greater error. This greater error is due to the lower S/N ratio of the spectrum of R2 extracted from S3. In contrast, the derived dynamical masses for R3 in this galaxy are not in complete agreement, although they coincide within the errors, which are comparable. In this case we have taken the average as the “adopted” value. The fractional errors of the dynamical masses of the individual knots and of the CNSFRs are listed in column 4. As explained above, since the stellar velocity dispersion for the R1+R2 region of NGC 3310 has a large error, we do not list the errors of the dynamical masses of the individual knots or of the whole region R12sum.
| Region | Slit | M | error(%) | Region | Slit | M | error(%) | |
|---|---|---|---|---|---|---|---|---|
| NGC 2903 | ||||||||
| R1a | S1 | 405 | 12 | R4 | S2 | 466 | 13 | |
| R1b | S1 | 396 | 17 | R4a | S2 | 264 | 16 | |
| R1c | S1 | 375 | 13 | R4b | S2 | 234 | 17 | |
| R1d | S1 | 526 | 12 | R4c | S2 | 264 | 14 | |
| R2 | S1 | 466 | 12 | R4d | S2 | 375 | 15 | |
| R2a | S1 | 476 | 12 | R4e | S2 | 468 | 17 | |
| R2b | S1 | 477 | 15 | R4f | S2 | 405 | 13 | |
| R2c | S1 | 466 | 12 | R4g | S2 | 407 | 19 | |
| R2d | S1 | 447 | 16 | R4h | S2 | 204 | 19 | |
| R12a | S1 | 476 | 12 | R4i | S2 | 275 | 20 | |
| R12b | S1 | 637 | 11 | R4j | S2 | 325 | 15 | |
| R12c | S1 | 637 | 11 | R4k | S2 | 274 | 16 | |
| R12d | S1 | 526 | 12 | R4l | S2 | 295 | 19 | |
| R12e | S1 | 405 | 12 | R4m | S2 | 306 | 18 | |
| R12f | S1 | 455 | 12 | R4n | S2 | 205 | 24 | |
| R12g | S1 | 7910 | 12 | R4o | S2 | 316 | 18 | |
| R12h | S1 | 8914 | 15 | R4p | S2 | 224 | 18 | |
| R12i | S1 | 7911 | 14 | R4q | S2 | 366 | 17 | |
| R12j | S1 | 8113 | 16 | R4r | S2 | 234 | 17 | |
| R12k | S1 | 10016 | 16 | R4s | S2 | 366 | 17 | |
| R12l | S1 | 476 | 12 | R4t | S2 | 244 | 17 | |
| R12m | S1 | 9413 | 13 | R4u | S2 | 336 | 18 | |
| R12n | S1 | 445 | 12 | R4v | S2 | 295 | 19 | |
| R12o | S1 | 648 | 13 | R4w | S2 | 274 | 16 | |
| R12p | S1 | 709 | 13 | R4x | S2 | 438 | 18 | |
| R12q | S1 | 588 | 14 | R4y | S2 | 265 | 20 | |
| R12r | S1 | 6812 | 18 | R4z | S2 | 275 | 20 | |
| R12s | S1 | 526 | 12 | R4 | S2 | 275 | 20 | |
| R12t | S1 | 8814 | 16 | R4sum | S2 | 85328 | 3 | |
| R12u | S1 | 527 | 14 | R7 | S1 | 265 | 18 | |
| R12v | S1 | 427 | 16 | R7a | S1 | 265 | 19 | |
| R12sum | S1 | 181648 | 3 | R7b | S1 | 326 | 17 | |
| R1a | S2 | 455 | 10 | R7c | S1 | 265 | 20 | |
| R1b | S2 | 446 | 14 | R7d | S1 | 255 | 19 | |
| R1c | S2 | 414 | 10 | R7e | S1 | 143 | 22 | |
| R1d | S2 | 596 | 9 | R7f | S1 | 388 | 21 | |
| R2 | S2 | 525 | 10 | R7g | S1 | 245 | 19 | |
| R2a | S2 | 535 | 10 | R7h | S1 | 214 | 19 | |
| R2b | S2 | 537 | 13 | R7i | S1 | 224 | 18 | |
| R2c | S2 | 525 | 10 | R7j | S1 | 255 | 19 | |
| R2d | S2 | 506 | 13 | R7k | S1 | 255 | 21 | |
| R12a | S2 | 535 | 10 | R7l | S1 | 317 | 23 | |
| R12b | S2 | 716 | 9 | R7m | S1 | 275 | 19 | |
| R12c | S2 | 716 | 9 | R7n | S1 | 205 | 22 | |
| R12d | S2 | 596 | 9 | R7o | S1 | 204 | 20 | |
| R12e | S2 | 455 | 10 | R7p | S1 | 193 | 18 | |
| R12f | S2 | 515 | 10 | R7q | S1 | 173 | 18 | |
| R12g | S2 | 899 | 10 | R7r | S1 | 184 | 20 | |
| R12h | S2 | 10113 | 13 | R7s | S1 | 368 | 22 | |
| R12i | S2 | 8911 | 12 | R7t | S1 | 215 | 25 | |
| R12j | S2 | 9113 | 14 | R7u | S1 | 286 | 22 | |
| R12k | S2 | 11316 | 14 | R7v | S1 | 214 | 19 | |
| R12l | S2 | 535 | 10 | R7w | S1 | 194 | 20 | |
| R12m | S2 | 10712 | 11 | R7x | S1 | 234 | 19 | |
| R12n | S2 | 505 | 10 | R7y | S1 | 173 | 18 | |
| R12o | S2 | 728 | 11 | R7z | S1 | 214 | 18 | |
| R12p | S2 | 798 | 10 | R7sum | S1 | 64226 | 4 | |
| R12q | S2 | 657 | 11 | N | S2 | 11210 | 9 | |
| R12r | S2 | 7712 | 15 | Na | S2 | 437 | 16 | |
| R12s | S2 | 596 | 9 | Nb | S2 | 628 | 13 | |
| R12t | S2 | 10013 | 13 | Nsum | S2 | 21715 | 7 | |
| R12u | S2 | 597 | 12 | |||||
| R12v | S2 | 476 | 13 | |||||
| R12sum | S2 | 205445 | 2 | |||||
| R12 (adopted) | 193566 | 3 | ||||||
| NGC 3310 | ||||||||
| R1 | S2 | 202: | — | R6 | S2 | 288 | 30 | |
| R1a | S2 | 115: | — | R6a | S2 | 186 | 32 | |
| R2 | S2 | 208: | — | R6b | S2 | 329 | 29 | |
| R2a | S2 | 241: | — | R6c | S2 | 227 | 30 | |
| R2b | S2 | 144: | — | R6d | S2 | 3510 | 30 | |
| R12sum | S2 | 911: | — | R6e | S2 | 3210 | 31 | |
| R4 | S1 | 264 | 17 | R6f | S2 | 309 | 29 | |
| R4a | S1 | 275 | 17 | R6g | S2 | 289 | 31 | |
| R4b | S1 | 224 | 18 | R6h | S2 | 268 | 30 | |
| R4c | S1 | 214 | 18 | R6i | S2 | 216 | 30 | |
| R4d | S1 | 366 | 16 | R6j | S2 | 3310 | 31 | |
| R4e | S1 | 386 | 17 | R6k | S2 | 258 | 30 | |
| R4f | S1 | 386 | 16 | R6l | S2 | 3110 | 31 | |
| R4g | S1 | 264 | 17 | R6m | S2 | 3511 | 31 | |
| R4h | S1 | 255 | 21 | R6sum | S2 | 39733 | 8 | |
| R4i | S1 | 376 | 16 | S6 | S2 | 286 | 23 | |
| R4j | S1 | 275 | 19 | S6a | S2 | 378 | 23 | |
| R4k | S1 | 244 | 17 | S6b | S2 | 185 | 25 | |
| R4l | S1 | 307 | 21 | S6c | S2 | 236 | 24 | |
| R4m | S1 | 255 | 19 | S6d | S2 | 185 | 25 | |
| R4n | S1 | 305 | 18 | S6e | S2 | 205 | 23 | |
| R4o | S1 | 285 | 17 | S6f | S2 | 246 | 23 | |
| R4p | S1 | 214 | 18 | S6g | S2 | 205 | 25 | |
| R4q | S1 | 286 | 20 | S6h | S2 | 195 | 25 | |
| R4r | S1 | 275 | 18 | S6sum | S2 | 21017 | 8 | |
| R4s | S1 | 245 | 19 | R7 | S2 | 429 | 22 | |
| R4t | S1 | 265 | 21 | R7a | S2 | 7115 | 21 | |
| R4u | S1 | 346 | 19 | R7b | S2 | 4611 | 23 | |
| R4v | S1 | 367 | 19 | R7c | S2 | 6414 | 21 | |
| R4w | S1 | 265 | 21 | R7d | S2 | 409 | 22 | |
| R4x | S1 | 285 | 18 | R7e | S2 | 328 | 24 | |
| R4y | S1 | 265 | 21 | R7f | S2 | 5211 | 22 | |
| R4z | S1 | 316 | 18 | R7g | S2 | 6013 | 22 | |
| R4 | S1 | 296 | 20 | R7h | S2 | 5111 | 22 | |
| R4 | S1 | 336 | 18 | R7i | S2 | 409 | 22 | |
| R4 | S1 | 336 | 18 | R7j | S2 | 5313 | 24 | |
| R4 | S1 | 235 | 19 | R7k | S2 | 4410 | 23 | |
| R4sum | S1 | 88630 | 3 | R7l | S2 | 5412 | 22 | |
| R4 | S2 | 305 | 18 | R7m | S2 | 409 | 23 | |
| R4a | S2 | 316 | 18 | R7n | S2 | 4410 | 23 | |
| R4b | S2 | 255 | 19 | R7o | S2 | 5213 | 25 | |
| R4c | S2 | 255 | 19 | R7p | S2 | 439 | 22 | |
| R4d | S2 | 427 | 17 | R7q | S2 | 5011 | 22 | |
| R4e | S2 | 438 | 18 | R7r | S2 | 5212 | 22 | |
| R4f | S2 | 437 | 17 | R7s | S2 | 5312 | 22 | |
| R4g | S2 | 305 | 18 | R7t | S2 | 328 | 24 | |
| R4h | S2 | 286 | 22 | R7u | S2 | 4811 | 24 | |
| R4i | S2 | 427 | 17 | R7v | S2 | 4811 | 23 | |
| R4j | S2 | 306 | 19 | R7w | S2 | 5211 | 22 | |
| R4k | S2 | 275 | 18 | R7x | S2 | 4610 | 22 | |
| R4l | S2 | 358 | 22 | R7y | S2 | 5212 | 22 | |
| R4m | S2 | 296 | 20 | R7z | S2 | 4411 | 24 | |
| R4n | S2 | 357 | 19 | R7 | S2 | 6315 | 25 | |
| R4o | S2 | 326 | 18 | R7 | S2 | 4411 | 24 | |
| R4p | S2 | 255 | 19 | R7sum | S2 | 141360 | 4 | |
| R4q | S2 | 327 | 21 | R10 | S1 | 335 | 17 | |
| R4r | S2 | 316 | 19 | R10a | S1 | 5310 | 18 | |
| R4s | S2 | 276 | 20 | R10b | S1 | 406 | 16 | |
| R4t | S2 | 306 | 22 | R10c | S1 | 376 | 18 | |
| R4u | S2 | 398 | 20 | R10d | S1 | 438 | 18 | |
| R4v | S2 | 418 | 19 | R10e | S1 | 295 | 19 | |
| R4w | S2 | 306 | 22 | R10f | S1 | 296 | 21 | |
| R4x | S2 | 326 | 19 | R10g | S1 | 469 | 21 | |
| R4y | S2 | 306 | 22 | R10h | S1 | 437 | 17 | |
| R4z | S2 | 367 | 19 | R10i | S1 | 509 | 19 | |
| R4 | S2 | 337 | 21 | R10j | S1 | 428 | 19 | |
| R4 | S2 | 387 | 19 | R10k | S1 | 407 | 17 | |
| R4 | S2 | 387 | 19 | R10l | S1 | 407 | 17 | |
| R4 | S2 | 275 | 20 | R10m | S1 | 326 | 18 | |
| R5 | S2 | 357 | 19 | R10n | S1 | 337 | 20 | |
| R5a | S2 | 327 | 21 | R10sum | S1 | 58828 | 5 | |
| R5b | S2 | 367 | 20 | N | S1 | 52657 | 11 | |
| R5c | S2 | 6312 | 19 | Na | S1 | 21628 | 13 | |
| R5d | S2 | 367 | 19 | Nsum | S1 | 74264 | 9 | |
| R5e | S2 | 377 | 18 | |||||
| R5f | S2 | 305 | 18 | |||||
| R5g | S2 | 336 | 19 | |||||
| R45sum | S2 | 131741 | 3 | |||||
| NGC 3351 | ||||||||
| R2 | S1 | 855 | 6 | R6 | S2 | 299 | 32 | |
| R2a | S1 | 444 | 9 | R6a | S2 | 218 | 37 | |
| R2sum | S1 | 1296 | 3 | R6b | S2 | 218 | 38 | |
| R2 | S3 | 8721 | 24 | R6c | S2 | 218 | 37 | |
| R2a | S3 | 4411 | 25 | R6d | S2 | 187 | 37 | |
| R2sum | S3 | 13123 | 18 | R6e | S2 | 2610 | 38 | |
| R2 (adopted) | 1296 | 3 | R6f | S2 | 218 | 37 | ||
| R3 | S1 | 8214 | 17 | R6g | S2 | 187 | 37 | |
| R3a | S1 | 468 | 17 | R6h | S2 | 187 | 37 | |
| R3b | S1 | 429 | 22 | R6i | S2 | 218 | 38 | |
| R3c | S1 | 5211 | 20 | R6j | S2 | 3112 | 38 | |
| R3d | S1 | 5711 | 18 | R6k | S2 | 2610 | 39 | |
| R3e | S1 | 6111 | 20 | R6l | S2 | 2610 | 38 | |
| R3f | S1 | 7815 | 20 | R6m | S2 | 249 | 39 | |
| R3sum | S1 | 41731 | 7 | R6n | S2 | 249 | 38 | |
| R3 | S2 | 9423 | 24 | R6o | S2 | 3112 | 38 | |
| R3a | S2 | 5313 | 24 | R6p | S2 | 3313 | 38 | |
| R3b | S2 | 4814 | 28 | R6q | S2 | 249 | 39 | |
| R3c | S2 | 6016 | 27 | R6sum | S2 | 43439 | 9 | |
| R3d | S2 | 6517 | 26 | N | S3 | 35011 | 3 | |
| R3e | S2 | 7017 | 25 | |||||
| R3f | S2 | 895 | 26 | |||||
| R3sum | S2 | 47747 | 10 | |||||
| R3 (adopted) | 44756 | 13 | ||||||
| R4 | S2 | 8712 | 14 | |||||
| R5 | S3 | 498 | 16 | |||||
| masses in 10 M. | ||||||||
4.6 Ionizing star cluster properties
We have derived the masses of the ionizing star clusters (M) from the total number of ionizing photons using solar metallicity single burst models by [1995A&AS..112...35G], assuming a Salpeter initial mass function ([1955ApJ...121..161S]; IMF) with lower and upper mass limits of 0.8 and 120 M which provide the number of ionizing photons per unit mass, []. In order to take into account the evolution of the Hii region, we have made use of the fact that a relation exists between the degree of evolution of the cluster, as represented by the equivalent width of the H emission line, and the number of Lyman continuum photons per unit solar mass (e.g. [2000MNRAS.318..462D]). This number decreases with the age of the region. We have used the following relation between and the equivalent width (EW) of H, EW(H), derived from the models, in order to take into account the evolutionary state of the region [1998Ap&SS.263..143D]:
We have measured the EW(H) from our spectra (see Table 4.8) following the same procedure as in ([2006MNRAS.372..293H, 2008MNRAS.383..209H]; see Chapter §2), that is defining a pseudo-continuum to take into account the absorption from the underlying stellar population. This correction would increase the values of EW(H) thus decreasing the calculated M. However, since there is a contribution to the continuum by the older stellar population (see discussion in Díaz et al. 2007; see Chapter §5) the final derived values of the equivalent widths are still underestimated. The total number of ionizing photons has been derived from the H luminosities (see for example [1989agna.book.....O]):
For NGC 2903 and NGC 3351 we have taken the total observed H luminosities from Planesas et al. (1997) and for NGC 3310 from [2000MNRAS.311..120D] and [1993MNRAS.260..177P]. Corrections were applied to take into account the different assumed distances. In the cases of the regions of NGC 2903 and NGC 3351 we have corrected the H luminosities given by Planesas and co-authors for internal extinction using the colour excess [E(B-V)] estimated by [tesisdiego] from optical spectroscopy and assuming the galactic extinction law of [1972ApJ...172..593M] with = 3.2. [2000MNRAS.311..120D] and [1993MNRAS.260..177P] give the already corrected luminosities for NGC 3310. In the case of NGC 2903, Planesas et al. (1997) estimated a diameter of 2.0 arcsec for regions R1, R2, R7 and the nucleus and 2.4 arcsec for region R4. In the case of R1+R2 we added their H luminosities. Likewise, for NGC 3351, these authors estimated a diameter of 2.4 arcsec for each whole region and the nucleus, except for R4 for which they used 2.2 arcsec. [2000MNRAS.311..120D] estimated a diameter of 2 arcsec for regions R2, R4, R6, R7 and R10, and 1.4 arcsec for R1 and R5 of NGC 3310, and 3.4 for the Jumbo region. For this last one we give the values derived using the different quantities for the luminosities given by [2000MNRAS.311..120D] (region R19) and [1993MNRAS.260..177P] (region A of that work). Again, for R1+R2 and R4+R5 (for S2) we added their H luminosities. No values are found in the literature for the H luminosity of region X of NGC 2903 and regions X and Y of NGC 3310. Our derived values of Q(H) constitute lower limits since we have not taken into account the fraction of photons that may have been absorbed by dust or may have escaped the region.
The final expression for the derivation of M is:
The derived masses for the ionizing populations of the observed CNSFRs are given in column 8 of Table 4.8 and are between 2 and 8 per cent of the dynamical mass for those regions of NGC 2903, between 1 and 7 per cent for those of NGC 3310, and between 2 and 16 per cent in the cases of NGC 3351 (see column 11 of the table).
| Region | L(H) | E(B-V) | c(H) | L(H) | Q(H) | EW(H) | M | N | M | M/M |
|---|---|---|---|---|---|---|---|---|---|---|
| (per cent) | ||||||||||
| NGC 2903 | ||||||||||
| R1+R2 | 20.3 | 0.53 | 0.75 | 114.0 | 83.7 | 12.1 | 32.5 | 280 | 1.35 | 1.7 |
| R4 | 8.9 | 0.66 | 0.93 | 76.3 | 56.1 | 4.8 | 48.2 | 270 | 0.94 | 5.7 |
| R7 | 6.4 | 0.71 | 1.01 | 64.5 | 47.4 | 3.9 | 48.8 | 350 | 0.61 | 7.6 |
| N | 2.8 | — | — | 2.8 | 2.0 | 3.8 | 2.1 | — | 0.03 | 1.0 |
| NGC 3310 | ||||||||||
| R1+R2 | — | — | 0.33 | 102.0 | 74.9 | 28.6 | 13.9 | 100 | 3.38 | 1.5 |
| R4 | — | — | 0.33 | 144.0 | 106.0 | 32.4 | 17.6 | 100 | 4.78 | 1.6 |
| R4+R5 | — | — | 0.29 | 218.0 | 160.0 | 41.7 | 21.4 | 100 | 7.24 | 1.1 |
| R6 | — | — | 0.25 | 57.3 | 42.1 | 16.7 | 12.4 | 100 | 1.90 | 3.5 |
| S6 | — | — | 0.35 | 62.5 | 45.9 | 12.5 | 17.4 | 100 | 2.07 | 6.6 |
| R7 | — | — | 0.25 | 45.5 | 33.5 | 19.4 | 8.7 | 100 | 1.51 | 1.0 |
| R10 | — | — | 0.33 | 45.5 | 33.5 | 9.7 | 15.7 | 100 | 1.51 | 2.4 |
| N | — | — | 0.42 | 113.0 | 82.9 | 11.0 | 34.9 | 8000 | 0.05 | 4.7 |
| J | — | — | 0.33 | 573.0 | 421.0 | 82.5 | 31.4 | 200 | 9.52 | — |
| — | — | 0.19 | 236.0 | 174.0 | 82.5 | 12.9 | 200 | 3.93 | — | |
| NGC 3351 | ||||||||||
| R2 | 19.3 | 0.17 | 0.24 | 33.6 | 24.7 | 9.5 | 11.8 | 440 | 0.25 | 9.0 |
| R3 | 25.0 | 0.46 | 0.65 | 112.0 | 82.3 | 16.5 | 24.5 | 430 | 0.87 | 5.5 |
| R4 | 12.7 | 0.27 | 0.38 | 30.6 | 22.5 | 13.0 | 8.2 | 310 | 0.33 | 9.5 |
| R5 | 5.9 | 0.25 | 0.35 | 13.3 | 9.8 | 5.1 | 8.0 | 360 | 0.12 | 16.2 |
| R6 | 7.5 | 0.0 | 0.00 | 7.5 | 5.5 | 2.3 | 8.9 | 360 | 0.07 | 2.0 |
| N | 3.3 | 0.07 | 0.10 | 4.1 | 3.0 | 1.8 | 6.0 | 650 | 0.02 | 1.7 |
| Luminosities in 10 erg s, masses in 10 M, ionizing photons in 10 photon s and densities in cm | ||||||||||
| From Planesas et al. (1997) corrected for the different adopted distances. | ||||||||||
| From [tesisdiego]. | ||||||||||
| From Díaz et al. (2007; see Chapter §5). | ||||||||||
| We assume a value of 0.0 and 300 for E(B-V) and N, respectively. | ||||||||||
| From [2000MNRAS.311..120D]. | ||||||||||
| Assumed from the values given by [1993MNRAS.260..177P] for the other CNSFRs of this galaxy studied by | ||||||||||
| them. | ||||||||||
| From [1993MNRAS.260..177P]. | ||||||||||
The amount of ionized gas (M) associated to each star-forming complex has been obtained from our derived H luminosities using the relation given by [1990ApJ...356..389M] for an electron temperature of 10 K
where N is the electron density. The electron density for each region (obtained from the [Sii] 6717 / 6731 Å line ratio) has been taken from Díaz et al. (2007; see Chapter §5) for the CNSFRs of NGC 2903 and NGC 3351, and from [1993MNRAS.260..177P] for the regions in common and the nucleus of NGC 3310. For the rest of the regions of NGC 3310 we assume a value of N equal to 100 cm, the value given by [1993MNRAS.260..177P] for the other CNSFRs of this galaxy studied by them. For the nucleus of NGC 2903, N equal to 300 cm, typical of nuclear Hii regions, has been assumed. The electron density of the nucleus of NGC 3351 has been taken from [tesisdiego] (see Table 4.8).
4.7 Discussion
NGC 2903
The relations between the velocity dispersions of gas (as measured by the H and the [Oiii] emission lines) and stars (as measured by the IR Caii triplet in absorption) in the case of NGC 2903 are shown in Figure 2.5.1. H is shown in the upper panel, [Oiii] in the lower one. The straight line shows the one-to-one relation in both panels. Red circles in the upper panel correspond to gas velocity dispersions measured from the H emission line using a single Gaussian fit. Orange squares and magenta downward triangles correspond to the broad and narrow component respectively, for measurements performed using two-component Gaussian fits. The deviant point, marked with arrows, corresponds to the nucleus, which has low signal-to-noise ratio and for which the fits do not provide accurate results for the broad component. In the lower panel, red upward triangles, orange diamonds and magenta left triangles correspond to the values obtained by a single Gaussian fit, and to the broad and narrow components of the two Gaussian fits, respectively.
![[Uncaptioned image]](/html/0908.4285/assets/chapter4/disp-est-vs-gas-OIII-2903+X-tesis.png)
In general, the H velocity dispersions of the CNSFRs of NGC 2903 derived by a single Gaussian fit are lower than the stellar ones by about 25 km s, except for regions R7 and X, for which these values are very similar. These two regions also have the lowest velocity dispersions, and in the first of them the values derived using the two different techniques are very similar. On the other hand, a good agreement is found between the stellar velocity dispersions of the CNSFRs and those of the broad component of H. The narrow component shows velocity dispersions even lower than those obtained by single Gaussian fits, and similar to each other in all cases, with an average value equal to 24.5 2.2 km s, with the error given by the dispersion of the individual values. This average is represented as a magenta horizontal line in the upper panel of Figure 2.5.1, with its error as magenta dashed lines. This narrow component could be identified with ionized gas in a rotating disc. The broad component should then correspond to the gas response to the gravitational potential of the stellar cluster and therefore should, in principle, coincide with the stellar velocity dispersion.
This seems to be the case for the H line (see upper panel of Figure 2.5.1). In the case of the [Oiii] however, there seems to be an excess in the broad component velocity dispersion (orange diamonds in the Figure) which is found to be larger than the stellar one by about 35 km s (see Table 4.4). This extra component could be identified with peculiar velocities in the high ionization gas related to massive star winds or even supernova remnants. Since the H line is dominated by the narrow component, this peculiar velocity contributes negligibly to the line width.
To test the possibility of finding a spurious results due to the low signal-to-noise ratio of this weak [Oiii] emission line, we generates a synthetic spectrum with the measured characteristics and we added an artificial noise with a rms twice the observed one. We then measured the synthetic spectra with the same technique as the data, using also a double Gaussian fitting with the same initial parameters, and we obtain the same results within the observational errors.
The widths of the narrow [Oiii] component (magenta left triangles) are comparable to those of the H lines, and again show a relatively constant value, but in this case with a larger dispersion, giving = 26.2 4.2 km s.
The gas velocity dispersions derived for the nucleus from its H emission line is closer to those estimated for the CNSFRs from their [Oiii] 5007 Å emission lines than to those derived from H. This broad nuclear component has a velocity dispersion higher than by about 35 km s, and also the narrow one is higher than the average of the narrow components of the CNSFRs this time by approximately 20 km s (see upper panel of Figure 2.5.1). However, we have to take into account that this values are derived with a large error (in particular for the broad component) due to the low signal-to-noise ratio of our blue spectrum of the nucleus of NGC 2903. The single Gaussian fit to this recombination line gives a value similar to the stellar one (see Table 4.4). The nuclear and CNSFRs velocity dispersions estimated from the [Oiii] line have a similar behaviour, with the narrow component of the nucleus giving a gas velocity dispersion (27.2 7.1 km s) almost equal to the average of the CNSFRs.
The ratios between the fluxes in the narrow and broad components of the H emission lines of the CNSFRs are between 0.65 and 0.95, except for the weakest knot R7, for which it is about 1.46. For the [Oiii] emission line the ratio between the narrow and broad component fluxes vary between 0.06 (for R7) and 0.24. For the nucleus, the ratio between the narrow and broad component of the H emission line fluxes are approximately the same as in R7, 1.44, and the ratio between the narrow and broad [Oiii] fluxes is 0.29.
The radial velocities along the slit for each angular position of NGC 2903 as derived from the ionized gas emission lines, H and [Oiii] 5007 Å, and the stellar CaT absorptions are shown in both panels of Figure 2.5.1. The rotation curves seem to have the turnover points at the same positions as the star-forming ring, specially for the S2 slit position across the nucleus, as found in other galaxies (see [1988ApJ...334..573T, 1999ApJ...512..623D] and references therein). For the systemic velocity of NGC 2903, the derived values are consistent with those previously obtained by Planesas et al. (1997) and [1998AJ....115...62H], and with the velocity distribution expected for this type of galaxies [1987gady.book.....B].
![[Uncaptioned image]](/html/0908.4285/assets/chapter4/s2-2903-vel-red.png)
![[Uncaptioned image]](/html/0908.4285/assets/chapter4/s2-2903-disp-red.png)
The rotation velocities derived for both stars and [Oiii] 5007 Å, are in good agreement. The H velocities differ from the stellar ones in quantities similar to those differences shown by the two Gaussian components (v; see Table 4.4). This could be explained if the broad component dominates the single fit in [Oiii], and hence the measured velocity corresponds mainly to this component, while for H the dominant one is the narrow component.
In the upper and lower panels of Figure 2.5.1 we plot the velocity dispersions along the slit versus pixel number for slit position S1 and S2 of NGC 2903, respectively. These velocity dispersions have been derived from the gas emission lines, H and [Oiii], and the stellar absorption ones using the 2 and 3 px apertures for S1 and S2, respectively. We have also plotted the gas and stellar velocity dispersions derived for each region and the nucleus of NGC 2903 using the 5 px apertures. The values derived with wider apertures using a single Gaussian fit are approximately the average of the velocity dispersions estimated using the narrower apertures.
The estimated dynamical masses were derived through the virial theorem using the stellar velocity dispersions, estimated from the CaT absorptions features, and the cluster sizes, measured in the high spatial resolution WFPC2-PC1 HST image. For the individual clusters of NGC 2903 these masses are in the range between 1.4 10 and 1.13 10 M (see table LABEL:mass), with fractional errors between 9 and 25 per cent. The dynamical masses estimated for the whole CNSFRs (“sum”) are between 6.4 10 and 1.9 10 M, with fractional errors between 3 and 4 per cent. The dynamical mass derived for the nuclear region inside the inner 3.8 pc is 1.1 10 M, with a fractional error of about 9 per cent.
On the other hand, the masses of the ionizing stellar clusters of the CNSFRs, as derived from their H luminosities, are between 3.3 and 4.9 10 M for the star-forming regions, and 2.1 10 M for the nucleus (see Table 4.8). In column 11 of Table 4.8 we show a comparison (in percentage) between ionizing stellar masses of the circumnuclear regions and their dynamical masses. These values are approximately between 2 - 8 per cent for the CNSFRs, and 1 per cent for the nucleus of NGC 2903.
Finally, the masses of the ionized gas, also derived from their H luminosities, range between 6.1 10 and 1.3 10 M for the CNSFRs, and 3 10 M for the nucleus (see Table 4.8). They make up a small fraction of the total mass of the regions.
The masses of these young clusters, alternatively, have been obtained from the fitting of broad-band colours or spectra using stellar population synthesis models. [2001MNRAS.322..757A] from near-IR photometry in the H band and the model mass-to-light ratios from [1993ApJ...412...99R] with a single burst of star formation with Gaussian FWHM values of 1, 5 and 100 Myr, and a Salpeter IMF with lower and upper mass cut-offs of 1 and 80 M (the parameters of the model are described in detail in [2000ApJ...532..845A, 2001ApJ...546..952A]) estimated a total mass in the young stellar clusters of 2.1-3.6 10 M within the central 625 pc. This range in masses takes into account the spread of the age estimates, and thus a variation in the mass-to-light ratio, of these young stellar clusters. Using the mass-to-light ratio found by [1988ApJ...327..671T], Alonso-Herrero and collaborators estimated a mass in old stars of 2.7 10 M within the same region of NGC 2903. Likewise, they estimated the masses of the ionizing stellar population (which are even younger than the young stellar clusters defined by them) using the output from the evolutionary synthesis models. Our estimates of the masses of the bright Hii regions in the star-forming ring are similar to those found by them for the young clusters.
NGC 3310
![[Uncaptioned image]](/html/0908.4285/assets/chapter4/disp-est-vs-gas-OIII-3310-tesis.png)
Figure 2.5.1 shows the relations between the velocity dispersions of gas and stars for NGC 3310. In the upper panel we plot the relation derived using the H emission line, and in the lower one, that from the [Oiii]. In the first of these panels the violet circles, maroon squares and blue downward triangles correspond to the single Gaussian fit, and the broad and narrow component of the two-component Gaussian fits, respectively. The deviant points, marked with arrows, corresponds to the R1+R2 region, which has low signal-to-noise ratio and the cross-correlation does not provide accurate results. On the other hand, in the lower panel, violet upward triangles, maroon diamonds and blue left triangles correspond to the values obtained by a single Gaussian fit, and to the broad and narrow components of the two Gaussian fits, respectively. Again, the deviant points (R1+R2) are marked with arrows.
The H velocity dispersions of the CNSFRs of NGC 3310 derived by a single-component Gaussian fit are the same, within the errors, as the stellar ones, except for R1+R2 and R7, for which they are lower by about 50 and 25 km s, respectively. For R1+R2 this can be it can be due to an overestimation of . Given the relatively low metal abundance of NGC 3310 [1993MNRAS.260..177P] generally the emission lines have a very good signal-to-noise ratio in the spectra of the CNSFRs, while the red continuum depends on the particular case (see Figures 2.5.1 and 2.5.1, the spatial profiles and the spectra, respectively). On the other hand, the stellar velocity dispersions of the CNSFRs are lower than those of the broad component of H by about 20 km s, again except for R1+R2 where is greater by about 35 km s, and for R7 where and H broad are in good agreement. The narrow component of the CNSFRs shows velocity dispersions very similar for all the regions, with an average value of 23.0 1.3 km s, and is represented as a blue solid line in the upper panel of Figure 2.5.1, while the dashed lines of the same colour represent its error. We find the same behaviour for the two different components of the ionized gas and the stars both from H and [Oiii]. In all cases the gas narrow component has velocity dispersion lower than the stellar one, and the broad component are slightly over it. Again the narrow component may be associated with rotating gas within a disc-like structure. The broad component of the [Oiii] 5007 Å emission line (maroon diamonds in the Figure) is wider than the stellar lines by about 20 km s, except for R4+R5 (S2 slit) and R7 for which they are approximately similar. The narrow component of [Oiii] (blue left triangles in the Figure) shows a relatively constant value with an average of 20.9 1.8 km s (blue lines in the Figure).
In the nuclear region of the galaxy the stars and the broad component of the ionized gas, both for H and [Oiii] have the same width, with a of about 70 km s. The gas narrow component however shows a substantially lower velocity dispersion but still higher than shown by the CNSFRs by about 15 km s.
For regions J, X and Y we can not derive a stellar velocity dispersion due to the low signal-to-noise ratio of their continuum and the noise added by subtracting the large amount of emission lines present in their red spectra (see right panels of Figure 2.5.1). However, if we analyze the velocity dispersions derived from their strong emission lines in the blue spectral range we find values very similar to those of the CNSFRs (see Table 4.4).
In general, the broad and narrow component of the H have comparable fluxes. The ratios between the fluxes in the narrow and broad components of the H emission lines of the regions (including J, X and Y) vary from 0.95 to 1.65, except for R10 and R7 for which we find ratios of 0.65 and 2.5, respectively. For the nucleus we estimate a value of 0.55. The ratio of the narrow to broad [Oiii] fluxes is between 0.85 and 1.5, except again for R10 and R7, for which this value is 0.65 and 1.98, respectively. The nucleus of NGC 3310 presents a comparatively low value (0.33) for this ratio with respect to the CNSFRs.
Figure 2.5.1 presents the radial velocities derived from the H and [Oiii] emission lines and the CaT absorptions along the slit for each angular slit position of NGC 3310, S1 in the upper panel and S2 in the lower one. The rotation curves seem to have the turnover points located in or near the star-forming ring. Due to the relatively low metallicity of NGC 3310 [1993MNRAS.260..177P], the gas emission lines are very strong in the central zone of the galaxy and we can derive the radial velocity of the gas much further (up to 18 ) than for NGC 2903 and NGC 3351. However, the measurements of the radial velocities using the CaT absorption feature are confined approximately to a zone similar to in the other two cases. The gas H and [Oiii] 5007 Å radial velocities and the stellar ones are in very good agreement, except in the zone located around R4, where we find a difference between the gas and stars of about 30 to 40 km s. We must note that these differences can be due to a low signal-to-noise ratio of the stellar continuum emission in this zone of the galaxy.
![[Uncaptioned image]](/html/0908.4285/assets/chapter4/s2-3310-vel-red.png)
In both slit positions we can appreciate a very steep slope in the radial velocity curve as measured from the H and [Oiii], in very good agreement with each other. These strong gradients occur more or less at the same distance from the nucleus (8 ) toward the north-east of the galaxy, almost at the position where the two slits intersect (see Figures 4.6 and 4.8). These curves show a step in the radial velocity of about 70 and 90 km s for S1 and S2, respectively. In Figure 4.8 we indicate with two circles with radii of 8 and 18, the approximate position where this step is located and the distance from the nucleus up to where we can derive the radial velocities for S1. The stellar radial velocity of R1+R2 derived using the 5 px aperture (criss-crossed white-blue diamond in the lower panel of the Figure 2.5.1) are in very good agreement with the values derived from the gas emission lines.
A very similar result was found by [2007A&A...469..405P] using high spatial resolution spectra ( 0.07 px) and moderate spectral resolution (R = / 6000; given a resolution of 1.108 Å px at H) from the STIS-HST, and using a 2 2 on-chip binning for the non nuclear spectra. The position angle of their slits is 170 and three parallel positions were used, one of them passing across the nucleus and the other two with 0.2 offset to both sides. However, it must be noted that the H narrow band-filter image in Figure 2 of that work (the same ACS image presented by us) is rotated by 180 with respect to their quoted position, since the Jumbo region appears placed at the north-east of the nucleus (according to the orientation of the image given by these authors) while this region is located at the south-west (see e.g. [1984ApJ...284..557T, 1990MNRAS.242P..48T, 1993MNRAS.260..177P]). As was pointed out by Pastorini and collaborators, NGC 3310 shows a typical rotation curve expected for a rotating disc (a typical feature, [2006A&A...448..921M]) but the curve is disturbed. Besides, we can appreciate that in the zone near the Jumbo region there is a deviation from the circular rotation motion. The step in the radial velocity found by us is an effect of the spatial resolution. In Figure 3 of [2007A&A...469..405P], the better spatial resolution of the STIS-HST instrument resolves the steep gradient and completes the information missing in our data. The disturbed behaviour of the rotation curve of the gas in the galactic disc, characterized by non-circular motions, was also found by [1995A&A...300..687M] using Hi radio data; [1996A&A...309..403M] from Hi and Hi and Hii radio data and and [2001A&A...376...59K] using optical data. They found a strong streaming along the spiral arms, supporting the hypothesis of a recent collision with a dwarf galaxy that triggered the circumnuclear star formation during the last 10 yr. Besides, [1976A&A....49..161V] shows that the rotation centre of the gas is offset with respect to the stellar continuum (by 1.5 ). The central velocity of NGC 3310 derived by us is in very good agreement with that previously estimated by [1976A&A....49..161V, 1995A&A...300..687M, 1996A&A...309..403M, 1998AJ....115...62H, 2001A&A...376...59K]. The velocity distribution is also in very good agreement with that expected for this type of galaxies [1987gady.book.....B].
![[Uncaptioned image]](/html/0908.4285/assets/chapter4/s2-3310-disp-red.png)
The velocity dispersions along the slit versus pixel number for slit position S1 and S2 of NGC 3310 are plotted in the upper and lower panel of Figure 2.5.1, respectively. The gas velocity dispersions are derived from H and [Oiii] emission lines, and the stellar velocity dispersions from the CaT absorption features. For S1 we have plotted the results derived using the 2 px apertures; for S2, we used the 3 px ones, while for the actual regions and the nucleus we plot in the Figure the values derived using the 5 px apertures. It can be seen that the values estimated from the single Gaussian fit using this last aperture are approximately the average of those derived with the narrower apertures. The velocity dispersions, both for stars and gas, show a behaviour characteristic of a regular circular motion in a rotating disc, a smooth plateau and a peak in the centre. A similar result was found by [2007A&A...469..405P].
The estimated dynamical masses derived using the virial theorem for the individual clusters of NGC 3310, except for R1+R2, are between 1.8 and 7.1 10 M (see table LABEL:mass), with fractional errors between 16 and 32 per cent. The dynamical masses estimated for the whole CNSFRs (“sum”), except for R1+R2, are between 2.1 10 and 1.4 10 M, with fractional errors between 3 and 8 per cent. R1+R2 stellar velocity dispersion has a big associated error, so we do not give an explicit error for its derived mass. The individual clusters of this CNSFR derived using this value of the velocity dispersion present greater masses, between 1.2 and 2.4 10 M. However, if we assume that the relation between the gas and the stellar velocity dispersions follows a behaviour similar to those of the other CNSFRs of NGC 3310 (see Figure 2.5.1) these masses could be reduced by a factor of 2.3, giving individual masses between 5.2 10 and 1.0 10 M. In the same way, the total dynamical mass of R1+R2 is 9.1 10 M, which is reduced to 4.0 10 M assuming the same 2.3 factor. The dynamical mass derived for the nuclear region inside the inner 14.2 pc is 5.3 10 M, with a fractional error of about 11 per cent. This value is a somewhat higher than that derived by [2007A&A...469..405P] under the assumption of the presence of a super massive black hole (BH) in the centre of this galaxy. When they take into account the allowed disc inclinations, this BH mass varies in the range 5.0 10 - 4.2 10 M.
On the other hand, the masses of the ionizing stellar clusters of the CNSFRs, derived from their H luminosities, are between 8.7 10 and 2.1 10 M for the star-forming regions, and 3.5 10 M for the nucleus (see Table 4.8). These ionizing stellar masses are approximately between 1 - 7 per cent of their dynamical masses, and 5 per cent for the nucleus of NGC 3310. In the case of the Jumbo region this mass vary between 1.3 and 3.1 10 M whether we take the H luminosities from [1993MNRAS.260..177P] or [2000MNRAS.311..120D] respectively, probably because the estimated reddening constants in these two works are different (see Table 4.8). These different values of the luminosities can be due to the very complex structure of the region (see Figure 1 of both works) and differences in the selection of the zone used to measure the H fluxes. Besides, Pastoriza and colleagues used spectroscopic data while Díaz and collaborators used photometric images.
Finally, the masses of the ionized gas, range between 1.5 and 7.2 10 M for the CNSFRs, and 5 10 M for the nucleus, also derived from their H luminosities (see Table 4.8). They make up a small fraction of the total mass of the regions. As in the case of the masses of the ionizing stellar clusters of the Jumbo region and for the same reasons, the mass of the ionized gas derived using the H luminosities from [1993MNRAS.260..177P] or from [2000MNRAS.311..120D] are different, 3.93 and 9.52 10 M, respectively.
Comparing colours of the small-scale clusters from HST data with models, [2002AJ....123.1381E] suggest that most of these clusters contain masses from 10 M to several times 10 M. For the large-scale “hot-spots” they estimate masses ranging from 10 to several times 10 M. For their 108+109 region (almost equivalent to the Jumbo region) they derived a mass of 6.3 M, similar to the value derived by [1993MNRAS.260..177P], 7 M. These last authors estimated from the unusually large H and Heii emission line luminosities, that this region must contain 220 WN and 570 OB stars. Regarding other regions, Elmegreen et al. derived a mass of M for their region 78 using the NIR data and 7.7 M from their optical ones. Besides, they found 17 candidate SSCs, with masses in the range between 2 to 4.5 M. Some of them coincide with the CNSFRs studied by us, such as 48, 49 and 50, approximately coincident with R5 and R6. These SSCs are mostly in the innermost southern spiral arm, with some in the northern one or outside the southern arm of the ring [2002AJ....123.1381E]. Their derived (J-H) colours suggest two different populations of SSCs, a very young of few million years and an older one in a range between 10 and 50 million years, with the younger clusters located in the northern part of the ring.
NGC 3351
The upper panel of Figure 2.5.1 shows the relation between the velocity dispersions of gas and stars. Light green circles correspond to gas velocity dispersions measured from the H emission line using a single Gaussian fit. Dark green squares and cyan downward triangles correspond to measurements performed using two-component Gaussian fits, squares for the broad component and triangles for the narrow one. The straight line shows the one-to-one relation. As a general result, the H velocity dispersions derived by a single Gaussian fit are lower than the stellar ones by about 25 km s. This is also the case for the Paschen lines in the two regions where they could be measured. On the other hand, a good agreement is found between the stellar velocity dispersions and those of the broad component of H. The deviant point, marked with arrows, corresponds to the region with the lowest signal-to-noise ratio (R5) for which the fits do not provide accurate results. The narrow component shows velocity dispersions even lower than those obtained by single Gaussian fits. The ratio between the fluxes in the narrow and broad components is between 0.7 and 0.95 (except for the case of R5 for which no meaningful result is found).
![[Uncaptioned image]](/html/0908.4285/assets/chapter4/disp-est-vs-gas-OIII-3351-tesis.png)
The lower panel of Figure 2.5.1 shows the relation between the stellar velocity dispersions and those of the [Oiii] emission line measured by both single- and two-component Gaussian fits, which due to the weakness of the line (see Figure 2.5.1), could be done in only four cases, corresponding to the two slit positions on regions R2 and R3. In this case, the broad component seems to dominate the width of the emission line which agrees with the stellar one. The width of the narrow component, in the cases in which the two-component fit was possible, is comparable to that of the narrow component of the H line.
The narrow components of the H emission line show similar values, with an average equal to 22.4 2.5 km s. This average is represented as a cyan horizontal line in the upper panel of Figure 2.5.1, with its error as cyan dashed lines. A very similar behaviour is found for the [Oiii] emission line with an average value of 24.1 1.7 km s, and is shown in the lower panel of the Figure.
Figure 2.5.1 shows the radial velocities along the slit for each slit position in NGC 3351 as derived from the ionized gas emission lines and the stellar absorptions. The turnover points of the rotation curves seem to be located at the same position than the star-forming ring, specially for the S3 slit position that crosses the centre of the galaxy. For the systemic velocity of NGC 3351, the derived values are consistent with those previously obtained by [1975ApJ...199...39R] and Planesas et al. (1997), and with the velocity distribution expected for this type of galaxies [1987gady.book.....B].
![[Uncaptioned image]](/html/0908.4285/assets/chapter4/s1-3351-vel-red.png)
![[Uncaptioned image]](/html/0908.4285/assets/chapter4/s3-3351-vel-red.png)
![[Uncaptioned image]](/html/0908.4285/assets/chapter4/s1-3351-disp-red.png)
![[Uncaptioned image]](/html/0908.4285/assets/chapter4/s3-3351-disp-red.png)
The rotation velocities derived for both stars and gas are in reasonable agreement, although in some cases the gas seems to rotate somewhat faster than the stars. In fact, in the lower panel of Figure 2.5.1, which corresponds to the slit position passing through the nucleus, it is interesting to note that at the maximum and minimum of the velocity curve, which correspond approximately to the positions of regions R5 and R2, the H emission line shows velocities lower and higher than the stars by about 25 and 30 km s, respectively. This could be interpreted as motions of the ionized hydrogen deviating from rotation and consistent with a radial infall to the central regions of the galaxy. A similar result was found by Rubin et al. (1975) from high dispersion observations of the H line in the central region of this galaxy. Their preferred model for the fitting of the kinematical data consists of gas which is rotating and contracting with V = 126 16 km s and V = 34 11 km s.
In the three panels of Figure 2.5.1 we plot the velocity dispersions along the slit versus pixel number for slit position S1 (upper), S2 (middle) and S3 (lower) of NGC 3351, respectively. Again, these velocity dispersions have been derived from the gas emission lines, H and [Oiii], and the stellar absorption ones. We have also plotted the gas and stellar velocity dispersions derived for each region and the nucleus of NGC 3351 using the 5 px aperture. For the broad H component of R5 in S3 we do not plot the error bars. As in the cases of NGC 2903 and NGC 3310, the values derived with the wider apertures (five pixels) using a single Gaussian fitting are approximately the average of the velocity dispersions estimated using the extractions made with the narrower apertures.
Our values of the dynamical masses have been derived from stellar velocity dispersion measurements as mapped by the CaT absorption lines and the sizes measured on an HST image. They are in the range between 4.9 10 and 4.5 10 M for the CNSFRs and is 3.5 10 M for the nuclear region inside the inner 11.3 pc (see Table LABEL:mass). The fractional errors of the dynamical masses of the CNSFRs are between 3 and 18 per cent, and is about 3 per cent for the nucleus. The masses derived here for the circumnuclear star-forming individual clusters are between 1.8 and 8.7 10 M.
Other estimates of the masses of these regions have been obtained from the fitting of broad-band colours or spectra with the use of stellar population synthesis models. [1997AJ....114.1850E] from near-IR photometry in the J and K bands and models by [1995ApJS...96....9L] for instantaneous star formation and solar and twice solar metallicity, derive masses of the CNSFRs from 1 to 10 10 M. [1997ApJ...484L..41C] from UV [International Ultraviolet Explorer (IUE)] spectra and instantaneous burst models by [1991A&AS...88..399M] derived a value of 3 10 M for the whole SF ring. In both cases, in fact, these observables trace the young massive population which constitutes only part of the total mass.
The masses of the ionizing stellar clusters of the CNSFRs of NGC 3351, as derived from their H luminosities, are between 8.0 10 and 2.5 10 M for the star-forming regions, and is 6.0 10 M for the nucleus (see Table 4.8). In column 11 of Table 4.8 we show a comparison (in percentage) between ionizing stellar masses of the circumnuclear regions and their dynamical masses. These values vary approximately in the range 2 - 16 per cent for the CNSFRs, and is 1.7 per cent for the nucleus. Since the CaT absorption features are dominated by young stars (see discussion above, Section 4.5), and the M/M fraction is still remarkably small in the case of the CNSFRs composed of single knots (R4 and R5, for which the dynamical mass is most robustly estimated) we can assume that our upper limits to the dynamical masses, in spite of the limitations of the method used to derive them, are rather tight. Then, our results concerning the M/M fraction are robust.
Finally, the masses of the ionized gas vary between 7 10 and 8.7 10 M for the CNSFRs, and is 2 10 M for the nucleus (see Table 4.8). Again, these masses of the ionized gas make up a small fraction of the total mass of the regions.
![[Uncaptioned image]](/html/0908.4285/assets/chapter4/disp-est-vs-gas-OIII-todos-tesis-1comp.png)
![[Uncaptioned image]](/html/0908.4285/assets/chapter4/disp-est-vs-gas-OIII-todos-tesis-narrow.png)
![[Uncaptioned image]](/html/0908.4285/assets/chapter4/disp-est-vs-gas-OIII-todos-tesis-broad.png)
Global analysis
In Figures 2.5.1, 2.5.1 and 2.5.1 we present the different relations found between the velocity dispersions measured for the whole sample of CNSFRs. Figure 2.5.1 shows the velocity dispersion of the gas as measured from the H and the [Oiii] emission lines versus the stellar one. The gas velocity dispersions have been measured using a single Gaussian fit. Figure 2.5.1 shows the same graph, but with the gas velocity dispersion corresponding to the narrow velocity component as measured from the two-component fit. Finally, Figure 2.5.1 shows this last graph but for the broad velocity component. For the three Figures the upper panel shows the values derived from H emission line and the lower one, those derived from the [Oiii] 5007 Å line. The red solid lines in Figure 2.5.1 represent the average of the narrow components of all the CNSFRs and the red dashed lines their errors.
The behaviour of the velocity dispersion of the CNSFRs of NGC 2903 and NGC 3351 derived from their H and the [Oiii] emission lines measured using a single Gaussian fit are very different (compare upper and lower panels of Figure 2.5.1). While the values derived for the first line are always lower than the stellar velocity dispersion, approaching the one-to-one relation for the lowest values, in the case of the collisional line, the gas velocity dispersions are always greater than the stellar ones by about 20 km s. On the other hand, the values derived using these two emission lines for NGC 3310 are in very good agreement and similar to the stellar ones in almost all cases (lower by about 25 km s for R7). R1+R2 in NGC 3310 seems to be a special case as discussed above.
The velocity dispersions derived from the narrow components of the two Gaussian fit show a relatively constant value for the whole sample (see Figure 2.5.1). In both cases, H and [Oiii], the global average value is equal to 23.1 km s, with errors of 1.1 and 1.4 km s, respectively. In the case of (Figure 2.5.1) the broad components show velocity dispersions derived from the H line are in very good agreement with the stellar ones, except for some regions (four) of NGC 3310 whose estimated broad H components are greater by about 20 km s, and two deviant points: one from NGC 3310 (R1+R2) and another one from NGC 3351 (R5). The broad components derived from the [Oiii] emission line show velocity dispersions also greater than the stellar ones, but in these cases by about 30 km s, except for a couple of exceptions in NGC 3310, and the deviant point of the same galaxy. The difference between the narrow component of the ionized gas on one hand, and the broad component and stars on the other, could be interpreted by assuming that part of the emission comes from gas that is confined in the disc and supported by rotation while the stars and that portion of the gas related to the star-forming regions are mostly supported by dynamical pressure (see [2004A&A...424..447P] and references therein).
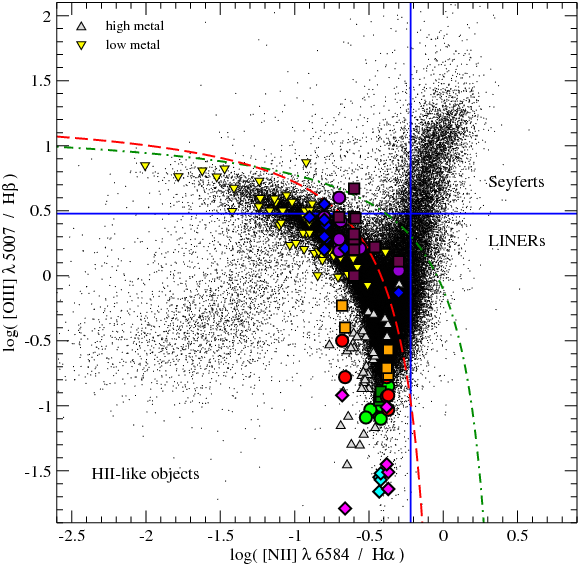
The presence of two different gaseous components could have an effect on the classification of the activity in the central regions of galaxies through diagnostic diagrams. We have plotted these two components individually, together with the value obtained by fitting a single Gaussian, for the three studied galaxies, in Figure 4.55. This figure shows the location of the CNSFRs and of the nuclei of the observed galaxies in the [Oiii]/H versus [Nii]/H diagram ([1981PASP...93....5B]; BPT), together with a sample of emission line galaxies (including Hii-like objects) from the Sloan Digital Sky Survey - Data Release 3 (SDSS-DR3) (López, 2005) and Hii regions from the sample of [2005MNRAS.361.1063P]. This BPT diagram clearly shows that the two systems are segregated in the cases of NGC 2903 and NGC 3351, with the narrow component showing the lowest excitation and occupying the same position in the diagram as the starburst systems in the SDSS data set with the lowest excitation found. However, in the case of NGC 3310, the [Oiii]/H ratios of the different fittings and components are more or less equal. The studied regions of NGC 3310 are located in the BPT diagram among the low-metallicity Hii regions from the sample of Pérez-Montero and Díaz (2005), which is in agreement with the metal abundances derived by [1993MNRAS.260..177P]. It should be noted that we can discriminate between line ratios of the two separate velocity components only for [Oiii]/H since we do not have the necessary high dispersion data for the [Nii] and H lines. In fact, for the CNSFRs of NGC 3310, we have applied an artificial offset to the log([Nii]/H) of -0.1 and 0.1 dex for the narrow and broad components, respectively, for illustrative purposes only.
It is clearly of major interest to find out how widespread is the presence of two distinct components in the emission lines in ionized regions and what is its influence on the observed line ratios for several reasons. Firstly, a change in position in the diagnostic diagrams would certainly affect the classification of the activity in the central regions of the concerned galaxies. Secondly, it will affect the inferences about the nature of the source of ionization in the two components. Thirdly, it could have an influence on the gas abundance determinations given that the ratio of the narrow to the broad components of H is about 1. Clearly it is not possible to use global line ratios to estimate gaseous abundances if the permitted and forbidden line fluxes are partially originated in different kinematical systems. To disentangle the origin of these two components it will be necessary to map these regions with high spectral and spatial resolution and much better S/N ratio in particular for the O lines. Three-dimensional (3D) spectroscopy with Integral Field Units (IFUs) would be the ideal tool to approach this issue.
We have found that only two of the observed regions, R4 and R5 of NGC 3351, seem to possess just one knot showing up in the continuum image and coincident with the H emission. The sizes of these knots are 2.9 and 3.2 pc, respectively. The rest of the regions are made up of several knots which presumably correspond to individual star clusters. Their sizes are between 1.5 and 4.0 pc for NGC 2903, between 2.2 and 6.2 pc for NGC 3310, and between 1.7 and 4.9 pc for NGC 3351. In all the cases the small sizes are at the limit of the resolution. For comparison, the size of cluster A in the BCD/amorphous galaxy NGC 1569 [1985AJ.....90.1163A] is 1.9 pc, as given by [1995AJ....110.2665M]. The sizes and absolute visual magnitudes estimated for each individual star cluster (e.g. M = -12.55 for R4 of NGC 3351 derived from the HST image) are in the ranges established by [1995AJ....110.2665M] in the definition of a super star cluster (SSC).
Using the stellar velocity dispersion measurements as mapped by the CaT absorption lines, the sizes measured on the HST image and the virial theorem we have derived values of the dynamical masses, under the assumption that the systems are spherically symmetric, gravitationally bound and have isotropic velocity distribution. Masses derived from the H velocity dispersion under the assumption of a single component for the gas would have been underestimated by factors of between approximately 2 and 4.
The values of the dynamical masses of the individual clusters derived by us for the CNSFRs of these three galaxies are several times the mass derived for the SSC A in NGC 1569 by [1996ApJ...466L..83H] from stellar velocity dispersion measurements using red (6000 Å) spectra. The mass of SSC A is (3.30.5) 10 M. Our estimated masses are between 4.2 and 33 times this mass. Besides, they are larger than masses derived kinematically for SSC in irregular galaxies [2003ApJ...596..240M, 2004AJ....128.2295L] and also larger than those derived by [2002AJ....123.1411B] for the individual circumnuclear clusters of NGC 4314 from HST imaging data following the procedure of [1999AJ....117..764E], which are in the range 0.2 10 M 1.6 10 M. However, the H luminosities of the NGC 4314 clusters are also lower than those of NGC 2903, NGC 3310 and NGC 3351 by factors of about 40 for the first and third galaxy, and 50 for the second one.
It must be noted that we have measured the size of each knot (typically between 3 and 5 pc), but the stellar velocity dispersion corresponds to the integrated CNSFR wider area containing several knots. The use of these wider size scale velocity dispersion measurements to estimate the mass of each knot, leads us to overestimate the mass of the individual clusters, and hence of each CNSFR.
However, as can be seen in the HST-NICMOS images (Figures 4.5, 4.7 and 4.10), the CNSFRs are clearly visible in the IR and dominate the light inside the apertures observed. All the regions analyzed show up very prominently in the near-IR and therefore we can assume that the light at the CaT wavelength region is dominated by the stars in the clusters. The IR CaT is very strong, in fact the strongest stellar feature, in very young clusters, i.e. older than 4 Myr [1990MNRAS.242P..48T]. Besides, we detect a minimum in the velocity dispersion at the position of the clusters, indicating that they are kinematically distinct, and the values derived with the widest apertures (five pixels) using a single Gaussian fitting are approximately the average of the velocity dispersions estimated using the extractions made with the narrower apertures (see Figures 2.5.1, 2.5.1 and 2.5.1). We can not be sure though that we are actually measuring their velocity dispersion and thus prefer to say that our measurements of and hence dynamical masses constitute upper limits. Although we are well aware of the difficulties, still we are confident that these upper limits are valid and important for comparison with the gas kinematic measurements.
Another important effect that can affect to the estimated dynamical masses is the presence of binaries among the red supergiant and red giant populations from which we have estimated the stellar velocity dispersions. On the basis of multislit spectroscopy of 180 stars in the ionizing cluster of 30 Doradus in the LMC, [2001A&A...380..137B] studied the possible influence of spectroscopic binaries in the radial velocity dispersion. In a recent work, Bosch et al. (2008; private communication) using GMOS-GEMINI data investigated the presence of binary stars within the ionizing cluster of 30 Doradus. From a three epoch observing run they detected a rate of candidate to be binary systems within their OB stars sample of 48 % (25 out of 52 stars). Interestingly enough, this detection rate is consistent with a spectroscopic population of 100 % binaries, when the observational parameters described in [2001RMxAC..11...29B] are set for their observations. Their final sample of ‘single’ stars (after removing their confirmed or candidate binaries) decreased to 26 stars, still enough to calculate a representative value of the stellar radial velocity dispersion, for which they estimated a value of 8.3 km s. When they derived from a single GMOS observation epoch, they found values as high as 30 km s, consistent with the values derived from NTT observations by [2001A&A...380..137B].
Although the environment of our CNSFRs is very different from that of 30 Dor and the stellar components of the binary systems studied by Bosch and collaborators (O and early B type stars) are very different from those stars in our regions where the CaT arise (red supergiants), this is a very illustrative observational example of this problem. The orbital motions of the stars in binary (multiple) systems produce an overestimate of the velocity dispersions and hence of the dynamical masses. The single-star assumption introduces a systematic error that depends on the properties of the star cluster and the binary population, with an important effect on the cluster mass if the typical orbital velocity of a binary component is of the order of, or larger than, the velocity dispersion of the single/binary stars in the potential of the cluster [2007arXiv0710.1207K]. As was pointed out by these authors, the relative weights between the single and binary stars in the velocity dispersion measurements depend on the binary fraction, which, together with the semi-major axis or period distribution, are the most important parameters to determine whether the binary population affects the estimated dynamical masses. Their simulations indicate that the dynamical mass is overestimated by 70 % for a measured stellar velocity dispersion in the line of sight of 1 km s, 50 % for 2 km s, and 5 % for 10 km s. They conclude that most of the known dynamical masses of massive star clusters are only mildly affected by the presence of binaries. Hence, for our clusters, where the smallest estimated velocity dispersion is 31 km s, we can assume that the contribution of binaries to the stellar velocity dispersions is not that important. Moreover, the binary fraction of the red supergiants and red giants in this type of circumnuclear and typically high metal rich environment is not known.
The masses of the ionizing stellar clusters of the circumnuclear regions, as derived from their H luminosities under the assumption that the regions are ionization bound and without taking into account any photon absorption by dust (see Table 4.8), are comparable to that derived by [1995ApJ...439..604G] for the circumnuclear region A in NGC 7714 (5.110 M) and so are the masses of the ionized gas (310 M) as can be seen from Table 4.8. In all the cases the masses of the ionized gas make up a small fraction of the total mass of the regions. We have derived both the masses of the ionizing stellar clusters and of the ionized gas from the H luminosity of the CNSFRs assuming that they consist of one single component. However, if we consider only the broad component whose kinematics follows that of the stars in the regions, all derived quantities would be smaller by a factor of 2.
4.8 Summary and conclusions
We have measured gas and stellar velocity dispersions in seventeen CNSFRs and the nuclei of three barred spirals, NGC 2903, NGC 3310 and NGC 3351 (four, eight and five CNSFRs, respectively). The stellar velocity dispersions have been measured from the CaT lines at 8494, 8542, 8662 Å, while the gas velocity dispersions have been measured by Gaussian fits to the H 4861 Å and the [Oiii] 5007Å emission lines on high dispersion spectra.
Stellar velocity dispersions are between 31 and 73 km s. In the case of NGC 2903 and NGC 3351 ( between 37 and 65, and between 39 and 67 km s, respectively) these values are about 25 km s larger than those measured for the gas from the H emission line using a single Gaussian fit. For NGC 3310 the stellar (between 31 and 73 km s) and gas velocity dispersion are in relatively good agreement, with the first being slightly larger. The [Oiii] 5007 Å presents velocity dispersions almost coincident with the stellar ones, or slightly, for NGC 2903 and NGC 3351, while in the case of NGC 3310 its behaviour is very similar to that shown by the H line. However, the best Gaussian fits involved two different components for the gas: a “broad component” with a velocity dispersion similar to that measured for the stars for NGC 2903 and NGC 3351, and larger by about 20 km s for NGC 3310, and a “narrow component” with a velocity dispersion lower than the stellar one by about 30 km s. This last component seems to have a relatively constant value for all the studied CNSFRs in these three galaxies, with estimated values close to 25 km s for the two gas emission lines. The velocities of the two components of the multi-Gaussian fits in the CNSFRs of NGC 3351 are the same within the observational errors, but in the cases of NGC 2903 and NGC 3310 we find a shift between the narrow and the broad component that vary between -25 and 35 km s in radial velocity.
When plotted in a [Oiii]/H versus [Nii]/H diagram, the two systems are clearly segregated for the high-metallicity regions of NGC 2903 and NGC 3351, with the narrow component having the lowest excitation and being among the lowest excitation line ratios detected within the SDSS data set of starburst systems. In the regions of the low-metallicity galaxy these two components and those values derived using the single Gaussian fit are very similar but it should be remembered that no comparable information exists for the [Nii]/H ratio.
The dynamical masses estimated from the stellar velocity dispersion using the virial theorem for the CNSFRs of NGC 2903 are in the range between 6.4 and 1.9 M and is 1.1 for its nuclear region inside the inner 3.8 pc. In the case of NGC 3310 the masses are in the range between 2.1 and 1.4 M for the CNSFRs and for the nuclear region inside the inner 14.2 pc is 5.3 M. For NGC 3351 the dynamical masses are in the range between 4.9 and 4.5 M, and is 3.5 for its nuclear region inside the inner 11.3 pc. Masses derived from the H velocity dispersions under the assumption of a single component for the gas would have been underestimated by factors between 2 and 4 approximately.
The derived masses for the individual clusters are between 1.4 10 and 1.1 10 M, between 1.8 and 7.1 10 M, and between 1.8 and 8.7 10 M for NGC 2903, NGC 3310 and NGC 3351, respectively. Then, globally, the masses of these individual clusters vary between 1.4 10 and 1.1 10 M. These values are between 4.2 and 33 times the mass derived for the SSC A in NGC 1569 by [1996ApJ...466L..83H] and larger than other kinematically derived SSC masses.
Masses of the ionizing stellar clusters of the CNSFRs have been derived from their H luminosities under the assumption that the regions are ionization bound and without taking into account any photon absorption by dust. For the regions of NGC 2903 these masses are between 3.3 and 4.9 M, and is 2.1 for its nucleus. The values derived in NGC 3310 are between 8.7 and 2.1 M for the star-forming regions, and is 3.5 for the nucleus. For NGC 3351 are between 8.0 10 and 2.5 10 M for the regions, and is 6.0 10 M for its nuclear region (see table 4.8). Thus, the ionizing stellar cluster studied in these three galaxies vary between 8.0 10 and 4.9 M. Therefore, the ratio of the ionizing stellar population to the total dynamical mass is between 0.01 and 0.16. These values of the masses of the ionizing stellar clusters of the CNSFRs are comparable to that derived by [1995ApJ...439..604G] for the circumnuclear region A in NGC 7714.
Derived masses for the ionized gas, also from their H luminosities, vary between 6.1 and 1.3 M for the regions and is 3 M for the nucleus of NGC 2903; between 1.5 and 7.2 M for the CNSFRs and is 5 M for the nucleus of NGC 3310; and between 7.0 10 and 8.7 10 M for the CNSFRs of NGC 3351, and is 2 10 M for its nucleus. These values are also comparable to that derived by [1995ApJ...439..604G].
It is interesting to note that, according to our findings, the SSC in CNSFRs seem to contain composite stellar populations. Although the youngest one dominates the UV light and is responsible for the gas ionization, it constitutes only about 10 per cent of the total. This can explain the low EWs of emission lines measured in these regions. This may well apply to the case of other SSC and therefore conclusions drawn from fits of single stellar population (SSP) models should be taken with caution (e.g. [2003ApJ...596..240M, 2004AJ....128.2295L]). Furthermore, the composite nature of the CNSFRs means that star formation in the rings is a process that has taken place over time periods much longer than those implied by the properties of the ionized gas.
The observed stellar and [Oiii] rotational velocities of NGC 2903 are in good agreement, while the H measurements show shifts similar to those find between the narrow and the broad components. This different behaviour can be explained if the positions of the single Gaussian fits are dominated by the broad component in the case of the [Oiii] emission line and by the narrow one in the case of the H. The rotation curve corresponding to the position going through the nucleus shows maximum and minimum values at the positions of the circumnuclear regions, as observed in other galaxies with CNSFRs.
In the case of NGC 3310 the rotation curve shows a typical feature, with the presence of some perturbations, in particular near the location of the Jumbo region. In this galaxy the values derived from the gas emission lines and the stellar absorption features are in very good agreement. Again, the position going through the nucleus shows maximum and minimum values more or less coincident with the location of the CNSFRs.
For NGC 3351, the rotation velocities derived for both stars and gas are in reasonable agreement, although in some cases the gas shows a velocity slightly different from that of the stars. The rotation curve corresponding to the position going through the centre of the galaxy also shows maximum and minimum values at the position of the circumnuclear ring. The differences in velocity between gas and stars can be interpreted as motions of the ionized hydrogen deviating from rotation and consistent with a radial infall to the central regions of the galaxy. Our results are consistent with those found by Rubin et al. (1975) and would yield an infall velocity of about 25 km s.
The existence of more than one velocity component in the ionized gas corresponding to kinematically distinct systems, deserves further study. Several results derived from the observations of the different emission lines could be affected, among others: the classification of the activity in the central regions of galaxies, the inferences about the nature of the source of ionization, the gas abundance determinations, the number of ionizing photons from a given region and any quantity derived from them. To disentangle the origin of these two components it will be necessary to map these regions with high spectral and spatial resolution and much better S/N ratio in particular for the O lines. High resolution 3D spectroscopy with IFUs would be the ideal tool to approach this issue.
Bibliography
- Abazajian et al., 2004 Abazajian, K., Adelman-McCarthy, J. K., Agüeros, M. A., Allam, S. S., Anderson, K., Anderson, S. F., Annis, J., Bahcall, N. A., Baldry, I. K., Bastian, S., and 143 coauthors: 2004, Astron. J. 128, 502
- Abazajian et al., 2005 Abazajian, K., Adelman-McCarthy, J. K., Agüeros, M. A., Allam, S. S., Anderson, K. S. J., Anderson, S. F., Annis, J., Bahcall, N. A., Baldry, I. K., Bastian, S., and 144 coauthors: 2005, Astron. J. 129, 1755
- Adelman-McCarthy et al., 2008 Adelman-McCarthy, J. K., Agüeros, M. A., Allam, S. S., Allende Prieto, C., Anderson, K. S. J., Anderson, S. F., Annis, J., Bahcall, N. A., Bailer-Jones, C. A. L., Baldry, I. K., and 153 coauthors: 2008, Astrophys. J., Suppl. Ser. 175, 297
- Adelman-McCarthy et al., 2006 Adelman-McCarthy, J. K., Agüeros, M. A., Allam, S. S., Anderson, K. S. J., Anderson, S. F., Annis, J., Bahcall, N. A., Baldry, I. K., Barentine, J. C., Berlind, A., and 131 coauthors: 2006, Astrophys. J., Suppl. Ser. 162, 38
- Allende-Prieto et al., 2001 Allende-Prieto, C., Lambert, D. L., and Asplund, M.: 2001, Astrophys. J. Letters 556, L63
- Alloin et al., 1979 Alloin, D., Collin-Souffrin, S., Joly, M., and Vigroux, L.: 1979, Astron. Astrophys. 78, 200
- Alloin and Nieto, 1982 Alloin, D. and Nieto, J.-L.: 1982, Astron. and Astrophys. Suppl. Sries 50, 491
- Aloisi et al., 1999 Aloisi, A., Tosi, M., and Greggio, L.: 1999, Astron. J. 118, 302
- Alonso-Herrero et al., 2001a Alonso-Herrero, A., Engelbracht, C. W., Rieke, M. J., Rieke, G. H., and Quillen, A. C.: 2001a, Astrophys. J. 546, 952
- Alonso-Herrero et al., 2000 Alonso-Herrero, A., Rieke, G. H., Rieke, M. J., and Scoville, N. Z.: 2000, Astrophys. J. 532, 845
- Alonso-Herrero et al., 2001b Alonso-Herrero, A., Ryder, S. D., and Knapen, J. H.: 2001b, Mon. Not. R. Astron. Soc. 322, 757
- Álvarez-Álvarez, 2002 Álvarez-Álvarez, M.: 2002, PhD Thesis, Universidad Autónoma de Madrid
- Arp and Sandage, 1985 Arp, H. and Sandage, A.: 1985, Astron. J. 90, 1163
- Asari et al., 2007 Asari, N. V., Cid Fernandes, R., Stasińska, G., Torres-Papaqui, J. P., Mateus, A., Sodré, L., Schoenell, W., and Gomes, J. M.: 2007, Mon. Not. R. Astron. Soc. 381, 263
- Asplund et al., 2005 Asplund, M., Grevesse, N., and Sauval, A. J.: 2005, in T. G. Barnes, III and F. N. Bash (eds.), Cosmic Abundances as Records of Stellar Evolution and Nucleosynthesis, Vol. 336 of Astronomical Society of the Pacific Conference Series, pp 25–+
- Athanassoula, 1992a Athanassoula, E.: 1992a, Mon. Not. R. Astron. Soc. 259, 328
- Athanassoula, 1992b Athanassoula, E.: 1992b, Mon. Not. R. Astron. Soc. 259, 345
- Badnell, 2006 Badnell, N. R.: 2006, Astron. Astrophys. 447, 389
- Bagnuolo, 1976 Bagnuolo, Jr., W. G.: 1976, Ph.D. thesis, AA(California Inst. of Tech., Pasadena.)
- Baldwin et al., 1981 Baldwin, J. A., Phillips, M. M., and Terlevich, R.: 1981, Publ. Astron. Soc. Pac. 93, 5
- Baldwin et al., 1982 Baldwin, J. A., Spinrad, H., and Terlevich, R.: 1982, Mon. Not. R. Astron. Soc. 198, 535
- Balick and Heckman, 1981 Balick, B. and Heckman, T.: 1981, Astron. Astrophys. 96, 271
- Balick and Sneden, 1976 Balick, B. and Sneden, C.: 1976, Astrophys. J. 208, 336
- Balzano, 1983 Balzano, V. A.: 1983, Astrophys. J. 268, 602
- Barker, 1980 Barker, T.: 1980, Astrophys. J. 240, 99
- Barmby et al., 2000 Barmby, P., Huchra, J. P., Brodie, J. P., Forbes, D. A., Schroder, L. L., and Grillmair, C. J.: 2000, Astron. J. 119, 727
- Barth et al., 1995 Barth, A. J., Ho, L. C., Filippenko, A. V., and Sargent, W. L.: 1995, Astron. J. 110, 1009
- Bastian et al., 2005 Bastian, N., Gieles, M., Lamers, H. J. G. L. M., Scheepmaker, R. A., and de Grijs, R.: 2005, Astron. Astrophys. 431, 905
- Bastian et al., 2006 Bastian, N., Saglia, R. P., Goudfrooij, P., Kissler-Patig, M., Maraston, C., Schweizer, F., and Zoccali, M.: 2006, Astron. Astrophys. 448, 881
- Benedict et al., 2002 Benedict, G. F., Howell, D. A., Jørgensen, I., Kenney, J. D. P., and Smith, B. J.: 2002, Astron. J. 123, 1411
- Benjamin et al., 1999 Benjamin, R. A., Skillman, E. D., and Smits, D. P.: 1999, Astrophys. J. 514, 307
- Binney and Tremaine, 1987 Binney, J. and Tremaine, S.: 1987, Galactic dynamics, Princeton, NJ, Princeton University Press, 1987, 747 p.
- Boer and Schulz, 1993 Boer, B. and Schulz, H.: 1993, Astron. Astrophys. 277, 397
- Bosch and Meza, 2001 Bosch, G. and Meza, A.: 2001, in Revista Mexicana de Astronomia y Astrofisica Conference Series, Vol. 11 of Revista Mexicana de Astronomia y Astrofisica, vol. 27, pp 29–+
- Bosch et al., 2001 Bosch, G., Selman, F., Melnick, J., and Terlevich, R.: 2001, Astron. Astrophys. 380, 137
- Bosch et al., 2008 Bosch, G., Terlevich, E., and Terlevich, R.: 2008, Mon. Not. R. Astron. Soc.(submitted)
- Bottinelli et al., 1984 Bottinelli, L., Gouguenheim, L., Paturel, G., and de Vaucouleurs, G.: 1984, Astron. and Astrophys. Suppl. Sries 56, 381
- Bournaud et al., 2004 Bournaud, F., Duc, P.-A., Amram, P., Combes, F., and Gach, J.-L.: 2004, Astron. Astrophys. 425, 813
- Bresolin, 2007 Bresolin, F.: 2007, Astrophys. J. 656, 186
- Bresolin et al., 2004 Bresolin, F., Garnett, D. R., and Kennicutt, Jr., R. C.: 2004, Astrophys. J. 615, 228
- Bresolin and Kennicutt, 1997 Bresolin, F. and Kennicutt, Jr., R. C.: 1997, Astron. J. 113, 975
- Bresolin et al., 1999 Bresolin, F., Kennicutt, Jr., R. C., and Garnett, D. R.: 1999, Astrophys. J. 510, 104
- Bresolin et al., 2005 Bresolin, F., Schaerer, D., González-Delgado, R. M., and Stasińska, G.: 2005, Astron. Astrophys. 441, 981
- Brocklehurst, 1971 Brocklehurst, M.: 1971, Mon. Not. R. Astron. Soc. 153, 471
- Bushouse, 1987 Bushouse, H. A.: 1987, Astrophys. J. 320, 49
- Bushouse et al., 1998 Bushouse, H. A., Telesco, C. M., and Werner, M. W.: 1998, Astron. J. 115, 938
- Bushouse et al., 1988 Bushouse, H. A., Werner, M. W., and Lamb, S. A.: 1988, Astrophys. J. 335, 74
- Butler and Zeippen, 1994 Butler, K. and Zeippen, C. J.: 1994, Astron. and Astrophys. Suppl. Sries 108, 1
- Carlson et al., 1998 Carlson, M. N., Holtzman, J. A., Watson, A. M., Grillmair, C. J., Mould, J. R., Ballester, G. E., Burrows, C. J., Clarke, J. T., Crisp, D., Evans, R. W., Gallagher, III, J. S., Griffiths, R. E., Hester, J. J., Hoessel, J. G., Scowen, P. A., Stapelfeldt, K. R., Trauger, J. T., and Westphal, J. A.: 1998, Astron. J. 115, 1778
- Castellanos et al., 2002 Castellanos, M., Díaz, A. I., and Terlevich, E.: 2002, Mon. Not. R. Astron. Soc. 329, 315
- Cepa and Beckman, 1990 Cepa, J. and Beckman, J. E.: 1990, Astrophys. J. 349, 497
- Cerviño et al., 2002 Cerviño, M., Valls-Gabaud, D., Luridiana, V., and Mas-Hesse, J. M.: 2002, Astron. Astrophys. 381, 51
- Cid Fernandes et al., 2007 Cid Fernandes, R., Asari, N. V., Sodré, L., Stasińska, G., Mateus, A., Torres-Papaqui, J. P., and Schoenell, W.: 2007, Mon. Not. R. Astron. Soc. 375, L16
- Cid Fernandes et al., 2001 Cid Fernandes, R., Heckman, T., Schmitt, H., Delgado, R. M. G., and Storchi-Bergmann, T.: 2001, Astrophys. J. 558, 81
- Cid Fernandes et al., 2005 Cid Fernandes, R., Mateus, A., Sodré, L., Stasińska, G., and Gomes, J. M.: 2005, Mon. Not. R. Astron. Soc. 358, 363
- Colina et al., 1997 Colina, L., García Vargas, M. L., Mas-Hesse, J. M., Alberdi, A., and Krabbe, A.: 1997, Astrophys. J. Letters 484, L41+
- Colina et al., 2002 Colina, L., González-Delgado, R., Mas-Hesse, J. M., and Leitherer, C.: 2002, Astrophys. J. 579, 545
- Combes and Gerin, 1985 Combes, F. and Gerin, M.: 1985, Astron. Astrophys. 150, 327
- Crockett et al., 2006 Crockett, N. R., Garnett, D. R., Massey, P., and Jacoby, G.: 2006, Astrophys. J. 637, 741
- de Robertis et al., 1987 de Robertis, M. M., Dufour, R. J., and Hunt, R. W.: 1987, Royal Astronomical Society of Canada, Journal 81, 195
- de Vaucouleurs, 1963 de Vaucouleurs, G.: 1963, Astrophys. J., Suppl. Ser. 8, 31
- de Vaucouleurs et al., 1991 de Vaucouleurs, G., de Vaucouleurs, A., Corwin, Jr., H. G., Buta, R. J., Paturel, G., and Fouque, P.: 1991, Third Reference Catalogue of Bright Galaxies, Volume 1-3, XII, 2069 pp. 7 figs.. Springer-Verlag Berlin Heidelberg New York
- Denicoló et al., 2002 Denicoló, G., Terlevich, R., and Terlevich, E.: 2002, Mon. Not. R. Astron. Soc. 330, 69
- Denicoló et al., 2002 Denicoló, G., Terlevich, R., and Terlevich, E.: 2002, Mon. Not. R. Astron. Soc. 330, 69
- Devereux, 1989 Devereux, N. A.: 1989, Astrophys. J. 346, 126
- Devereux et al., 1992 Devereux, N. A., Kenney, J. D., and Young, J. S.: 1992, Astron. J. 103, 784
- Díaz, 1989 Díaz, A. I.: 1989, in J. E. Beckman and B. E. J. Pagel (eds.), Evolutionary Phenomena in Galaxies, pp 377–397
- Díaz, 1988 Díaz, A. I.: 1988, Mon. Not. R. Astron. Soc. 231, 57
- Díaz, 1998 Díaz, A. I.: 1998, Astron. Astrophys. Suppl. Ser. 263, 143
- Díaz et al., 2000a Díaz, A. I., Álvarez-Álvarez, M., Terlevich, E., Terlevich, R., Portal, M. S., and Aretxaga, I.: 2000a, Mon. Not. R. Astron. Soc. 311, 120
- Díaz et al., 2000b Díaz, A. I., Castellanos, M., Terlevich, E., and Luisa García-Vargas, M.: 2000b, Mon. Not. R. Astron. Soc. 318, 462
- Díaz and Pérez-Montero, 2000 Díaz, A. I. and Pérez-Montero, E.: 2000, Mon. Not. R. Astron. Soc. 312, 130
- Díaz et al., 1985 Díaz, A. I., Pagel, B. E. J., and Wilson, I. R. G.: 1985, Mon. Not. R. Astron. Soc. 212, 737
- Díaz and Pérez-Montero, 1999 Díaz, A. I. and Pérez-Montero, E.: 1999, in J. R. Walsh and M. R. Rosa (eds.), Chemical Evolution from Zero to High Redshift, pp 134–+
- Díaz et al., 2006 Díaz, A. I., Terlevich, E., Castellanos, M., and Hägele, G. F.: 2006, astro-ph/0610787
- Díaz et al., 2007 Díaz, Á. I., Terlevich, E., Castellanos, M., and Hägele, G. F.: 2007, Mon. Not. R. Astron. Soc. 382, 251
- Díaz et al., 1987 Díaz, A. I., Terlevich, E., Pagel, B. E. J., Víilchez, J. M., and Edmunds, M. G.: 1987, Mon. Not. R. Astron. Soc. 226, 19
- Díaz et al., 1989 Díaz, A. I., Terlevich, E., and Terlevich, R.: 1989, Mon. Not. R. Astron. Soc. 239, 325
- Díaz et al., 1991 Díaz, A. I., Terlevich, E., Vílchez, J. M., Pagel, B. E. J., and Edmunds, M. G.: 1991, Mon. Not. R. Astron. Soc. 253, 245
- Díaz et al., 1999 Díaz, R., Carranza, G., Dottori, H., and Goldes, G.: 1999, Astrophys. J. 512, 623
- Dopita et al., 2002 Dopita, M. A., Pereira, M., Kewley, L. J., and Capaccioli, M.: 2002, Astrophys. J., Suppl. Ser. 143, 47
- Dors et al., 2008 Dors, Jr., O. L., Storchi-Bergmann, T., Riffel, R. A., and Schimdt, A. A.: 2008, astro-ph-0802.2070
- Drake and Testa, 2005 Drake, J. J. and Testa, P.: 2005, Nature 436, 525
- Ellison et al., 2001 Ellison, S. L., Yan, L., Hook, I. M., Pettini, M., Wall, J. V., and Shaver, P.: 2001, Astron. Astrophys. 379, 393
- Elmegreen and Elmegreen, 1986 Elmegreen, B. G. and Elmegreen, D. M.: 1986, Astrophys. J. 311, 554
- Elmegreen et al., 2002 Elmegreen, D. M., Chromey, F. R., McGrath, E. J., and Ostenson, J. M.: 2002, Astron. J. 123, 1381
- Elmegreen et al., 1997 Elmegreen, D. M., Chromey, F. R., Santos, M., and Marshall, D.: 1997, Astron. J. 114, 1850
- Elmegreen et al., 2006 Elmegreen, D. M., Elmegreen, B. G., Kaufman, M., Sheth, K., Struck, C., Thomasson, M., and Brinks, E.: 2006, Astrophys. J. 642, 158
- Elmegreen et al., 2001 Elmegreen, D. M., Kaufman, M., Elmegreen, B. G., Brinks, E., Struck, C., Klarić, M., and Thomasson, M.: 2001, Astron. J. 121, 182
- Elmegreen and Salzer, 1999 Elmegreen, D. M. and Salzer, J. J.: 1999, Astron. J. 117, 764
- Ercolano et al., 2007 Ercolano, B., Bastian, N., and Stasińska, G.: 2007, Mon. Not. R. Astron. Soc. 379, 945
- Esteban et al., 2004 Esteban, C., Peimbert, M., García-Rojas, J., Ruiz, M. T., Peimbert, A., and Rodríguez, M.: 2004, Mon. Not. R. Astron. Soc. 355, 229
- Falco et al., 1999 Falco, E. E., Kurtz, M. J., Geller, M. J., Huchra, J. P., Peters, J., Berlind, P., Mink, D. J., Tokarz, S. P., and Elwell, B.: 1999, Publ. Astron. Soc. Pac. 111, 438
- Ferland et al., 1998 Ferland, G. J., Korista, K. T., Verner, D. A., Ferguson, J. W., Kingdon, J. B., and Verner, E. M.: 1998, Publ. Astron. Soc. Pac. 110, 761
- French, 1980 French, H. B.: 1980, Astrophys. J. 240, 41
- Friedli and Benz, 1995 Friedli, D. and Benz, W.: 1995, Astron. Astrophys. 301, 649
- Galavis et al., 1995 Galavis, M. E., Mendoza, C., and Zeippen, C. J.: 1995, Astron. and Astrophys. Suppl. Sries 111, 347
- Gallagher et al., 2001 Gallagher, S. C., Charlton, J. C., Hunsberger, S. D., Zaritsky, D., and Whitmore, B. C.: 2001, Astron. J. 122, 163
- García-Rojas, 2006 García-Rojas, J.: 2006, PhD Thesis, Universidad de La Laguna
- García Vargas and Díaz, 1994 García Vargas, M. L. and Díaz, A. I.: 1994, Astrophys. J., Suppl. Ser. 91, 553
- García-Rojas and Esteban, 2007 García-Rojas, J. and Esteban, C.: 2007, Astrophys. J. 670, 457
- García-Rojas et al., 2005 García-Rojas, J., Esteban, C., Peimbert, A., Peimbert, M., Rodríguez, M., and Ruiz, M. T.: 2005, Mon. Not. R. Astron. Soc. 362, 301
- García-Rojas et al., 2006 García-Rojas, J., Esteban, C., Peimbert, M., Costado, M. T., Rodríguez, M., Peimbert, A., and Ruiz, M. T.: 2006, Mon. Not. R. Astron. Soc. 368, 253
- García-Rojas et al., 2004 García-Rojas, J., Esteban, C., Peimbert, M., Rodríguez, M., Ruiz, M. T., and Peimbert, A.: 2004, Astrophys. J., Suppl. Ser. 153, 501
- García-Vargas et al., 1995 García-Vargas, M. L., Bressan, A., and Díaz, A. I.: 1995, Astron. and Astrophys. Suppl. Sries 112, 35
- Garnett, 1992 Garnett, D. R.: 1992, Astron. J. 103, 1330
- Garnett, 2002 Garnett, D. R.: 2002, Astrophys. J. 581, 1019
- Garnett et al., 2004 Garnett, D. R., Kennicutt, Jr., R. C., and Bresolin, F.: 2004, Astrophys. J. Letters 607, L21
- Garnett et al., 1997 Garnett, D. R., Shields, G. A., Skillman, E. D., Sagan, S. P., and Dufour, R. J.: 1997, Astrophys. J. 489, 63
- Gil de Paz et al., 2003 Gil de Paz, A., Madore, B. F., and Pevunova, O.: 2003, Astrophys. J., Suppl. Ser. 147, 29
- González-Delgado et al., 2005 González-Delgado, R. M., Cerviño, M., Martins, L. P., Leitherer, C., and Hauschildt, P. H.: 2005, Mon. Not. R. Astron. Soc. 357, 945
- González-Delgado et al., 1998 González-Delgado, R. M., Heckman, T., Leitherer, C., Meurer, G., Krolik, J., Wilson, A. S., Kinney, A., and Koratkar, A.: 1998, Astrophys. J. 505, 174
- González-Delgado and Pérez, 1996 González-Delgado, R. M. and Pérez, E.: 1996, Mon. Not. R. Astron. Soc. 281, 781
- González-Delgado et al., 1995 González-Delgado, R. M., Pérez, E., Díaz, A. I., García-Vargas, M. L., Terlevich, E., and Vílchez, J. M.: 1995, Astrophys. J. 439, 604
- González-Delgado et al., 1994 González-Delgado, R. M., Pérez, E., Tenorio-Tagle, G., Vílchez, J. M., Terlevich, E., Terlevich, R., Telles, E., Rodríguez-Espinosa, J. M., Mas-Hesse, M., García-Vargas, M. L., Díaz, A. I., Cepa, J., and Castañeda, H.: 1994, Astrophys. J. 437, 239
- Graham and et al., 1997 Graham, J. A. and et al.: 1997, Astrophys. J. 477, 535
- Grevesse and Sauval, 1998 Grevesse, N. and Sauval, A. J.: 1998, Space Science Reviews 85, 161
- Groves et al., 2006 Groves, B. A., Heckman, T. M., and Kauffmann, G.: 2006, Mon. Not. R. Astron. Soc. 371, 1559
- Gu et al., 2006 Gu, Q., Melnick, J., Fernandes, R. C., Kunth, D., Terlevich, E., and Terlevich, R.: 2006, Mon. Not. R. Astron. Soc. 366, 480
- Guseva et al., 2007 Guseva, N. G., Izotov, Y. I., Papaderos, P., and Fricke, K. J.: 2007, Astron. Astrophys. 464, 885
- Guseva et al., 2000 Guseva, N. G., Izotov, Y. I., and Thuan, T. X.: 2000, Astrophys. J. 531, 776 (GIT00)
- Guseva et al., 2006 Guseva, N. G., Izotov, Y. I., and Thuan, T. X.: 2006, Astrophys. J. 644, 890
- Guseva et al., 2003a Guseva, N. G., Papaderos, P., Izotov, Y. I., Green, R. F., Fricke, K. J., Thuan, T. X., and Noeske, K. G.: 2003a, Astron. Astrophys. 407, 75
- Guseva et al., 2003b Guseva, N. G., Papaderos, P., Izotov, Y. I., Green, R. F., Fricke, K. J., Thuan, T. X., and Noeske, K. G.: 2003b, Astron. Astrophys. 407, 91
- Guseva et al., 2003c Guseva, N. G., Papaderos, P., Izotov, Y. I., Green, R. F., Fricke, K. J., Thuan, T. X., and Noeske, K. G.: 2003c, Astron. Astrophys. 407, 105
- Guzmán et al., 1998 Guzmán, R., Jangren, A., Koo, D. C., Bershady, M. A., and Simard, L.: 1998, Astrophys. J. Letters 495, L13+
- Guzmán et al., 1996 Guzmán, R., Koo, D. C., Faber, S. M., Illingworth, G. D., Takamiya, M., Kron, R. G., and Bershady, M. A.: 1996, Astrophys. J. Letters 460, L5+
- Hägele et al., 2007 Hägele, G. F., Díaz, A. I., Cardaci, M. V., Terlevich, E., and Terlevich, R.: 2007, Mon. Not. R. Astron. Soc. 378, 163
- Hägele et al., 2008 Hägele, G. F., Díaz, Á. I., Terlevich, E., Terlevich, R., Pérez-Montero, E., and Cardaci, M. V.: 2008, Mon. Not. R. Astron. Soc. 383, 209
- Hägele et al., 2006 Hägele, G. F., Pérez-Montero, E., Díaz, A. I., Terlevich, E., and Terlevich, R.: 2006, Mon. Not. R. Astron. Soc. 372, 293
- Harper and Low, 1973 Harper, Jr., D. A. and Low, F. J.: 1973, Astrophys. J. Letters 182, L89+
- Haynes et al., 1998 Haynes, M. P., van Zee, L., Hogg, D. E., Roberts, M. S., and Maddalena, R. J.: 1998, Astron. J. 115, 62
- Henry, 1989 Henry, R. B. C.: 1989, Mon. Not. R. Astron. Soc. 241, 453
- Ho and Filippenko, 1996a Ho, L. C. and Filippenko, A. V.: 1996a, Astrophys. J. Letters 466, L83+
- Ho and Filippenko, 1996b Ho, L. C. and Filippenko, A. V.: 1996b, Astrophys. J. 472, 600
- Ho et al., 1997 Ho, L. C., Filippenko, A. V., and Sargent, W. L. W.: 1997, Astrophys. J., Suppl. Ser. 112, 315
- Holtzman et al., 1992 Holtzman, J. A., Faber, S. M., Shaya, E. J., Lauer, T. R., Groth, J., Hunter, D. A., Baum, W. A., Ewald, S. P., Hester, J. J., Light, R. M., Lynds, C. R., O’Neil, Jr., E. J., and Westphal, J. A.: 1992, Astron. J. 103, 691
- Holweger, 2001 Holweger, H.: 2001, in R. F. Wimmer-Schweingruber (ed.), Joint SOHO/ACE workshop ”Solar and Galactic Composition”, Vol. 598 of American Institute of Physics Conference Series, pp 23–+
- Hoyos and Díaz, 2006 Hoyos, C. and Díaz, A. I.: 2006, Mon. Not. R. Astron. Soc. 365, 454
- Hubble, 1926 Hubble, E. P.: 1926, Astrophys. J. 64, 321
- Huchra, 1977 Huchra, J. P.: 1977, Astrophys. J. 217, 928
- Israelian and Rebolo, 2001 Israelian, G. and Rebolo, R.: 2001, Astrophys. J. Letters 557, L43
- Izotov et al., 1999 Izotov, Y. I., Chaffee, F. H., Foltz, C. B., Green, R. F., Guseva, N. G., and Thuan, T. X.: 1999, Astrophys. J. 527, 757
- Izotov et al., 2001a Izotov, Y. I., Chaffee, F. H., and Green, R. F.: 2001a, Astrophys. J. 562, 727
- Izotov et al., 2001b Izotov, Y. I., Chaffee, F. H., and Schaerer, D.: 2001b, Astron. Astrophys. 378, L45 (ICS01)
- Izotov et al., 1997a Izotov, Y. I., Lipovetsky, V. A., Chaffee, F. H., Foltz, C. B., Guseva, N. G., and Kniazev, A. Y.: 1997a, Astrophys. J. 476, 698
- Izotov et al., 2004a Izotov, Y. I., Papaderos, P., Guseva, N. G., Fricke, K. J., and Thuan, T. X.: 2004a, Astron. Astrophys. 421, 539
- Izotov et al., 2004b Izotov, Y. I., Stasińska, G., Guseva, N. G., and Thuan, T. X.: 2004b, Astron. Astrophys. 415, 87 (IT04)
- Izotov et al., 2006 Izotov, Y. I., Stasińska, G., Meynet, G., Guseva, N. G., and Thuan, T. X.: 2006, Astron. Astrophys. 448, 955
- Izotov and Thuan, 1998a Izotov, Y. I. and Thuan, T. X.: 1998a, Astrophys. J. 497, 227
- Izotov and Thuan, 1998b Izotov, Y. I. and Thuan, T. X.: 1998b, Astrophys. J. 500, 188 (IT98)
- Izotov and Thuan, 2004 Izotov, Y. I. and Thuan, T. X.: 2004, Astrophys. J. 602, 200
- Izotov et al., 1994 Izotov, Y. I., Thuan, T. X., and Lipovetsky, V. A.: 1994, Astrophys. J. 435, 647 (ITL94)
- Izotov et al., 1997b Izotov, Y. I., Thuan, T. X., and Lipovetsky, V. A.: 1997b, Astrophys. J., Suppl. Ser. 108, 1 (ITL97)
- Jamet et al., 2005 Jamet, L., Stasińska, G., Pérez, E., González-Delgado, R. M., and Vílchez, J. M.: 2005, Astron. Astrophys. 444, 723
- Jarrett et al., 2003 Jarrett, T. H., Chester, T., Cutri, R., Schneider, S. E., and Huchra, J. P.: 2003, Astron. J. 125, 525
- Jiménez-Benito et al., 2000 Jiménez-Benito, L., Díaz, A. I., Terlevich, R., and Terlevich, E.: 2000, Mon. Not. R. Astron. Soc. 317, 907
- Jogee et al., 2005 Jogee, S., Scoville, N., and Kenney, J. D. P.: 2005, Astrophys. J. 630, 837
- Kauffmann et al., 2003 Kauffmann, G., Heckman, T. M., Tremonti, C., Brinchmann, J., Charlot, S., White, S. D. M., Ridgway, S. E., Brinkmann, J., Fukugita, M., Hall, P. B., Ivezić, Ž., Richards, G. T., and Schneider, D. P.: 2003, Mon. Not. R. Astron. Soc. 346, 1055
- Kenney et al., 1992 Kenney, J. D. P., Wilson, C. D., Scoville, N. Z., Devereux, N. A., and Young, J. S.: 1992, Astrophys. J. Letters 395, L79
- Kennicutt et al., 2003 Kennicutt, R. C., Bresolin, F., and Garnett, D. R.: 2003, Astrophys. J. 591, 801(KBG03)
- Kennicutt, 1989 Kennicutt, Jr., R. C.: 1989, Astrophys. J. 344, 685
- Kennicutt, 1992 Kennicutt, Jr., R. C.: 1992, Astrophys. J., Suppl. Ser. 79, 255
- Kennicutt, 1998a Kennicutt, Jr., R. C.: 1998a, Ann. Rev. Astron. Astrophys. 36, 189
- Kennicutt, 1998b Kennicutt, Jr., R. C.: 1998b, Astrophys. J. 498, 541
- Kennicutt and Garnett, 1996 Kennicutt, Jr., R. C. and Garnett, D. R.: 1996, Astrophys. J. 456, 504
- Kennicutt et al., 1989 Kennicutt, Jr., R. C., Keel, W. C., and Blaha, C. A.: 1989, Astron. J. 97, 1022
- Kennicutt et al., 1987 Kennicutt, Jr., R. C., Roettiger, K. A., Keel, W. C., van der Hulst, J. M., and Hummel, E.: 1987, Astron. J. 93, 1011
- Kewley et al., 2001 Kewley, L. J., Dopita, M. A., Sutherland, R. S., Heisler, C. A., and Trevena, J.: 2001, Astrophys. J. 556, 121
- Kewley and Ellison, 2008 Kewley, L. J. and Ellison, S. L.: 2008, ArXiv e-prints 801
- Kingdon and Ferland, 1995 Kingdon, J. and Ferland, G. J.: 1995, Astrophys. J. 442, 714
- Knapen et al., 1992 Knapen, J. H., Beckman, J. E., Cepa, J., van der Hulst, T., and Rand, R. J.: 1992, Astrophys. J. Letters 385, L37
- Kniazev et al., 2003 Kniazev, A. Y., Grebel, E. K., Hao, L., Strauss, M. A., Brinkmann, J., and Fukugita, M.: 2003, Astrophys. J. Letters 593, L73
- Kniazev et al., 2004 Kniazev, A. Y., Pustilnik, S. A., Grebel, E. K., Lee, H., and Pramskij, A. G.: 2004, Astrophys. J., Suppl. Ser. 153, 429
- Kobulnicky et al., 1999 Kobulnicky, H. A., Kennicutt, Jr., R. C., and Pizagno, J. L.: 1999, Astrophys. J. 514, 544
- Koo et al., 1994 Koo, D. C., Bershady, M. A., Wirth, G. D., Stanford, S. A., and Majewski, S. R.: 1994, Astrophys. J. Letters 427, L9
- Koo et al., 1995 Koo, D. C., Guzmán, R., Faber, S. M., Illingworth, G. D., Bershady, M. A., Kron, R. G., and Takamiya, M.: 1995, Astrophys. J. Letters 440, L49
- Kouwenhoven and de Grijs, 2007 Kouwenhoven, M. B. N. and de Grijs, R.: 2007, astro-ph/0710.1207
- Kregel and Sancisi, 2001 Kregel, M. and Sancisi, R.: 2001, Astron. Astrophys. 376, 59
- Kroupa, 2002 Kroupa, P.: 2002, Science 295, 82
- Kunth and Östlin, 2000 Kunth, D. and Östlin, G.: 2000, Astron. Astrophys. Rev 10, 1
- Kunth and Sargent, 1983 Kunth, D. and Sargent, W. L. W.: 1983, Astrophys. J. 273, 81
- Kurtz and Mink, 1998 Kurtz, M. J. and Mink, D. J.: 1998, Publ. Astron. Soc. Pac. 110, 934
- Lamareille et al., 2004 Lamareille, F., Mouhcine, M., Contini, T., Lewis, I., and Maddox, S.: 2004, Mon. Not. R. Astron. Soc. 350, 396
- Larsen et al., 2001 Larsen, S. S., Brodie, J. P., Elmegreen, B. G., Efremov, Y. N., Hodge, P. W., and Richtler, T.: 2001, Astrophys. J. 556, 801
- Larsen et al., 2004 Larsen, S. S., Brodie, J. P., and Hunter, D. A.: 2004, Astron. J. 128, 2295
- Larson and Tinsley, 1978 Larson, R. B. and Tinsley, B. M.: 1978, Astrophys. J. 219, 46
- Lee et al., 2004 Lee, J. C., Salzer, J. J., and Melbourne, J.: 2004, Astrophys. J. 616, 752 (L04)
- Leitherer and Heckman, 1995 Leitherer, C. and Heckman, T. M.: 1995, Astrophys. J., Suppl. Ser. 96, 9
- Leitherer et al., 1992 Leitherer, C., Robert, C., and Drissen, L.: 1992, Astrophys. J. 401, 596
- Leitherer et al., 1999 Leitherer, C., Schaerer, D., Goldader, J. D., Delgado, R. M. G., Robert, C., Kune, D. F., de Mello, D. F., Devost, D., and Heckman, T. M.: 1999, Astrophys. J., Suppl. Ser. 123, 3
- Lennon and Burke, 1994 Lennon, D. J. and Burke, V. M.: 1994, Astron. and Astrophys. Suppl. Sries 103, 273
- Liu and Kennicutt, 1995 Liu, C. T. and Kennicutt, Jr., R. C.: 1995, Astrophys. J. 450, 547
- Liu, 2006 Liu, X.-W.: 2006, in M. J. Barlow and R. H. Méndez (eds.), Planetary Nebulae in our Galaxy and Beyond, Vol. 234 of IAU Symposium, pp 219–226
- Liu et al., 2006 Liu, X.-W., Barlow, M. J., Zhang, Y., Bastin, R. J., and Storey, P. J.: 2006, Mon. Not. R. Astron. Soc. 368, 1959
- Liu et al., 2001 Liu, X.-W., Luo, S.-G., Barlow, M. J., Danziger, I. J., and Storey, P. J.: 2001, Mon. Not. R. Astron. Soc. 327, 141
- Liu et al., 2000 Liu, X.-W., Storey, P. J., Barlow, M. J., Danziger, I. J., Cohen, M., and Bryce, M.: 2000, Mon. Not. R. Astron. Soc. 312, 585
- López, 2005a López, J.: 2005a, MSc Thesis, INAOE
- López, 2005b López, J.: 2005b, MSc Thesis, INAOE
- Luridiana et al., 2003 Luridiana, V., Peimbert, A., Peimbert, M., and Cerviño, M.: 2003, Astrophys. J. 592, 846
- Luridiana et al., 1999 Luridiana, V., Peimbert, M., and Leitherer, C.: 1999, Astrophys. J. 527, 110
- Macchetto et al., 1990 Macchetto, F., Colina, L., Golombek, D., Perryman, M. A. C., and di Serego Alighieri, S.: 1990, Astrophys. J. 356, 389
- Maoz et al., 2001 Maoz, D., Barth, A. J., Ho, L. C., Sternberg, A., and Filippenko, A. V.: 2001, Astron. J. 121, 3048
- Maoz et al., 1996 Maoz, D., Barth, A. J., Sternberg, A., Filippenko, A. V., Ho, L. C., Macchetto, F. D., Rix, H.-W., and Schneider, D. P.: 1996, Astron. J. 111, 2248
- Marconi et al., 2006 Marconi, A., Pastorini, G., Pacini, F., Axon, D. J., Capetti, A., Macchetto, D., Koekemoer, A. M., and Schreier, E. J.: 2006, Astron. Astrophys. 448, 921
- Mas-Hesse and Kunth, 1991 Mas-Hesse, J. M. and Kunth, D.: 1991, Astron. and Astrophys. Suppl. Sries 88, 399
- Mas-Hesse et al., 2003 Mas-Hesse, J. M., Kunth, D., Tenorio-Tagle, G., Leitherer, C., Terlevich, R. J., and Terlevich, E.: 2003, Astrophys. J. 598, 858
- Mateus et al., 2007 Mateus, A., Sodré, L., Cid Fernandes, R., and Stasińska, G.: 2007, Mon. Not. R. Astron. Soc. 374, 1457
- Mateus et al., 2006 Mateus, A., Sodré, L., Cid Fernandes, R., Stasińska, G., Schoenell, W., and Gomes, J. M.: 2006, Mon. Not. R. Astron. Soc. 370, 721
- McCall and Schmidt, 1986 McCall, M. L. and Schmidt, F. H.: 1986, Astrophys. J. 311, 548
- McCrady et al., 2003 McCrady, N., Gilbert, A. M., and Graham, J. R.: 2003, Astrophys. J. 596, 240
- McCrady and Graham, 2007 McCrady, N. and Graham, J. R.: 2007, Astrophys. J. 663, 844
- McGaugh, 1991 McGaugh, S. S.: 1991, Astrophys. J. 380, 140
- Melbourne et al., 2004 Melbourne, J., Phillips, A., Salzer, J. J., Gronwall, C., and Sarajedini, V. L.: 2004, Astron. J. 127, 686 (M04)
- Melnick et al., 1999 Melnick, J., Tenorio-Tagle, G., and Terlevich, R.: 1999, Mon. Not. R. Astron. Soc. 302, 677
- Melnick et al., 1985a Melnick, J., Terlevich, R., and Eggleton, P. P.: 1985a, Mon. Not. R. Astron. Soc. 216, 255
- Melnick et al., 1985b Melnick, J., Terlevich, R., and Moles, M.: 1985b, Revista Mexicana de Astronomia y Astrofisica 11, 91
- Melnick et al., 1988 Melnick, J., Terlevich, R., and Moles, M.: 1988, Mon. Not. R. Astron. Soc. 235, 297
- Melnick et al., 2000 Melnick, J., Terlevich, R., and Terlevich, E.: 2000, Mon. Not. R. Astron. Soc. 311
- Mengel et al., 2005 Mengel, S., Lehnert, M. D., Thatte, N., and Genzel, R.: 2005, Astron. Astrophys. 443, 41
- Mengel et al., 2008 Mengel, S., Lehnert, M. D., Thatte, N. A., Vacca, W. D., Whitmore, B., and Chandar, R.: 2008, ArXiv e-prints 805
- Meurer et al., 1995 Meurer, G. R., Heckman, T. M., Leitherer, C., Kinney, A., Robert, C., and Garnett, D. R.: 1995, Astron. J. 110, 2665
- Meynet et al., 1994 Meynet, G., Maeder, A., Schaller, G., Schaerer, D., and Charbonnel, C.: 1994, Astron. and Astrophys. Suppl. Sries 103, 97
- Miller et al., 1997 Miller, B. W., Whitmore, B. C., Schweizer, F., and Fall, S. M.: 1997, Astron. J. 114, 2381
- Miller and Mathews, 1972 Miller, J. S. and Mathews, W. G.: 1972, Astrophys. J. 172, 593
- Mollá et al., 2006 Mollá, M., Vílchez, J. M., Gavilán, M., and Díaz, A. I.: 2006, Mon. Not. R. Astron. Soc. 372, 1069
- Morgan, 1958 Morgan, W. W.: 1958, Publ. Astron. Soc. Pac. 70, 364
- Morisset et al., 2004 Morisset, C., Schaerer, D., Bouret, J.-C., and Martins, F.: 2004, Astron. Astrophys. 415, 577
- Mould et al., 2000 Mould, J. R., Huchra, J. P., Freedman, W. L., Kennicutt, Jr., R. C., Ferrarese, L., Ford, H. C., Gibson, B. K., Graham, J. A., Hughes, S. M. G., Illingworth, G. D., Kelson, D. D., Macri, L. M., Madore, B. F., Sakai, S., Sebo, K. M., Silbermann, N. A., and Stetson, P. B.: 2000, Astrophys. J. 529, 786
- Mulder and van Driel, 1996 Mulder, P. S. and van Driel, W.: 1996, Astron. Astrophys. 309, 403
- Mulder et al., 1995 Mulder, P. S., van Driel, W., and Braine, J.: 1995, Astron. Astrophys. 300, 687
- Nagao et al., 2006 Nagao, T., Maiolino, R., and Marconi, A.: 2006, Astron. Astrophys. 459, 85
- Nelson and Whittle, 1995 Nelson, C. H. and Whittle, M.: 1995, Astrophys. J., Suppl. Ser. 99, 67
- Noeske et al., 2005 Noeske, K. G., Papaderos, P., Cairós, L. M., and Fricke, K. J.: 2005, Astron. Astrophys. 429, 115
- Oke, 1990 Oke, J. B.: 1990, Astron. J. 99, 1621
- Oke and Gunn, 1983 Oke, J. B. and Gunn, J. E.: 1983, Astrophys. J. 266, 713
- Olive and Skillman, 2001 Olive, K. A. and Skillman, E. D.: 2001, New Astronomy 6, 119
- Olive and Skillman, 2004 Olive, K. A. and Skillman, E. D.: 2004, Astrophys. J. 617, 29
- Origlia et al., 2001 Origlia, L., Leitherer, C., Aloisi, A., Greggio, L., and Tosi, M.: 2001, Astron. J. 122, 815
- Origlia et al., 2004 Origlia, L., Ranalli, P., Comastri, A., and Maiolino, R.: 2004, Astrophys. J. 606, 862
- Osterbrock, 1989 Osterbrock, D. E.: 1989, Astrophysics of gaseous nebulae and active galactic nuclei, Mill Valley, CA, University Science Books
- Osterbrock et al., 1996 Osterbrock, D. E., Fulbright, J. P., Martel, A. R., Keane, M. J., Trager, S. C., and Basri, G.: 1996, Publ. Astron. Soc. Pac. 108, 277
- Östlin et al., 2004 Östlin, G., Cumming, R. J., Amram, P., Bergvall, N., Kunth, D., Márquez, I., Masegosa, J., and Zackrisson, E.: 2004, Astron. Astrophys. 419, L43
- Pagel et al., 1979 Pagel, B. E. J., Edmunds, M. G., Blackwell, D. E., Chun, M. S., and Smith, G.: 1979, Mon. Not. R. Astron. Soc. 189, 95
- Pagel et al., 1992 Pagel, B. E. J., Simonson, E. A., Terlevich, R. J., and Edmunds, M. G.: 1992, Mon. Not. R. Astron. Soc. 255, 325
- Palacios et al., 1997 Palacios, J., García-Vargas, M. L., Díaz, A., Terlevich, R., and Terlevich, E.: 1997, Astron. Astrophys. 323, 749
- Pasquali and Castangia, 2008 Pasquali, A. and Castangia, P.: 2008, Mon. Not. R. Astron. Soc. 385, 468
- Pastorini et al., 2007 Pastorini, G., Marconi, A., Capetti, A., Axon, D. J., Alonso-Herrero, A., Atkinson, J., Batcheldor, D., Carollo, C. M., Collett, J., Dressel, L., Hughes, M. A., Macchetto, D., Maciejewski, W., Sparks, W., and van der Marel, R.: 2007, Astron. Astrophys. 469, 405
- Pastoriza et al., 1993 Pastoriza, M. G., Dottori, H. A., Terlevich, E., Terlevich, R., and Diaz, A. I.: 1993, Mon. Not. R. Astron. Soc. 260, 177
- Pauldrach et al., 2001 Pauldrach, A. W. A., Hoffmann, T. L., and Lennon, M.: 2001, Astron. Astrophys. 375, 161
- Peimbert, 2003 Peimbert, A.: 2003, Astrophys. J. 584, 735
- Peimbert et al., 2002 Peimbert, A., Peimbert, M., and Luridiana, V.: 2002, Astrophys. J. 565, 668
- Peimbert et al., 2005 Peimbert, A., Peimbert, M., and Ruiz, M. T.: 2005, Astrophys. J. 634, 1056
- Peimbert, 1967 Peimbert, M.: 1967, Astrophys. J. 150, 825
- Peimbert, 1971 Peimbert, M.: 1971, Boletin de los Observatorios Tonantzintla y Tacubaya 6, 29
- Peimbert and Costero, 1969 Peimbert, M. and Costero, R.: 1969, Boletin de los Observatorios Tonantzintla y Tacubaya 5, 3
- Peimbert and Peimbert, 2003 Peimbert, M. and Peimbert, A.: 2003, in Revista Mexicana de Astronomia y Astrofisica Conference Series, Vol. 16, pp 113–116
- Peimbert and Peimbert, 2006 Peimbert, M. and Peimbert, A.: 2006, in M. J. Barlow and R. H. Méndez (eds.), Planetary Nebulae in our Galaxy and Beyond, Vol. 234 of IAU Symposium, pp 227–234
- Peimbert et al., 2007 Peimbert, M., Peimbert, A., Esteban, C., García-Rojas, J., Bresolin, F., Carigi, L., Ruiz, M. T., and López-Sánchez, A. R.: 2007, in Revista Mexicana de Astronomia y Astrofisica Conference Series, Vol. 29 of Revista Mexicana de Astronomia y Astrofisica Conference Series, pp 72–79
- Peimbert et al., 2000 Peimbert, M., Peimbert, A., and Ruiz, M. T.: 2000, Astrophys. J. 541, 688
- Peimbert et al., 2004 Peimbert, M., Peimbert, A., Ruiz, M. T., and Esteban, C.: 2004, Astrophys. J., Suppl. Ser. 150, 431
- Peimbert and Torres-Peimbert, 1992 Peimbert, M. and Torres-Peimbert, S.: 1992, Astron. Astrophys. 253, 349
- Pérez et al., 2000 Pérez, E., Márquez, I., Marrero, I., Durret, F., González Delgado, R. M., Masegosa, J., Maza, J., and Moles, M.: 2000, Astron. Astrophys. 353, 893
- Pérez-Montero and Díaz, 2003 Pérez-Montero, E. and Díaz, A. I.: 2003, Mon. Not. R. Astron. Soc. 346, 105 (PMD03)
- Pérez-Montero and Díaz, 2005 Pérez-Montero, E. and Díaz, A. I.: 2005, Mon. Not. R. Astron. Soc. 361, 1063
- Pérez-Montero and Díaz, 2007 Pérez-Montero, E. and Díaz, A. I.: 2007, Mon. Not. R. Astron. Soc. 377, 1195
- Pérez-Montero et al., 2006 Pérez-Montero, E., Díaz, A. I., Vílchez, J. M., and Kehrig, C.: 2006, Astron. Astrophys. 449, 193
- Pérez-Montero et al., 2007 Pérez-Montero, E., Hägele, G. F., Contini, T., and Díaz, Á. I.: 2007, Mon. Not. R. Astron. Soc. 381, 125
- Pérez-Olea, 1996 Pérez-Olea, D.: 1996, PhD Thesis, Universidad Autónoma de Madrid
- Pettini et al., 2001 Pettini, M., Shapley, A. E., Steidel, C. C., Cuby, J.-G., Dickinson, M., Moorwood, A. F. M., Adelberger, K. L., and Giavalisco, M.: 2001, Astrophys. J. 554, 981
- Pettini et al., 2000 Pettini, M., Steidel, C. C., Adelberger, K. L., Dickinson, M., and Giavalisco, M.: 2000, Astrophys. J. 528, 96
- Phillips et al., 1984 Phillips, M. M., Pagel, B. E. J., Edmunds, M. G., and Díaz, A.: 1984, Mon. Not. R. Astron. Soc. 210, 701
- Pilyugin, 2000 Pilyugin, L. S.: 2000, Astron. Astrophys. 362, 325
- Pilyugin, 2007 Pilyugin, L. S.: 2007, Mon. Not. R. Astron. Soc. 375, 685
- Pilyugin et al., 2006 Pilyugin, L. S., Thuan, T. X., and Vílchez, J. M.: 2006, Mon. Not. R. Astron. Soc. 367, 1139
- Pilyugin et al., 2004 Pilyugin, L. S., Vílchez, J. M., and Contini, T.: 2004, Astron. Astrophys. 425, 849
- Piner et al., 1995 Piner, B. G., Stone, J. M., and Teuben, P. J.: 1995, Astrophys. J. 449, 508
- Pizzella et al., 2004 Pizzella, A., Corsini, E. M., Vega Beltrán, J. C., and Bertola, F.: 2004, Astron. Astrophys. 424, 447
- Planesas et al., 1997 Planesas, P., Colina, L., and Pérez-Olea, D.: 1997, Astron. Astrophys. 325, 81
- Popescu and Hopp, 2000 Popescu, C. C. and Hopp, U.: 2000, Astron. and Astrophys. Suppl. Sries 142, 247
- Porter et al., 2005 Porter, R. L., Bauman, R. P., Ferland, G. J., and MacAdam, K. B.: 2005, Astrophys. J. Letters 622, L73
- Prada et al., 1994 Prada, F., Greve, A., and McKeith, C. D.: 1994, Astron. Astrophys. 288, 396
- Pradhan, 1976 Pradhan, A. K.: 1976, Mon. Not. R. Astron. Soc. 177, 31
- Puxley et al., 1990 Puxley, P. J., Hawarden, T. G., and Mountain, C. M.: 1990, Astrophys. J. 364, 77
- Ramsbottom et al., 1996 Ramsbottom, C. A., Bell, K. L., and Stafford, R. P.: 1996, Atomic Data and Nuclear Data Tables 63, 57
- Rieke and Lebofsky, 1978 Rieke, G. H. and Lebofsky, M. J.: 1978, Astrophys. J. Letters 220, L37
- Rieke et al., 1993 Rieke, G. H., Loken, K., Rieke, M. J., and Tamblyn, P.: 1993, Astrophys. J. 412, 99
- Rieke and Low, 1972 Rieke, G. H. and Low, F. J.: 1972, Astrophys. J. Letters 176, L95+
- Roberts et al., 1979 Roberts, Jr., W. W., Huntley, J. M., and van Albada, G. D.: 1979, Astrophys. J. 233, 67
- Rodríguez and Rubin, 2004 Rodríguez, M. and Rubin, R. H.: 2004, in IAU Symp. 217, Recycling Intergallactic and Interstellar Matter, ed. P. A. Duc, J. Braine, and E. Brinks (San Francisco: ASP), pp 188–+ (astro–ph/0312246)
- Rola et al., 1997 Rola, C. S., Terlevich, E., and Terlevich, R. J.: 1997, Mon. Not. R. Astron. Soc. 289, 419
- Rosa-González et al., 2007 Rosa-González, D., Schmitt, H. R., Terlevich, E., and Terlevich, R.: 2007, Astrophys. J. 654, 226
- Rubin et al., 2002 Rubin, R. H., Bhatt, N. J., Dufour, R. J., Buckalew, B. A., Barlow, M. J., Liu, X.-W., Storey, P. J., Balick, B., Ferland, G. J., Harrington, J. P., and Martin, P. G.: 2002, Mon. Not. R. Astron. Soc. 334, 777
- Rubin et al., 1975 Rubin, V. C., Peterson, C. J., and Ford, Jr., W. K.: 1975, Astrophys. J. 199, 39
- Ruiz et al., 2003 Ruiz, M. T., Peimbert, A., Peimbert, M., and Esteban, C.: 2003, Astrophys. J. 595, 247
- Sakamoto et al., 1999 Sakamoto, K., Okumura, S. K., Ishizuki, S., and Scoville, N. Z.: 1999, Astrophys. J. 525, 691
- Salpeter, 1955 Salpeter, E. E.: 1955, Astrophys. J. 121, 161
- Sánchez-Portal et al., 2000 Sánchez-Portal, M., Díaz, Á. I., Terlevich, R., Terlevich, E., Álvarez Álvarez, M., and Aretxaga, I.: 2000, Mon. Not. R. Astron. Soc. 312, 2
- Sargent, 1970 Sargent, W. L. W.: 1970, Astrophys. J. 160, 405
- Sargent and Searle, 1970 Sargent, W. L. W. and Searle, L.: 1970, Astrophys. J. Letters 162, L155+
- Schulte-Ladbeck et al., 1998 Schulte-Ladbeck, R. E., Crone, M. M., and Hopp, U.: 1998, Astrophys. J. Letters 493, L23+
- Searle and Sargent, 1972 Searle, L. and Sargent, W. L. W.: 1972, Astrophys. J. 173, 25
- Searle et al., 1973 Searle, L., Sargent, W. L. W., and Bagnuolo, W. G.: 1973, Astrophys. J. 179, 427
- Sérsic and Pastoriza, 1965 Sérsic, J. L. and Pastoriza, M.: 1965, Publ. Astron. Soc. Pac. 77, 287
- Sérsic and Pastoriza, 1967 Sérsic, J. L. and Pastoriza, M.: 1967, Publ. Astron. Soc. Pac. 79, 152
- Shaw and Dufour, 1995 Shaw, R. A. and Dufour, R. J.: 1995, Publ. Astron. Soc. Pac. 107, 896
- Sheth et al., 2005 Sheth, K., Vogel, S. N., Regan, M. W., Thornley, M. D., and Teuben, P. J.: 2005, Astrophys. J. 632, 217
- Shields and Kennicutt, 1995 Shields, J. C. and Kennicutt, Jr., R. C.: 1995, Astrophys. J. 454, 807
- Siegel et al., 2005 Siegel, E. R., Guzmán, R., Gallego, J. P., Orduña López, M., and Rodríguez-Hidalgo, P.: 2005, Mon. Not. R. Astron. Soc. 356, 1117
- Skillman and Kennicutt, 1993 Skillman, E. D. and Kennicutt, Jr., R. C.: 1993, Astrophys. J. 411, 655 (SK93)
- Skillman et al., 1994 Skillman, E. D., Televich, R. J., Kennicutt, Jr., R. C., Garnett, D. R., and Terlevich, E.: 1994, Astrophys. J. 431, 172 (S94)
- Smith et al., 2005 Smith, B. J., Struck, C., Appleton, P. N., Charmandaris, V., Reach, W., and Eitter, J. J.: 2005, Astron. J. 130, 2117
- Smith et al., 1996 Smith, D. A., Neff, S. G., Bothun, G. D., Fanelli, M. N., Offenberg, J. D., Waller, W. H., Bohlin, R. C., O’Connell, R. W., Roberts, M. S., Smith, A. M., and Stecher, T. P.: 1996, Astrophys. J. Letters 473, L21+
- Smith et al., 2002 Smith, L. J., Norris, R. P. F., and Crowther, P. A.: 2002, Mon. Not. R. Astron. Soc. 337, 1309
- Stasińska and Izotov, 2003 Stasińska, G. and Izotov, Y.: 2003, Astron. Astrophys. 397, 71
- Stasińska, 1978 Stasińska, G.: 1978, Astron. Astrophys. 66, 257
- Stasińska, 1980 Stasińska, G.: 1980, Astron. Astrophys. 84, 320
- Stasińska, 1990 Stasińska, G.: 1990, Astron. and Astrophys. Suppl. Sries 83, 501
- Stasińska, 2005 Stasińska, G.: 2005, Astron. Astrophys. 434, 507
- Stasińska, 2006 Stasińska, G.: 2006, Astron. Astrophys. 454, L127
- Stasińska and Leitherer, 1996 Stasińska, G. and Leitherer, C.: 1996, Astrophys. J., Suppl. Ser. 107, 661
- Stauffer, 1982 Stauffer, J. R.: 1982, Astrophys. J., Suppl. Ser. 50, 517
- Storey and Hummer, 1995 Storey, P. J. and Hummer, D. G.: 1995, Mon. Not. R. Astron. Soc. 272, 41
- Stoughton and et al., 2002 Stoughton, C. and et al.: 2002, Astron. J. 123, 485
- Swartz et al., 2006 Swartz, D. A., Yukita, M., Tennant, A. F., Soria, R., and Ghosh, K. K.: 2006, Astrophys. J. 647, 1030
- Tayal and Gupta, 1999 Tayal, S. S. and Gupta, G. P.: 1999, Astrophys. J. 526, 544
- Telesco, 1988 Telesco, C. M.: 1988, Ann. Rev. Astron. Astrophys. 26, 343
- Telesco and Decher, 1988 Telesco, C. M. and Decher, R.: 1988, Astrophys. J. 334, 573
- Telesco and Gatley, 1984 Telesco, C. M. and Gatley, I.: 1984, Astrophys. J. 284, 557
- Telesco and Harper, 1980 Telesco, C. M. and Harper, D. A.: 1980, Astrophys. J. 235, 392
- Telles et al., 1997 Telles, E., Melnick, J., and Terlevich, R.: 1997, Mon. Not. R. Astron. Soc. 288, 78
- Temporin et al., 2003 Temporin, S., Ciroi, S., Rafanelli, P., Radovich, M., Vennik, J., Richter, G. M., and Birkle, K.: 2003, Astrophys. J., Suppl. Ser. 148, 353
- Terlevich et al., 1990 Terlevich, E., Terlevich, R., Díaz, A. I., Pastoriza, M. G., and Dottori, H.: 1990, Mon. Not. R. Astron. Soc. 242, 48P
- Terlevich et al., 2003 Terlevich, E., Terlevich, R., and Melnick, J.: 2003, in J. M. Rodriguez-Espinoza, F. Garzon Lopez, and V. Melo Martin (eds.), Revista Mexicana de Astronomia y Astrofisica Conference Series, pp 213–215
- Terlevich et al., 1991 Terlevich, R., Melnick, J., Masegosa, J., Moles, M., and Copetti, M. V. F.: 1991, Astron. and Astrophys. Suppl. Sries 91, 285 (T91)
- Thronson and Greenhouse, 1988 Thronson, Jr., H. A. and Greenhouse, M. A.: 1988, Astrophys. J. 327, 671
- Tinsley, 1968 Tinsley, B. M.: 1968, Astrophys. J. 151, 547
- Tinsley, 1972 Tinsley, B. M.: 1972, Astron. Astrophys. 20, 383
- Tonry and Davis, 1979 Tonry, J. and Davis, M.: 1979, Astron. J. 84, 1511
- Trancho et al., 2007 Trancho, G., Bastian, N., Miller, B. W., and Schweizer, F.: 2007, Astrophys. J. 664, 284
- Tsamis et al., 2003 Tsamis, Y. G., Barlow, M. J., Liu, X.-W., Danziger, I. J., and Storey, P. J.: 2003, Mon. Not. R. Astron. Soc. 338, 687
- Tsamis and Péquignot, 2005 Tsamis, Y. G. and Péquignot, D.: 2005, Mon. Not. R. Astron. Soc. 364, 687
- Ugryumov et al., 2003 Ugryumov, A. V., Engels, D., Pustilnik, S. A., Kniazev, A. Y., Pramskij, A. G., and Hagen, H.-J.: 2003, Astron. Astrophys. 397, 463
- van der Kruit, 1976 van der Kruit, P. C.: 1976, Astron. Astrophys. 49, 161
- van der Kruit and de Bruyn, 1976 van der Kruit, P. C. and de Bruyn, A. G.: 1976, Astron. Astrophys. 48, 373
- van Zee, 2000 van Zee, L.: 2000, Astrophys. J. Letters 543, L31
- Vázquez and Leitherer, 2005 Vázquez, G. A. and Leitherer, C.: 2005, Astrophys. J. 621, 695
- Vermeij and van der Hulst, 2002 Vermeij, R. and van der Hulst, J. M.: 2002, Astron. Astrophys. 391, 1081
- Vílchez et al., 1988 Vílchez, J. M., Pagel, B. E. J., Díaz, A. I., Terlevich, E., and Edmunds, M. G.: 1988, Mon. Not. R. Astron. Soc. 235, 633
- Vila-Costas and Edmunds, 1992 Vila-Costas, M. B. and Edmunds, M. G.: 1992, Mon. Not. R. Astron. Soc. 259, 121
- Vílchez and Esteban, 1996 Vílchez, J. M. and Esteban, C.: 1996, Mon. Not. R. Astron. Soc. 280, 720
- Vílchez and Pagel, 1988 Vílchez, J. M. and Pagel, B. E. J.: 1988, Mon. Not. R. Astron. Soc. 231, 257
- Wang et al., 2004 Wang, W., Liu, X.-W., Zhang, Y., and Barlow, M. J.: 2004, Astron. Astrophys. 427, 873
- Weaver and Woosley, 1993 Weaver, T. A. and Woosley, S. E.: 1993, Phys. Rep. 227, 65
- Wesson et al., 2005 Wesson, R., Liu, X.-W., and Barlow, M. J.: 2005, Mon. Not. R. Astron. Soc. 362, 424
- Whitmore and Schweizer, 1995 Whitmore, B. C. and Schweizer, F.: 1995, Astron. J. 109, 960
- Whitmore et al., 1993 Whitmore, B. C., Schweizer, F., Leitherer, C., Borne, K., and Robert, C.: 1993, Astron. J. 106, 1354
- Whitmore et al., 1999 Whitmore, B. C., Zhang, Q., Leitherer, C., Fall, S. M., Schweizer, F., and Miller, B. W.: 1999, Astron. J. 118, 1551
- Woods and Geller, 2007 Woods, D. F. and Geller, M. J.: 2007, Astron. J. 134, 527
- Woods et al., 2006 Woods, D. F., Geller, M. J., and Barton, E. J.: 2006, Astron. J. 132, 197
- Xu and Sulentic, 1991 Xu, C. and Sulentic, J. W.: 1991, Astrophys. J. 374, 407
- Zaritsky et al., 1994 Zaritsky, D., Kennicutt, Jr., R. C., and Huchra, J. P.: 1994, Astrophys. J. 420, 87
- Zeippen, 1982 Zeippen, C. J.: 1982, Mon. Not. R. Astron. Soc. 198, 111
- Zeippen et al., 1987 Zeippen, C. J., Le Bourlot, J., and Butler, K.: 1987, Astron. Astrophys. 188, 251
- Zepf et al., 1999 Zepf, S. E., Ashman, K. M., English, J., Freeman, K. C., and Sharples, R. M.: 1999, Astron. J. 118, 752
- Zwicky, 1966 Zwicky, F.: 1966, Astrophys. J. 143, 192
Chapter 5 Star Formation in Circumnuclear Regions: The metal abundance
5.1 Introduction
Despite its difficulty, the importance of an accurate determination of the abundances of high metallicity Hii regions cannot be overestimated since they constitute most of the Hii regions in early spiral galaxies (Sa to Sbc) and the inner regions of most late type ones (Sc to Sd) [1989epg..conf..377D, 1992MNRAS.259..121V] without which our description of the metallicity distribution in galaxies cannot be complete. In particular, the effects of the choice of different calibrations on the derivation of abundance gradients can be very important since any abundance profile fit will be strongly biased towards data points at the ends of the distribution. It should be kept in mind that abundance gradients are widely used to constrain chemical evolution models, histories of star formation over galactic discs or galaxy formation scenarios. The question of how high is the highest oxygen abundance in the gaseous phase of galaxies is still standing and extrapolation of known radial abundance gradients would point to CNSFRs as the most probable sites for these high metallicities.
As was pointed out in Chapter §4, the [Oiii] emission lines in CNSFRs are generally very weak ([Oiii] 5007/H 1; e.g. [2000A&A...353..893P]), and in some cases unobservable. This low value of these collisional excited lines can be explained by their over-solar metal abundances (e.g. [1993A&A...277..397B]). The equivalent width of the emission lines are lower than those shown by the disc Hii regions (see for example [1989AJ.....97.1022K, 1997AJ....113..975B, 1999ApJ...510..104B]). Kennicutt and collaborators found that the equivalent widths of H in CNSFRs are lower by a factor of seven than the ones in disc Hii regions. They suggest different mechanisms for this fact, none of them dominant: (i) strong deficiency of high-mass stars in the initial mass function; (ii) a long timescale star formation, with the excess continuum arising from more evolved stars, and the star formation nearly continuous over the “hot-spot” region as a whole; (iii) very high dust abundance; (iv) some of the nuclear Hii regions are not ionization bounded; (v) contamination of the continuum by contribution from the bulge or other underlying stellar populations.
Combining two-dimensional integral field unit data from GEMINI South (GMOS-IFU) and a grid of photo-ionization models [2008arXiv0802.2070D] conclude that the contamination of the continua of CNSFRs by underlying contributions from both old bulge stars and stars formed in the ring in previous episodes of star formation (10-20 Myr) yield the observed low equivalent widths, and correcting for these contributions they did not find significant differences in ages between the CNSFRs and the inner disc Hii regions.
NGC 2903, NGC 3351 and NGC 3504 have been studied using moderate spectral resolution data covering a broad spectral range to estimate the chemical abundances and densities of the CNSFRs. In Section 5.2 we present the sample with emphasis on NGC 3504 that has not been studied in Chapter $ 4. In §5.3, the observations and the data reduction procedures. The results are presented in Section §5.4. The method for the derivation of chemical abundances is described in Section §5.5. Section §5.6 is devoted to the discussion of our results. Finally, Section §5.7 summarizes the main conclusions of this part of the work.
5.2 Sample selection
We have obtained moderate resolution observations of 12 CNSFRs in three “hot-spot” galaxies: NGC 2903, NGC 3351 and NGC 3504. The three of them are early barred spirals and show a high star formation rate in their nuclear regions. They are quoted in the literature as among the spirals with the highest overall oxygen abundances [1994ApJ...420...87Z, tesisdiego]. High resolution spectroscopy on two of these objects, NGC 2903 and NGC 3351, were presented in Chapter §4.
The third one, NGC 3504 (see Figure 5.1), is the brightest galaxy in the optically selected catalogue of starburst galactic nuclei in Balzano [1983ApJ...268..602B]. It forms a pair with NGC 3512. Various studies at different wavelengths confirmed that it harbours a very intense nuclear starburst [1989ApJ...346..126D, 1990ApJ...364...77P]. Infrared observations in the J and K bands reveal a ring with five discrete clumps of star formation with colours indicating ages of about 10 yr [1997AJ....114.1850E]. The H emission from Planesas et al. [1997A&A...325...81P] traces a compact ring structure with a radius of 2 (200 pc) around the nucleus where four separate Hii regions can be identified. From the H emission, these authors derive a global star formation rate for the circumnuclear region of 0.62 M yr, while from their CO observations, a molecular gas mass of 21 10 M inside a circle 2.7 Kpc in diameter is derived.
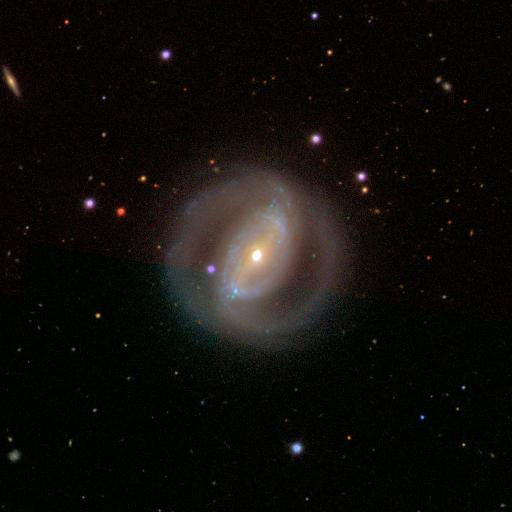
The main properties of these galaxies are given in Table 5.1.
| Property | NGC 2903 | NGC 3351 | NGC 3504 |
| R. A. (2000) | 09 32 10.1 | 10 43 57.7 | 11 03 11.2 |
| Dec (2000) | +21 30 03 | +11 42 14 | +27 58 21 |
| Morph. Type | SBbc | SBb | SABab |
| Distance (Mpc) | 8.6 | 10.1 | 20 |
| pc/ | 42 | 50 | 100 |
| B (mag) | 9.7 | 10.5 | 11.8 |
| E(B-V)(mag) | 0.031 | 0.028 | 0.027 |
| [1991trcb.book.....D] | |||
| NGC 2903: [1984AAS...56..381B] | |||
| NGC 3351: Graham et al. (1997) | |||
| NGC 3504: [1992ApJ...395L..79K] | |||
5.3 Observations and data reduction
Our spectrophotometric observations were obtained with the 4.2m William Herschel Telescope at the Roque de los Muchachos Observatory, in 2001 January 26, using the ISIS double spectrograph, with the EEV12 and TEK4 detectors in the blue and red arm respectively. The incoming light was split by the dichroic at 7500 Å. Gratings R300B in the blue arm and R600R in the red arm were used, covering 3400 Å in the blue (3650 to 7000) and 800 Å in the near IR (8850 to 9650) and yielding spectral dispersions of 1.73 Å pixel in the blue arm and 0.79 Å pixel in the red arm. With a slit width of 105, spectral resolutions of 2.0 Å and 1.5 Å FWHM in the blue and red arms respectively were attained. This is an optimal configuration which allows the simultaneous observation of a given region in both frames in a single exposure.
The nominal spatial sampling is 04 pixel in each frame and the average seeing for this night was 12. The journal of the observations is given in Table 5.2.
| Galaxy | Spectral range | Grating | Disp. | Spatial resolution | PA | Exposure Time |
|---|---|---|---|---|---|---|
| (Å) | (Å px) | ( px) | () | (sec) | ||
| NGC 2903 | 3650-7000 | R300B | 1.73 | 0.4 | 105 | 2 1800 |
| NGC 2903 | 8850-9650 | R600R | 0.79 | 0.4 | 105 | 2 1800 |
| NGC 2903 | 3650-7000 | R300B | 1.73 | 0.4 | 162 | 2 1800 |
| NGC 2903 | 8850-9650 | R600R | 0.79 | 0.4 | 162 | 2 1800 |
| NGC 3351 | 3650-7000 | R300B | 1.73 | 0.4 | 10 | 2 1800 |
| NGC 3351 | 8850-9650 | R600R | 0.79 | 0.4 | 10 | 2 1800 |
| NGC 3351 | 3650-7000 | R300B | 1.73 | 0.4 | 38 | 2 1800 |
| NGC 3351 | 8850-9650 | R600R | 0.79 | 0.4 | 38 | 2 1800 |
| NGC 3351 | 3650-7000 | R300B | 1.73 | 0.4 | 61 | 2 1800 |
| NGC 3351 | 8850-9650 | R600R | 0.79 | 0.4 | 61 | 2 1800 |
| NGC 3504 | 3650-7000 | R300B | 1.73 | 0.4 | 110 | 2 1800 |
| NGC 3504 | 8850-9650 | R600R | 0.79 | 0.4 | 110 | 2 1800 |
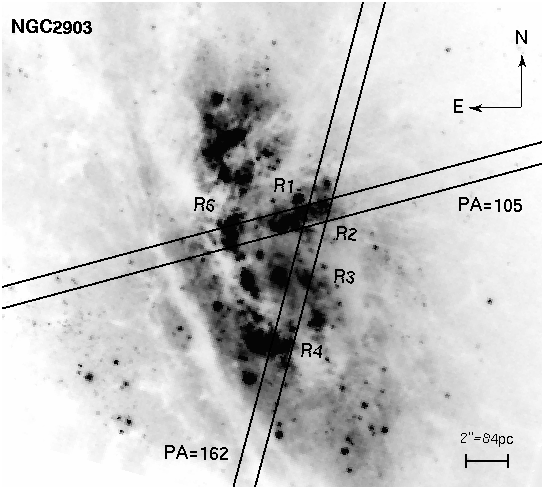
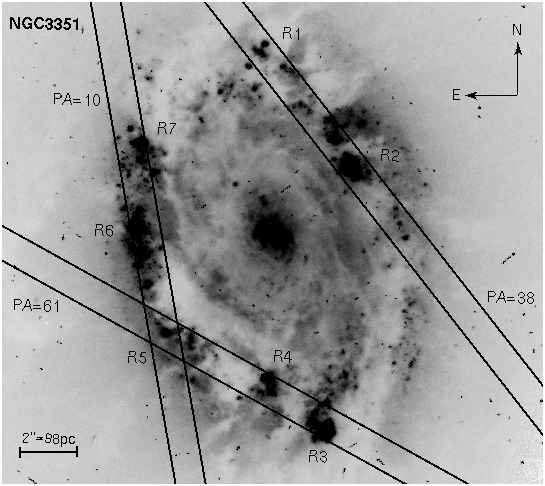
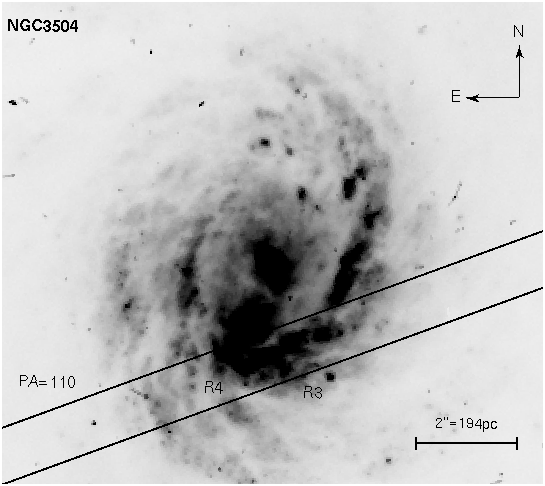
Two, three and one slit positions in NGC 2903, NGC 3351 and NGC 3504 respectively were chosen to observe a total of 12 CNSFRs. Figures 5.2-5.4 show the different slit positions superimposed on images obtained with the HST-WFPC2 camera and taken from the HST archive. Some characteristics of the observed regions, as given by Planesas et al. (1997), from where the identification numbers have also been taken, are listed in Table 5.3.
| Galaxy | Region | Offsets from center | Diameter | F(H) |
|---|---|---|---|---|
| 10 erg s cm | ||||
| NGC 2903 | R1+R2 | -1.7,+3.5 | 4.0 | 22.8 |
| R3 | -1.6,-0.3 | 2.0 | 2.6 | |
| R4 | -0.3,-3.3 | 2.4 | 10.1 | |
| R6 | +2.3,+2.4 | 2.4 | 12.7 | |
| NGC 3351 | R1 | +0.4,+6.5 | 2.4 | 12.3 |
| R2 | -2.6,+2.6 | 2.4 | 16.0 | |
| R3 | -1.5,-6.5 | 2.4 | 20.7 | |
| R4 | +0.5,5.4 | 2.2 | 10.5 | |
| R5 | +2.9,-3.5 | 2.4 | 4.9 | |
| R6 | +4.1,-0.4 | 2.4 | 6.1 | |
| R7 | +4.8,+3.6 | 1.8 | 9.5 | |
| NGC 3504 | R3+R4 | -0.5,-1.7 | 1.6 | 21.6 |
| Size of the circular aperture used to measure fluxes | ||||
The data were reduced using the IRAF111IRAF: the Image Reduction and Analysis Facility is distributed by the National Optical Astronomy Observatories, which is operated by the Association of Universities for Research in Astronomy, Inc. (AURA) under cooperative agreement with the National Science Foundation (NSF). package following standard methods. The two-dimensional wavelength calibration was accurate to 1 Å in all cases, obtained by means of Cu, Ne and Ar calibration lamps. The two-dimensional frames were flux calibrated using four spectroscopic standard stars: Feige 34, BD26+2606, HZ44 and HD84937, observed before and after each program object with a 3 width slit. For two of the standard stars: Feige 34 and HZ44, the fluxes have been obtained from the most updated version of the original Oke’s spectra [1990AJ.....99.1621O] and cover the 3200 to 9200 Å range. Data between 9200 and 9650 Å have been obtained from stellar atmosphere models. For the other two stars: BD26+2606 and HD84937, the fluxes have been taken from Oke and Gunn [1983ApJ...266..713O] that cover the whole spectral range. The agreement between the individual calibration curves was better than 5% in all cases and a weighted mean calibration curve was derived. The spectra were previously corrected for atmospheric extinction using a mean extinction curve applicable to La Palma observing site.
Regarding background subtraction, the high spectral dispersion used in the near infrared allowed the almost complete elimination of the night-sky OH emission lines and, in fact, the observed [Siii] 9532/ 9069 ratio is close to the theoretical value of 2.44 in most cases. Telluric absorptions have been removed from the spectra of the regions by dividing by the relatively featureless continuum of a subdwarf star observed in the same night.
![[Uncaptioned image]](/html/0908.4285/assets/chapter5/per-Halpha-2903-1.png)
![[Uncaptioned image]](/html/0908.4285/assets/chapter5/per-Halpha-3351-1.png)
![[Uncaptioned image]](/html/0908.4285/assets/chapter5/per-Halpha-3351-2.png)
![[Uncaptioned image]](/html/0908.4285/assets/chapter5/per-Halpha-3351-3.png)
![[Uncaptioned image]](/html/0908.4285/assets/chapter5/per-Halpha-3504.png)
5.4 Results
Figure 2.5.1 shows the spatial distribution of the H flux along the slit for the six different positions observed, one in NGC 3504, two in NGC 2903 and three in NGC 3351. The regions that were extracted into 1-D spectra are delimited by arrows. The spectra corresponding to each of the identified regions are shown in Figures 2.5.1, 2.5.1 and 5.8 for NGC 2903, NGC 3351 and NGC 3504, respectively.
![[Uncaptioned image]](/html/0908.4285/assets/chapter5/2903-r12-blue.png)
![[Uncaptioned image]](/html/0908.4285/assets/chapter5/2903-r3-blue.png)
![[Uncaptioned image]](/html/0908.4285/assets/chapter5/2903-r3-red.png)
![[Uncaptioned image]](/html/0908.4285/assets/chapter5/2903-r4-blue.png)
![[Uncaptioned image]](/html/0908.4285/assets/chapter5/2903-r4-red.png)
![[Uncaptioned image]](/html/0908.4285/assets/chapter5/2903-r6-blue.png)
![[Uncaptioned image]](/html/0908.4285/assets/chapter5/2903-r6-red.png)
![[Uncaptioned image]](/html/0908.4285/assets/chapter5/3351-r1-blue.png)
![[Uncaptioned image]](/html/0908.4285/assets/chapter5/3351-r2-blue.png)
![[Uncaptioned image]](/html/0908.4285/assets/chapter5/3351-r2-red.png)
![[Uncaptioned image]](/html/0908.4285/assets/chapter5/3351-r3-blue.png)
![[Uncaptioned image]](/html/0908.4285/assets/chapter5/3351-r3-red.png)
![[Uncaptioned image]](/html/0908.4285/assets/chapter5/3351-r4-blue.png)
![[Uncaptioned image]](/html/0908.4285/assets/chapter5/3351-r4-red.png)
![[Uncaptioned image]](/html/0908.4285/assets/chapter5/3351-r5-blue.png)
![[Uncaptioned image]](/html/0908.4285/assets/chapter5/3351-r6-blue.png)
![[Uncaptioned image]](/html/0908.4285/assets/chapter5/3351-r6-red.png)
![[Uncaptioned image]](/html/0908.4285/assets/chapter5/3351-r7-blue.png)
![[Uncaptioned image]](/html/0908.4285/assets/chapter5/3351-r7-red.png)
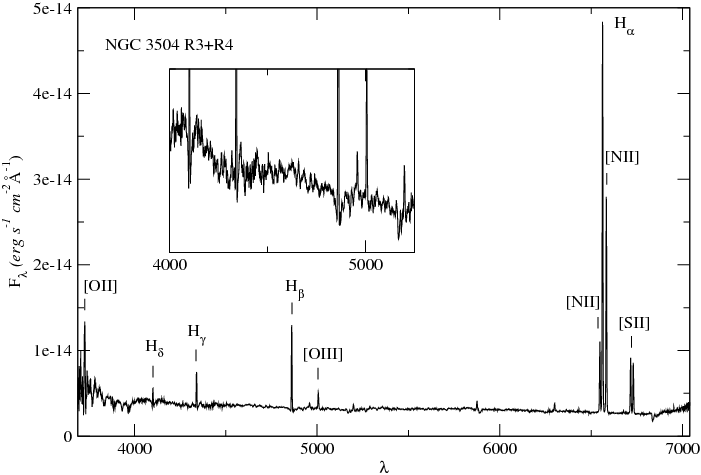
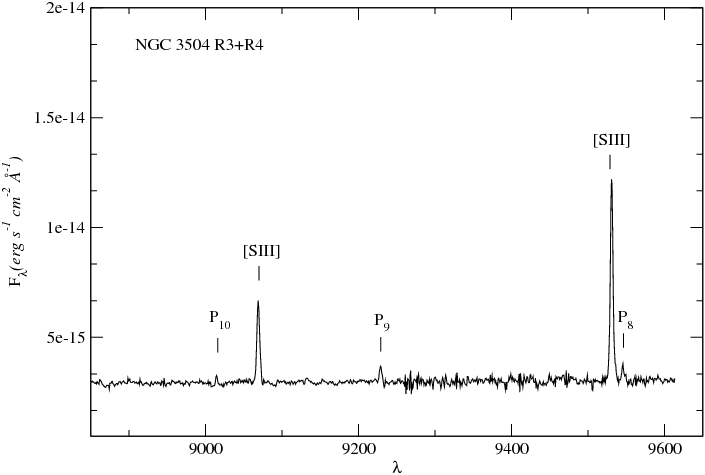
5.4.1 Underlying population
The presence of underlying Balmer stellar absorptions is clearly evident in the blue spectra of the observed regions (see Figures 2.5.1, 2.5.1 and 5.8) and complicates the measurements. A two-component – emission and absorption – Gaussian fit was performed in order to correct the Balmer emission lines for this effect. Examples of this procedure can be seen in Figure 2.5.1. The equivalent widths (in Åmstrongs) of the Gaussian absorption components resulting from the fits are given in Table 5.4 together with the ratio between the line flux measured after subtraction of the absorption component and the line flux measured without any correction and using a pseudo-continuum placed at the bottom of the line. This factor provides a value for the final correction to the measured fluxes in terms of each line flux. In regions R4 of NGC 2903 and R5 of NGC 3351 the H line is seen only in absorption. In region R5 of NGC 3351 also H is seen only in absorption. No fitting was performed for these lines, hence no correction is listed for them in Table 5.4. No prominent absorption wings are observed in the Hei and Paschen lines that would allow the fitting of an absorption component as it was done in the case of the Balmer lines. These lines were measured with respect to a local continuum placed at their base, which partially corrects by underlying absorption.
![[Uncaptioned image]](/html/0908.4285/assets/chapter5/fitting_2903_r4.png)
| Galaxy | Region | H | Corr. factor | H | Corr. factor | H | Corr. factor |
|---|---|---|---|---|---|---|---|
| (Å) | (Å) | (Å) | |||||
| NGC 2903 | R1+R2 | 2.3 | 1.15 | 3.1 | 1.17 | 2.9 | 1.09 |
| R3 | 2.8 | 1.17 | 3.6 | 1.21 | 3.5 | 1.09 | |
| R4 | 4.5 | – | 3.8 | 1.08 | 4.8 | 1.24 | |
| R6 | 3.0 | 1.04 | 2.6 | 1.06 | 3.9 | 1.18 | |
| NGC 3351 | R1 | 2.1 | 1.16 | 1.6 | 1.14 | 3.0 | 1.08 |
| R2 | 2.4 | 1.30 | 1.2 | 1.09 | 3.2 | 1.06 | |
| R3 | 2.5 | 1.16 | 1.2 | 1.07 | 1.2 | 1.03 | |
| R4 | 2.1 | 1.04 | 1.2 | 1.08 | 2.5 | 1.07 | |
| R5 | 3.7 | – | 2.5 | – | 3.7 | 1.27 | |
| R6 | 2.4 | 1.32 | 2.0 | 1.04 | 3.5 | 1.13 | |
| R7 | 2.4 | 1.26 | 2.1 | 1.17 | 3.4 | 1.09 | |
| NGC 3504 | R3+R4 | 4.5 | 1.25 | 3.6 | 1.18 | 4.4 | 1.10 |
5.4.2 Line intensity measurements
Emission line fluxes were measured on the extracted spectra using the IRAF SPLOT software package, by integrating the line intensity over a local fitted continuum. The errors in the observed line fluxes have been calculated from the expression = N[1 + EW/(N)], where is the error in the line flux, represents the standard deviation in a box near the measured emission line and stands for the error in the continuum placement, N is the number of pixels used in the measurement of the line flux, EW is the line equivalent width, and is the wavelength dispersion in Ångstroms per pixel. The first term represents the error in the line flux introduced by the uncertainty in the placement of the continuum, while the second one scales the signal-to-noise in the continuum to the line [1994ApJ...437..239G].
The Balmer emission lines were corrected for the underlying absorption as explained above. The logarithmic extinction at H, c(H), was calculated from the corrected Balmer line decrements assuming the Balmer line theoretical values for case B recombination [1971MNRAS.153..471B] for a temperature of 6000 K, as expected for high metallicity regions, and an average extinction law [1972ApJ...172..593M]. An example of this procedure is shown in Figure 5.10 for region R1+R2 of NGC 2903, where the logarithm of the quotient between observed and theoretical Balmer decrements is represented against the logarithmic extinction at the Balmer line wavelengths, f(). The tight relation found for a baseline from the Paschen lines to H can be taken as evidence of the reliability of our underlying absorption subtraction procedure for this region. This is also the case for most regions, although in some cases the H/H ratio lies above or below the reddening line, implying that in that case the subtraction procedure is not that good. This is not surprising since the presence of the G-band and other metal features in the left wing of H, makes the fitting less reliable than for the other Balmer lines. We have used all the available Balmer and Paschen-to-Balmer ratios, although due to the uncertainties in the emission line intensities of the higher order Balmer lines, which are difficult to estimate (in fact, in some regions they are seen only in absorption), these ratios have been given a lower weight in the fit. This almost amounts to deriving the values of c(H) from the H/H ratio and checking for consistency against the values measured for the Paschen lines, which are much less affected by underlying absorption due to the smaller contribution to the continuum from main sequence AF stars. The errors in c(H) have in fact been derived from the measured errors in the H and H lines, since in any weighted average these two lines have by far the largest weight.
The blue region of the spectrum near the Balmer discontinuity is dominated by absorption lines which cause a depression of the continuum and difficult the measurement of the [Oii] lines at 3727 Å. None of them however is at the actual wavelength of the [Oii] line. This can be seen in Figure 5.11 where we show the spectrum of region R1+R2 in NGC 2903 compared to that corresponding to a globular cluster of M 31, 337-068, of relatively high metallicity ([2000AJ....119..727B]; Mike Beasley, private communication). We have measured the line using a local continuum at its base as shown in the figure. The different continuum placements used for computing the error are shown by horizontal dotted lines.
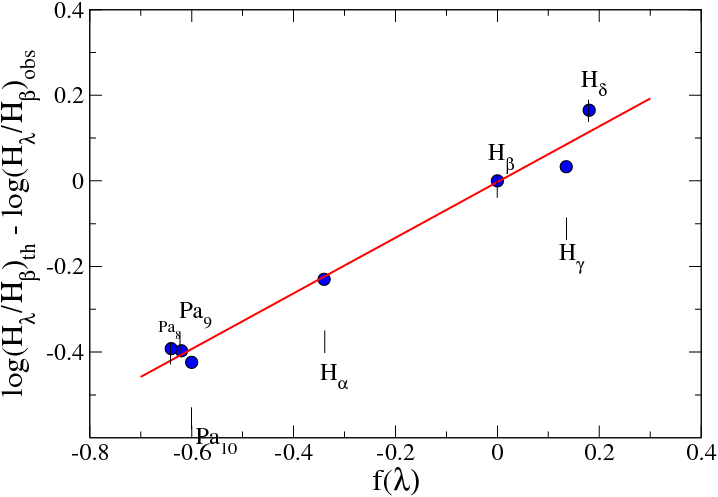
Once the reddening constant was found, the measured line intensities relative to H were corrected for interstellar reddening according to the assumed reddening law. The errors in the reddening corrected line intensities have been derived by means of error propagation theory. Measured and reddening corrected emission line fluxes, together with their corresponding errors, are given in Tables 5.5, 5.6 and 5.7 for the observed CNSFRs in NGC 2903, NGC 3351 and NGC 3504 respectively. Balmer emission lines are given after correction for underlying absorption. Also given in the tables are the assumed reddening law, the H intensity underlying absorption and extinction corrected, the H equivalent width, also corrected for absorption, and the reddening constant.
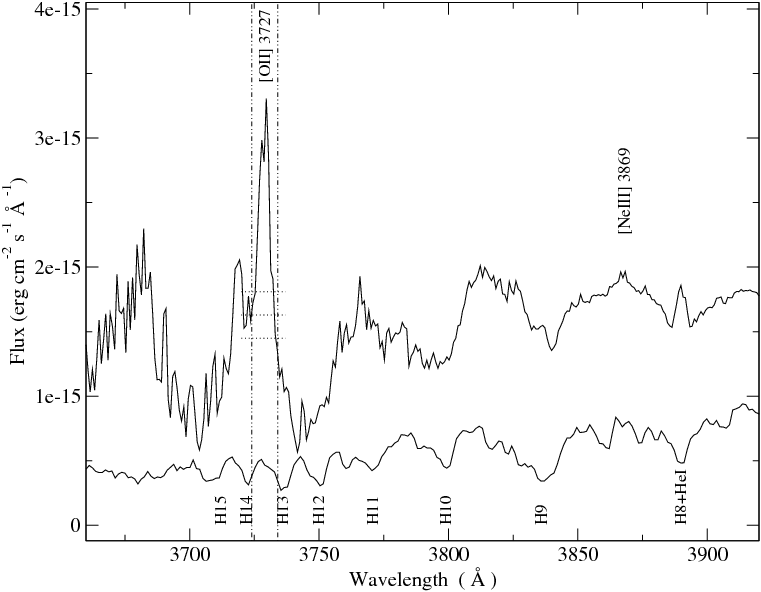
| Region | R1+R2 | R3 | R4 | R6 | ||||||
|---|---|---|---|---|---|---|---|---|---|---|
| (Å) | Line | f | F | I | F | I | F | I | F | I |
| 3727 | [Oii] | 0.271 | 26727 | 42844 | 333 33 | 430 45 | 421 42 | 841 88 | 198 20 | 310 31 |
| 4102 | H | 0.188 | 17911 | 24816 | 23516 | 28019 | – | – | 1459 | 19713 |
| 4340 | H | 0.142 | 43213 | 55217 | 55318 | 63220 | 16417 | 23524 | 29810 | 37713 |
| 4686 | Heii | 0.045 | 52 | 63 | – | – | – | – | 114 | 124 |
| 4861 | H | 0.000 | 100016 | 100016 | 100021 | 100021 | 100027 | 100028 | 100013 | 100013 |
| 4959 | [Oiii] | -0.024 | 436 | 415 | 785 | 765 | 13284 | 12579 | 413 | 403 |
| 5007 | [Oiii] | -0.035 | 1315 | 1235 | 22913 | 22212 | 39125 | 35723 | 1229 | 1158 |
| 5199 | [Ni] | -0.078 | 568 | 497 | 6526 | 6024 | 13945 | 11437 | 6015 | 5313 |
| 5876 | Hei | -0.209 | 7914 | 5510 | 9726 | 8021 | – | – | 9717 | 6912 |
| 6300 | [Oi] | -0.276 | 396 | 243 | 5413 | 4110 | 5614 | 287 | 4013 | 258 |
| 6312 | [Siii] | -0.278 | 71 | 41 | – | – | – | – | – | – |
| 6548 | [Nii] | -0.311 | 67511 | 39412 | 53616 | 40017 | 86662 | 39131 | 52917 | 31812 |
| 6563 | H | -0.313 | 489745 | 285026 | 382643 | 285032 | 634150 | 285022 | 475938 | 285023 |
| 6584 | [Nii] | -0.316 | 208219 | 120633 | 167947 | 124754 | 266666 | 118952 | 170726 | 101727 |
| 6678 | Hei | -0.329 | 83 | 42 | – | – | – | – | – | – |
| 6717 | [Sii] | -0.334 | 49814 | 28011 | 47228 | 34524 | 81134 | 34620 | 52815 | 30611 |
| 6731 | [Sii] | -0.336 | 43216 | 24211 | 39124 | 28520 | 69931 | 29718 | 45016 | 26011 |
| 8863 | P11 | -0.546 | 368 | 143 | – | – | – | – | – | – |
| 9016 | P10 | -0.557 | 467 | 183 | – | – | – | – | 5314 | 216 |
| 9069 | [Siii] | -0.561 | 15710 | 605 | 1039 | 616 | 22033 | 539 | 13711 | 555 |
| 9230 | P9 | -0.572 | 618 | 233 | – | – | – | – | 8716 | 346 |
| 9532 | [Siii] | -0.592 | 39316 | 1419 | 33716 | 19315 | 50853 | 11214 | 45029 | 17113 |
| 9547 | P8 | -0.593 | 12814 | 465 | 12817 | 7311 | 30558 | 6714 | 19220 | 738 |
| c(H) | 0.750.04 | 0.410.05 | 1.110.05 | 0.710.03 | ||||||
| I(H) | 13.70.22 | 1.800.04 | 7.760.21 | 6.840.09 | ||||||
| EW(H)(Å) | 12.70.2 | 8.20.2 | 2.60.1 | 9.60.2 | ||||||
| in units of 10 erg s cm | ||||||||||
| Region | R1 | R2 | R3 | R4 | ||||||
|---|---|---|---|---|---|---|---|---|---|---|
| (Å) | Line | f | F | I | F | I | F | I | F | I |
| 3727 | [Oii] | 0.271 | 282 28 | 455 46 | 172 17 | 230 23 | 226 23 | 336 34 | 188 19 | 271 28 |
| 4102 | H | 0.188 | 1647 | 2299 | 2707 | 3309 | 2556 | 3358 | 21813 | 28116 |
| 4340 | H | 0.142 | 3728 | 47810 | 3888 | 4529 | 4347 | 5349 | 38614 | 46717 |
| 4686 | Heii | 0.045 | – | – | – | – | – | – | – | – |
| 4861 | H | 0.000 | 100010 | 100010 | 100010 | 100010 | 10009 | 10009 | 100018 | 100018 |
| 4959 | [Oiii] | -0.024 | 362 | 342 | 474 | 464 | 272 | 262 | 283 | 273 |
| 5007 | [Oiii] | -0.035 | 1066 | 1006 | 1406 | 1356 | 844 | 794 | 838 | 798 |
| 5199 | [Ni] | -0.078 | 4913 | 4211 | 6116 | 5614 | 388 | 347 | 6117 | 5515 |
| 5876 | Hei | -0.209 | 6512 | 458 | 6327 | 5121 | 6910 | 517 | 5510 | 417 |
| 6300 | [Oi] | -0.276 | 246 | 154 | 3110 | 237 | 194 | 133 | 195 | 133 |
| 6312 | [Siii] | -0.278 | – | – | – | – | – | – | – | – |
| 6548 | [Nii] | -0.311 | 56517 | 32612 | 47616 | 34114 | 58413 | 37211 | 45724 | 30118 |
| 6563 | H | -0.313 | 495248 | 285028 | 398142 | 285030 | 449437 | 285024 | 434245 | 285030 |
| 6584 | [Nii] | -0.316 | 173930 | 99627 | 148921 | 106327 | 171919 | 108623 | 140634 | 91935 |
| 6678 | Hei | -0.329 | 164 | 92 | 52 | 32 | 154 | 93 | – | – |
| 6717 | [Sii] | -0.334 | 3859 | 2147 | 35313 | 24711 | 3476 | 2135 | 36618 | 23314 |
| 6731 | [Sii] | -0.336 | 3539 | 1957 | 33712 | 23510 | 3308 | 2036 | 32215 | 20511 |
| 8863 | P11 | -0.546 | 365 | 142 | – | – | – | – | – | – |
| 9016 | P10 | -0.557 | 535 | 202 | 181 | 101 | 407 | 183 | 244 | 122 |
| 9069 | [Siii] | -0.561 | 26415 | 987 | 1187 | 655 | 23313 | 1036 | 13913 | 667 |
| 9230 | P9 | -0.572 | 926 | 333 | 435 | 233 | 667 | 293 | 6651 | 3124 |
| 9532 | [Siii] | -0.592 | 69730 | 24514 | 30116 | 16011 | 58130 | 24515 | 34621 | 15613 |
| 9547 | P8 | -0.593 | 895 | 312 | 2472 | 1315 | 1031 | 431 | 927 | 424 |
| c(H) | 0.770.03 | 0.460.03 | 0.630.02 | 0.580.04 | ||||||
| I(H) | 9.630.10 | 8.870.09 | 11.40.11 | 3.410.06 | ||||||
| EW(H)(Å) | 14.60.2 | 9.50.1 | 18.10.3 | 12.30.3 | ||||||
| in units of 10 erg s cm | ||||||||||
| Region | R5 | R6 | R7 | |||||
|---|---|---|---|---|---|---|---|---|
| (Å) | Line | f | F | I | F | I | F | I |
| 3727 | [Oii] | 0.271 | 348 35 | 521 61 | 350: | 495: | 196: | 284: |
| 4102 | H | 0.188 | – | – | 856 | 1097 | 1939 | 24911 |
| 4340 | H | 0.142 | – | – | 26211 | 31513 | 40010 | 48612 |
| 4686 | Heii | 0.045 | – | – | – | – | 124 | 125 |
| 4861 | H | 0.000 | 100037 | 100037 | 100020 | 100020 | 100013 | 100013 |
| 4959 | [Oiii] | -0.024 | 13813 | 13412 | 32: | 31: | 342 | 332 |
| 5007 | [Oiii] | -0.035 | 40937 | 38835 | 96: | 91: | 1007 | 967 |
| 5199 | [Ni] | -0.078 | 7833 | 7029 | 6119 | 5517 | 6113 | 5512 |
| 5876 | Hei | -0.209 | – | – | – | – | 368 | 276 |
| 6300 | [Oi] | -0.276 | 4714 | 3110 | – | – | 145 | 94 |
| 6312 | [Siii] | -0.278 | – | – | – | – | – | – |
| 6548 | [Nii] | -0.311 | 62243 | 39139 | 42028 | 28220 | 41217 | 26913 |
| 6563 | H | -0.313 | 454352 | 285095 | 425944 | 285030 | 438234 | 285022 |
| 6584 | [Nii] | -0.316 | 1928109 | 1204109 | 127255 | 84845 | 128929 | 83526 |
| 6678 | Hei | -0.329 | – | – | – | – | 73 | 42 |
| 6717 | [Sii] | -0.334 | 54837 | 33334 | 27518 | 18013 | 34512 | 2189 |
| 6731 | [Sii] | -0.336 | 48733 | 29530 | 24817 | 16112 | 32511 | 2058 |
| 8863 | P11 | -0.546 | – | – | – | – | – | – |
| 9016 | P10 | -0.557 | – | – | – | – | 223 | 101 |
| 9069 | [Siii] | -0.561 | 19120 | 8313 | 8913 | 437 | 11213 | 526 |
| 9230 | P9 | -0.572 | 8829 | 3813 | 3611 | 175 | 667 | 304 |
| 9532 | [Siii] | -0.592 | 41539 | 17228 | 20212 | 958 | 30729 | 13614 |
| 9547 | P8 | -0.593 | – | – | 7411 | 356 | 871 | 392 |
| c(H) | 0.650.10 | 0.560.043 | 0.600.03 | |||||
| I(H) | 2.040.07 | 3.260.07 | 8.050.10 | |||||
| EW(H)(Å) | 3.10.1 | 4.90.1 | 9.00.2 | |||||
| in units of 10 erg s cm | ||||||||
| Region | R3+R4 | |||
|---|---|---|---|---|
| (Å) | Line | f | F | I |
| 3727 | [Oii] | 0.271 | 953 95 | 1395 141 |
| 4102 | H | 0.188 | 2505 | 3267 |
| 4340 | H | 0.142 | 4606 | 5618 |
| 4686 | Heii | 0.045 | – | – |
| 4861 | H | 0.000 | 10008 | 10008 |
| 4959 | [Oiii] | -0.024 | 634 | 614 |
| 5007 | [Oiii] | -0.035 | 1928 | 1837 |
| 5199 | [Ni] | -0.078 | 6915 | 6213 |
| 5876 | Hei | -0.209 | 8711 | 658 |
| 6300 | [Oi] | -0.276 | 807 | 545 |
| 6312 | [Siii] | -0.278 | – | – |
| 6548 | [Nii] | -0.311 | 81817 | 52913 |
| 6563 | H | -0.313 | 442329 | 285019 |
| 6584 | [Nii] | -0.316 | 246629 | 158330 |
| 6678 | Hei | -0.329 | 174 | 113 |
| 6717 | [Sii] | -0.334 | 65213 | 40810 |
| 6731 | [Sii] | -0.336 | 59912 | 3749 |
| 8863 | P11 | -0.546 | – | – |
| 9016 | P10 | -0.557 | 347 | 153 |
| 9069 | [Siii] | -0.561 | 32713 | 1497 |
| 9230 | P9 | -0.572 | 958 | 434 |
| 9532 | [Siii] | -0.592 | 80225 | 35015 |
| 9547 | P8 | -0.593 | – | – |
| c(H) | 0.610.02 | |||
| I(H) | 20.80.17 | |||
| EW(H)(Å) | 15.20.2 | |||
| in units of 10 erg s cm | ||||
5.5 Chemical abundances
Electron densities for each observed region have been derived from the [Sii] 6717, 6731 Å line ratio, following standard methods (e.g. [1989agna.book.....O]). They were found to be, in all cases, 600 cm, higher than those usually derived in disc Hii regions, but still below the critical value for collisional de-excitation.
The low excitation of the regions, as evidenced by the weakness of the [Oiii] 5007 Å line (see left panels of Figures 2.5.1, 2.5.1 and 5.8), precludes the detection and measurement of the auroral [Oiii] 4363 Å necessary for the derivation of the electron temperature. It is therefore impossible to obtain a direct determination of the oxygen abundances. Empirical calibrations have to be used instead.
Different calibrators for strong emission lines have been proposed in the literature for different kinds of objects involving different chemical elements, among others, the oxygen abundance parameter R O [1979MNRAS.189...95P], the nitrogen N2 parameter [2002MNRAS.330...69D] and the sulphur abundance parameter S [2000MNRAS.312..130D]. Also, calibrators involving a combination of emission lines of two elements have been proposed, such as [Oiii]/[Nii] [1979A&A....78..200A], [Ariii] 7135 Å/[Oiii] 5007 Å and [Siii] 9069 Å/[Oiii] 5007 Å [2006A&A...454L.127S]. Our CNSFRs, show very weak lines of [Oiii] which are measured with large errors. This is taken as evidence for high metallicity in these regions. This, in turn, may imply values of N/O larger than solar, due to the chemical evolution of the regions themselves and the increasing production of secondary nitrogen. Hence, we have considered the use of the N2 parameter unreliable for this kind of objects. On the other hand, the [Siii] lines are seen to be strong as compared to the [Oiii] lines (see right panels of Figures 2.5.1, 2.5.1 and 5.8). Recently, the combination of both the oxygen abundance, O, and sulphur abundance, S, parameters has been claimed to be a good metallicity indicator for high metallicity Hii regions [2000MNRAS.312..130D, 2005MNRAS.361.1063P]. From now onwards we will call this parameter SO, and is defined as:
This parameter is similar to the SO proposed by [2006A&A...454L.127S] but is, at first order, independent of geometrical (ionization parameter) effects. The amount of available data on sulphur emission lines is increasingly growing, especially in the high metallicity regime. This makes possible for the first time to calibrate the electron temperature of [Siii] in terms of the SO parameter. To perform this calibration we have compiled all the data so far at hand with sulphur emission line data both for the auroral and nebular lines at 6312 Å and 9069,9532 Å respectively. The sample comprises data on galactic [tesisjorge] and extragalactic [1987MNRAS.226...19D, 1988MNRAS.235..633V, 1993MNRAS.260..177P, 1997ApJ...489...63G, 1994ApJ...437..239G, 1995ApJ...439..604G, 2000MNRAS.318..462D, 2002MNRAS.329..315C, 2003ApJ...591..801K, 2004ApJ...615..228B, 2005A&A...441..981B] Hii regions and Hii galaxies [1993ApJ...411..655S, 1994ApJ...431..172S, 2003MNRAS.346..105P, 2006MNRAS.372..293H, 2008MNRAS.383..209H]. The data on extragalactic Hii regions has been further split into low and high metallicity Hii regions according to the criterion of [2000MNRAS.312..130D], i.e. log 0.47 and -0.5 0.28 implies oversolar abundances. For all the regions the [Siii] electron temperature has been derived from the ratio between the auroral and the nebular sulphur lines, using a five-level atom program [1995PASP..107..896S] and the collisional strengths from [1999ApJ...526..544T], through the task TEMDEN as implemented in the IRAF package. The calibration is shown in Figure 5.12 together with the quadratic fit to the high metallicity Hii region data:
Figure 2.5.1 shows the comparison between the electron temperatures and ionic sulphur abundances derived from measurements of the auroral sulphur line 6312 Å and our derived calibration. The S/H and S/H ionic ratios (see Chapter §2) have been derived from:
These expressions have been derived by performing appropriate fittings to the IONIC task results following the functional form given in [1992MNRAS.255..325P]. The assumption has been made that T([Siii]) T([Sii]) in the observed regions. This assumption seems to be justified in view of the results presented by [2005A&A...441..981B].
We have used the calibration above to derive t([Siii]) for our observed CNSFRs. In all cases the values of log are inside the range used in performing the calibration, thus requiring no extrapolation of the fit. These temperatures, in turn, have been used to derive the S/H and S/H ionic ratios. The derived T and ionic abundances for sulphur are given in Table 5.8, together with measured values of the electron density. Temperature and abundance errors are formal errors calculated from the measured line intensity errors applying error propagation formulae, without assigning any error to the temperature calibration itself.
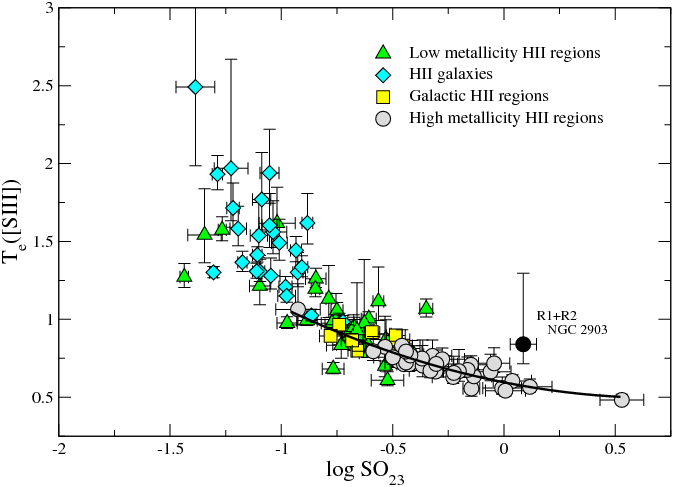
![[Uncaptioned image]](/html/0908.4285/assets/chapter5/TSIII_comparison_2.png)
| Galaxy | Region | N | T([Siii]) | 12+log (S/H) | 12+log (S/H) | 12+log[ (S+S)/H] |
|---|---|---|---|---|---|---|
| (cm) | (K) | |||||
| NGC 2903 | R1+R2 | 280 90 | 5731 188 | 6.83 0.04 | 6.50 0.05 | 7.01 0.05 |
| R3 | 230 135 | 5737 210 | 6.91 0.06 | 6.60 0.06 | 7.09 0.06 | |
| R4 | 270 120 | 6660 331 | 6.68 0.06 | 6.21 0.08 | 6.81 0.06 | |
| R6 | 250 80 | 5413 221 | 6.97 0.05 | 6.64 0.06 | 7.14 0.05 | |
| NGC 3351 | R1 | 360 80 | 5683 188 | 6.74 0.04 | 6.75 0.05 | 7.05 0.04 |
| R2 | 440 110 | 5405 210 | 6.90 0.05 | 6.65 0.06 | 7.09 0.05 | |
| R3 | 430 70 | 5399 210 | 6.84 0.04 | 6.83 0.05 | 7.14 0.05 | |
| R4 | 310 120 | 5390 271 | 6.87 0.06 | 6.64 0.07 | 7.07 0.07 | |
| R5 | 360 230 | 6177 286 | 6.78 0.07 | 6.49 0.09 | 6.97 0.08 | |
| R6 | 360 170 | 6297 295 | 6.49 0.06 | 6.20 0.07 | 6.67 0.07 | |
| R7 | 410 100 | 5537 220 | 6.80 0.05 | 6.52 0.07 | 6.99 0.06 | |
| NGC 3504 | R3+R4 | 370 60 | 6288 170 | 6.86 0.03 | 6.77 0.03 | 7.12 0.03 |
Once the sulphur ionic abundances have been derived, we have estimated the corresponding oxygen abundances. In order to do that, we have assumed that sulphur and oxygen electron temperatures follow the relation given by [1992AJ....103.1330G] and confirmed by more recent data ([2006MNRAS.372..293H], see Chapter §2), and hence we have derived t([Oiii]) according to the expression:
We have also assumed that t ([Oii]) t([Siii]). The values of T([Oiii]) and the ionic abundances for oxygen are given in Table 5.9. The same comments regarding errors mentioned above apply. Finally, we have derived the N/O ratio assuming that t([Oii]) t([Nii]) t([Siii]). These values are also listed in Table 5.9.
| Galaxy | Region | T([Oiii]) | 12+log(O/H) | 12+log(O/H) | 12+log[(O+O)/H] | log(N/O) |
|---|---|---|---|---|---|---|
| (K) | ||||||
| NGC 2903 | R1+R2 | 4855 226 | 8.55 0.08 | 8.11 0.08 | 8.69 0.08 | -0.37 0.07 |
| R3 | 4863 253 | 8.55 0.09 | 8.37 0.09 | 8.77 0.09 | -0.36 0.08 | |
| R4 | 5975 399 | 8.42 0.10 | 8.04 0.14 | 8.57 0.11 | -0.50 0.08 | |
| R6 | 4473 267 | 8.59 0.10 | 8.33 0.10 | 8.79 0.10 | -0.38 0.07 | |
| NGC 3351 | R1 | 4798 227 | 8.60 0.08 | 8.06 0.08 | 8.72 0.08 | -0.49 0.07 |
| R2 | 4463 253 | 8.47 0.09 | 8.41 0.10 | 8.74 0.09 | -0.23 0.07 | |
| R3 | 4456 253 | 8.64 0.09 | 8.17 0.10 | 8.77 0.09 | -0.38 0.07 | |
| R4 | 4445 327 | 8.55 0.11 | 8.19 0.13 | 8.71 0.12 | -0.37 0.08 | |
| R5 | 5393 344 | 8.42 0.10 | 8.34 0.10 | 8.68 0.10 | -0.37 0.10 | |
| R6 | 5538 356 | 8.34 0.10 | 7.62 0.17 | 8.42 0.11 | -0.47 0.08 | |
| R7 | 4622 266 | 8.48 0.09 | 8.15 0.10 | 8.65 0.10 | -0.40 0.07 | |
| NGC 3504 | R3+R4 | 5527 205 | 8.79 0.07 | 7.94 0.06 | 8.85 0.07 | -0.65 0.06 |
For one of the observed regions, R1+R2 in NGC 2903, the [Siii] 6312 Å has been detected and measured. Although the line intensity ratios for this region presented in Table 5.5 have been measured on the combined spectrum of slit positions 1 and 2, the placement of the continuum for the [Siii] 6312 Å line was very uncertain. Therefore, we have performed the temperature measurement on the spectrum extracted from slit position 1, which shows the best defined continuum. On this spectrum we have measured the intensity of the [Siii] 6312 Å line with respect to H, and those of [Siii] 9069, 9532 Å with respect to P9 9329, in order to minimize reddening corrections. The region of this spectrum around the [Siii] 6312 Å line is shown in Figure 5.14 where the horizontal lines show the different placements of the continuum used to measure the line and calculate the corresponding errors. The obtained [Siii] nebular to auroral line ratio is: 79.4 49.1 which gives a T([Siii]) = 8400K, slightly higher than predicted by the proposed fit. This region is represented as a solid black circle in Figure 5.12.
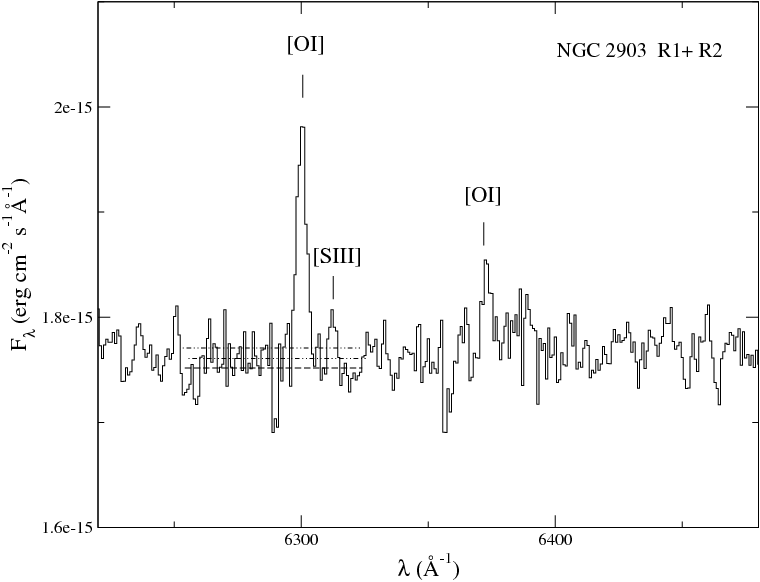
5.6 Discussion on metal abundances
5.6.1 Characteristics of the observed CNSFRs
Planesas et al. (1997) provide H fluxes (from images) for all our observed regions. These values are larger than those measured inside our slit by factors between 1.0 and 2.7, depending on the size of the region, something to be expected given the long-slit nature of our observations. We have calculated the regions’ H luminosities from our observed values, correcting for extinction according to the values found from the spectroscopic analysis. The resulting values are listed in Table 5.10. These values are larger than the typical ones found for disc Hii regions and overlap with those measured in Hii galaxies. The region with the largest H luminosity is R3+R4 in NGC 3504, for which a value of 2.02 10 erg s is measured.
We have derived the number of hydrogen ionizing photons [] from the extinction corrected H flux as:
where F(H) is in erg cm s and the distance, D, is in Mpc.
The ionization parameter, , can be estimated from the [Sii]/[Siii] ratio [1991MNRAS.253..245D] as:
and ranges between -3.12 and -3.98 for our observed CNSFRs, in the low side of what is found for disc Hii regions, even in the cases of high metallicity (see [1991MNRAS.253..245D]).
From the calculated values of the number of Lyman photons, Q(H), ionization parameter and electron density, it is possible to derive the size of the emitting regions as well as the filling factor (see [2002MNRAS.329..315C]). The derived sizes are between 1.5 arcsec for region R3 in NGC 3351 and 5.7 arcsec for region R4 in NGC 2903; these values correspond to linear dimensions between 74 and 234 pc. The derived filling factors are low: between 6 10 and 1 10, lower than commonly found in giant Hii regions ( 0.01). Sizes in arcsec, filling factors and the corresponding masses of ionized hydrogen, M(Hii), are given in Table 5.10.
We have also derived the mass of ionizing stars, M, from the calculated number of hydrogen ionizing photons with the use of evolutionary models of ionizing clusters [1994ApJS...91..553G, 1996ApJS..107..661S] assuming that the regions are ionization bound and that no photons are absorbed by dust. A Salpeter IMF with upper and lower mass limits of 100 and 0.8 M respectively, has been assumed. According to these models, a relation exists between the degree of evolution of the cluster, as represented by its H emission line equivalent width and the number of hydrogen ionizing photons per unit solar mass [1998Ap&SS.263..143D, 2000MNRAS.318..462D]. The ionizing cluster masses thus derived are given in Table 5.10 and range between 1.1 10 and 4.7 10 M. The measured H equivalent widths, however, are very low and could be reflecting the contribution by underlying non-ionizing populations. An alternative way to take into account the cluster evolution in the derivation of the mass is to make use of the existing relation between the ionization parameter and the H equivalent width for ionized regions [2006MNRAS.365..454H]. In that case, the derived masses are lower by factors between 1.5 and 15. At any rate, given the assumptions of no dust absorption or photon leakage, these masses represent lower limits.
| Galaxy | Region | F(H) | L(H) | Q(H) | log u | Diameter | M | M(Hii) | |
| (erg cm s) | (erg s) | (ph s) | (arcsec) | ||||||
| NGC 2903 | R1+R2 | 3.06E-13 | 2.71E+39 | 1.98E+51 | -3.69 | 4.66 | 5.93E-04 | 7.39 | 0.144 |
| R3 | 3.16E-14 | 2.80E+38 | 2.05E+50 | -3.65 | 1.59 | 2.29E-03 | 1.11 | 0.018 | |
| R4 | 2.23E-13 | 1.98E+39 | 1.45E+51 | -3.98 | 5.70 | 2.54E-04 | 21.1 | 0.109 | |
| R6 | 1.48E-13 | 1.31E+39 | 9.60E+50 | -3.66 | 3.33 | 9.89E-04 | 4.55 | 0.078 | |
| NGC 3351 | R1 | 2.19E-13 | 2.65E+39 | 1.94E+51 | -3.12 | 1.81 | 3.76E-03 | 6.40 | 0.109 |
| R2 | 1.61E-13 | 1.95E+39 | 1.42E+51 | -3.55 | 2.29 | 9.08E-04 | 6.80 | 0.066 | |
| R3 | 2.35E-13 | 2.84E+39 | 2.08E+51 | -3.12 | 1.72 | 3.31E-03 | 5.70 | 0.098 | |
| R4 | 6.84E-14 | 8.29E+38 | 6.06E+50 | -3.49 | 1.66 | 2.04E-03 | 2.32 | 0.040 | |
| R5 | 4.25E-14 | 5.15E+38 | 3.76E+50 | -3.65 | 1.47 | 1.37E-03 | 4.71 | 0.021 | |
| R6 | 6.43E-14 | 7.79E+38 | 5.70E+50 | -3.65 | 1.81 | 1.11E-03 | 4.81 | 0.032 | |
| R7 | 1.60E-13 | 1.94E+39 | 1.42E+51 | -3.58 | 2.47 | 8.31E-04 | 7.11 | 0.070 | |
| NGC 3504 | R3+R4 | 4.20E-13 | 2.02E+40 | 1.47E+52 | -3.32 | 3.11 | 6.76E-04 | 47.0 | 0.807 |
| masses in 10 M. | |||||||||
5.6.2 Metallicity estimates
The abundances we derive using our T([Siii]) calibration are comparable to those found by Bresolin et al. (2005) for their sample of high metallicity Hii regions. Most of our CNSFRs show total oxygen abundances, taken to be O/H= O/H + O/H, consistent with solar values within the errors. The region with the highest oxygen abundance is R3+R4 in NGC 3504: 12+log(O/H) = 8.85, about 1.6 solar if the solar oxygen abundance is set at the value derived by Asplund et al. (2005), 12+log(O/H) = 8.660.05. Region R6 in NGC 3351 has the lowest oxygen abundance of the sample, about 0.6 times solar. In all the observed CNSFRs the O/H abundance is dominated by the O/H contribution with 0.18 log(O/O) 0.85. This is also the case for high metallicity disc Hii regions where these values are even higher. For our observed regions, also the S/S ratios are larger than one, which is at odds with the high metallicity disc Hii regions for which, in general, the sulphur abundances are dominated by S/H.
The fact that both O/H and S/H seem to be dominated by the lower ionization species, can raise concern about our method of abundance derivation, based on the calibration of the T([Siii]). In a recent article [2007MNRAS.375..685P] addresses this particular problem. He proposes a calibration of the ratio of the [Nii] nebular-to-auroral line intensities in terms of those of the nebular oxygen lines. Then the [Nii] electron temperature, thought to properly characterize the low ionization zone of the nebula, can be obtained. We have applied Pilyugin (2007) to our observed CNSFRs and to the high metallicity Hii sample. Figure 5.15 shows the derived t([Nii]) following Pilyugin’s method against the t([Siii]) derived from our calibration. The red dashed line shows the one-to-one relation while the (black) solid line shows the actual fit to all the data. It can be seen that, in what regards CNSFR, both temperatures are very similar, with the [Nii] temperature being, in average, 500 K higher than that of [Siii]. This difference is of the same size of the average errors in the measured temperatures entering the calibrations, therefore we can assume that our derived t([Siii]) characterizes the low ionization zone at least as well as the t([Nii]) derived applying Pilyugin’s method.
Concerning relative abundances, with our analysis it is possible to derive the relative N/O value, assumed to be equal to the N/O ratio. These values are in all cases larger than the solar one (log(N/O)= -0.88; Asplund et al., 2005) by factors between 1.7 (R3+R4 in NGC 3504) and 4.5 (R2 in NGC 3351) which are amongst the highest observed N/O ratios (see e.g. [2006MNRAS.372.1069M]). Regarding S, if – given the low excitation of the observed regions – the fraction of S is assumed to be negligible, the S/O ratio can be obtained as:
The values of log(S/O) span a very narrow range between -1.76 and -1.63, that is between 0.6 and 0.8 of the solar value (log(S/O) = -1.52; [2005ASPC..336...25A]).
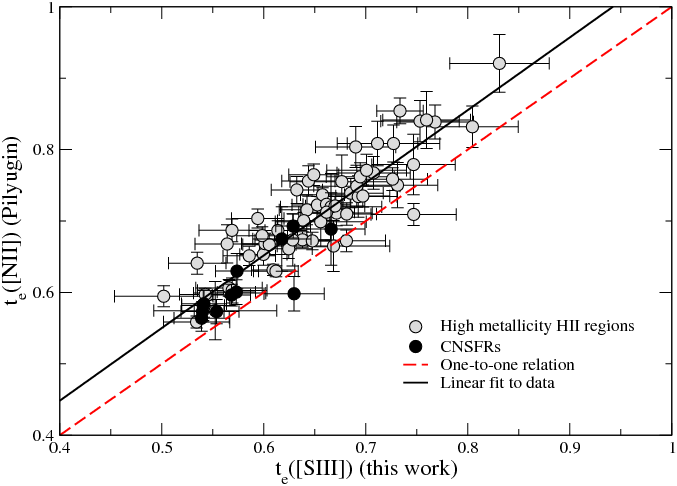
5.6.3 Comparison with high metallicity Hii regions
The observed CNSFRs being of high metallicity show however marked differences with respect to high metallicity disc Hii regions. Even though their derived oxygen and sulphur abundances are similar, they show values of the O and the N2 parameters whose distributions are shifted to lower and higher values respectively with respect to the high metallicity disc sample (Figure 2.5.1). Hence, if pure empirical methods were used to estimate the oxygen abundances for these regions, higher values would in principle be obtained. This would seem to be in agreement with the fact that CNSFR, when compared to the disc high metallicity regions, show the highest [Nii]/[Oii] ratios. Figure 5.17 shows indeed a bi-modal distribution of the [Nii]/[Oii] ratio in disc and circumnuclear Hii regions.
![[Uncaptioned image]](/html/0908.4285/assets/chapter5/histo_N2.png)
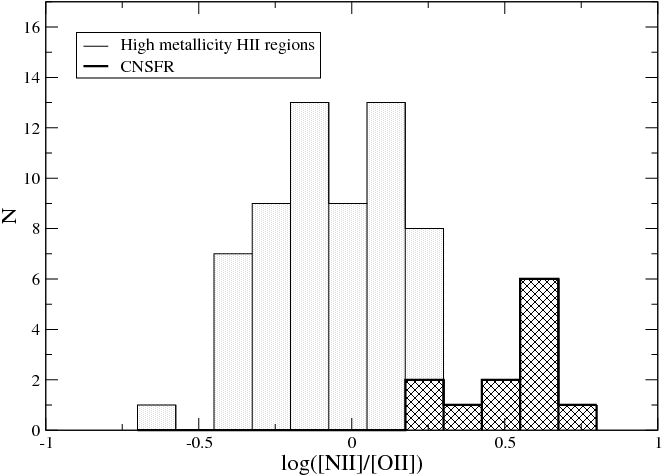
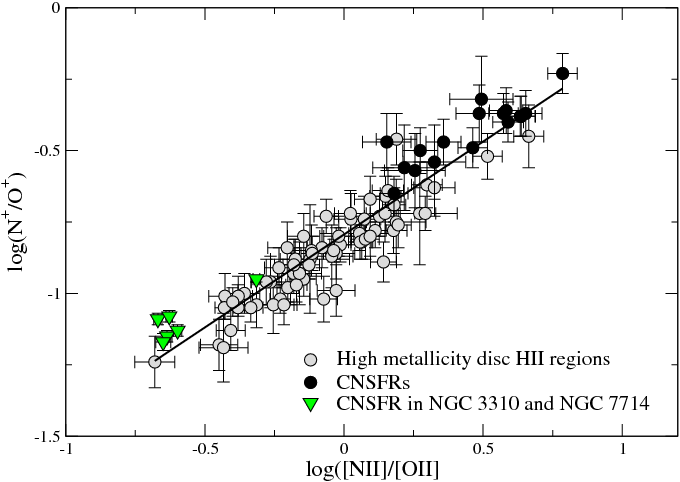
A good correlation has been found to exist between the [Nii]/[Oii] ratio and the N/O ionic abundance ratio, which in turn can be assumed to trace the N/O ratio [2005MNRAS.361.1063P]. This relation is shown in Figure 5.18 for the observed CNSFRs (black circles) and the high metallicity Hii region sample (gray circles). The CNSFRs sample has been enlarged with two circumnuclear regions of NGC 1097 observed by [1984MNRAS.210..701P] and other three observed in NGC 5953 by [1996MNRAS.281..781G], all of them of high metallicity. Also shown are data of some CNSFRs in two peculiar galaxies: NGC 3310 [1993MNRAS.260..177P] and NGC 7714 [1995ApJ...439..604G] of reported lower metallicity. In all the cases, ionic and total abundances have been derived following the same methods as in the CNSFRs in the present study and described in Section §5.5. In the case of the latter regions, abundances derived in this way are larger than derived from direct determinations of t([Oiii]) since our estimated values for this temperature are systematically lower by about 1200 K. This could be due to the fact that our semi-empirical calibration has been actually derived for high metallicity regions. However, the values of log(SO) for these regions are between -0.44 and -0.85 and therefore within the validity range of the calibration and we have preferred to use the same method for consistency reasons.
We can see that a very tight correlation exists which allows to estimate the N/O ratio from the measured [Nii] and [Oii] emission line intensities. In this relation, high metallicity regions and CNSFRs seem to follow a sequence of increasing N/O ratio. A linear regression fit to the data yields the expression:
This relation is shallower than that found in [2005MNRAS.361.1063P] for a sample that did not include high metallicity Hii regions. The N/O ratio for our observed CNSFRs is shown in Figure 5.19 against their oxygen abundance together with similar data for the high metallicity Hii region and Hii galaxy samples as described in section 5.5. It can be seen that all the CNSFRs show similar oxygen abundances, with the mean value being lower than that shown by high metallicity disc Hii regions, but the observed CNSFRs show larger N/O ratios and they do not seem to follow the trend of N/O vs. O/H which marks the secondary behaviour of nitrogen.
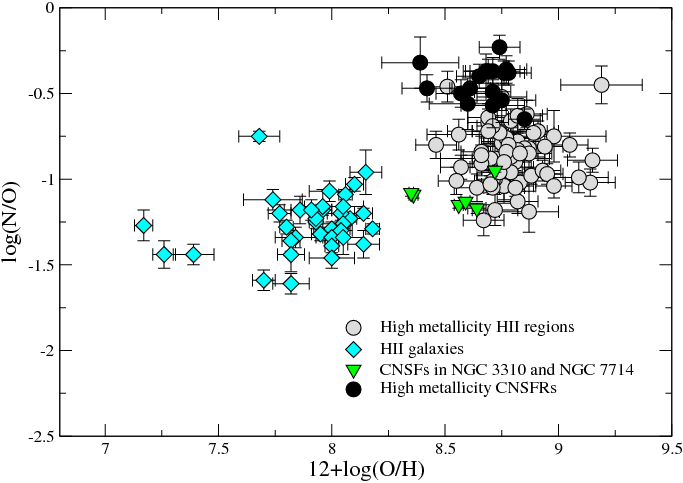
Equal values, within the errors, are found for the CNSFRs in NGC 3351 (12+log(O/H) = 8.70 0.10) except for region R6 which shows an O/H abundance lower by a factor of about 2. It is worth noting that this is the region with the highest O/O ratio (0.83) and a very low O/H value: 12+log(O/H) = 7.62 0.17. The average value for the rest of the regions is in agreement with the central abundance determined by [2006MNRAS.367.1139P] by extrapolating the galaxy oxygen abundance gradient, 12+log(O/H) = 8.74 0.02. This value is somewhat lower than that previously estimated by [2004A&A...425..849P]: 8.90 from the same data but following a different method of analysis. In that same work, the quoted central abundance for NGC 2903 is 12+log(O/H) = 8.94. Our results for regions R1+R2, R3 and R6 in this galaxy yield an average value of 8.75 0.09 lower than theirs by 0.2 dex. Region R4 shows a lower oxygen abundance but still consistent within the errors with the average. Values of N/O ratios for the centres of NGC 3351 and NGC 2903 similar to those found here (-0.33 and -0.35 respectively) are quoted by [2004A&A...425..849P].
Another difference between the high metallicity circumnuclear and disc regions is related to their average ionization parameter. The upper panel of Figure 2.5.1 shows the distribution of the [Sii]/[Siii] ratio for the two samples. The [Sii]/[Siii] ratio has been shown to be a good ionization parameter indicator for moderate to high metallicities [1991MNRAS.253..245D] with very little dependence on metallicity or ionization temperature. It can be seen that all the CNSFRs observed show large [Sii]/[Siii] ratios which imply extremely low ionization parameters. On the other hand, a different answer would be found if the [Oii]/[Oiii] parameter, also commonly adopted as an ionization parameter indicator, was used. In this case, CNSFRs and high metallicity Hii regions show a much more similar distribution, with CNSFRs showing slightly lower values of [Oii]/[Oiii] (Figure 2.5.1, lower panel).
It should be noted the dependence of the [Oii]/[Oiii] parameter on metallicity due to the presence of opacity edges of various abundant elements (O, Ne, C, N) in the stellar atmospheres that can combine to substantially modify the stellar flux of high abundance stars at energies higher than 35-40 eV and then produce a lower [Oiii] emission [1976ApJ...208..336B]. However, if the CNSFRs were ionized by stars of a higher metallicity than those in disc Hii regions this effect would go in the direction of producing higher [Oii]/[Oiii] ratios for the CNSFRs, and ionization parameters derived from [Oii]/[Oiii] ratios would be found to be lower than those derived from [Sii]/[Siii] ratios, contrary to what is actually observed.
![[Uncaptioned image]](/html/0908.4285/assets/chapter5/histo_O2-O3.png)
The ionization structure can provide important information about the characteristics of the ionizing source. The relation between the emission line ratios [Oii]/[Oiii] vs. [Sii]/[Siii], in particular, works as a diagnostic diagram for the nature and temperature of the radiation field. This diagram was used in [1985MNRAS.212..737D] in order to investigate the possible contributions by shocks in CNSFRs and LINERs and is the basis of the definition of the ’ parameter [1988MNRAS.231..257V]. The ’ parameter, defined as:
is a measure of the “softness” of the ionizing radiation and increases with decreasing ionizing temperature. The “’ plot” is shown in Figure 5.21. In this plot, diagonal lines of slope unity would show the locus of ionized regions with constant values of ’. The lines shown in the plot have slope 1.3 reflecting the second order dependence of ’ on ionization parameter [1991MNRAS.253..245D]. In this graph CNSFRs are seen to segregate from disc Hii regions. The former cluster around the value of log’ = 0.0 (T 40,000 K) while the latter cluster around log ’ = 0.7 (T 35,000 K). Also shown are the data corresponding to Hii galaxies. Indeed, CNSFRs seem to share more the locus of the Hii galaxies than that of disc Hii regions.
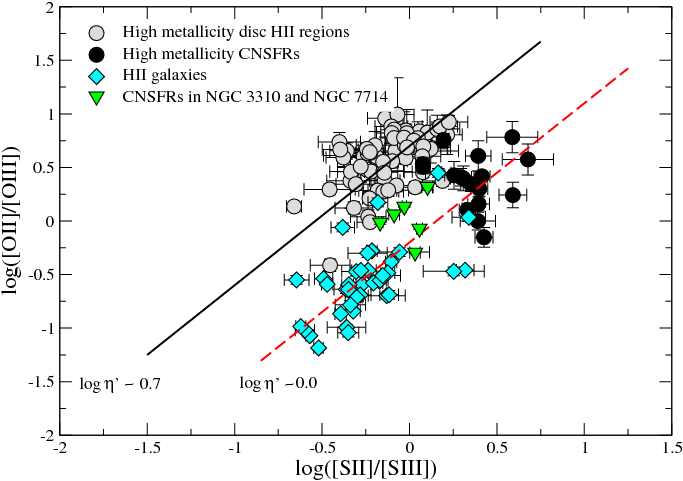
Given the problems involved in the measurement of the [Oii] emission lines mentioned in Section §5.4.2 it is interesting to see the effects that a possible underestimate of the intensity of this line would have on our analysis. The underestimate of the [Oii] line leads to an overestimate of the SO parameter and hence to an underestimate of the [Siii] electron temperature. This lower temperature in turn leads to higher O/H abundances. Therefore, larger values of the intensity of the [Oii] line would lead to lower O/H abundances. However, not by a large amount. Increasing the [Oii] intensity by a factor of 2, would decrease the SO parameter by a factor between 1.5 and 1.8 depending on the region, which would lead to increased [Siii] electron temperatures by between 500 and 1000 K. The corresponding O/H would be only slightly smaller, by about 0.10 dex, as would also be the total O/H abundance which is dominated by O/H. The O/H ionic ratio however would be lower by between 0.3 and 0.4 dex, which would produce an ionization structure more similar to what is found in disc Hii regions. The sulphur ionic and total abundances would be decreased by about 0.17 dex. Finally, the N/O ratios would be decreased by about 0.17 dex, while the S/O ratios would remain almost unchanged. In the “’ plot” (Figure 5.21) the data points corresponding to our observed CNSFRs would move upwards by 0.30 dex. However, we do not find any compelling reason why the [Oii] intensities should be larger than measured by such a big amount (see Section §5.4 and Figure 5.11).
One possible concern about these CNSFR is that, given their proximity to the galactic nuclei, they could be affected by hard radiation coming from a low luminosity AGN. NGC 3351 shows a faint UV core . However, the IUE spectrum that covers the whole central star forming ring, shows broad absorption lines of Siiv 1400 Å and Civ 1549 Å typical of young stars of high metallicity [1997ApJ...484L..41C]. They are consistent with a total mass of 3 10 M of recently formed stars (4-5 Myr). This is of the order of our derived values for single CNSFR in this galaxy. Therefore, no signs of activity are found for this nucleus nor are they reported for the other two galaxy nuclei. On the other hand, the Heii 4686 Å line is measured in regions R1+R2 and R6 of NGC 2903 and in region R7 in NGC 3351. In the first region, there is some evidence for the presence of WR stars [2002MNRAS.329..315C]. For the other two, that presence is difficult to assess due to the difficulty in placing the continuum for which a detailed modeling of the stellar population is needed.
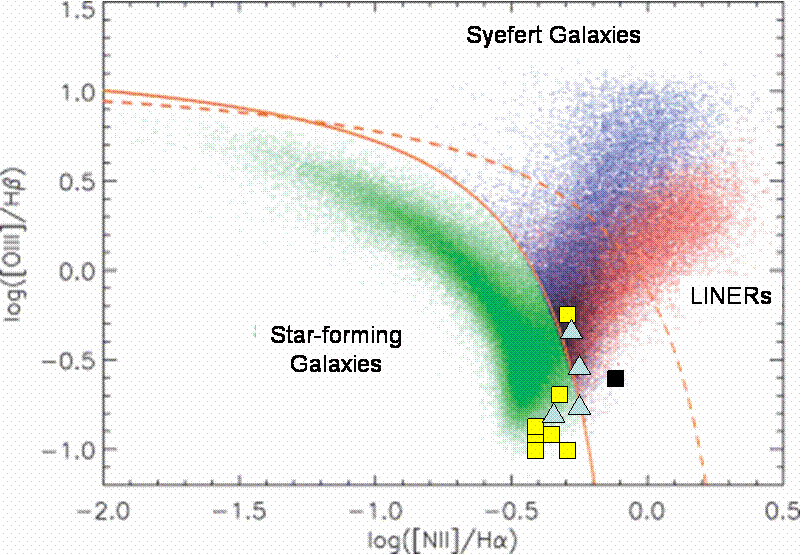
Alternatively, the spectra of these regions harbouring massive clusters of young stars might be affected by the presence of shocked gas. Diagnostic diagrams of the kind presented by [1981PASP...93....5B] can be used to investigate the possible contribution by either a hidden AGN or by the presence of shocks to the emission line spectra of the observed CNSFRs. Figure 5.22 shows one of these diagnostic diagrams, log ([Nii]/H) vs. log ([Oiii])/H, for our CNSFRs: light yellow squares for NGC 3351, light blue triangles for NGC 2903 and dark square for NGC 3504. The figure has been adapted from [2006MNRAS.371.1559G] and shows the location of emission line galaxies in the Sloan Digital Sky Survey (SDSS). Dashed and solid lines correspond to the boundary between Active Galactic Nuclei (AGN) and Hii galaxies defined by [2001ApJ...556..121K] and [2003MNRAS.346.1055K] respectively. Some of our observed CNSFRs are found close to the transition zone between Hii region and LINER spectra but only R3+R4 in NGC 3504 may show a hint of a slight contamination by shocks. This region, the most luminous in our sample and also the one with the highest abundance, should be studied in more detail.
A final remark concerns the gas kinematics in CNSFRs (see Chapter §4; [2007MNRAS.378..163H]). As already discussed, we have studied the kinematics of gas and stars in the CNSFRs of NGC 2903, NGC 3310 and NGC 3351, finding two different components for the ionized gas in H and [Oiii] emission: a “broad component” with a velocity dispersion similar to that measured for the stars, and a “narrow component” with a dispersion lower than the stellar one by about 30 km s. Obviously the abundance analysis and the location of these regions on diagnostic diagrams would be affected if more than one velocity component in the ionized gas corresponding to kinematically distinct systems are present.
5.7 Summary and conclusions on metal abundances
We have obtained spectro-photometric observations in the optical ( 3650-7000 Å) and far-red ( 8850-9650 Å) wavelength ranges of a total of 12 circumnuclear Hii regions in the early type spiral galaxies: NGC 2903, NGC 3351 and NGC 3504. These regions were expected to be amongst the highest metallicity regions as corresponds to their position near the galactic centre. At the same time, this position implies a substantial contribution by the bulge stellar population to their spectra which represents a major observational problem and compromises the reliability of the emission line intensities. Its proper subtraction however requires the detailed modeling of the stellar population and the disentangling of the contribution by the bulge and by any previous stellar generations in the CNSFRs themselves. Almost all these regions show the presence of the CaT lines in the far red (see Chapter §4) some of them with equivalent widths that suggest a certain contribution by red supergiant stars.
We have derived the characteristics of the observed CNSFRs in terms of size, H luminosities and ionizing cluster masses. The derived sizes are between 1.5 arcsec and 5.7 arcsec which correspond to linear dimensions between 74 and 234 pc. The derived filling factors, between 6 10 and 1 10, are lower than commonly found in giant Hii regions ( 0.01). H luminosities are larger than the typical ones found for disc Hii regions and overlap with those measured in Hii galaxies. The region with the largest H luminosity is R3+R4 in NGC 3504, for which a value of 2.02 10 is measured. Ionizing cluster masses range between 1.1 10 and 4.7 10 M but could be lower by factors between 1.5 and 15 if the contribution by the underlying stellar population is taken into account.
The low excitation of the regions, as evidenced by the weakness of the [Oiii] 5007 Å line, precludes the detection and measurement of the auroral [Oiii] 4363 Å necessary for the derivation of the electron temperature. For one of the regions, the [Siii] 6312 Å line was detected providing, together with the nebular [Siii] lines at 9069, 9532 Å, a value of the electron temperature of T([Siii]) = 8400K. A new method for the derivation of sulphur abundances was developed based on the calibration of the [Siii] electron temperature vs. the empirical parameter SO defined as the quotient of the oxygen and sulphur abundance parameters O and S and the further assumption that T([Siii]) T([Sii]). Using this method, the oxygen abundances and the N/O and S/O ratios can also be derived.
The derived oxygen abundances are comparable to those found in high metallicity disc Hii regions from direct measurements of electron temperatures and consistent with solar values within the errors. The region with the highest oxygen abundance is R3+R4 in NGC 3504, 12+log(O/H) = 8.85, about 1.6 solar if the solar oxygen abundance is set at the value derived by Asplund et al. (2005), 12+log(O/H) = 8.660.05. Region R7 in NGC 3351 has the lowest oxygen abundance of the sample, about 0.6 times solar. In all the observed CNSFRs the O/H abundance is dominated by the O/H contribution, as is also the case for high metallicity disc Hii regions. For our observed regions, however also the S/S ratio is larger than one, different from the case of high metallicity disc Hii regions for which, in general, the sulphur abundances are dominated by S/H. The derived N/O ratios are in average larger than those found in high metallicity disc Hii regions and they do not seem to follow the trend of N/O vs. O/H which marks the secondary behaviour of nitrogen. On the other hand, the S/O ratios span a very narrow range between 0.6 and 0.8 of the solar value.
When compared to high metallicity disc Hii regions, CNSFRs show values of the O and the N2 parameters whose distributions are shifted to lower and higher values respectively, hence, even though their derived oxygen and sulphur abundances are similar, higher values would in principle be obtained for the CNSFRs if pure empirical methods were used to estimate abundances. CNSFRs also show lower ionization parameters than their disc counterparts, as derived from the [Sii]/[Siii] ratio. Their ionization structure also seems to be different with CNSFRs showing radiation field properties more similar to Hii galaxies than to disc high metallicity Hii regions. The possible contamination of their spectra from hidden low luminosity AGN and/or shocks, as well as the probable presence of more than one velocity component in the ionized gas corresponding to kinematically distinct systems, should be further investigated.
Bibliography
- Abazajian et al., 2004 Abazajian, K., Adelman-McCarthy, J. K., Agüeros, M. A., Allam, S. S., Anderson, K., Anderson, S. F., Annis, J., Bahcall, N. A., Baldry, I. K., Bastian, S., and 143 coauthors: 2004, Astron. J. 128, 502
- Abazajian et al., 2005 Abazajian, K., Adelman-McCarthy, J. K., Agüeros, M. A., Allam, S. S., Anderson, K. S. J., Anderson, S. F., Annis, J., Bahcall, N. A., Baldry, I. K., Bastian, S., and 144 coauthors: 2005, Astron. J. 129, 1755
- Adelman-McCarthy et al., 2008 Adelman-McCarthy, J. K., Agüeros, M. A., Allam, S. S., Allende Prieto, C., Anderson, K. S. J., Anderson, S. F., Annis, J., Bahcall, N. A., Bailer-Jones, C. A. L., Baldry, I. K., and 153 coauthors: 2008, Astrophys. J., Suppl. Ser. 175, 297
- Adelman-McCarthy et al., 2006 Adelman-McCarthy, J. K., Agüeros, M. A., Allam, S. S., Anderson, K. S. J., Anderson, S. F., Annis, J., Bahcall, N. A., Baldry, I. K., Barentine, J. C., Berlind, A., and 131 coauthors: 2006, Astrophys. J., Suppl. Ser. 162, 38
- Allende-Prieto et al., 2001 Allende-Prieto, C., Lambert, D. L., and Asplund, M.: 2001, Astrophys. J. Letters 556, L63
- Alloin et al., 1979 Alloin, D., Collin-Souffrin, S., Joly, M., and Vigroux, L.: 1979, Astron. Astrophys. 78, 200
- Alloin and Nieto, 1982 Alloin, D. and Nieto, J.-L.: 1982, Astron. and Astrophys. Suppl. Sries 50, 491
- Aloisi et al., 1999 Aloisi, A., Tosi, M., and Greggio, L.: 1999, Astron. J. 118, 302
- Alonso-Herrero et al., 2001a Alonso-Herrero, A., Engelbracht, C. W., Rieke, M. J., Rieke, G. H., and Quillen, A. C.: 2001a, Astrophys. J. 546, 952
- Alonso-Herrero et al., 2000 Alonso-Herrero, A., Rieke, G. H., Rieke, M. J., and Scoville, N. Z.: 2000, Astrophys. J. 532, 845
- Alonso-Herrero et al., 2001b Alonso-Herrero, A., Ryder, S. D., and Knapen, J. H.: 2001b, Mon. Not. R. Astron. Soc. 322, 757
- Álvarez-Álvarez, 2002 Álvarez-Álvarez, M.: 2002, PhD Thesis, Universidad Autónoma de Madrid
- Arp and Sandage, 1985 Arp, H. and Sandage, A.: 1985, Astron. J. 90, 1163
- Asari et al., 2007 Asari, N. V., Cid Fernandes, R., Stasińska, G., Torres-Papaqui, J. P., Mateus, A., Sodré, L., Schoenell, W., and Gomes, J. M.: 2007, Mon. Not. R. Astron. Soc. 381, 263
- Asplund et al., 2005 Asplund, M., Grevesse, N., and Sauval, A. J.: 2005, in T. G. Barnes, III and F. N. Bash (eds.), Cosmic Abundances as Records of Stellar Evolution and Nucleosynthesis, Vol. 336 of Astronomical Society of the Pacific Conference Series, pp 25–+
- Athanassoula, 1992a Athanassoula, E.: 1992a, Mon. Not. R. Astron. Soc. 259, 328
- Athanassoula, 1992b Athanassoula, E.: 1992b, Mon. Not. R. Astron. Soc. 259, 345
- Badnell, 2006 Badnell, N. R.: 2006, Astron. Astrophys. 447, 389
- Bagnuolo, 1976 Bagnuolo, Jr., W. G.: 1976, Ph.D. thesis, AA(California Inst. of Tech., Pasadena.)
- Baldwin et al., 1981 Baldwin, J. A., Phillips, M. M., and Terlevich, R.: 1981, Publ. Astron. Soc. Pac. 93, 5
- Baldwin et al., 1982 Baldwin, J. A., Spinrad, H., and Terlevich, R.: 1982, Mon. Not. R. Astron. Soc. 198, 535
- Balick and Heckman, 1981 Balick, B. and Heckman, T.: 1981, Astron. Astrophys. 96, 271
- Balick and Sneden, 1976 Balick, B. and Sneden, C.: 1976, Astrophys. J. 208, 336
- Balzano, 1983 Balzano, V. A.: 1983, Astrophys. J. 268, 602
- Barker, 1980 Barker, T.: 1980, Astrophys. J. 240, 99
- Barmby et al., 2000 Barmby, P., Huchra, J. P., Brodie, J. P., Forbes, D. A., Schroder, L. L., and Grillmair, C. J.: 2000, Astron. J. 119, 727
- Barth et al., 1995 Barth, A. J., Ho, L. C., Filippenko, A. V., and Sargent, W. L.: 1995, Astron. J. 110, 1009
- Bastian et al., 2005 Bastian, N., Gieles, M., Lamers, H. J. G. L. M., Scheepmaker, R. A., and de Grijs, R.: 2005, Astron. Astrophys. 431, 905
- Bastian et al., 2006 Bastian, N., Saglia, R. P., Goudfrooij, P., Kissler-Patig, M., Maraston, C., Schweizer, F., and Zoccali, M.: 2006, Astron. Astrophys. 448, 881
- Benedict et al., 2002 Benedict, G. F., Howell, D. A., Jørgensen, I., Kenney, J. D. P., and Smith, B. J.: 2002, Astron. J. 123, 1411
- Benjamin et al., 1999 Benjamin, R. A., Skillman, E. D., and Smits, D. P.: 1999, Astrophys. J. 514, 307
- Binney and Tremaine, 1987 Binney, J. and Tremaine, S.: 1987, Galactic dynamics, Princeton, NJ, Princeton University Press, 1987, 747 p.
- Boer and Schulz, 1993 Boer, B. and Schulz, H.: 1993, Astron. Astrophys. 277, 397
- Bosch and Meza, 2001 Bosch, G. and Meza, A.: 2001, in Revista Mexicana de Astronomia y Astrofisica Conference Series, Vol. 11 of Revista Mexicana de Astronomia y Astrofisica, vol. 27, pp 29–+
- Bosch et al., 2001 Bosch, G., Selman, F., Melnick, J., and Terlevich, R.: 2001, Astron. Astrophys. 380, 137
- Bosch et al., 2008 Bosch, G., Terlevich, E., and Terlevich, R.: 2008, Mon. Not. R. Astron. Soc.(submitted)
- Bottinelli et al., 1984 Bottinelli, L., Gouguenheim, L., Paturel, G., and de Vaucouleurs, G.: 1984, Astron. and Astrophys. Suppl. Sries 56, 381
- Bournaud et al., 2004 Bournaud, F., Duc, P.-A., Amram, P., Combes, F., and Gach, J.-L.: 2004, Astron. Astrophys. 425, 813
- Bresolin, 2007 Bresolin, F.: 2007, Astrophys. J. 656, 186
- Bresolin et al., 2004 Bresolin, F., Garnett, D. R., and Kennicutt, Jr., R. C.: 2004, Astrophys. J. 615, 228
- Bresolin and Kennicutt, 1997 Bresolin, F. and Kennicutt, Jr., R. C.: 1997, Astron. J. 113, 975
- Bresolin et al., 1999 Bresolin, F., Kennicutt, Jr., R. C., and Garnett, D. R.: 1999, Astrophys. J. 510, 104
- Bresolin et al., 2005 Bresolin, F., Schaerer, D., González-Delgado, R. M., and Stasińska, G.: 2005, Astron. Astrophys. 441, 981
- Brocklehurst, 1971 Brocklehurst, M.: 1971, Mon. Not. R. Astron. Soc. 153, 471
- Bushouse, 1987 Bushouse, H. A.: 1987, Astrophys. J. 320, 49
- Bushouse et al., 1998 Bushouse, H. A., Telesco, C. M., and Werner, M. W.: 1998, Astron. J. 115, 938
- Bushouse et al., 1988 Bushouse, H. A., Werner, M. W., and Lamb, S. A.: 1988, Astrophys. J. 335, 74
- Butler and Zeippen, 1994 Butler, K. and Zeippen, C. J.: 1994, Astron. and Astrophys. Suppl. Sries 108, 1
- Carlson et al., 1998 Carlson, M. N., Holtzman, J. A., Watson, A. M., Grillmair, C. J., Mould, J. R., Ballester, G. E., Burrows, C. J., Clarke, J. T., Crisp, D., Evans, R. W., Gallagher, III, J. S., Griffiths, R. E., Hester, J. J., Hoessel, J. G., Scowen, P. A., Stapelfeldt, K. R., Trauger, J. T., and Westphal, J. A.: 1998, Astron. J. 115, 1778
- Castellanos et al., 2002 Castellanos, M., Díaz, A. I., and Terlevich, E.: 2002, Mon. Not. R. Astron. Soc. 329, 315
- Cepa and Beckman, 1990 Cepa, J. and Beckman, J. E.: 1990, Astrophys. J. 349, 497
- Cerviño et al., 2002 Cerviño, M., Valls-Gabaud, D., Luridiana, V., and Mas-Hesse, J. M.: 2002, Astron. Astrophys. 381, 51
- Cid Fernandes et al., 2007 Cid Fernandes, R., Asari, N. V., Sodré, L., Stasińska, G., Mateus, A., Torres-Papaqui, J. P., and Schoenell, W.: 2007, Mon. Not. R. Astron. Soc. 375, L16
- Cid Fernandes et al., 2001 Cid Fernandes, R., Heckman, T., Schmitt, H., Delgado, R. M. G., and Storchi-Bergmann, T.: 2001, Astrophys. J. 558, 81
- Cid Fernandes et al., 2005 Cid Fernandes, R., Mateus, A., Sodré, L., Stasińska, G., and Gomes, J. M.: 2005, Mon. Not. R. Astron. Soc. 358, 363
- Colina et al., 1997 Colina, L., García Vargas, M. L., Mas-Hesse, J. M., Alberdi, A., and Krabbe, A.: 1997, Astrophys. J. Letters 484, L41+
- Colina et al., 2002 Colina, L., González-Delgado, R., Mas-Hesse, J. M., and Leitherer, C.: 2002, Astrophys. J. 579, 545
- Combes and Gerin, 1985 Combes, F. and Gerin, M.: 1985, Astron. Astrophys. 150, 327
- Crockett et al., 2006 Crockett, N. R., Garnett, D. R., Massey, P., and Jacoby, G.: 2006, Astrophys. J. 637, 741
- de Robertis et al., 1987 de Robertis, M. M., Dufour, R. J., and Hunt, R. W.: 1987, Royal Astronomical Society of Canada, Journal 81, 195
- de Vaucouleurs, 1963 de Vaucouleurs, G.: 1963, Astrophys. J., Suppl. Ser. 8, 31
- de Vaucouleurs et al., 1991 de Vaucouleurs, G., de Vaucouleurs, A., Corwin, Jr., H. G., Buta, R. J., Paturel, G., and Fouque, P.: 1991, Third Reference Catalogue of Bright Galaxies, Volume 1-3, XII, 2069 pp. 7 figs.. Springer-Verlag Berlin Heidelberg New York
- Denicoló et al., 2002 Denicoló, G., Terlevich, R., and Terlevich, E.: 2002, Mon. Not. R. Astron. Soc. 330, 69
- Denicoló et al., 2002 Denicoló, G., Terlevich, R., and Terlevich, E.: 2002, Mon. Not. R. Astron. Soc. 330, 69
- Devereux, 1989 Devereux, N. A.: 1989, Astrophys. J. 346, 126
- Devereux et al., 1992 Devereux, N. A., Kenney, J. D., and Young, J. S.: 1992, Astron. J. 103, 784
- Díaz, 1989 Díaz, A. I.: 1989, in J. E. Beckman and B. E. J. Pagel (eds.), Evolutionary Phenomena in Galaxies, pp 377–397
- Díaz, 1988 Díaz, A. I.: 1988, Mon. Not. R. Astron. Soc. 231, 57
- Díaz, 1998 Díaz, A. I.: 1998, Astron. Astrophys. Suppl. Ser. 263, 143
- Díaz et al., 2000a Díaz, A. I., Álvarez-Álvarez, M., Terlevich, E., Terlevich, R., Portal, M. S., and Aretxaga, I.: 2000a, Mon. Not. R. Astron. Soc. 311, 120
- Díaz et al., 2000b Díaz, A. I., Castellanos, M., Terlevich, E., and Luisa García-Vargas, M.: 2000b, Mon. Not. R. Astron. Soc. 318, 462
- Díaz and Pérez-Montero, 2000 Díaz, A. I. and Pérez-Montero, E.: 2000, Mon. Not. R. Astron. Soc. 312, 130
- Díaz et al., 1985 Díaz, A. I., Pagel, B. E. J., and Wilson, I. R. G.: 1985, Mon. Not. R. Astron. Soc. 212, 737
- Díaz and Pérez-Montero, 1999 Díaz, A. I. and Pérez-Montero, E.: 1999, in J. R. Walsh and M. R. Rosa (eds.), Chemical Evolution from Zero to High Redshift, pp 134–+
- Díaz et al., 2006 Díaz, A. I., Terlevich, E., Castellanos, M., and Hägele, G. F.: 2006, astro-ph/0610787
- Díaz et al., 2007 Díaz, Á. I., Terlevich, E., Castellanos, M., and Hägele, G. F.: 2007, Mon. Not. R. Astron. Soc. 382, 251
- Díaz et al., 1987 Díaz, A. I., Terlevich, E., Pagel, B. E. J., Víilchez, J. M., and Edmunds, M. G.: 1987, Mon. Not. R. Astron. Soc. 226, 19
- Díaz et al., 1989 Díaz, A. I., Terlevich, E., and Terlevich, R.: 1989, Mon. Not. R. Astron. Soc. 239, 325
- Díaz et al., 1991 Díaz, A. I., Terlevich, E., Vílchez, J. M., Pagel, B. E. J., and Edmunds, M. G.: 1991, Mon. Not. R. Astron. Soc. 253, 245
- Díaz et al., 1999 Díaz, R., Carranza, G., Dottori, H., and Goldes, G.: 1999, Astrophys. J. 512, 623
- Dopita et al., 2002 Dopita, M. A., Pereira, M., Kewley, L. J., and Capaccioli, M.: 2002, Astrophys. J., Suppl. Ser. 143, 47
- Dors et al., 2008 Dors, Jr., O. L., Storchi-Bergmann, T., Riffel, R. A., and Schimdt, A. A.: 2008, astro-ph-0802.2070
- Drake and Testa, 2005 Drake, J. J. and Testa, P.: 2005, Nature 436, 525
- Ellison et al., 2001 Ellison, S. L., Yan, L., Hook, I. M., Pettini, M., Wall, J. V., and Shaver, P.: 2001, Astron. Astrophys. 379, 393
- Elmegreen and Elmegreen, 1986 Elmegreen, B. G. and Elmegreen, D. M.: 1986, Astrophys. J. 311, 554
- Elmegreen et al., 2002 Elmegreen, D. M., Chromey, F. R., McGrath, E. J., and Ostenson, J. M.: 2002, Astron. J. 123, 1381
- Elmegreen et al., 1997 Elmegreen, D. M., Chromey, F. R., Santos, M., and Marshall, D.: 1997, Astron. J. 114, 1850
- Elmegreen et al., 2006 Elmegreen, D. M., Elmegreen, B. G., Kaufman, M., Sheth, K., Struck, C., Thomasson, M., and Brinks, E.: 2006, Astrophys. J. 642, 158
- Elmegreen et al., 2001 Elmegreen, D. M., Kaufman, M., Elmegreen, B. G., Brinks, E., Struck, C., Klarić, M., and Thomasson, M.: 2001, Astron. J. 121, 182
- Elmegreen and Salzer, 1999 Elmegreen, D. M. and Salzer, J. J.: 1999, Astron. J. 117, 764
- Ercolano et al., 2007 Ercolano, B., Bastian, N., and Stasińska, G.: 2007, Mon. Not. R. Astron. Soc. 379, 945
- Esteban et al., 2004 Esteban, C., Peimbert, M., García-Rojas, J., Ruiz, M. T., Peimbert, A., and Rodríguez, M.: 2004, Mon. Not. R. Astron. Soc. 355, 229
- Falco et al., 1999 Falco, E. E., Kurtz, M. J., Geller, M. J., Huchra, J. P., Peters, J., Berlind, P., Mink, D. J., Tokarz, S. P., and Elwell, B.: 1999, Publ. Astron. Soc. Pac. 111, 438
- Ferland et al., 1998 Ferland, G. J., Korista, K. T., Verner, D. A., Ferguson, J. W., Kingdon, J. B., and Verner, E. M.: 1998, Publ. Astron. Soc. Pac. 110, 761
- French, 1980 French, H. B.: 1980, Astrophys. J. 240, 41
- Friedli and Benz, 1995 Friedli, D. and Benz, W.: 1995, Astron. Astrophys. 301, 649
- Galavis et al., 1995 Galavis, M. E., Mendoza, C., and Zeippen, C. J.: 1995, Astron. and Astrophys. Suppl. Sries 111, 347
- Gallagher et al., 2001 Gallagher, S. C., Charlton, J. C., Hunsberger, S. D., Zaritsky, D., and Whitmore, B. C.: 2001, Astron. J. 122, 163
- García-Rojas, 2006 García-Rojas, J.: 2006, PhD Thesis, Universidad de La Laguna
- García Vargas and Díaz, 1994 García Vargas, M. L. and Díaz, A. I.: 1994, Astrophys. J., Suppl. Ser. 91, 553
- García-Rojas and Esteban, 2007 García-Rojas, J. and Esteban, C.: 2007, Astrophys. J. 670, 457
- García-Rojas et al., 2005 García-Rojas, J., Esteban, C., Peimbert, A., Peimbert, M., Rodríguez, M., and Ruiz, M. T.: 2005, Mon. Not. R. Astron. Soc. 362, 301
- García-Rojas et al., 2006 García-Rojas, J., Esteban, C., Peimbert, M., Costado, M. T., Rodríguez, M., Peimbert, A., and Ruiz, M. T.: 2006, Mon. Not. R. Astron. Soc. 368, 253
- García-Rojas et al., 2004 García-Rojas, J., Esteban, C., Peimbert, M., Rodríguez, M., Ruiz, M. T., and Peimbert, A.: 2004, Astrophys. J., Suppl. Ser. 153, 501
- García-Vargas et al., 1995 García-Vargas, M. L., Bressan, A., and Díaz, A. I.: 1995, Astron. and Astrophys. Suppl. Sries 112, 35
- Garnett, 1992 Garnett, D. R.: 1992, Astron. J. 103, 1330
- Garnett, 2002 Garnett, D. R.: 2002, Astrophys. J. 581, 1019
- Garnett et al., 2004 Garnett, D. R., Kennicutt, Jr., R. C., and Bresolin, F.: 2004, Astrophys. J. Letters 607, L21
- Garnett et al., 1997 Garnett, D. R., Shields, G. A., Skillman, E. D., Sagan, S. P., and Dufour, R. J.: 1997, Astrophys. J. 489, 63
- Gil de Paz et al., 2003 Gil de Paz, A., Madore, B. F., and Pevunova, O.: 2003, Astrophys. J., Suppl. Ser. 147, 29
- González-Delgado et al., 2005 González-Delgado, R. M., Cerviño, M., Martins, L. P., Leitherer, C., and Hauschildt, P. H.: 2005, Mon. Not. R. Astron. Soc. 357, 945
- González-Delgado et al., 1998 González-Delgado, R. M., Heckman, T., Leitherer, C., Meurer, G., Krolik, J., Wilson, A. S., Kinney, A., and Koratkar, A.: 1998, Astrophys. J. 505, 174
- González-Delgado and Pérez, 1996 González-Delgado, R. M. and Pérez, E.: 1996, Mon. Not. R. Astron. Soc. 281, 781
- González-Delgado et al., 1995 González-Delgado, R. M., Pérez, E., Díaz, A. I., García-Vargas, M. L., Terlevich, E., and Vílchez, J. M.: 1995, Astrophys. J. 439, 604
- González-Delgado et al., 1994 González-Delgado, R. M., Pérez, E., Tenorio-Tagle, G., Vílchez, J. M., Terlevich, E., Terlevich, R., Telles, E., Rodríguez-Espinosa, J. M., Mas-Hesse, M., García-Vargas, M. L., Díaz, A. I., Cepa, J., and Castañeda, H.: 1994, Astrophys. J. 437, 239
- Graham and et al., 1997 Graham, J. A. and et al.: 1997, Astrophys. J. 477, 535
- Grevesse and Sauval, 1998 Grevesse, N. and Sauval, A. J.: 1998, Space Science Reviews 85, 161
- Groves et al., 2006 Groves, B. A., Heckman, T. M., and Kauffmann, G.: 2006, Mon. Not. R. Astron. Soc. 371, 1559
- Gu et al., 2006 Gu, Q., Melnick, J., Fernandes, R. C., Kunth, D., Terlevich, E., and Terlevich, R.: 2006, Mon. Not. R. Astron. Soc. 366, 480
- Guseva et al., 2007 Guseva, N. G., Izotov, Y. I., Papaderos, P., and Fricke, K. J.: 2007, Astron. Astrophys. 464, 885
- Guseva et al., 2000 Guseva, N. G., Izotov, Y. I., and Thuan, T. X.: 2000, Astrophys. J. 531, 776 (GIT00)
- Guseva et al., 2006 Guseva, N. G., Izotov, Y. I., and Thuan, T. X.: 2006, Astrophys. J. 644, 890
- Guseva et al., 2003a Guseva, N. G., Papaderos, P., Izotov, Y. I., Green, R. F., Fricke, K. J., Thuan, T. X., and Noeske, K. G.: 2003a, Astron. Astrophys. 407, 75
- Guseva et al., 2003b Guseva, N. G., Papaderos, P., Izotov, Y. I., Green, R. F., Fricke, K. J., Thuan, T. X., and Noeske, K. G.: 2003b, Astron. Astrophys. 407, 91
- Guseva et al., 2003c Guseva, N. G., Papaderos, P., Izotov, Y. I., Green, R. F., Fricke, K. J., Thuan, T. X., and Noeske, K. G.: 2003c, Astron. Astrophys. 407, 105
- Guzmán et al., 1998 Guzmán, R., Jangren, A., Koo, D. C., Bershady, M. A., and Simard, L.: 1998, Astrophys. J. Letters 495, L13+
- Guzmán et al., 1996 Guzmán, R., Koo, D. C., Faber, S. M., Illingworth, G. D., Takamiya, M., Kron, R. G., and Bershady, M. A.: 1996, Astrophys. J. Letters 460, L5+
- Hägele et al., 2007 Hägele, G. F., Díaz, A. I., Cardaci, M. V., Terlevich, E., and Terlevich, R.: 2007, Mon. Not. R. Astron. Soc. 378, 163
- Hägele et al., 2008 Hägele, G. F., Díaz, Á. I., Terlevich, E., Terlevich, R., Pérez-Montero, E., and Cardaci, M. V.: 2008, Mon. Not. R. Astron. Soc. 383, 209
- Hägele et al., 2006 Hägele, G. F., Pérez-Montero, E., Díaz, A. I., Terlevich, E., and Terlevich, R.: 2006, Mon. Not. R. Astron. Soc. 372, 293
- Harper and Low, 1973 Harper, Jr., D. A. and Low, F. J.: 1973, Astrophys. J. Letters 182, L89+
- Haynes et al., 1998 Haynes, M. P., van Zee, L., Hogg, D. E., Roberts, M. S., and Maddalena, R. J.: 1998, Astron. J. 115, 62
- Henry, 1989 Henry, R. B. C.: 1989, Mon. Not. R. Astron. Soc. 241, 453
- Ho and Filippenko, 1996a Ho, L. C. and Filippenko, A. V.: 1996a, Astrophys. J. Letters 466, L83+
- Ho and Filippenko, 1996b Ho, L. C. and Filippenko, A. V.: 1996b, Astrophys. J. 472, 600
- Ho et al., 1997 Ho, L. C., Filippenko, A. V., and Sargent, W. L. W.: 1997, Astrophys. J., Suppl. Ser. 112, 315
- Holtzman et al., 1992 Holtzman, J. A., Faber, S. M., Shaya, E. J., Lauer, T. R., Groth, J., Hunter, D. A., Baum, W. A., Ewald, S. P., Hester, J. J., Light, R. M., Lynds, C. R., O’Neil, Jr., E. J., and Westphal, J. A.: 1992, Astron. J. 103, 691
- Holweger, 2001 Holweger, H.: 2001, in R. F. Wimmer-Schweingruber (ed.), Joint SOHO/ACE workshop ”Solar and Galactic Composition”, Vol. 598 of American Institute of Physics Conference Series, pp 23–+
- Hoyos and Díaz, 2006 Hoyos, C. and Díaz, A. I.: 2006, Mon. Not. R. Astron. Soc. 365, 454
- Hubble, 1926 Hubble, E. P.: 1926, Astrophys. J. 64, 321
- Huchra, 1977 Huchra, J. P.: 1977, Astrophys. J. 217, 928
- Israelian and Rebolo, 2001 Israelian, G. and Rebolo, R.: 2001, Astrophys. J. Letters 557, L43
- Izotov et al., 1999 Izotov, Y. I., Chaffee, F. H., Foltz, C. B., Green, R. F., Guseva, N. G., and Thuan, T. X.: 1999, Astrophys. J. 527, 757
- Izotov et al., 2001a Izotov, Y. I., Chaffee, F. H., and Green, R. F.: 2001a, Astrophys. J. 562, 727
- Izotov et al., 2001b Izotov, Y. I., Chaffee, F. H., and Schaerer, D.: 2001b, Astron. Astrophys. 378, L45 (ICS01)
- Izotov et al., 1997a Izotov, Y. I., Lipovetsky, V. A., Chaffee, F. H., Foltz, C. B., Guseva, N. G., and Kniazev, A. Y.: 1997a, Astrophys. J. 476, 698
- Izotov et al., 2004a Izotov, Y. I., Papaderos, P., Guseva, N. G., Fricke, K. J., and Thuan, T. X.: 2004a, Astron. Astrophys. 421, 539
- Izotov et al., 2004b Izotov, Y. I., Stasińska, G., Guseva, N. G., and Thuan, T. X.: 2004b, Astron. Astrophys. 415, 87 (IT04)
- Izotov et al., 2006 Izotov, Y. I., Stasińska, G., Meynet, G., Guseva, N. G., and Thuan, T. X.: 2006, Astron. Astrophys. 448, 955
- Izotov and Thuan, 1998a Izotov, Y. I. and Thuan, T. X.: 1998a, Astrophys. J. 497, 227
- Izotov and Thuan, 1998b Izotov, Y. I. and Thuan, T. X.: 1998b, Astrophys. J. 500, 188 (IT98)
- Izotov and Thuan, 2004 Izotov, Y. I. and Thuan, T. X.: 2004, Astrophys. J. 602, 200
- Izotov et al., 1994 Izotov, Y. I., Thuan, T. X., and Lipovetsky, V. A.: 1994, Astrophys. J. 435, 647 (ITL94)
- Izotov et al., 1997b Izotov, Y. I., Thuan, T. X., and Lipovetsky, V. A.: 1997b, Astrophys. J., Suppl. Ser. 108, 1 (ITL97)
- Jamet et al., 2005 Jamet, L., Stasińska, G., Pérez, E., González-Delgado, R. M., and Vílchez, J. M.: 2005, Astron. Astrophys. 444, 723
- Jarrett et al., 2003 Jarrett, T. H., Chester, T., Cutri, R., Schneider, S. E., and Huchra, J. P.: 2003, Astron. J. 125, 525
- Jiménez-Benito et al., 2000 Jiménez-Benito, L., Díaz, A. I., Terlevich, R., and Terlevich, E.: 2000, Mon. Not. R. Astron. Soc. 317, 907
- Jogee et al., 2005 Jogee, S., Scoville, N., and Kenney, J. D. P.: 2005, Astrophys. J. 630, 837
- Kauffmann et al., 2003 Kauffmann, G., Heckman, T. M., Tremonti, C., Brinchmann, J., Charlot, S., White, S. D. M., Ridgway, S. E., Brinkmann, J., Fukugita, M., Hall, P. B., Ivezić, Ž., Richards, G. T., and Schneider, D. P.: 2003, Mon. Not. R. Astron. Soc. 346, 1055
- Kenney et al., 1992 Kenney, J. D. P., Wilson, C. D., Scoville, N. Z., Devereux, N. A., and Young, J. S.: 1992, Astrophys. J. Letters 395, L79
- Kennicutt et al., 2003 Kennicutt, R. C., Bresolin, F., and Garnett, D. R.: 2003, Astrophys. J. 591, 801(KBG03)
- Kennicutt, 1989 Kennicutt, Jr., R. C.: 1989, Astrophys. J. 344, 685
- Kennicutt, 1992 Kennicutt, Jr., R. C.: 1992, Astrophys. J., Suppl. Ser. 79, 255
- Kennicutt, 1998a Kennicutt, Jr., R. C.: 1998a, Ann. Rev. Astron. Astrophys. 36, 189
- Kennicutt, 1998b Kennicutt, Jr., R. C.: 1998b, Astrophys. J. 498, 541
- Kennicutt and Garnett, 1996 Kennicutt, Jr., R. C. and Garnett, D. R.: 1996, Astrophys. J. 456, 504
- Kennicutt et al., 1989 Kennicutt, Jr., R. C., Keel, W. C., and Blaha, C. A.: 1989, Astron. J. 97, 1022
- Kennicutt et al., 1987 Kennicutt, Jr., R. C., Roettiger, K. A., Keel, W. C., van der Hulst, J. M., and Hummel, E.: 1987, Astron. J. 93, 1011
- Kewley et al., 2001 Kewley, L. J., Dopita, M. A., Sutherland, R. S., Heisler, C. A., and Trevena, J.: 2001, Astrophys. J. 556, 121
- Kewley and Ellison, 2008 Kewley, L. J. and Ellison, S. L.: 2008, ArXiv e-prints 801
- Kingdon and Ferland, 1995 Kingdon, J. and Ferland, G. J.: 1995, Astrophys. J. 442, 714
- Knapen et al., 1992 Knapen, J. H., Beckman, J. E., Cepa, J., van der Hulst, T., and Rand, R. J.: 1992, Astrophys. J. Letters 385, L37
- Kniazev et al., 2003 Kniazev, A. Y., Grebel, E. K., Hao, L., Strauss, M. A., Brinkmann, J., and Fukugita, M.: 2003, Astrophys. J. Letters 593, L73
- Kniazev et al., 2004 Kniazev, A. Y., Pustilnik, S. A., Grebel, E. K., Lee, H., and Pramskij, A. G.: 2004, Astrophys. J., Suppl. Ser. 153, 429
- Kobulnicky et al., 1999 Kobulnicky, H. A., Kennicutt, Jr., R. C., and Pizagno, J. L.: 1999, Astrophys. J. 514, 544
- Koo et al., 1994 Koo, D. C., Bershady, M. A., Wirth, G. D., Stanford, S. A., and Majewski, S. R.: 1994, Astrophys. J. Letters 427, L9
- Koo et al., 1995 Koo, D. C., Guzmán, R., Faber, S. M., Illingworth, G. D., Bershady, M. A., Kron, R. G., and Takamiya, M.: 1995, Astrophys. J. Letters 440, L49
- Kouwenhoven and de Grijs, 2007 Kouwenhoven, M. B. N. and de Grijs, R.: 2007, astro-ph/0710.1207
- Kregel and Sancisi, 2001 Kregel, M. and Sancisi, R.: 2001, Astron. Astrophys. 376, 59
- Kroupa, 2002 Kroupa, P.: 2002, Science 295, 82
- Kunth and Östlin, 2000 Kunth, D. and Östlin, G.: 2000, Astron. Astrophys. Rev 10, 1
- Kunth and Sargent, 1983 Kunth, D. and Sargent, W. L. W.: 1983, Astrophys. J. 273, 81
- Kurtz and Mink, 1998 Kurtz, M. J. and Mink, D. J.: 1998, Publ. Astron. Soc. Pac. 110, 934
- Lamareille et al., 2004 Lamareille, F., Mouhcine, M., Contini, T., Lewis, I., and Maddox, S.: 2004, Mon. Not. R. Astron. Soc. 350, 396
- Larsen et al., 2001 Larsen, S. S., Brodie, J. P., Elmegreen, B. G., Efremov, Y. N., Hodge, P. W., and Richtler, T.: 2001, Astrophys. J. 556, 801
- Larsen et al., 2004 Larsen, S. S., Brodie, J. P., and Hunter, D. A.: 2004, Astron. J. 128, 2295
- Larson and Tinsley, 1978 Larson, R. B. and Tinsley, B. M.: 1978, Astrophys. J. 219, 46
- Lee et al., 2004 Lee, J. C., Salzer, J. J., and Melbourne, J.: 2004, Astrophys. J. 616, 752 (L04)
- Leitherer and Heckman, 1995 Leitherer, C. and Heckman, T. M.: 1995, Astrophys. J., Suppl. Ser. 96, 9
- Leitherer et al., 1992 Leitherer, C., Robert, C., and Drissen, L.: 1992, Astrophys. J. 401, 596
- Leitherer et al., 1999 Leitherer, C., Schaerer, D., Goldader, J. D., Delgado, R. M. G., Robert, C., Kune, D. F., de Mello, D. F., Devost, D., and Heckman, T. M.: 1999, Astrophys. J., Suppl. Ser. 123, 3
- Lennon and Burke, 1994 Lennon, D. J. and Burke, V. M.: 1994, Astron. and Astrophys. Suppl. Sries 103, 273
- Liu and Kennicutt, 1995 Liu, C. T. and Kennicutt, Jr., R. C.: 1995, Astrophys. J. 450, 547
- Liu, 2006 Liu, X.-W.: 2006, in M. J. Barlow and R. H. Méndez (eds.), Planetary Nebulae in our Galaxy and Beyond, Vol. 234 of IAU Symposium, pp 219–226
- Liu et al., 2006 Liu, X.-W., Barlow, M. J., Zhang, Y., Bastin, R. J., and Storey, P. J.: 2006, Mon. Not. R. Astron. Soc. 368, 1959
- Liu et al., 2001 Liu, X.-W., Luo, S.-G., Barlow, M. J., Danziger, I. J., and Storey, P. J.: 2001, Mon. Not. R. Astron. Soc. 327, 141
- Liu et al., 2000 Liu, X.-W., Storey, P. J., Barlow, M. J., Danziger, I. J., Cohen, M., and Bryce, M.: 2000, Mon. Not. R. Astron. Soc. 312, 585
- López, 2005a López, J.: 2005a, MSc Thesis, INAOE
- López, 2005b López, J.: 2005b, MSc Thesis, INAOE
- Luridiana et al., 2003 Luridiana, V., Peimbert, A., Peimbert, M., and Cerviño, M.: 2003, Astrophys. J. 592, 846
- Luridiana et al., 1999 Luridiana, V., Peimbert, M., and Leitherer, C.: 1999, Astrophys. J. 527, 110
- Macchetto et al., 1990 Macchetto, F., Colina, L., Golombek, D., Perryman, M. A. C., and di Serego Alighieri, S.: 1990, Astrophys. J. 356, 389
- Maoz et al., 2001 Maoz, D., Barth, A. J., Ho, L. C., Sternberg, A., and Filippenko, A. V.: 2001, Astron. J. 121, 3048
- Maoz et al., 1996 Maoz, D., Barth, A. J., Sternberg, A., Filippenko, A. V., Ho, L. C., Macchetto, F. D., Rix, H.-W., and Schneider, D. P.: 1996, Astron. J. 111, 2248
- Marconi et al., 2006 Marconi, A., Pastorini, G., Pacini, F., Axon, D. J., Capetti, A., Macchetto, D., Koekemoer, A. M., and Schreier, E. J.: 2006, Astron. Astrophys. 448, 921
- Mas-Hesse and Kunth, 1991 Mas-Hesse, J. M. and Kunth, D.: 1991, Astron. and Astrophys. Suppl. Sries 88, 399
- Mas-Hesse et al., 2003 Mas-Hesse, J. M., Kunth, D., Tenorio-Tagle, G., Leitherer, C., Terlevich, R. J., and Terlevich, E.: 2003, Astrophys. J. 598, 858
- Mateus et al., 2007 Mateus, A., Sodré, L., Cid Fernandes, R., and Stasińska, G.: 2007, Mon. Not. R. Astron. Soc. 374, 1457
- Mateus et al., 2006 Mateus, A., Sodré, L., Cid Fernandes, R., Stasińska, G., Schoenell, W., and Gomes, J. M.: 2006, Mon. Not. R. Astron. Soc. 370, 721
- McCall and Schmidt, 1986 McCall, M. L. and Schmidt, F. H.: 1986, Astrophys. J. 311, 548
- McCrady et al., 2003 McCrady, N., Gilbert, A. M., and Graham, J. R.: 2003, Astrophys. J. 596, 240
- McCrady and Graham, 2007 McCrady, N. and Graham, J. R.: 2007, Astrophys. J. 663, 844
- McGaugh, 1991 McGaugh, S. S.: 1991, Astrophys. J. 380, 140
- Melbourne et al., 2004 Melbourne, J., Phillips, A., Salzer, J. J., Gronwall, C., and Sarajedini, V. L.: 2004, Astron. J. 127, 686 (M04)
- Melnick et al., 1999 Melnick, J., Tenorio-Tagle, G., and Terlevich, R.: 1999, Mon. Not. R. Astron. Soc. 302, 677
- Melnick et al., 1985a Melnick, J., Terlevich, R., and Eggleton, P. P.: 1985a, Mon. Not. R. Astron. Soc. 216, 255
- Melnick et al., 1985b Melnick, J., Terlevich, R., and Moles, M.: 1985b, Revista Mexicana de Astronomia y Astrofisica 11, 91
- Melnick et al., 1988 Melnick, J., Terlevich, R., and Moles, M.: 1988, Mon. Not. R. Astron. Soc. 235, 297
- Melnick et al., 2000 Melnick, J., Terlevich, R., and Terlevich, E.: 2000, Mon. Not. R. Astron. Soc. 311
- Mengel et al., 2005 Mengel, S., Lehnert, M. D., Thatte, N., and Genzel, R.: 2005, Astron. Astrophys. 443, 41
- Mengel et al., 2008 Mengel, S., Lehnert, M. D., Thatte, N. A., Vacca, W. D., Whitmore, B., and Chandar, R.: 2008, ArXiv e-prints 805
- Meurer et al., 1995 Meurer, G. R., Heckman, T. M., Leitherer, C., Kinney, A., Robert, C., and Garnett, D. R.: 1995, Astron. J. 110, 2665
- Meynet et al., 1994 Meynet, G., Maeder, A., Schaller, G., Schaerer, D., and Charbonnel, C.: 1994, Astron. and Astrophys. Suppl. Sries 103, 97
- Miller et al., 1997 Miller, B. W., Whitmore, B. C., Schweizer, F., and Fall, S. M.: 1997, Astron. J. 114, 2381
- Miller and Mathews, 1972 Miller, J. S. and Mathews, W. G.: 1972, Astrophys. J. 172, 593
- Mollá et al., 2006 Mollá, M., Vílchez, J. M., Gavilán, M., and Díaz, A. I.: 2006, Mon. Not. R. Astron. Soc. 372, 1069
- Morgan, 1958 Morgan, W. W.: 1958, Publ. Astron. Soc. Pac. 70, 364
- Morisset et al., 2004 Morisset, C., Schaerer, D., Bouret, J.-C., and Martins, F.: 2004, Astron. Astrophys. 415, 577
- Mould et al., 2000 Mould, J. R., Huchra, J. P., Freedman, W. L., Kennicutt, Jr., R. C., Ferrarese, L., Ford, H. C., Gibson, B. K., Graham, J. A., Hughes, S. M. G., Illingworth, G. D., Kelson, D. D., Macri, L. M., Madore, B. F., Sakai, S., Sebo, K. M., Silbermann, N. A., and Stetson, P. B.: 2000, Astrophys. J. 529, 786
- Mulder and van Driel, 1996 Mulder, P. S. and van Driel, W.: 1996, Astron. Astrophys. 309, 403
- Mulder et al., 1995 Mulder, P. S., van Driel, W., and Braine, J.: 1995, Astron. Astrophys. 300, 687
- Nagao et al., 2006 Nagao, T., Maiolino, R., and Marconi, A.: 2006, Astron. Astrophys. 459, 85
- Nelson and Whittle, 1995 Nelson, C. H. and Whittle, M.: 1995, Astrophys. J., Suppl. Ser. 99, 67
- Noeske et al., 2005 Noeske, K. G., Papaderos, P., Cairós, L. M., and Fricke, K. J.: 2005, Astron. Astrophys. 429, 115
- Oke, 1990 Oke, J. B.: 1990, Astron. J. 99, 1621
- Oke and Gunn, 1983 Oke, J. B. and Gunn, J. E.: 1983, Astrophys. J. 266, 713
- Olive and Skillman, 2001 Olive, K. A. and Skillman, E. D.: 2001, New Astronomy 6, 119
- Olive and Skillman, 2004 Olive, K. A. and Skillman, E. D.: 2004, Astrophys. J. 617, 29
- Origlia et al., 2001 Origlia, L., Leitherer, C., Aloisi, A., Greggio, L., and Tosi, M.: 2001, Astron. J. 122, 815
- Origlia et al., 2004 Origlia, L., Ranalli, P., Comastri, A., and Maiolino, R.: 2004, Astrophys. J. 606, 862
- Osterbrock, 1989 Osterbrock, D. E.: 1989, Astrophysics of gaseous nebulae and active galactic nuclei, Mill Valley, CA, University Science Books
- Osterbrock et al., 1996 Osterbrock, D. E., Fulbright, J. P., Martel, A. R., Keane, M. J., Trager, S. C., and Basri, G.: 1996, Publ. Astron. Soc. Pac. 108, 277
- Östlin et al., 2004 Östlin, G., Cumming, R. J., Amram, P., Bergvall, N., Kunth, D., Márquez, I., Masegosa, J., and Zackrisson, E.: 2004, Astron. Astrophys. 419, L43
- Pagel et al., 1979 Pagel, B. E. J., Edmunds, M. G., Blackwell, D. E., Chun, M. S., and Smith, G.: 1979, Mon. Not. R. Astron. Soc. 189, 95
- Pagel et al., 1992 Pagel, B. E. J., Simonson, E. A., Terlevich, R. J., and Edmunds, M. G.: 1992, Mon. Not. R. Astron. Soc. 255, 325
- Palacios et al., 1997 Palacios, J., García-Vargas, M. L., Díaz, A., Terlevich, R., and Terlevich, E.: 1997, Astron. Astrophys. 323, 749
- Pasquali and Castangia, 2008 Pasquali, A. and Castangia, P.: 2008, Mon. Not. R. Astron. Soc. 385, 468
- Pastorini et al., 2007 Pastorini, G., Marconi, A., Capetti, A., Axon, D. J., Alonso-Herrero, A., Atkinson, J., Batcheldor, D., Carollo, C. M., Collett, J., Dressel, L., Hughes, M. A., Macchetto, D., Maciejewski, W., Sparks, W., and van der Marel, R.: 2007, Astron. Astrophys. 469, 405
- Pastoriza et al., 1993 Pastoriza, M. G., Dottori, H. A., Terlevich, E., Terlevich, R., and Diaz, A. I.: 1993, Mon. Not. R. Astron. Soc. 260, 177
- Pauldrach et al., 2001 Pauldrach, A. W. A., Hoffmann, T. L., and Lennon, M.: 2001, Astron. Astrophys. 375, 161
- Peimbert, 2003 Peimbert, A.: 2003, Astrophys. J. 584, 735
- Peimbert et al., 2002 Peimbert, A., Peimbert, M., and Luridiana, V.: 2002, Astrophys. J. 565, 668
- Peimbert et al., 2005 Peimbert, A., Peimbert, M., and Ruiz, M. T.: 2005, Astrophys. J. 634, 1056
- Peimbert, 1967 Peimbert, M.: 1967, Astrophys. J. 150, 825
- Peimbert, 1971 Peimbert, M.: 1971, Boletin de los Observatorios Tonantzintla y Tacubaya 6, 29
- Peimbert and Costero, 1969 Peimbert, M. and Costero, R.: 1969, Boletin de los Observatorios Tonantzintla y Tacubaya 5, 3
- Peimbert and Peimbert, 2003 Peimbert, M. and Peimbert, A.: 2003, in Revista Mexicana de Astronomia y Astrofisica Conference Series, Vol. 16, pp 113–116
- Peimbert and Peimbert, 2006 Peimbert, M. and Peimbert, A.: 2006, in M. J. Barlow and R. H. Méndez (eds.), Planetary Nebulae in our Galaxy and Beyond, Vol. 234 of IAU Symposium, pp 227–234
- Peimbert et al., 2007 Peimbert, M., Peimbert, A., Esteban, C., García-Rojas, J., Bresolin, F., Carigi, L., Ruiz, M. T., and López-Sánchez, A. R.: 2007, in Revista Mexicana de Astronomia y Astrofisica Conference Series, Vol. 29 of Revista Mexicana de Astronomia y Astrofisica Conference Series, pp 72–79
- Peimbert et al., 2000 Peimbert, M., Peimbert, A., and Ruiz, M. T.: 2000, Astrophys. J. 541, 688
- Peimbert et al., 2004 Peimbert, M., Peimbert, A., Ruiz, M. T., and Esteban, C.: 2004, Astrophys. J., Suppl. Ser. 150, 431
- Peimbert and Torres-Peimbert, 1992 Peimbert, M. and Torres-Peimbert, S.: 1992, Astron. Astrophys. 253, 349
- Pérez et al., 2000 Pérez, E., Márquez, I., Marrero, I., Durret, F., González Delgado, R. M., Masegosa, J., Maza, J., and Moles, M.: 2000, Astron. Astrophys. 353, 893
- Pérez-Montero and Díaz, 2003 Pérez-Montero, E. and Díaz, A. I.: 2003, Mon. Not. R. Astron. Soc. 346, 105 (PMD03)
- Pérez-Montero and Díaz, 2005 Pérez-Montero, E. and Díaz, A. I.: 2005, Mon. Not. R. Astron. Soc. 361, 1063
- Pérez-Montero and Díaz, 2007 Pérez-Montero, E. and Díaz, A. I.: 2007, Mon. Not. R. Astron. Soc. 377, 1195
- Pérez-Montero et al., 2006 Pérez-Montero, E., Díaz, A. I., Vílchez, J. M., and Kehrig, C.: 2006, Astron. Astrophys. 449, 193
- Pérez-Montero et al., 2007 Pérez-Montero, E., Hägele, G. F., Contini, T., and Díaz, Á. I.: 2007, Mon. Not. R. Astron. Soc. 381, 125
- Pérez-Olea, 1996 Pérez-Olea, D.: 1996, PhD Thesis, Universidad Autónoma de Madrid
- Pettini et al., 2001 Pettini, M., Shapley, A. E., Steidel, C. C., Cuby, J.-G., Dickinson, M., Moorwood, A. F. M., Adelberger, K. L., and Giavalisco, M.: 2001, Astrophys. J. 554, 981
- Pettini et al., 2000 Pettini, M., Steidel, C. C., Adelberger, K. L., Dickinson, M., and Giavalisco, M.: 2000, Astrophys. J. 528, 96
- Phillips et al., 1984 Phillips, M. M., Pagel, B. E. J., Edmunds, M. G., and Díaz, A.: 1984, Mon. Not. R. Astron. Soc. 210, 701
- Pilyugin, 2000 Pilyugin, L. S.: 2000, Astron. Astrophys. 362, 325
- Pilyugin, 2007 Pilyugin, L. S.: 2007, Mon. Not. R. Astron. Soc. 375, 685
- Pilyugin et al., 2006 Pilyugin, L. S., Thuan, T. X., and Vílchez, J. M.: 2006, Mon. Not. R. Astron. Soc. 367, 1139
- Pilyugin et al., 2004 Pilyugin, L. S., Vílchez, J. M., and Contini, T.: 2004, Astron. Astrophys. 425, 849
- Piner et al., 1995 Piner, B. G., Stone, J. M., and Teuben, P. J.: 1995, Astrophys. J. 449, 508
- Pizzella et al., 2004 Pizzella, A., Corsini, E. M., Vega Beltrán, J. C., and Bertola, F.: 2004, Astron. Astrophys. 424, 447
- Planesas et al., 1997 Planesas, P., Colina, L., and Pérez-Olea, D.: 1997, Astron. Astrophys. 325, 81
- Popescu and Hopp, 2000 Popescu, C. C. and Hopp, U.: 2000, Astron. and Astrophys. Suppl. Sries 142, 247
- Porter et al., 2005 Porter, R. L., Bauman, R. P., Ferland, G. J., and MacAdam, K. B.: 2005, Astrophys. J. Letters 622, L73
- Prada et al., 1994 Prada, F., Greve, A., and McKeith, C. D.: 1994, Astron. Astrophys. 288, 396
- Pradhan, 1976 Pradhan, A. K.: 1976, Mon. Not. R. Astron. Soc. 177, 31
- Puxley et al., 1990 Puxley, P. J., Hawarden, T. G., and Mountain, C. M.: 1990, Astrophys. J. 364, 77
- Ramsbottom et al., 1996 Ramsbottom, C. A., Bell, K. L., and Stafford, R. P.: 1996, Atomic Data and Nuclear Data Tables 63, 57
- Rieke and Lebofsky, 1978 Rieke, G. H. and Lebofsky, M. J.: 1978, Astrophys. J. Letters 220, L37
- Rieke et al., 1993 Rieke, G. H., Loken, K., Rieke, M. J., and Tamblyn, P.: 1993, Astrophys. J. 412, 99
- Rieke and Low, 1972 Rieke, G. H. and Low, F. J.: 1972, Astrophys. J. Letters 176, L95+
- Roberts et al., 1979 Roberts, Jr., W. W., Huntley, J. M., and van Albada, G. D.: 1979, Astrophys. J. 233, 67
- Rodríguez and Rubin, 2004 Rodríguez, M. and Rubin, R. H.: 2004, in IAU Symp. 217, Recycling Intergallactic and Interstellar Matter, ed. P. A. Duc, J. Braine, and E. Brinks (San Francisco: ASP), pp 188–+ (astro–ph/0312246)
- Rola et al., 1997 Rola, C. S., Terlevich, E., and Terlevich, R. J.: 1997, Mon. Not. R. Astron. Soc. 289, 419
- Rosa-González et al., 2007 Rosa-González, D., Schmitt, H. R., Terlevich, E., and Terlevich, R.: 2007, Astrophys. J. 654, 226
- Rubin et al., 2002 Rubin, R. H., Bhatt, N. J., Dufour, R. J., Buckalew, B. A., Barlow, M. J., Liu, X.-W., Storey, P. J., Balick, B., Ferland, G. J., Harrington, J. P., and Martin, P. G.: 2002, Mon. Not. R. Astron. Soc. 334, 777
- Rubin et al., 1975 Rubin, V. C., Peterson, C. J., and Ford, Jr., W. K.: 1975, Astrophys. J. 199, 39
- Ruiz et al., 2003 Ruiz, M. T., Peimbert, A., Peimbert, M., and Esteban, C.: 2003, Astrophys. J. 595, 247
- Sakamoto et al., 1999 Sakamoto, K., Okumura, S. K., Ishizuki, S., and Scoville, N. Z.: 1999, Astrophys. J. 525, 691
- Salpeter, 1955 Salpeter, E. E.: 1955, Astrophys. J. 121, 161
- Sánchez-Portal et al., 2000 Sánchez-Portal, M., Díaz, Á. I., Terlevich, R., Terlevich, E., Álvarez Álvarez, M., and Aretxaga, I.: 2000, Mon. Not. R. Astron. Soc. 312, 2
- Sargent, 1970 Sargent, W. L. W.: 1970, Astrophys. J. 160, 405
- Sargent and Searle, 1970 Sargent, W. L. W. and Searle, L.: 1970, Astrophys. J. Letters 162, L155+
- Schulte-Ladbeck et al., 1998 Schulte-Ladbeck, R. E., Crone, M. M., and Hopp, U.: 1998, Astrophys. J. Letters 493, L23+
- Searle and Sargent, 1972 Searle, L. and Sargent, W. L. W.: 1972, Astrophys. J. 173, 25
- Searle et al., 1973 Searle, L., Sargent, W. L. W., and Bagnuolo, W. G.: 1973, Astrophys. J. 179, 427
- Sérsic and Pastoriza, 1965 Sérsic, J. L. and Pastoriza, M.: 1965, Publ. Astron. Soc. Pac. 77, 287
- Sérsic and Pastoriza, 1967 Sérsic, J. L. and Pastoriza, M.: 1967, Publ. Astron. Soc. Pac. 79, 152
- Shaw and Dufour, 1995 Shaw, R. A. and Dufour, R. J.: 1995, Publ. Astron. Soc. Pac. 107, 896
- Sheth et al., 2005 Sheth, K., Vogel, S. N., Regan, M. W., Thornley, M. D., and Teuben, P. J.: 2005, Astrophys. J. 632, 217
- Shields and Kennicutt, 1995 Shields, J. C. and Kennicutt, Jr., R. C.: 1995, Astrophys. J. 454, 807
- Siegel et al., 2005 Siegel, E. R., Guzmán, R., Gallego, J. P., Orduña López, M., and Rodríguez-Hidalgo, P.: 2005, Mon. Not. R. Astron. Soc. 356, 1117
- Skillman and Kennicutt, 1993 Skillman, E. D. and Kennicutt, Jr., R. C.: 1993, Astrophys. J. 411, 655 (SK93)
- Skillman et al., 1994 Skillman, E. D., Televich, R. J., Kennicutt, Jr., R. C., Garnett, D. R., and Terlevich, E.: 1994, Astrophys. J. 431, 172 (S94)
- Smith et al., 2005 Smith, B. J., Struck, C., Appleton, P. N., Charmandaris, V., Reach, W., and Eitter, J. J.: 2005, Astron. J. 130, 2117
- Smith et al., 1996 Smith, D. A., Neff, S. G., Bothun, G. D., Fanelli, M. N., Offenberg, J. D., Waller, W. H., Bohlin, R. C., O’Connell, R. W., Roberts, M. S., Smith, A. M., and Stecher, T. P.: 1996, Astrophys. J. Letters 473, L21+
- Smith et al., 2002 Smith, L. J., Norris, R. P. F., and Crowther, P. A.: 2002, Mon. Not. R. Astron. Soc. 337, 1309
- Stasińska and Izotov, 2003 Stasińska, G. and Izotov, Y.: 2003, Astron. Astrophys. 397, 71
- Stasińska, 1978 Stasińska, G.: 1978, Astron. Astrophys. 66, 257
- Stasińska, 1980 Stasińska, G.: 1980, Astron. Astrophys. 84, 320
- Stasińska, 1990 Stasińska, G.: 1990, Astron. and Astrophys. Suppl. Sries 83, 501
- Stasińska, 2005 Stasińska, G.: 2005, Astron. Astrophys. 434, 507
- Stasińska, 2006 Stasińska, G.: 2006, Astron. Astrophys. 454, L127
- Stasińska and Leitherer, 1996 Stasińska, G. and Leitherer, C.: 1996, Astrophys. J., Suppl. Ser. 107, 661
- Stauffer, 1982 Stauffer, J. R.: 1982, Astrophys. J., Suppl. Ser. 50, 517
- Storey and Hummer, 1995 Storey, P. J. and Hummer, D. G.: 1995, Mon. Not. R. Astron. Soc. 272, 41
- Stoughton and et al., 2002 Stoughton, C. and et al.: 2002, Astron. J. 123, 485
- Swartz et al., 2006 Swartz, D. A., Yukita, M., Tennant, A. F., Soria, R., and Ghosh, K. K.: 2006, Astrophys. J. 647, 1030
- Tayal and Gupta, 1999 Tayal, S. S. and Gupta, G. P.: 1999, Astrophys. J. 526, 544
- Telesco, 1988 Telesco, C. M.: 1988, Ann. Rev. Astron. Astrophys. 26, 343
- Telesco and Decher, 1988 Telesco, C. M. and Decher, R.: 1988, Astrophys. J. 334, 573
- Telesco and Gatley, 1984 Telesco, C. M. and Gatley, I.: 1984, Astrophys. J. 284, 557
- Telesco and Harper, 1980 Telesco, C. M. and Harper, D. A.: 1980, Astrophys. J. 235, 392
- Telles et al., 1997 Telles, E., Melnick, J., and Terlevich, R.: 1997, Mon. Not. R. Astron. Soc. 288, 78
- Temporin et al., 2003 Temporin, S., Ciroi, S., Rafanelli, P., Radovich, M., Vennik, J., Richter, G. M., and Birkle, K.: 2003, Astrophys. J., Suppl. Ser. 148, 353
- Terlevich et al., 1990 Terlevich, E., Terlevich, R., Díaz, A. I., Pastoriza, M. G., and Dottori, H.: 1990, Mon. Not. R. Astron. Soc. 242, 48P
- Terlevich et al., 2003 Terlevich, E., Terlevich, R., and Melnick, J.: 2003, in J. M. Rodriguez-Espinoza, F. Garzon Lopez, and V. Melo Martin (eds.), Revista Mexicana de Astronomia y Astrofisica Conference Series, pp 213–215
- Terlevich et al., 1991 Terlevich, R., Melnick, J., Masegosa, J., Moles, M., and Copetti, M. V. F.: 1991, Astron. and Astrophys. Suppl. Sries 91, 285 (T91)
- Thronson and Greenhouse, 1988 Thronson, Jr., H. A. and Greenhouse, M. A.: 1988, Astrophys. J. 327, 671
- Tinsley, 1968 Tinsley, B. M.: 1968, Astrophys. J. 151, 547
- Tinsley, 1972 Tinsley, B. M.: 1972, Astron. Astrophys. 20, 383
- Tonry and Davis, 1979 Tonry, J. and Davis, M.: 1979, Astron. J. 84, 1511
- Trancho et al., 2007 Trancho, G., Bastian, N., Miller, B. W., and Schweizer, F.: 2007, Astrophys. J. 664, 284
- Tsamis et al., 2003 Tsamis, Y. G., Barlow, M. J., Liu, X.-W., Danziger, I. J., and Storey, P. J.: 2003, Mon. Not. R. Astron. Soc. 338, 687
- Tsamis and Péquignot, 2005 Tsamis, Y. G. and Péquignot, D.: 2005, Mon. Not. R. Astron. Soc. 364, 687
- Ugryumov et al., 2003 Ugryumov, A. V., Engels, D., Pustilnik, S. A., Kniazev, A. Y., Pramskij, A. G., and Hagen, H.-J.: 2003, Astron. Astrophys. 397, 463
- van der Kruit, 1976 van der Kruit, P. C.: 1976, Astron. Astrophys. 49, 161
- van der Kruit and de Bruyn, 1976 van der Kruit, P. C. and de Bruyn, A. G.: 1976, Astron. Astrophys. 48, 373
- van Zee, 2000 van Zee, L.: 2000, Astrophys. J. Letters 543, L31
- Vázquez and Leitherer, 2005 Vázquez, G. A. and Leitherer, C.: 2005, Astrophys. J. 621, 695
- Vermeij and van der Hulst, 2002 Vermeij, R. and van der Hulst, J. M.: 2002, Astron. Astrophys. 391, 1081
- Vílchez et al., 1988 Vílchez, J. M., Pagel, B. E. J., Díaz, A. I., Terlevich, E., and Edmunds, M. G.: 1988, Mon. Not. R. Astron. Soc. 235, 633
- Vila-Costas and Edmunds, 1992 Vila-Costas, M. B. and Edmunds, M. G.: 1992, Mon. Not. R. Astron. Soc. 259, 121
- Vílchez and Esteban, 1996 Vílchez, J. M. and Esteban, C.: 1996, Mon. Not. R. Astron. Soc. 280, 720
- Vílchez and Pagel, 1988 Vílchez, J. M. and Pagel, B. E. J.: 1988, Mon. Not. R. Astron. Soc. 231, 257
- Wang et al., 2004 Wang, W., Liu, X.-W., Zhang, Y., and Barlow, M. J.: 2004, Astron. Astrophys. 427, 873
- Weaver and Woosley, 1993 Weaver, T. A. and Woosley, S. E.: 1993, Phys. Rep. 227, 65
- Wesson et al., 2005 Wesson, R., Liu, X.-W., and Barlow, M. J.: 2005, Mon. Not. R. Astron. Soc. 362, 424
- Whitmore and Schweizer, 1995 Whitmore, B. C. and Schweizer, F.: 1995, Astron. J. 109, 960
- Whitmore et al., 1993 Whitmore, B. C., Schweizer, F., Leitherer, C., Borne, K., and Robert, C.: 1993, Astron. J. 106, 1354
- Whitmore et al., 1999 Whitmore, B. C., Zhang, Q., Leitherer, C., Fall, S. M., Schweizer, F., and Miller, B. W.: 1999, Astron. J. 118, 1551
- Woods and Geller, 2007 Woods, D. F. and Geller, M. J.: 2007, Astron. J. 134, 527
- Woods et al., 2006 Woods, D. F., Geller, M. J., and Barton, E. J.: 2006, Astron. J. 132, 197
- Xu and Sulentic, 1991 Xu, C. and Sulentic, J. W.: 1991, Astrophys. J. 374, 407
- Zaritsky et al., 1994 Zaritsky, D., Kennicutt, Jr., R. C., and Huchra, J. P.: 1994, Astrophys. J. 420, 87
- Zeippen, 1982 Zeippen, C. J.: 1982, Mon. Not. R. Astron. Soc. 198, 111
- Zeippen et al., 1987 Zeippen, C. J., Le Bourlot, J., and Butler, K.: 1987, Astron. Astrophys. 188, 251
- Zepf et al., 1999 Zepf, S. E., Ashman, K. M., English, J., Freeman, K. C., and Sharples, R. M.: 1999, Astron. J. 118, 752
- Zwicky, 1966 Zwicky, F.: 1966, Astrophys. J. 143, 192
Chapter 6 Conclusions and future work
In this Chapter we summarize the main conclusions of this work and envisage future ramifications that stem from it.
In the present thesis we have studied large scale star formation processes in galaxies in two very different environments that can be considered extreme in terms of metal content: relatively compact Hii galaxies and circumnuclear star-forming regions in spiral galaxies. Hii galaxies are among the most metal-poor objects known while the circumnuclear regions of galaxies are expected to be very high abundance sites due to their location in the inner part of galactic bulges. Therefore, even when their emission line spectra are similar, as they both correspond to ionized gases, they show important differences. In the first case the spectra show a high excitation, being dominated by strong forbidden oxygen lines; in the second, the spectra show a considerably lower excitation, weak oxygen lines and more prominent nitrogen and sulphur lines when compared to lower abundance gas. In fact, for Hii galaxies, [Oiii] 5007/H 4, and reach values as high as 6 for the objects in this study, while the [Oiii] emission lines in CNSFRs are generally very weak ([Oiii] 5007/H 1).
We have analyzed the physical properties of the gas in 10 Hii galaxies and 12 CNSFRs in 3 early type spirals using intermediate resolution spectroscopy obtained with double arm spectrographs which provide the best spectrophotometry attainable, since it allows to cover the whole spectral range from 3600 to 10000 Å simultaneously in the same position in the object. We have also investigated the kinematical properties of the gas and stars in a total of 17 CNSFRs using high dispersion spectroscopy. In some cases, we have used complementary photometric data acquired from data archives and from the literature.
The first set of data has been used to infer the properties of the ionizing stellar populations using photo-ionization and stellar population synthesis models, including the photometric mass of the ionizing clusters. The second set of data has been used mainly to determine the dynamical masses of the CNSFRs, but has yielded some very interesting information about the gas kinematics in the galactic circumnuclear environments.
The main findings of our work are summarized below.
The star formation processes in Hii galaxies are found to occur in low density environments. In all the observed galaxies the electron densities have been found to be lower than 150 cm, well below the critical density for collisional de-excitation. In contrast, in the CNSFRs the densities are relatively high, with typical values around 300 cm, and in some cases as high as 440 cm. These values are higher than those usually derived for disc Hii regions, although still below the critical value for collisional de-excitation.
For all our observed Hii galaxies we have measured at least four line temperatures: T([Oiii]), T([Siii]), T([Oii]) and T([Sii]) reaching accuracies of 1 % in T([Oiii]), 3 % in T([Oii]) and 5 % in T([Siii]) in the best cases. These accuracies are expected to improve as better calibrations based on more precise measurements, both on electron temperatures and densities, are produced. The temperatures related to the high ionization zone are between 11000 and 14500 K, and in the low ionization zone between 9000 and 13500 K. This means that the observed objects are of intermediate excitation, in which the cooling is dominated by the oxygen forbidden lines.
For three of the Hii galaxies of the sample, we measured the Balmer continuum temperature [T(Bac)] and estimated the temperature fluctuations according to the scheme introduced by M. Peimbert. Only one of the objects shows significant temperature fluctuations which, if taken into account, would lead to higher oxygen abundances than derived by about 0.20 dex.
The temperature measurements for the observed Hii galaxies and a careful and realistic treatment of the observational errors yielded total oxygen abundances between 7.93 and 8.19 (Z/Z between 0.19 and 0.34, using 12+log(O/H) = 8.66 0.05 from [2005ASPC..336...25A]), with accuracies between 1 and 9 %. When compared to a large sample of Hii galaxies, the observed ones show higher N/O abundance ratios than the average. These ratios would be even higher if the [Oii] temperatures were derived with the use of photo-ionization models.
For some elements, like sulphur, neon and argon, the unseen contribution of different ionization species can be a source of appreciable error in the determination of chemical abundances. Using a grid of photo-ionization models that we have computed, we have calculated new ionization correction factors for Ne and Ar and we have studied the behaviour of the Ne/O and Ar/O abundance ratios with metallicity for our observed objects and for a heterogeneous sample of 853 objects including Hii galaxies, giant Hii regions in galactic discs and some Hii regions in the Milky Way, but excluding CNSFRs. A constant value for Ne/O has been found which points to the same nucleosynthesis sites for both elements in these objects. The situation regarding S/O is unclear, since the sample for which the necessary data exist is still small. For the objects studied in this work, the derived S/O ratios are consistent with the solar value within the observational errors, except for SDSS J0021, SDSS J1455 and SDSS J1528 for which S/O is lower by a factor of about 2.7 for the first and 1.8 for the other two. On the other hand, there seems to be some evidence for the existence of negative radial gradients of Ar/O over the discs of some nearby spirals. The origin of this gradient has to be explored.
The high average metallicity of the CNSFRs require a different methodology for abundance determinations involving empirical calibrators. We have developed a scheme for abundance determination using the oxygen and sulphur lines, these latter ones being much stronger than the first in this kind of objects. The scheme involves the calibration of T([Siii]) in terms of the SO parameter, and its use in combination with the observed line intensities of the different elements to derive the ionic abundances. This scheme has been found ”a posteriori” to yield results very similar to those obtained by L. Pyliugin using oxygen and nitrogen lines.
In all the observed CNSFRs the estimated T([Siii]) are substantially lower than for the Hii galaxies, ranging between 5400 and 6700 K. For one of the observed regions, the [Siii] 6312 Å auroral emission line was detected providing a measured electron temperature of T([Siii]) = 8400 K, consistent with our derived empirical calibration, although slightly higher than predicted.
The total oxygen abundances derived for our regions are between 8.42 and 8.85 in terms of 12+log(O/H) (Z/Z between 0.6 and 1.6). In contrast with the case of Hii galaxies for which the O/H abundances are dominated by O/H, in all the observed CNSFRs, the O/H abundance is dominated by the O/H contribution, as it is also the case for high metallicity disc Hii regions. For our observed circumnuclear regions, however, also the S/S ratio is larger than one, different from the case of high metallicity disc Hii regions for which, in general, the sulphur abundances are dominated by S/H.
Regarding abundance ratios, for the CNSFRs, the derived N/O ratios are in average larger than those found in high metallicity disc Hii regions and they do not seem to follow the trend of N/O vs. O/H which marks the secondary behaviour of nitrogen. The S/O ratios span a very narrow range between 0.6 and 0.8 of the solar value.
In spite of the differences in the environments where the star formation processes are taking place in the Hii galaxies and in the CNSFRs, their ionization structure and the temperature of their ionizing radiation field, as measured from their and ’ values, are very similar, yet very different from those of high metallicity disc Hii regions.
Taking into account the distances of our Hii galaxies, measured as part of the HST Key Project on the Extragalactic Distance Scale [2000ApJ...529..786Mtot], their H luminosities are in the range between 8.52 10 and 1.36 10 erg s, typical of this kind of objects [2006MNRAS.365..454H]. This luminosity range overlaps with the values derived for the CNSFRs, ranging between 7.50 10 and 1.44 10 erg s, also typical of this kind of objects [tesismar]. From these H luminosities, and using the calibration by [1989ApJ...344..685K], we find SFRs for our observed Hii galaxies in the range between 0.007 and 10.7 M yr. In the case of the studied CNSFRs these values range between 0.006 and 0.11 M yr, clearly overlapping with those derived for entire Hii galaxies.
There is clear evidence, both in the Hii galaxies and in the CNSFRs, of the presence of composite stellar populations, a young population responsible for the ionization of the gaseous medium and an older underlying population causing the absorption features easily observable in the hydrogen lines and, in some cases, in the helium ones. The presence of this older population reduces the equivalent widths of the emission lines increasing the continuum and absorbing some of the lines. This effect is largest in CNSFRs. Furthermore, the composite nature of these regions means that star formation in the rings is a process that has taken place over time periods much longer than those implied by the properties of the ionized gas.
Our high dispersion observations have allowed the measurement of the line widths of the gas and stars in CNSFRs in three different spiral galaxies: NGC 2903, NGC 3310 and NGC 3351. From the stellar absorption lines, corresponding to the CaT at 8500 Å, we have derived the dynamical masses of the stellar clusters, applying the virial theorem under the assumption that the systems are spherically symmetric, gravitationally bound and have isotropic velocity distribution. This provides upper limits to the masses inside the half light radius (typically between 3 and 5 pc) for each observed knot. Using the measured stellar velocity dispersions (31 - 66 km s) we obtained masses for the individual clusters between 1.4 10 and 1.1 10 M. The total dynamical masses of the CNSFRs are taken as the “sum” of these individual stellar clusters and are between 4.9 10 and 1.9 10 M.
These masses are about 10 times larger than those inferred from the observed number of ionizing photons emerging from the regions, using simple and robust stellar population models under the assumption of no photon leakage and without taking into account any absorption by dust.
An unexpected result from our study has been the finding of the existence of more than one velocity component in the ionized gas when Gaussian fits are performed, both in the hydrogen recombination and the [Oiii] lines. A component with a velocity dispersion substantially lower than that measured from the stellar lines, is clearly present in the hydrogen recombination lines and also seems to be present in the [Oiii] lines. The narrow component of the two-component Gaussian fits seems to be relatively constant for all the studied CNSFRs, with an estimated mean value close to 25 km s. This narrow component could be identified with ionized gas in a rotating disc, while the stars and the fraction of the gas (responsible for the broad component) related to the star-forming regions would be mostly supported by dynamical pressure [2004A&A...424..447P].
The fact that the emission lines show velocity components corresponding to kinematically distinct systems, could affect somewhat the results derived from the observations described above, among others, the gas abundance determinations. Also, masses derived from the H velocity dispersions under the assumption of a single component for the gas would have been underestimated by factors of approximately 2 to 4.
The rotation curve of the central zones of the studied early type spiral galaxies seem to have the turnover points at the same position as the star-forming ring, as found in other galaxies [1988ApJ...334..573T, 1999ApJ...512..623D], and the velocity distribution is consistent with that expected for this type of galaxies [1987gady.book.....B].
In summary, we have identified two star formation sites which differ widely in metal content. We conclude that ‘massive’ star formation that occurs in a high density, high metallicity environment, like that encountered in CNSFRs, takes place in systems that comply to the definition of super stellar clusters and that are arranged in much larger star forming complexes. These complexes have H luminosities, and therefore masses of ionizing stars, that overlap at the lower end with those found in Hii galaxies. The fact that their ionization structure and the temperature of their ionizing radiation field are very similar, point to stellar clusters have the same equivalent effective temperature in these two environments. This is contrary to what is expected from stellar evolution models which predict lower stellar effective temperatures in high metallicity regions. This point deserves further study.
Star forming regions in the two environments show a contribution by underlying stellar populations. This contribution is larger in CNSFRs and also the stellar population itself seems to be more evolved as evidenced by the presence of red supergiants which substantially contribute to the CaT lines. The fact that the N/O values are much higher in CNSFRs than in Hii galaxies and other high metallicity regions also point to the possibility of chemical evolution and self-enrichment in these regions.
Future work
In the course of this study, we have identified several results that inspired us for further investigation outside the scope of this work. This will entail the obtention of high quality optical spectroscopy observations with high spatial and spectral resolution both with integral spectroscopy units and two-arm spectrographs and longslit mode, using large telescopes. These observations should be complemented with wide electromagnetic spectral coverage.
Hii galaxies
One of our immediate aims is to try to expand the sample of Hii galaxies for which precise abundances can be obtained. In order to do that, double arm spectrographs and intermediate spectral resolution are required. The sample should be designed to encompass objects at the low and high electron temperature ends. This whole temperature coverage would provide a much needed constraint of the temperature structure in Hii galaxies.
One important issue is the study of the spatial variations of temperatures and abundances across a given galaxy since, in many cases, blue compact galaxies manifest themselves not so compact when observed at high spatial resolution. There are several nearby galaxies that can be very well mapped using Integral Field Unit spectrographs attached to 8 m telescopes such as GEMINI or VLT. Although these cameras have a small field of view, these telescopes have great light collector areas and an excellent spatial resolution. Even the PMAS-IFU instrument at the 3.5 m telescope of CAHA, which has a larger field of view but lower spatial resolution and light collector area, can perform a very complete and excellent work.
One aspect that deserves deeper study is whether or not temperature fluctuations are present in Hii galaxies. Another way to investigate this phenomenon is by comparing the abundances obtained for a particular ion both from collisionally excited and recombination lines. To this end, we plan to secure deeper observations of nearby and bright Hii galaxies in order to derive their abundances using recombination lines which are observable, but not measurable, in our spectra.
Regarding stellar populations, we are at present carrying out a project to study the properties of the brightest knots of star formation in the Hii galaxies studied in this work using detailed photo-ionization models. In this way we will study the properties of the ionizing stellar population, including, if present, the Wolf-Rayet stars following the analysis methodology explained in [2007MNRAS.377.1195P].
Circumnuclear star-forming regions
Given the importance of establishing the origin of the different kinematical components of the gas in the circumnuclear regions of galaxies and their influence in derived quantities that depend on line intensity ratios, we intend to conduct a campaign to study the velocity field of circumnuclear star forming rings in early type spirals, by mapping the gas and stellar velocity fields in these regions with good spatial sampling. We have already started this program using PMAS (lens array configuration) at the 3.5 m telescope of CAHA. We also plan to measure the widths of the [Siii] lines at 9069, 9532 Å, stronger than [Oiii] in this kind of objects. Figure 6.1 presents an H flux map where the main CNSFRs can be seen and a radial velocity map showing the inner galaxy rotation, as part of this project in progress.
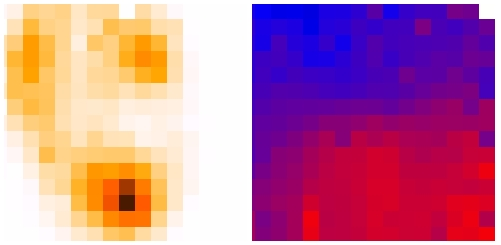
The study of the composite stellar populations in CNSFRs constitute a challenge. Most stellar population models point to a narrow interval of ages for the ionizing population. However, underlying stellar populations are clearly evident. In a effort to identify stellar population components not easily detected in the optical, we have designed observations to reveal the existence of supernova remnants (SNRs) and compact Hii regions associated with evolved and very young stellar populations, respectively, and closely related to the presence of recent star-formation. Time has been awarded to conduct these observations with MERLIN, the Multi-Element Radio Linked Interferometer Network, an array of radio telescopes distributed around Great Britain, with separations of up to 217 km. The requested observations have recently been completed and are being processed. The sub-arcsecond resolution radio observations of NGC 3351 will be sensitive enough not only to detect the already known Hii regions and SNRs, but also to discover new populations of ultra-compact Hii regions and SNRs, which are expected in regions of recent star formation activity. It is also possible that some of the X-ray sources with no obvious counterparts at other wavelengths (see Fig. 6.2) could be traced in the radio continuum. With such high resolution observations we will then be able to constrain the origin of the high energy emission from the point sources recently detected by [2006ApJ...647.1030S] using Chandra observations.
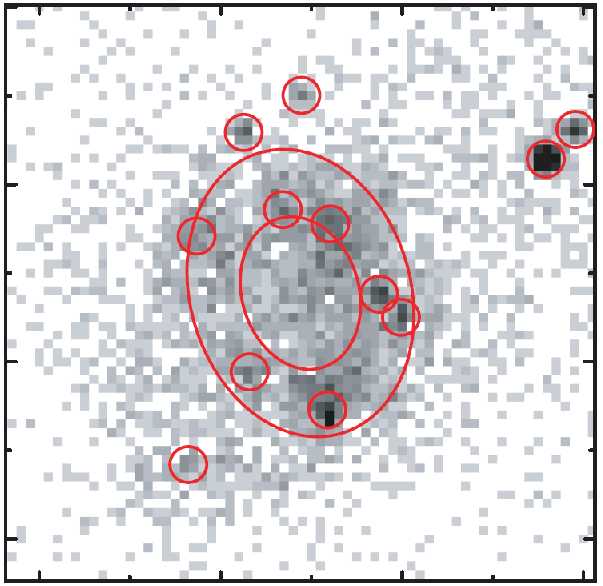
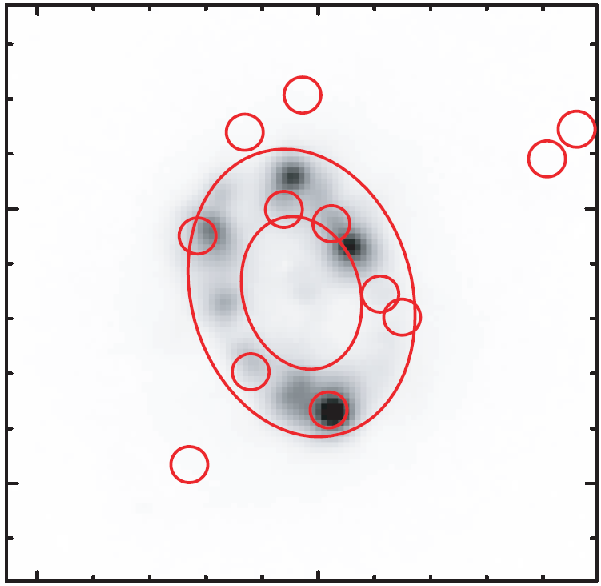
We also plan to perform abundance determinations of the very hot gas in the central 1 kpc of two of the circumnuclear rings studied in the present thesis combining the simultaneous observations obtained using the RGS and EPIC-pn cameras on board the XMM-Newton Satellite in a similar way to that followed by [2004ApJ...606..862O]. Observations are in progress for the circumnuclear regions of NGC 3310. For this galaxy, the analysis of the ionized gas in the circumnuclear Hii regions yields an oxygen abundance lower than expected from empirical abundance indicators. These findings point to an effect similar to what is found for M82, i.e. a deficiency of light alpha elements (O, Ne) in the central regions. If this is common among regions dominated by recent star formation, the oxygen abundances found for the warm ionized gas might not be representative of the true metal content of these regions. This could have a profound effect on the abundance calibrations leading to fundamental relations like the Mass-Metallicity and Luminosity-Metallicity relations.
Finally, combining photo-ionization models and synthetic stellar populations we will study in detail the stellar population of the CNSFRs, taking into account all the physical parameters derived in this thesis, the composite stellar population, the Wolf-Rayet features observed in their spectra and the low equivalent widths of the emission lines.
Bibliography
- Abazajian et al. (2004) Abazajian, K., Adelman-McCarthy, J. K., Agüeros, M. A., Allam, S. S., Anderson, K., Anderson, S. F., Annis, J., Bahcall, N. A., Baldry, I. K., Bastian, S., and 143 coauthors: 2004, Astron. J. 128, 502
- Abazajian et al. (2005) Abazajian, K., Adelman-McCarthy, J. K., Agüeros, M. A., Allam, S. S., Anderson, K. S. J., Anderson, S. F., Annis, J., Bahcall, N. A., Baldry, I. K., Bastian, S., and 144 coauthors: 2005, Astron. J. 129, 1755
- Adelman-McCarthy et al. (2008) Adelman-McCarthy, J. K., Agüeros, M. A., Allam, S. S., Allende Prieto, C., Anderson, K. S. J., Anderson, S. F., Annis, J., Bahcall, N. A., Bailer-Jones, C. A. L., Baldry, I. K., and 153 coauthors: 2008, Astrophys. J., Suppl. Ser. 175, 297
- Adelman-McCarthy et al. (2006) Adelman-McCarthy, J. K., Agüeros, M. A., Allam, S. S., Anderson, K. S. J., Anderson, S. F., Annis, J., Bahcall, N. A., Baldry, I. K., Barentine, J. C., Berlind, A., and 131 coauthors: 2006, Astrophys. J., Suppl. Ser. 162, 38
- Allende-Prieto et al. (2001) Allende-Prieto, C., Lambert, D. L., and Asplund, M.: 2001, Astrophys. J. Letters 556, L63
- Alloin et al. (1979) Alloin, D., Collin-Souffrin, S., Joly, M., and Vigroux, L.: 1979, Astron. Astrophys. 78, 200
- Alloin and Nieto (1982) Alloin, D. and Nieto, J.-L.: 1982, Astron. and Astrophys. Suppl. Sries 50, 491
- Aloisi et al. (1999) Aloisi, A., Tosi, M., and Greggio, L.: 1999, Astron. J. 118, 302
- Alonso-Herrero et al. (2001a) Alonso-Herrero, A., Engelbracht, C. W., Rieke, M. J., Rieke, G. H., and Quillen, A. C.: 2001a, Astrophys. J. 546, 952
- Alonso-Herrero et al. (2000) Alonso-Herrero, A., Rieke, G. H., Rieke, M. J., and Scoville, N. Z.: 2000, Astrophys. J. 532, 845
- Alonso-Herrero et al. (2001b) Alonso-Herrero, A., Ryder, S. D., and Knapen, J. H.: 2001b, Mon. Not. R. Astron. Soc. 322, 757
- Álvarez-Álvarez (2002) Álvarez-Álvarez, M.: 2002, PhD Thesis, Universidad Autónoma de Madrid
- Arp and Sandage (1985) Arp, H. and Sandage, A.: 1985, Astron. J. 90, 1163
- Asari et al. (2007) Asari, N. V., Cid Fernandes, R., Stasińska, G., Torres-Papaqui, J. P., Mateus, A., Sodré, L., Schoenell, W., and Gomes, J. M.: 2007, Mon. Not. R. Astron. Soc. 381, 263
- Asplund et al. (2005) Asplund, M., Grevesse, N., and Sauval, A. J.: 2005, in T. G. Barnes, III and F. N. Bash (eds.), Cosmic Abundances as Records of Stellar Evolution and Nucleosynthesis, Vol. 336 of Astronomical Society of the Pacific Conference Series, pp 25–+
- Athanassoula (1992a) Athanassoula, E.: 1992a, Mon. Not. R. Astron. Soc. 259, 328
- Athanassoula (1992b) Athanassoula, E.: 1992b, Mon. Not. R. Astron. Soc. 259, 345
- Badnell (2006) Badnell, N. R.: 2006, Astron. Astrophys. 447, 389
- Bagnuolo (1976) Bagnuolo, Jr., W. G.: 1976, Ph.D. thesis, AA(California Inst. of Tech., Pasadena.)
- Baldwin et al. (1981) Baldwin, J. A., Phillips, M. M., and Terlevich, R.: 1981, Publ. Astron. Soc. Pac. 93, 5
- Baldwin et al. (1982) Baldwin, J. A., Spinrad, H., and Terlevich, R.: 1982, Mon. Not. R. Astron. Soc. 198, 535
- Balick and Heckman (1981) Balick, B. and Heckman, T.: 1981, Astron. Astrophys. 96, 271
- Balick and Sneden (1976) Balick, B. and Sneden, C.: 1976, Astrophys. J. 208, 336
- Balzano (1983) Balzano, V. A.: 1983, Astrophys. J. 268, 602
- Barker (1980) Barker, T.: 1980, Astrophys. J. 240, 99
- Barmby et al. (2000) Barmby, P., Huchra, J. P., Brodie, J. P., Forbes, D. A., Schroder, L. L., and Grillmair, C. J.: 2000, Astron. J. 119, 727
- Barth et al. (1995) Barth, A. J., Ho, L. C., Filippenko, A. V., and Sargent, W. L.: 1995, Astron. J. 110, 1009
- Bastian et al. (2005) Bastian, N., Gieles, M., Lamers, H. J. G. L. M., Scheepmaker, R. A., and de Grijs, R.: 2005, Astron. Astrophys. 431, 905
- Bastian et al. (2006) Bastian, N., Saglia, R. P., Goudfrooij, P., Kissler-Patig, M., Maraston, C., Schweizer, F., and Zoccali, M.: 2006, Astron. Astrophys. 448, 881
- Benedict et al. (2002) Benedict, G. F., Howell, D. A., Jørgensen, I., Kenney, J. D. P., and Smith, B. J.: 2002, Astron. J. 123, 1411
- Benjamin et al. (1999) Benjamin, R. A., Skillman, E. D., and Smits, D. P.: 1999, Astrophys. J. 514, 307
- Binney and Tremaine (1987) Binney, J. and Tremaine, S.: 1987, Galactic dynamics, Princeton, NJ, Princeton University Press, 1987, 747 p.
- Boer and Schulz (1993) Boer, B. and Schulz, H.: 1993, Astron. Astrophys. 277, 397
- Bosch and Meza (2001) Bosch, G. and Meza, A.: 2001, in Revista Mexicana de Astronomia y Astrofisica Conference Series, Vol. 11 of Revista Mexicana de Astronomia y Astrofisica, vol. 27, pp 29–+
- Bosch et al. (2001) Bosch, G., Selman, F., Melnick, J., and Terlevich, R.: 2001, Astron. Astrophys. 380, 137
- Bosch et al. (2008) Bosch, G., Terlevich, E., and Terlevich, R.: 2008, Mon. Not. R. Astron. Soc.(submitted)
- Bottinelli et al. (1984) Bottinelli, L., Gouguenheim, L., Paturel, G., and de Vaucouleurs, G.: 1984, Astron. and Astrophys. Suppl. Sries 56, 381
- Bournaud et al. (2004) Bournaud, F., Duc, P.-A., Amram, P., Combes, F., and Gach, J.-L.: 2004, Astron. Astrophys. 425, 813
- Bresolin (2007) Bresolin, F.: 2007, Astrophys. J. 656, 186
- Bresolin et al. (2004) Bresolin, F., Garnett, D. R., and Kennicutt, Jr., R. C.: 2004, Astrophys. J. 615, 228
- Bresolin and Kennicutt (1997) Bresolin, F. and Kennicutt, Jr., R. C.: 1997, Astron. J. 113, 975
- Bresolin et al. (1999) Bresolin, F., Kennicutt, Jr., R. C., and Garnett, D. R.: 1999, Astrophys. J. 510, 104
- Bresolin et al. (2005) Bresolin, F., Schaerer, D., González-Delgado, R. M., and Stasińska, G.: 2005, Astron. Astrophys. 441, 981
- Brocklehurst (1971) Brocklehurst, M.: 1971, Mon. Not. R. Astron. Soc. 153, 471
- Bushouse (1987) Bushouse, H. A.: 1987, Astrophys. J. 320, 49
- Bushouse et al. (1998) Bushouse, H. A., Telesco, C. M., and Werner, M. W.: 1998, Astron. J. 115, 938
- Bushouse et al. (1988) Bushouse, H. A., Werner, M. W., and Lamb, S. A.: 1988, Astrophys. J. 335, 74
- Butler and Zeippen (1994) Butler, K. and Zeippen, C. J.: 1994, Astron. and Astrophys. Suppl. Sries 108, 1
- Carlson et al. (1998) Carlson, M. N., Holtzman, J. A., Watson, A. M., Grillmair, C. J., Mould, J. R., Ballester, G. E., Burrows, C. J., Clarke, J. T., Crisp, D., Evans, R. W., Gallagher, III, J. S., Griffiths, R. E., Hester, J. J., Hoessel, J. G., Scowen, P. A., Stapelfeldt, K. R., Trauger, J. T., and Westphal, J. A.: 1998, Astron. J. 115, 1778
- Castellanos et al. (2002) Castellanos, M., Díaz, A. I., and Terlevich, E.: 2002, Mon. Not. R. Astron. Soc. 329, 315
- Cepa and Beckman (1990) Cepa, J. and Beckman, J. E.: 1990, Astrophys. J. 349, 497
- Cerviño et al. (2002) Cerviño, M., Valls-Gabaud, D., Luridiana, V., and Mas-Hesse, J. M.: 2002, Astron. Astrophys. 381, 51
- Cid Fernandes et al. (2007) Cid Fernandes, R., Asari, N. V., Sodré, L., Stasińska, G., Mateus, A., Torres-Papaqui, J. P., and Schoenell, W.: 2007, Mon. Not. R. Astron. Soc. 375, L16
- Cid Fernandes et al. (2001) Cid Fernandes, R., Heckman, T., Schmitt, H., Delgado, R. M. G., and Storchi-Bergmann, T.: 2001, Astrophys. J. 558, 81
- Cid Fernandes et al. (2005) Cid Fernandes, R., Mateus, A., Sodré, L., Stasińska, G., and Gomes, J. M.: 2005, Mon. Not. R. Astron. Soc. 358, 363
- Colina et al. (1997) Colina, L., García Vargas, M. L., Mas-Hesse, J. M., Alberdi, A., and Krabbe, A.: 1997, Astrophys. J. Letters 484, L41+
- Colina et al. (2002) Colina, L., González-Delgado, R., Mas-Hesse, J. M., and Leitherer, C.: 2002, Astrophys. J. 579, 545
- Combes and Gerin (1985) Combes, F. and Gerin, M.: 1985, Astron. Astrophys. 150, 327
- Crockett et al. (2006) Crockett, N. R., Garnett, D. R., Massey, P., and Jacoby, G.: 2006, Astrophys. J. 637, 741
- de Robertis et al. (1987) de Robertis, M. M., Dufour, R. J., and Hunt, R. W.: 1987, Royal Astronomical Society of Canada, Journal 81, 195
- de Vaucouleurs (1963) de Vaucouleurs, G.: 1963, Astrophys. J., Suppl. Ser. 8, 31
- de Vaucouleurs et al. (1991) de Vaucouleurs, G., de Vaucouleurs, A., Corwin, Jr., H. G., Buta, R. J., Paturel, G., and Fouque, P.: 1991, Third Reference Catalogue of Bright Galaxies, Volume 1-3, XII, 2069 pp. 7 figs.. Springer-Verlag Berlin Heidelberg New York
- Denicoló et al. (2002) Denicoló, G., Terlevich, R., and Terlevich, E.: 2002, Mon. Not. R. Astron. Soc. 330, 69
- Denicoló et al. (2002) Denicoló, G., Terlevich, R., and Terlevich, E.: 2002, Mon. Not. R. Astron. Soc. 330, 69
- Devereux (1989) Devereux, N. A.: 1989, Astrophys. J. 346, 126
- Devereux et al. (1992) Devereux, N. A., Kenney, J. D., and Young, J. S.: 1992, Astron. J. 103, 784
- Díaz (1989) Díaz, A. I.: 1989, in J. E. Beckman and B. E. J. Pagel (eds.), Evolutionary Phenomena in Galaxies, pp 377–397
- Díaz (1988) Díaz, A. I.: 1988, Mon. Not. R. Astron. Soc. 231, 57
- Díaz (1998) Díaz, A. I.: 1998, Astron. Astrophys. Suppl. Ser. 263, 143
- Díaz et al. (2000a) Díaz, A. I., Álvarez-Álvarez, M., Terlevich, E., Terlevich, R., Portal, M. S., and Aretxaga, I.: 2000a, Mon. Not. R. Astron. Soc. 311, 120
- Díaz et al. (2000b) Díaz, A. I., Castellanos, M., Terlevich, E., and Luisa García-Vargas, M.: 2000b, Mon. Not. R. Astron. Soc. 318, 462
- Díaz and Pérez-Montero (2000) Díaz, A. I. and Pérez-Montero, E.: 2000, Mon. Not. R. Astron. Soc. 312, 130
- Díaz et al. (1985) Díaz, A. I., Pagel, B. E. J., and Wilson, I. R. G.: 1985, Mon. Not. R. Astron. Soc. 212, 737
- Díaz and Pérez-Montero (1999) Díaz, A. I. and Pérez-Montero, E.: 1999, in J. R. Walsh and M. R. Rosa (eds.), Chemical Evolution from Zero to High Redshift, pp 134–+
- Díaz et al. (2006) Díaz, A. I., Terlevich, E., Castellanos, M., and Hägele, G. F.: 2006, astro-ph/0610787
- Díaz et al. (2007) Díaz, Á. I., Terlevich, E., Castellanos, M., and Hägele, G. F.: 2007, Mon. Not. R. Astron. Soc. 382, 251
- Díaz et al. (1987) Díaz, A. I., Terlevich, E., Pagel, B. E. J., Víilchez, J. M., and Edmunds, M. G.: 1987, Mon. Not. R. Astron. Soc. 226, 19
- Díaz et al. (1989) Díaz, A. I., Terlevich, E., and Terlevich, R.: 1989, Mon. Not. R. Astron. Soc. 239, 325
- Díaz et al. (1991) Díaz, A. I., Terlevich, E., Vílchez, J. M., Pagel, B. E. J., and Edmunds, M. G.: 1991, Mon. Not. R. Astron. Soc. 253, 245
- Díaz et al. (1999) Díaz, R., Carranza, G., Dottori, H., and Goldes, G.: 1999, Astrophys. J. 512, 623
- Dopita et al. (2002) Dopita, M. A., Pereira, M., Kewley, L. J., and Capaccioli, M.: 2002, Astrophys. J., Suppl. Ser. 143, 47
- Dors et al. (2008) Dors, Jr., O. L., Storchi-Bergmann, T., Riffel, R. A., and Schimdt, A. A.: 2008, astro-ph-0802.2070
- Drake and Testa (2005) Drake, J. J. and Testa, P.: 2005, Nature 436, 525
- Ellison et al. (2001) Ellison, S. L., Yan, L., Hook, I. M., Pettini, M., Wall, J. V., and Shaver, P.: 2001, Astron. Astrophys. 379, 393
- Elmegreen and Elmegreen (1986) Elmegreen, B. G. and Elmegreen, D. M.: 1986, Astrophys. J. 311, 554
- Elmegreen et al. (2002) Elmegreen, D. M., Chromey, F. R., McGrath, E. J., and Ostenson, J. M.: 2002, Astron. J. 123, 1381
- Elmegreen et al. (1997) Elmegreen, D. M., Chromey, F. R., Santos, M., and Marshall, D.: 1997, Astron. J. 114, 1850
- Elmegreen et al. (2006) Elmegreen, D. M., Elmegreen, B. G., Kaufman, M., Sheth, K., Struck, C., Thomasson, M., and Brinks, E.: 2006, Astrophys. J. 642, 158
- Elmegreen et al. (2001) Elmegreen, D. M., Kaufman, M., Elmegreen, B. G., Brinks, E., Struck, C., Klarić, M., and Thomasson, M.: 2001, Astron. J. 121, 182
- Elmegreen and Salzer (1999) Elmegreen, D. M. and Salzer, J. J.: 1999, Astron. J. 117, 764
- Ercolano et al. (2007) Ercolano, B., Bastian, N., and Stasińska, G.: 2007, Mon. Not. R. Astron. Soc. 379, 945
- Esteban et al. (2004) Esteban, C., Peimbert, M., García-Rojas, J., Ruiz, M. T., Peimbert, A., and Rodríguez, M.: 2004, Mon. Not. R. Astron. Soc. 355, 229
- Falco et al. (1999) Falco, E. E., Kurtz, M. J., Geller, M. J., Huchra, J. P., Peters, J., Berlind, P., Mink, D. J., Tokarz, S. P., and Elwell, B.: 1999, Publ. Astron. Soc. Pac. 111, 438
- Ferland et al. (1998) Ferland, G. J., Korista, K. T., Verner, D. A., Ferguson, J. W., Kingdon, J. B., and Verner, E. M.: 1998, Publ. Astron. Soc. Pac. 110, 761
- French (1980) French, H. B.: 1980, Astrophys. J. 240, 41
- Friedli and Benz (1995) Friedli, D. and Benz, W.: 1995, Astron. Astrophys. 301, 649
- Galavis et al. (1995) Galavis, M. E., Mendoza, C., and Zeippen, C. J.: 1995, Astron. and Astrophys. Suppl. Sries 111, 347
- Gallagher et al. (2001) Gallagher, S. C., Charlton, J. C., Hunsberger, S. D., Zaritsky, D., and Whitmore, B. C.: 2001, Astron. J. 122, 163
- García-Rojas (2006) García-Rojas, J.: 2006, PhD Thesis, Universidad de La Laguna
- García Vargas and Díaz (1994) García Vargas, M. L. and Díaz, A. I.: 1994, Astrophys. J., Suppl. Ser. 91, 553
- García-Rojas and Esteban (2007) García-Rojas, J. and Esteban, C.: 2007, Astrophys. J. 670, 457
- García-Rojas et al. (2005) García-Rojas, J., Esteban, C., Peimbert, A., Peimbert, M., Rodríguez, M., and Ruiz, M. T.: 2005, Mon. Not. R. Astron. Soc. 362, 301
- García-Rojas et al. (2006) García-Rojas, J., Esteban, C., Peimbert, M., Costado, M. T., Rodríguez, M., Peimbert, A., and Ruiz, M. T.: 2006, Mon. Not. R. Astron. Soc. 368, 253
- García-Rojas et al. (2004) García-Rojas, J., Esteban, C., Peimbert, M., Rodríguez, M., Ruiz, M. T., and Peimbert, A.: 2004, Astrophys. J., Suppl. Ser. 153, 501
- García-Vargas et al. (1995) García-Vargas, M. L., Bressan, A., and Díaz, A. I.: 1995, Astron. and Astrophys. Suppl. Sries 112, 35
- Garnett (1992) Garnett, D. R.: 1992, Astron. J. 103, 1330
- Garnett (2002) Garnett, D. R.: 2002, Astrophys. J. 581, 1019
- Garnett et al. (2004) Garnett, D. R., Kennicutt, Jr., R. C., and Bresolin, F.: 2004, Astrophys. J. Letters 607, L21
- Garnett et al. (1997) Garnett, D. R., Shields, G. A., Skillman, E. D., Sagan, S. P., and Dufour, R. J.: 1997, Astrophys. J. 489, 63
- Gil de Paz et al. (2003) Gil de Paz, A., Madore, B. F., and Pevunova, O.: 2003, Astrophys. J., Suppl. Ser. 147, 29
- González-Delgado et al. (2005) González-Delgado, R. M., Cerviño, M., Martins, L. P., Leitherer, C., and Hauschildt, P. H.: 2005, Mon. Not. R. Astron. Soc. 357, 945
- González-Delgado et al. (1998) González-Delgado, R. M., Heckman, T., Leitherer, C., Meurer, G., Krolik, J., Wilson, A. S., Kinney, A., and Koratkar, A.: 1998, Astrophys. J. 505, 174
- González-Delgado and Pérez (1996) González-Delgado, R. M. and Pérez, E.: 1996, Mon. Not. R. Astron. Soc. 281, 781
- González-Delgado et al. (1995) González-Delgado, R. M., Pérez, E., Díaz, A. I., García-Vargas, M. L., Terlevich, E., and Vílchez, J. M.: 1995, Astrophys. J. 439, 604
- González-Delgado et al. (1994) González-Delgado, R. M., Pérez, E., Tenorio-Tagle, G., Vílchez, J. M., Terlevich, E., Terlevich, R., Telles, E., Rodríguez-Espinosa, J. M., Mas-Hesse, M., García-Vargas, M. L., Díaz, A. I., Cepa, J., and Castañeda, H.: 1994, Astrophys. J. 437, 239
- Graham and et al. (1997) Graham, J. A. and et al.: 1997, Astrophys. J. 477, 535
- Grevesse and Sauval (1998) Grevesse, N. and Sauval, A. J.: 1998, Space Science Reviews 85, 161
- Groves et al. (2006) Groves, B. A., Heckman, T. M., and Kauffmann, G.: 2006, Mon. Not. R. Astron. Soc. 371, 1559
- Gu et al. (2006) Gu, Q., Melnick, J., Fernandes, R. C., Kunth, D., Terlevich, E., and Terlevich, R.: 2006, Mon. Not. R. Astron. Soc. 366, 480
- Guseva et al. (2007) Guseva, N. G., Izotov, Y. I., Papaderos, P., and Fricke, K. J.: 2007, Astron. Astrophys. 464, 885
- Guseva et al. (2000) Guseva, N. G., Izotov, Y. I., and Thuan, T. X.: 2000, Astrophys. J. 531, 776 (GIT00)
- Guseva et al. (2006) Guseva, N. G., Izotov, Y. I., and Thuan, T. X.: 2006, Astrophys. J. 644, 890
- Guseva et al. (2003a) Guseva, N. G., Papaderos, P., Izotov, Y. I., Green, R. F., Fricke, K. J., Thuan, T. X., and Noeske, K. G.: 2003a, Astron. Astrophys. 407, 75
- Guseva et al. (2003b) Guseva, N. G., Papaderos, P., Izotov, Y. I., Green, R. F., Fricke, K. J., Thuan, T. X., and Noeske, K. G.: 2003b, Astron. Astrophys. 407, 91
- Guseva et al. (2003c) Guseva, N. G., Papaderos, P., Izotov, Y. I., Green, R. F., Fricke, K. J., Thuan, T. X., and Noeske, K. G.: 2003c, Astron. Astrophys. 407, 105
- Guzmán et al. (1998) Guzmán, R., Jangren, A., Koo, D. C., Bershady, M. A., and Simard, L.: 1998, Astrophys. J. Letters 495, L13+
- Guzmán et al. (1996) Guzmán, R., Koo, D. C., Faber, S. M., Illingworth, G. D., Takamiya, M., Kron, R. G., and Bershady, M. A.: 1996, Astrophys. J. Letters 460, L5+
- Hägele et al. (2007) Hägele, G. F., Díaz, A. I., Cardaci, M. V., Terlevich, E., and Terlevich, R.: 2007, Mon. Not. R. Astron. Soc. 378, 163
- Hägele et al. (2008) Hägele, G. F., Díaz, Á. I., Terlevich, E., Terlevich, R., Pérez-Montero, E., and Cardaci, M. V.: 2008, Mon. Not. R. Astron. Soc. 383, 209
- Hägele et al. (2006) Hägele, G. F., Pérez-Montero, E., Díaz, A. I., Terlevich, E., and Terlevich, R.: 2006, Mon. Not. R. Astron. Soc. 372, 293
- Harper and Low (1973) Harper, Jr., D. A. and Low, F. J.: 1973, Astrophys. J. Letters 182, L89+
- Haynes et al. (1998) Haynes, M. P., van Zee, L., Hogg, D. E., Roberts, M. S., and Maddalena, R. J.: 1998, Astron. J. 115, 62
- Henry (1989) Henry, R. B. C.: 1989, Mon. Not. R. Astron. Soc. 241, 453
- Ho and Filippenko (1996a) Ho, L. C. and Filippenko, A. V.: 1996a, Astrophys. J. Letters 466, L83+
- Ho and Filippenko (1996b) Ho, L. C. and Filippenko, A. V.: 1996b, Astrophys. J. 472, 600
- Ho et al. (1997) Ho, L. C., Filippenko, A. V., and Sargent, W. L. W.: 1997, Astrophys. J., Suppl. Ser. 112, 315
- Holtzman et al. (1992) Holtzman, J. A., Faber, S. M., Shaya, E. J., Lauer, T. R., Groth, J., Hunter, D. A., Baum, W. A., Ewald, S. P., Hester, J. J., Light, R. M., Lynds, C. R., O’Neil, Jr., E. J., and Westphal, J. A.: 1992, Astron. J. 103, 691
- Holweger (2001) Holweger, H.: 2001, in R. F. Wimmer-Schweingruber (ed.), Joint SOHO/ACE workshop ”Solar and Galactic Composition”, Vol. 598 of American Institute of Physics Conference Series, pp 23–+
- Hoyos and Díaz (2006) Hoyos, C. and Díaz, A. I.: 2006, Mon. Not. R. Astron. Soc. 365, 454
- Hubble (1926) Hubble, E. P.: 1926, Astrophys. J. 64, 321
- Huchra (1977) Huchra, J. P.: 1977, Astrophys. J. 217, 928
- Israelian and Rebolo (2001) Israelian, G. and Rebolo, R.: 2001, Astrophys. J. Letters 557, L43
- Izotov et al. (1999) Izotov, Y. I., Chaffee, F. H., Foltz, C. B., Green, R. F., Guseva, N. G., and Thuan, T. X.: 1999, Astrophys. J. 527, 757
- Izotov et al. (2001a) Izotov, Y. I., Chaffee, F. H., and Green, R. F.: 2001a, Astrophys. J. 562, 727
- Izotov et al. (2001b) Izotov, Y. I., Chaffee, F. H., and Schaerer, D.: 2001b, Astron. Astrophys. 378, L45 (ICS01)
- Izotov et al. (1997a) Izotov, Y. I., Lipovetsky, V. A., Chaffee, F. H., Foltz, C. B., Guseva, N. G., and Kniazev, A. Y.: 1997a, Astrophys. J. 476, 698
- Izotov et al. (2004a) Izotov, Y. I., Papaderos, P., Guseva, N. G., Fricke, K. J., and Thuan, T. X.: 2004a, Astron. Astrophys. 421, 539
- Izotov et al. (2004b) Izotov, Y. I., Stasińska, G., Guseva, N. G., and Thuan, T. X.: 2004b, Astron. Astrophys. 415, 87 (IT04)
- Izotov et al. (2006) Izotov, Y. I., Stasińska, G., Meynet, G., Guseva, N. G., and Thuan, T. X.: 2006, Astron. Astrophys. 448, 955
- Izotov and Thuan (1998a) Izotov, Y. I. and Thuan, T. X.: 1998a, Astrophys. J. 497, 227
- Izotov and Thuan (1998b) Izotov, Y. I. and Thuan, T. X.: 1998b, Astrophys. J. 500, 188 (IT98)
- Izotov and Thuan (2004) Izotov, Y. I. and Thuan, T. X.: 2004, Astrophys. J. 602, 200
- Izotov et al. (1994) Izotov, Y. I., Thuan, T. X., and Lipovetsky, V. A.: 1994, Astrophys. J. 435, 647 (ITL94)
- Izotov et al. (1997b) Izotov, Y. I., Thuan, T. X., and Lipovetsky, V. A.: 1997b, Astrophys. J., Suppl. Ser. 108, 1 (ITL97)
- Jamet et al. (2005) Jamet, L., Stasińska, G., Pérez, E., González-Delgado, R. M., and Vílchez, J. M.: 2005, Astron. Astrophys. 444, 723
- Jarrett et al. (2003) Jarrett, T. H., Chester, T., Cutri, R., Schneider, S. E., and Huchra, J. P.: 2003, Astron. J. 125, 525
- Jiménez-Benito et al. (2000) Jiménez-Benito, L., Díaz, A. I., Terlevich, R., and Terlevich, E.: 2000, Mon. Not. R. Astron. Soc. 317, 907
- Jogee et al. (2005) Jogee, S., Scoville, N., and Kenney, J. D. P.: 2005, Astrophys. J. 630, 837
- Kauffmann et al. (2003) Kauffmann, G., Heckman, T. M., Tremonti, C., Brinchmann, J., Charlot, S., White, S. D. M., Ridgway, S. E., Brinkmann, J., Fukugita, M., Hall, P. B., Ivezić, Ž., Richards, G. T., and Schneider, D. P.: 2003, Mon. Not. R. Astron. Soc. 346, 1055
- Kenney et al. (1992) Kenney, J. D. P., Wilson, C. D., Scoville, N. Z., Devereux, N. A., and Young, J. S.: 1992, Astrophys. J. Letters 395, L79
- Kennicutt et al. (2003) Kennicutt, R. C., Bresolin, F., and Garnett, D. R.: 2003, Astrophys. J. 591, 801(KBG03)
- Kennicutt (1989) Kennicutt, Jr., R. C.: 1989, Astrophys. J. 344, 685
- Kennicutt (1992) Kennicutt, Jr., R. C.: 1992, Astrophys. J., Suppl. Ser. 79, 255
- Kennicutt (1998a) Kennicutt, Jr., R. C.: 1998a, Ann. Rev. Astron. Astrophys. 36, 189
- Kennicutt (1998b) Kennicutt, Jr., R. C.: 1998b, Astrophys. J. 498, 541
- Kennicutt and Garnett (1996) Kennicutt, Jr., R. C. and Garnett, D. R.: 1996, Astrophys. J. 456, 504
- Kennicutt et al. (1989) Kennicutt, Jr., R. C., Keel, W. C., and Blaha, C. A.: 1989, Astron. J. 97, 1022
- Kennicutt et al. (1987) Kennicutt, Jr., R. C., Roettiger, K. A., Keel, W. C., van der Hulst, J. M., and Hummel, E.: 1987, Astron. J. 93, 1011
- Kewley et al. (2001) Kewley, L. J., Dopita, M. A., Sutherland, R. S., Heisler, C. A., and Trevena, J.: 2001, Astrophys. J. 556, 121
- Kewley and Ellison (2008) Kewley, L. J. and Ellison, S. L.: 2008, ArXiv e-prints 801
- Kingdon and Ferland (1995) Kingdon, J. and Ferland, G. J.: 1995, Astrophys. J. 442, 714
- Knapen et al. (1992) Knapen, J. H., Beckman, J. E., Cepa, J., van der Hulst, T., and Rand, R. J.: 1992, Astrophys. J. Letters 385, L37
- Kniazev et al. (2003) Kniazev, A. Y., Grebel, E. K., Hao, L., Strauss, M. A., Brinkmann, J., and Fukugita, M.: 2003, Astrophys. J. Letters 593, L73
- Kniazev et al. (2004) Kniazev, A. Y., Pustilnik, S. A., Grebel, E. K., Lee, H., and Pramskij, A. G.: 2004, Astrophys. J., Suppl. Ser. 153, 429
- Kobulnicky et al. (1999) Kobulnicky, H. A., Kennicutt, Jr., R. C., and Pizagno, J. L.: 1999, Astrophys. J. 514, 544
- Koo et al. (1994) Koo, D. C., Bershady, M. A., Wirth, G. D., Stanford, S. A., and Majewski, S. R.: 1994, Astrophys. J. Letters 427, L9
- Koo et al. (1995) Koo, D. C., Guzmán, R., Faber, S. M., Illingworth, G. D., Bershady, M. A., Kron, R. G., and Takamiya, M.: 1995, Astrophys. J. Letters 440, L49
- Kouwenhoven and de Grijs (2007) Kouwenhoven, M. B. N. and de Grijs, R.: 2007, astro-ph/0710.1207
- Kregel and Sancisi (2001) Kregel, M. and Sancisi, R.: 2001, Astron. Astrophys. 376, 59
- Kroupa (2002) Kroupa, P.: 2002, Science 295, 82
- Kunth and Östlin (2000) Kunth, D. and Östlin, G.: 2000, Astron. Astrophys. Rev 10, 1
- Kunth and Sargent (1983) Kunth, D. and Sargent, W. L. W.: 1983, Astrophys. J. 273, 81
- Kurtz and Mink (1998) Kurtz, M. J. and Mink, D. J.: 1998, Publ. Astron. Soc. Pac. 110, 934
- Lamareille et al. (2004) Lamareille, F., Mouhcine, M., Contini, T., Lewis, I., and Maddox, S.: 2004, Mon. Not. R. Astron. Soc. 350, 396
- Larsen et al. (2001) Larsen, S. S., Brodie, J. P., Elmegreen, B. G., Efremov, Y. N., Hodge, P. W., and Richtler, T.: 2001, Astrophys. J. 556, 801
- Larsen et al. (2004) Larsen, S. S., Brodie, J. P., and Hunter, D. A.: 2004, Astron. J. 128, 2295
- Larson and Tinsley (1978) Larson, R. B. and Tinsley, B. M.: 1978, Astrophys. J. 219, 46
- Lee et al. (2004) Lee, J. C., Salzer, J. J., and Melbourne, J.: 2004, Astrophys. J. 616, 752 (L04)
- Leitherer and Heckman (1995) Leitherer, C. and Heckman, T. M.: 1995, Astrophys. J., Suppl. Ser. 96, 9
- Leitherer et al. (1992) Leitherer, C., Robert, C., and Drissen, L.: 1992, Astrophys. J. 401, 596
- Leitherer et al. (1999) Leitherer, C., Schaerer, D., Goldader, J. D., Delgado, R. M. G., Robert, C., Kune, D. F., de Mello, D. F., Devost, D., and Heckman, T. M.: 1999, Astrophys. J., Suppl. Ser. 123, 3
- Lennon and Burke (1994) Lennon, D. J. and Burke, V. M.: 1994, Astron. and Astrophys. Suppl. Sries 103, 273
- Liu and Kennicutt (1995) Liu, C. T. and Kennicutt, Jr., R. C.: 1995, Astrophys. J. 450, 547
- Liu (2006) Liu, X.-W.: 2006, in M. J. Barlow and R. H. Méndez (eds.), Planetary Nebulae in our Galaxy and Beyond, Vol. 234 of IAU Symposium, pp 219–226
- Liu et al. (2006) Liu, X.-W., Barlow, M. J., Zhang, Y., Bastin, R. J., and Storey, P. J.: 2006, Mon. Not. R. Astron. Soc. 368, 1959
- Liu et al. (2001) Liu, X.-W., Luo, S.-G., Barlow, M. J., Danziger, I. J., and Storey, P. J.: 2001, Mon. Not. R. Astron. Soc. 327, 141
- Liu et al. (2000) Liu, X.-W., Storey, P. J., Barlow, M. J., Danziger, I. J., Cohen, M., and Bryce, M.: 2000, Mon. Not. R. Astron. Soc. 312, 585
- López (2005a) López, J.: 2005a, MSc Thesis, INAOE
- López (2005b) López, J.: 2005b, MSc Thesis, INAOE
- Luridiana et al. (2003) Luridiana, V., Peimbert, A., Peimbert, M., and Cerviño, M.: 2003, Astrophys. J. 592, 846
- Luridiana et al. (1999) Luridiana, V., Peimbert, M., and Leitherer, C.: 1999, Astrophys. J. 527, 110
- Macchetto et al. (1990) Macchetto, F., Colina, L., Golombek, D., Perryman, M. A. C., and di Serego Alighieri, S.: 1990, Astrophys. J. 356, 389
- Maoz et al. (2001) Maoz, D., Barth, A. J., Ho, L. C., Sternberg, A., and Filippenko, A. V.: 2001, Astron. J. 121, 3048
- Maoz et al. (1996) Maoz, D., Barth, A. J., Sternberg, A., Filippenko, A. V., Ho, L. C., Macchetto, F. D., Rix, H.-W., and Schneider, D. P.: 1996, Astron. J. 111, 2248
- Marconi et al. (2006) Marconi, A., Pastorini, G., Pacini, F., Axon, D. J., Capetti, A., Macchetto, D., Koekemoer, A. M., and Schreier, E. J.: 2006, Astron. Astrophys. 448, 921
- Mas-Hesse and Kunth (1991) Mas-Hesse, J. M. and Kunth, D.: 1991, Astron. and Astrophys. Suppl. Sries 88, 399
- Mas-Hesse et al. (2003) Mas-Hesse, J. M., Kunth, D., Tenorio-Tagle, G., Leitherer, C., Terlevich, R. J., and Terlevich, E.: 2003, Astrophys. J. 598, 858
- Mateus et al. (2007) Mateus, A., Sodré, L., Cid Fernandes, R., and Stasińska, G.: 2007, Mon. Not. R. Astron. Soc. 374, 1457
- Mateus et al. (2006) Mateus, A., Sodré, L., Cid Fernandes, R., Stasińska, G., Schoenell, W., and Gomes, J. M.: 2006, Mon. Not. R. Astron. Soc. 370, 721
- McCall and Schmidt (1986) McCall, M. L. and Schmidt, F. H.: 1986, Astrophys. J. 311, 548
- McCrady et al. (2003) McCrady, N., Gilbert, A. M., and Graham, J. R.: 2003, Astrophys. J. 596, 240
- McCrady and Graham (2007) McCrady, N. and Graham, J. R.: 2007, Astrophys. J. 663, 844
- McGaugh (1991) McGaugh, S. S.: 1991, Astrophys. J. 380, 140
- Melbourne et al. (2004) Melbourne, J., Phillips, A., Salzer, J. J., Gronwall, C., and Sarajedini, V. L.: 2004, Astron. J. 127, 686 (M04)
- Melnick et al. (1999) Melnick, J., Tenorio-Tagle, G., and Terlevich, R.: 1999, Mon. Not. R. Astron. Soc. 302, 677
- Melnick et al. (1985a) Melnick, J., Terlevich, R., and Eggleton, P. P.: 1985a, Mon. Not. R. Astron. Soc. 216, 255
- Melnick et al. (1985b) Melnick, J., Terlevich, R., and Moles, M.: 1985b, Revista Mexicana de Astronomia y Astrofisica 11, 91
- Melnick et al. (1988) Melnick, J., Terlevich, R., and Moles, M.: 1988, Mon. Not. R. Astron. Soc. 235, 297
- Melnick et al. (2000) Melnick, J., Terlevich, R., and Terlevich, E.: 2000, Mon. Not. R. Astron. Soc. 311
- Mengel et al. (2005) Mengel, S., Lehnert, M. D., Thatte, N., and Genzel, R.: 2005, Astron. Astrophys. 443, 41
- Mengel et al. (2008) Mengel, S., Lehnert, M. D., Thatte, N. A., Vacca, W. D., Whitmore, B., and Chandar, R.: 2008, ArXiv e-prints 805
- Meurer et al. (1995) Meurer, G. R., Heckman, T. M., Leitherer, C., Kinney, A., Robert, C., and Garnett, D. R.: 1995, Astron. J. 110, 2665
- Meynet et al. (1994) Meynet, G., Maeder, A., Schaller, G., Schaerer, D., and Charbonnel, C.: 1994, Astron. and Astrophys. Suppl. Sries 103, 97
- Miller et al. (1997) Miller, B. W., Whitmore, B. C., Schweizer, F., and Fall, S. M.: 1997, Astron. J. 114, 2381
- Miller and Mathews (1972) Miller, J. S. and Mathews, W. G.: 1972, Astrophys. J. 172, 593
- Mollá et al. (2006) Mollá, M., Vílchez, J. M., Gavilán, M., and Díaz, A. I.: 2006, Mon. Not. R. Astron. Soc. 372, 1069
- Morgan (1958) Morgan, W. W.: 1958, Publ. Astron. Soc. Pac. 70, 364
- Morisset et al. (2004) Morisset, C., Schaerer, D., Bouret, J.-C., and Martins, F.: 2004, Astron. Astrophys. 415, 577
- Mould et al. (2000) Mould, J. R., Huchra, J. P., Freedman, W. L., Kennicutt, Jr., R. C., Ferrarese, L., Ford, H. C., Gibson, B. K., Graham, J. A., Hughes, S. M. G., Illingworth, G. D., Kelson, D. D., Macri, L. M., Madore, B. F., Sakai, S., Sebo, K. M., Silbermann, N. A., and Stetson, P. B.: 2000, Astrophys. J. 529, 786
- Mulder and van Driel (1996) Mulder, P. S. and van Driel, W.: 1996, Astron. Astrophys. 309, 403
- Mulder et al. (1995) Mulder, P. S., van Driel, W., and Braine, J.: 1995, Astron. Astrophys. 300, 687
- Nagao et al. (2006) Nagao, T., Maiolino, R., and Marconi, A.: 2006, Astron. Astrophys. 459, 85
- Nelson and Whittle (1995) Nelson, C. H. and Whittle, M.: 1995, Astrophys. J., Suppl. Ser. 99, 67
- Noeske et al. (2005) Noeske, K. G., Papaderos, P., Cairós, L. M., and Fricke, K. J.: 2005, Astron. Astrophys. 429, 115
- Oke (1990) Oke, J. B.: 1990, Astron. J. 99, 1621
- Oke and Gunn (1983) Oke, J. B. and Gunn, J. E.: 1983, Astrophys. J. 266, 713
- Olive and Skillman (2001) Olive, K. A. and Skillman, E. D.: 2001, New Astronomy 6, 119
- Olive and Skillman (2004) Olive, K. A. and Skillman, E. D.: 2004, Astrophys. J. 617, 29
- Origlia et al. (2001) Origlia, L., Leitherer, C., Aloisi, A., Greggio, L., and Tosi, M.: 2001, Astron. J. 122, 815
- Origlia et al. (2004) Origlia, L., Ranalli, P., Comastri, A., and Maiolino, R.: 2004, Astrophys. J. 606, 862
- Osterbrock (1989) Osterbrock, D. E.: 1989, Astrophysics of gaseous nebulae and active galactic nuclei, Mill Valley, CA, University Science Books
- Osterbrock et al. (1996) Osterbrock, D. E., Fulbright, J. P., Martel, A. R., Keane, M. J., Trager, S. C., and Basri, G.: 1996, Publ. Astron. Soc. Pac. 108, 277
- Östlin et al. (2004) Östlin, G., Cumming, R. J., Amram, P., Bergvall, N., Kunth, D., Márquez, I., Masegosa, J., and Zackrisson, E.: 2004, Astron. Astrophys. 419, L43
- Pagel et al. (1979) Pagel, B. E. J., Edmunds, M. G., Blackwell, D. E., Chun, M. S., and Smith, G.: 1979, Mon. Not. R. Astron. Soc. 189, 95
- Pagel et al. (1992) Pagel, B. E. J., Simonson, E. A., Terlevich, R. J., and Edmunds, M. G.: 1992, Mon. Not. R. Astron. Soc. 255, 325
- Palacios et al. (1997) Palacios, J., García-Vargas, M. L., Díaz, A., Terlevich, R., and Terlevich, E.: 1997, Astron. Astrophys. 323, 749
- Pasquali and Castangia (2008) Pasquali, A. and Castangia, P.: 2008, Mon. Not. R. Astron. Soc. 385, 468
- Pastorini et al. (2007) Pastorini, G., Marconi, A., Capetti, A., Axon, D. J., Alonso-Herrero, A., Atkinson, J., Batcheldor, D., Carollo, C. M., Collett, J., Dressel, L., Hughes, M. A., Macchetto, D., Maciejewski, W., Sparks, W., and van der Marel, R.: 2007, Astron. Astrophys. 469, 405
- Pastoriza et al. (1993) Pastoriza, M. G., Dottori, H. A., Terlevich, E., Terlevich, R., and Diaz, A. I.: 1993, Mon. Not. R. Astron. Soc. 260, 177
- Pauldrach et al. (2001) Pauldrach, A. W. A., Hoffmann, T. L., and Lennon, M.: 2001, Astron. Astrophys. 375, 161
- Peimbert (2003) Peimbert, A.: 2003, Astrophys. J. 584, 735
- Peimbert et al. (2002) Peimbert, A., Peimbert, M., and Luridiana, V.: 2002, Astrophys. J. 565, 668
- Peimbert et al. (2005) Peimbert, A., Peimbert, M., and Ruiz, M. T.: 2005, Astrophys. J. 634, 1056
- Peimbert (1967) Peimbert, M.: 1967, Astrophys. J. 150, 825
- Peimbert (1971) Peimbert, M.: 1971, Boletin de los Observatorios Tonantzintla y Tacubaya 6, 29
- Peimbert and Costero (1969) Peimbert, M. and Costero, R.: 1969, Boletin de los Observatorios Tonantzintla y Tacubaya 5, 3
- Peimbert and Peimbert (2003) Peimbert, M. and Peimbert, A.: 2003, in Revista Mexicana de Astronomia y Astrofisica Conference Series, Vol. 16, pp 113–116
- Peimbert and Peimbert (2006) Peimbert, M. and Peimbert, A.: 2006, in M. J. Barlow and R. H. Méndez (eds.), Planetary Nebulae in our Galaxy and Beyond, Vol. 234 of IAU Symposium, pp 227–234
- Peimbert et al. (2007) Peimbert, M., Peimbert, A., Esteban, C., García-Rojas, J., Bresolin, F., Carigi, L., Ruiz, M. T., and López-Sánchez, A. R.: 2007, in Revista Mexicana de Astronomia y Astrofisica Conference Series, Vol. 29 of Revista Mexicana de Astronomia y Astrofisica Conference Series, pp 72–79
- Peimbert et al. (2000) Peimbert, M., Peimbert, A., and Ruiz, M. T.: 2000, Astrophys. J. 541, 688
- Peimbert et al. (2004) Peimbert, M., Peimbert, A., Ruiz, M. T., and Esteban, C.: 2004, Astrophys. J., Suppl. Ser. 150, 431
- Peimbert and Torres-Peimbert (1992) Peimbert, M. and Torres-Peimbert, S.: 1992, Astron. Astrophys. 253, 349
- Pérez et al. (2000) Pérez, E., Márquez, I., Marrero, I., Durret, F., González Delgado, R. M., Masegosa, J., Maza, J., and Moles, M.: 2000, Astron. Astrophys. 353, 893
- Pérez-Montero and Díaz (2003) Pérez-Montero, E. and Díaz, A. I.: 2003, Mon. Not. R. Astron. Soc. 346, 105 (PMD03)
- Pérez-Montero and Díaz (2005) Pérez-Montero, E. and Díaz, A. I.: 2005, Mon. Not. R. Astron. Soc. 361, 1063
- Pérez-Montero and Díaz (2007) Pérez-Montero, E. and Díaz, A. I.: 2007, Mon. Not. R. Astron. Soc. 377, 1195
- Pérez-Montero et al. (2006) Pérez-Montero, E., Díaz, A. I., Vílchez, J. M., and Kehrig, C.: 2006, Astron. Astrophys. 449, 193
- Pérez-Montero et al. (2007) Pérez-Montero, E., Hägele, G. F., Contini, T., and Díaz, Á. I.: 2007, Mon. Not. R. Astron. Soc. 381, 125
- Pérez-Olea (1996) Pérez-Olea, D.: 1996, PhD Thesis, Universidad Autónoma de Madrid
- Pettini et al. (2001) Pettini, M., Shapley, A. E., Steidel, C. C., Cuby, J.-G., Dickinson, M., Moorwood, A. F. M., Adelberger, K. L., and Giavalisco, M.: 2001, Astrophys. J. 554, 981
- Pettini et al. (2000) Pettini, M., Steidel, C. C., Adelberger, K. L., Dickinson, M., and Giavalisco, M.: 2000, Astrophys. J. 528, 96
- Phillips et al. (1984) Phillips, M. M., Pagel, B. E. J., Edmunds, M. G., and Díaz, A.: 1984, Mon. Not. R. Astron. Soc. 210, 701
- Pilyugin (2000) Pilyugin, L. S.: 2000, Astron. Astrophys. 362, 325
- Pilyugin (2007) Pilyugin, L. S.: 2007, Mon. Not. R. Astron. Soc. 375, 685
- Pilyugin et al. (2006) Pilyugin, L. S., Thuan, T. X., and Vílchez, J. M.: 2006, Mon. Not. R. Astron. Soc. 367, 1139
- Pilyugin et al. (2004) Pilyugin, L. S., Vílchez, J. M., and Contini, T.: 2004, Astron. Astrophys. 425, 849
- Piner et al. (1995) Piner, B. G., Stone, J. M., and Teuben, P. J.: 1995, Astrophys. J. 449, 508
- Pizzella et al. (2004) Pizzella, A., Corsini, E. M., Vega Beltrán, J. C., and Bertola, F.: 2004, Astron. Astrophys. 424, 447
- Planesas et al. (1997) Planesas, P., Colina, L., and Pérez-Olea, D.: 1997, Astron. Astrophys. 325, 81
- Popescu and Hopp (2000) Popescu, C. C. and Hopp, U.: 2000, Astron. and Astrophys. Suppl. Sries 142, 247
- Porter et al. (2005) Porter, R. L., Bauman, R. P., Ferland, G. J., and MacAdam, K. B.: 2005, Astrophys. J. Letters 622, L73
- Prada et al. (1994) Prada, F., Greve, A., and McKeith, C. D.: 1994, Astron. Astrophys. 288, 396
- Pradhan (1976) Pradhan, A. K.: 1976, Mon. Not. R. Astron. Soc. 177, 31
- Puxley et al. (1990) Puxley, P. J., Hawarden, T. G., and Mountain, C. M.: 1990, Astrophys. J. 364, 77
- Ramsbottom et al. (1996) Ramsbottom, C. A., Bell, K. L., and Stafford, R. P.: 1996, Atomic Data and Nuclear Data Tables 63, 57
- Rieke and Lebofsky (1978) Rieke, G. H. and Lebofsky, M. J.: 1978, Astrophys. J. Letters 220, L37
- Rieke et al. (1993) Rieke, G. H., Loken, K., Rieke, M. J., and Tamblyn, P.: 1993, Astrophys. J. 412, 99
- Rieke and Low (1972) Rieke, G. H. and Low, F. J.: 1972, Astrophys. J. Letters 176, L95+
- Roberts et al. (1979) Roberts, Jr., W. W., Huntley, J. M., and van Albada, G. D.: 1979, Astrophys. J. 233, 67
- Rodríguez and Rubin (2004) Rodríguez, M. and Rubin, R. H.: 2004, in IAU Symp. 217, Recycling Intergallactic and Interstellar Matter, ed. P. A. Duc, J. Braine, and E. Brinks (San Francisco: ASP), pp 188–+ (astro–ph/0312246)
- Rola et al. (1997) Rola, C. S., Terlevich, E., and Terlevich, R. J.: 1997, Mon. Not. R. Astron. Soc. 289, 419
- Rosa-González et al. (2007) Rosa-González, D., Schmitt, H. R., Terlevich, E., and Terlevich, R.: 2007, Astrophys. J. 654, 226
- Rubin et al. (2002) Rubin, R. H., Bhatt, N. J., Dufour, R. J., Buckalew, B. A., Barlow, M. J., Liu, X.-W., Storey, P. J., Balick, B., Ferland, G. J., Harrington, J. P., and Martin, P. G.: 2002, Mon. Not. R. Astron. Soc. 334, 777
- Rubin et al. (1975) Rubin, V. C., Peterson, C. J., and Ford, Jr., W. K.: 1975, Astrophys. J. 199, 39
- Ruiz et al. (2003) Ruiz, M. T., Peimbert, A., Peimbert, M., and Esteban, C.: 2003, Astrophys. J. 595, 247
- Sakamoto et al. (1999) Sakamoto, K., Okumura, S. K., Ishizuki, S., and Scoville, N. Z.: 1999, Astrophys. J. 525, 691
- Salpeter (1955) Salpeter, E. E.: 1955, Astrophys. J. 121, 161
- Sánchez-Portal et al. (2000) Sánchez-Portal, M., Díaz, Á. I., Terlevich, R., Terlevich, E., Álvarez Álvarez, M., and Aretxaga, I.: 2000, Mon. Not. R. Astron. Soc. 312, 2
- Sargent (1970) Sargent, W. L. W.: 1970, Astrophys. J. 160, 405
- Sargent and Searle (1970) Sargent, W. L. W. and Searle, L.: 1970, Astrophys. J. Letters 162, L155+
- Schulte-Ladbeck et al. (1998) Schulte-Ladbeck, R. E., Crone, M. M., and Hopp, U.: 1998, Astrophys. J. Letters 493, L23+
- Searle and Sargent (1972) Searle, L. and Sargent, W. L. W.: 1972, Astrophys. J. 173, 25
- Searle et al. (1973) Searle, L., Sargent, W. L. W., and Bagnuolo, W. G.: 1973, Astrophys. J. 179, 427
- Sérsic and Pastoriza (1965) Sérsic, J. L. and Pastoriza, M.: 1965, Publ. Astron. Soc. Pac. 77, 287
- Sérsic and Pastoriza (1967) Sérsic, J. L. and Pastoriza, M.: 1967, Publ. Astron. Soc. Pac. 79, 152
- Shaw and Dufour (1995) Shaw, R. A. and Dufour, R. J.: 1995, Publ. Astron. Soc. Pac. 107, 896
- Sheth et al. (2005) Sheth, K., Vogel, S. N., Regan, M. W., Thornley, M. D., and Teuben, P. J.: 2005, Astrophys. J. 632, 217
- Shields and Kennicutt (1995) Shields, J. C. and Kennicutt, Jr., R. C.: 1995, Astrophys. J. 454, 807
- Siegel et al. (2005) Siegel, E. R., Guzmán, R., Gallego, J. P., Orduña López, M., and Rodríguez-Hidalgo, P.: 2005, Mon. Not. R. Astron. Soc. 356, 1117
- Skillman and Kennicutt (1993) Skillman, E. D. and Kennicutt, Jr., R. C.: 1993, Astrophys. J. 411, 655 (SK93)
- Skillman et al. (1994) Skillman, E. D., Televich, R. J., Kennicutt, Jr., R. C., Garnett, D. R., and Terlevich, E.: 1994, Astrophys. J. 431, 172 (S94)
- Smith et al. (2005) Smith, B. J., Struck, C., Appleton, P. N., Charmandaris, V., Reach, W., and Eitter, J. J.: 2005, Astron. J. 130, 2117
- Smith et al. (1996) Smith, D. A., Neff, S. G., Bothun, G. D., Fanelli, M. N., Offenberg, J. D., Waller, W. H., Bohlin, R. C., O’Connell, R. W., Roberts, M. S., Smith, A. M., and Stecher, T. P.: 1996, Astrophys. J. Letters 473, L21+
- Smith et al. (2002) Smith, L. J., Norris, R. P. F., and Crowther, P. A.: 2002, Mon. Not. R. Astron. Soc. 337, 1309
- Stasińska and Izotov (2003) Stasińska, G. and Izotov, Y.: 2003, Astron. Astrophys. 397, 71
- Stasińska (1978) Stasińska, G.: 1978, Astron. Astrophys. 66, 257
- Stasińska (1980) Stasińska, G.: 1980, Astron. Astrophys. 84, 320
- Stasińska (1990) Stasińska, G.: 1990, Astron. and Astrophys. Suppl. Sries 83, 501
- Stasińska (2005) Stasińska, G.: 2005, Astron. Astrophys. 434, 507
- Stasińska (2006) Stasińska, G.: 2006, Astron. Astrophys. 454, L127
- Stasińska and Leitherer (1996) Stasińska, G. and Leitherer, C.: 1996, Astrophys. J., Suppl. Ser. 107, 661
- Stauffer (1982) Stauffer, J. R.: 1982, Astrophys. J., Suppl. Ser. 50, 517
- Storey and Hummer (1995) Storey, P. J. and Hummer, D. G.: 1995, Mon. Not. R. Astron. Soc. 272, 41
- Stoughton and et al. (2002) Stoughton, C. and et al.: 2002, Astron. J. 123, 485
- Swartz et al. (2006) Swartz, D. A., Yukita, M., Tennant, A. F., Soria, R., and Ghosh, K. K.: 2006, Astrophys. J. 647, 1030
- Tayal and Gupta (1999) Tayal, S. S. and Gupta, G. P.: 1999, Astrophys. J. 526, 544
- Telesco (1988) Telesco, C. M.: 1988, Ann. Rev. Astron. Astrophys. 26, 343
- Telesco and Decher (1988) Telesco, C. M. and Decher, R.: 1988, Astrophys. J. 334, 573
- Telesco and Gatley (1984) Telesco, C. M. and Gatley, I.: 1984, Astrophys. J. 284, 557
- Telesco and Harper (1980) Telesco, C. M. and Harper, D. A.: 1980, Astrophys. J. 235, 392
- Telles et al. (1997) Telles, E., Melnick, J., and Terlevich, R.: 1997, Mon. Not. R. Astron. Soc. 288, 78
- Temporin et al. (2003) Temporin, S., Ciroi, S., Rafanelli, P., Radovich, M., Vennik, J., Richter, G. M., and Birkle, K.: 2003, Astrophys. J., Suppl. Ser. 148, 353
- Terlevich et al. (1990) Terlevich, E., Terlevich, R., Díaz, A. I., Pastoriza, M. G., and Dottori, H.: 1990, Mon. Not. R. Astron. Soc. 242, 48P
- Terlevich et al. (2003) Terlevich, E., Terlevich, R., and Melnick, J.: 2003, in J. M. Rodriguez-Espinoza, F. Garzon Lopez, and V. Melo Martin (eds.), Revista Mexicana de Astronomia y Astrofisica Conference Series, pp 213–215
- Terlevich et al. (1991) Terlevich, R., Melnick, J., Masegosa, J., Moles, M., and Copetti, M. V. F.: 1991, Astron. and Astrophys. Suppl. Sries 91, 285 (T91)
- Thronson and Greenhouse (1988) Thronson, Jr., H. A. and Greenhouse, M. A.: 1988, Astrophys. J. 327, 671
- Tinsley (1968) Tinsley, B. M.: 1968, Astrophys. J. 151, 547
- Tinsley (1972) Tinsley, B. M.: 1972, Astron. Astrophys. 20, 383
- Tonry and Davis (1979) Tonry, J. and Davis, M.: 1979, Astron. J. 84, 1511
- Trancho et al. (2007) Trancho, G., Bastian, N., Miller, B. W., and Schweizer, F.: 2007, Astrophys. J. 664, 284
- Tsamis et al. (2003) Tsamis, Y. G., Barlow, M. J., Liu, X.-W., Danziger, I. J., and Storey, P. J.: 2003, Mon. Not. R. Astron. Soc. 338, 687
- Tsamis and Péquignot (2005) Tsamis, Y. G. and Péquignot, D.: 2005, Mon. Not. R. Astron. Soc. 364, 687
- Ugryumov et al. (2003) Ugryumov, A. V., Engels, D., Pustilnik, S. A., Kniazev, A. Y., Pramskij, A. G., and Hagen, H.-J.: 2003, Astron. Astrophys. 397, 463
- van der Kruit (1976) van der Kruit, P. C.: 1976, Astron. Astrophys. 49, 161
- van der Kruit and de Bruyn (1976) van der Kruit, P. C. and de Bruyn, A. G.: 1976, Astron. Astrophys. 48, 373
- van Zee (2000) van Zee, L.: 2000, Astrophys. J. Letters 543, L31
- Vázquez and Leitherer (2005) Vázquez, G. A. and Leitherer, C.: 2005, Astrophys. J. 621, 695
- Vermeij and van der Hulst (2002) Vermeij, R. and van der Hulst, J. M.: 2002, Astron. Astrophys. 391, 1081
- Vílchez et al. (1988) Vílchez, J. M., Pagel, B. E. J., Díaz, A. I., Terlevich, E., and Edmunds, M. G.: 1988, Mon. Not. R. Astron. Soc. 235, 633
- Vila-Costas and Edmunds (1992) Vila-Costas, M. B. and Edmunds, M. G.: 1992, Mon. Not. R. Astron. Soc. 259, 121
- Vílchez and Esteban (1996) Vílchez, J. M. and Esteban, C.: 1996, Mon. Not. R. Astron. Soc. 280, 720
- Vílchez and Pagel (1988) Vílchez, J. M. and Pagel, B. E. J.: 1988, Mon. Not. R. Astron. Soc. 231, 257
- Wang et al. (2004) Wang, W., Liu, X.-W., Zhang, Y., and Barlow, M. J.: 2004, Astron. Astrophys. 427, 873
- Weaver and Woosley (1993) Weaver, T. A. and Woosley, S. E.: 1993, Phys. Rep. 227, 65
- Wesson et al. (2005) Wesson, R., Liu, X.-W., and Barlow, M. J.: 2005, Mon. Not. R. Astron. Soc. 362, 424
- Whitmore and Schweizer (1995) Whitmore, B. C. and Schweizer, F.: 1995, Astron. J. 109, 960
- Whitmore et al. (1993) Whitmore, B. C., Schweizer, F., Leitherer, C., Borne, K., and Robert, C.: 1993, Astron. J. 106, 1354
- Whitmore et al. (1999) Whitmore, B. C., Zhang, Q., Leitherer, C., Fall, S. M., Schweizer, F., and Miller, B. W.: 1999, Astron. J. 118, 1551
- Woods and Geller (2007) Woods, D. F. and Geller, M. J.: 2007, Astron. J. 134, 527
- Woods et al. (2006) Woods, D. F., Geller, M. J., and Barton, E. J.: 2006, Astron. J. 132, 197
- Xu and Sulentic (1991) Xu, C. and Sulentic, J. W.: 1991, Astrophys. J. 374, 407
- Zaritsky et al. (1994) Zaritsky, D., Kennicutt, Jr., R. C., and Huchra, J. P.: 1994, Astrophys. J. 420, 87
- Zeippen (1982) Zeippen, C. J.: 1982, Mon. Not. R. Astron. Soc. 198, 111
- Zeippen et al. (1987) Zeippen, C. J., Le Bourlot, J., and Butler, K.: 1987, Astron. Astrophys. 188, 251
- Zepf et al. (1999) Zepf, S. E., Ashman, K. M., English, J., Freeman, K. C., and Sharples, R. M.: 1999, Astron. J. 118, 752
- Zwicky (1966) Zwicky, F.: 1966, Astrophys. J. 143, 192
Chapter 6 Conclusiones
En este Capítulo resumimos las principales conclusiones de este trabajo.
En la presente tesis se presenta un estudio de procesos de formación estelar a gran escala en galaxias en dos entornos muy diferentes que pueden considerarse extremos en términos de contenido metálico: galaxias Hii relativamente compactas y regiones circunnucleares de formación estelar (CNSFRs) en galaxias espirales. Las galaxias Hii están entre los objetos más pobres en metales conocidos, mientras que se espera que las regiones circunnucleares de galaxias sean sitios de abundancias muy altas debido a su localización en la parte interna de los bulbos galácticos. Por lo tanto, aún cuando sus espectros de líneas de emisión som similares, ya que ambos corresponden a gas ionizado, muestran importantes diferencias. En el primer caso los espectros muestran alta excitación, estando dominados por fuertes líneas prohibidas de oxígeno; en el segundo, los espectros muestran una excitación considerablemente más baja, líneas débiles de oxígeno y líneas de nitrógeno y azufre más prominentes, cuando se comparan con gas de abundancia más baja. De hecho, para las galaxias Hii, [Oiii] 5007/H 4, y alcanza valores tan altos como 6 para los objetos en este estudio, mientras que las líneas de emisión de [Oiii] en CNSFRs son generalmente débiles ([Oiii] 5007/H 1).
Hemos analizado las propiedades físicas del gas en 10 galaxias Hii y en 12 CNSFRs de 3 galaxias espirales tempranas utilizando espectroscopía de resolución intermedia obtenida con espectrógrafos de doble brazo que proporcionan la mejor espectrofotometría alcanzable, ya que permite cubrir completamente el rango espectral desde 3600 a 10000 Å simultáneamente en la misma posición en el objeto. También hemos investigado las propiedades cinemáticas del gas y las estrellas en un total de 17 CNSFRs utilizando espectroscopía de alta dispersión. En algunos casos, hemos utilizado datos fotométricos complementarios obtenidos de bases de datos y de la literatura.
El primer conjunto de datos se ha utilizado para inferir las propiedades de las poblaciones estelares ionizantes, incluyendo las masas fotométricas de los cúmulos ionizantes, usando modelos de foto-ionización y de síntesis de poblaciones estelares. El segundo conjunto de datos ha sido utilizado principalmente para determinar las masas dinámicas de las CNSFRs, pero además ha aportado información muy interesante sobre la cinemática del gas en el entorno circunnuclear galáctico.
Los principales hallazgos de nuestro trabajo están resumidos a continuación.
Se encuentra que los procesos de formación estelar en galaxias Hii ocurren en ambientes de baja densidad. En todas las galaxias observadas, la densidad electrónica que hemos encontrado es menor que 150 cm, menor que la densidad crítica necesaria para la desexcitación colisional. En contraste, en las CNSFRs la densidad es relativamente alta, con valores típicos alrededor de 300 cm, y en algunos casos tan altos como 440 cm. Estos valores son mayores que los que se encuentran normalmente en regiones Hii de disco, aunque están todavía por debajo del valor crítico para la desexcitación colisional.
Para todas las galaxias Hii observadas hemos medido al menos cuatro temperaturas de línea: T([Oiii]), T([Siii]), T([Oii]) y T([Sii]) alcanzándose precisiones del 1 % en T([Oiii]), 3 % en T([Oii]) y 5 % en T([Siii]) en los mejores casos. Se espera que estas precisiones mejoren cuando se realicen mejores calibraciones basadas en medidas más precisas, tanto de temperaturas electrónicas como de densidades. Las temperaturas relacionadas con la zona de alta ionización están entre 11000 y 14500 K, y en la zona de baja ionización entre 9000 y 13500 K. Esto significa que los objetos observados son de excitación intermedia, en los que el enfriamiento esta dominado por las líneas prohibidas del oxígeno.
Para tres de las galaxias Hii de la muestra, hemos medido la temperatura del continuo del Balmer [T(Bac)] y estimado las fluctuaciones de temperatura de acuerdo con el esquema introducido por M. Peimbert. Sólo uno de los objetos muestra fluctuaciones de temperatura significativas que, si se tienen en cuenta, podrían conducir a abundancias de oxígeno alrededor de 0.20 dex mayores que las derivadas.
Las medidas de temperatura para las galaxias Hii observadas y un tratamiento cuidadoso y realista de los errores observacionales, conduce a abundancias totales de oxígeno entre 7.93 y 8.19 (Z/Z entre 0.19 y 0.34, utilizando 12+log(O/H) = 8.66 0.05 de [2005ASPC..336...25A]), con una precisión de entre 1 y 9 %. En comparación con una muestra mayor de galaxias Hii, las observadas muestran cocientes de abundancias de N/O mayores que el valor medio. Estos cocientes podrían ser aún mayores si se derivan las temperaturas de [Oii] utilizando los modelos de foto-ionización.
Para algunos elementos, como el azufre, neón y argón, la contribución de las diferentes especies ionizadas que no se ven puede ser una fuente de error apreciable en la determinación de las abundancias químicas. Utilizando una red de modelos de foto-ionización que hemos calculado, hemos derivado nuevos factores de corrección por ionización para el Ne y el Ar y hemos estudiado el comportamiento de los cocientes de abundancias Ne/O y Ar/O con la metalicidad para los objetos observados y para un conjunto heterogéneo de 853 objetos incluyendo galaxias Hii regiones Hii gigantes en discos galácticos y algunas regiones Hii en la Vía Láctea, pero excluyendo las CNSFRs. Se encuentra un valor constante para el cociente Ne/O que apunta a que ambos elementos se sinteticen en el mismo tipo de estrellas. Respecto al cociente S/O, la situación no es clara, ya que la muestra para la que existen los datos necesarios para su cálculo, es aún muy pequeña. Para los objetos estudiados en este trabajo, las cocientes de S/O derivados son consistentes con los solares dentro de los errores observacionales, excepto para SDSS J0021, SDSS J1455 y SDSS J1528 para los cuales S/O es menor por un factor de alrededor de 2.7 para el primero y 1.8 para los otros dos. Por otro lado, parece haber alguna evidencia de la existencia de un gradiente radial negativo del Ar/O sobre los discos de algunas espirales cercanas. El origen de este gradiente está por explorar.
La alta metalicidad promedio de las CNSFRs requiere una metodología diferente para la determinación de abundancias, involucrando calibradores empíricos. Hemos desarrollado un esquema para la determinación de abundancias utlizando las líneas del oxígeno y del azufre, siendo estas últimas mucho más intensas que las primeras en esta clase de objetos. El esquema propone la calibración de T([Siii]) en términos del parámetro SO, y su uso en combinación con las intensidades de las líneas observadas de los diferentes elementos para derivar las abundancias iónicas. ”A posteriori” se ha encontrado que este esquema produce resultados muy similares a los obtenidos por L. Pyliugin utilizando líneas de oxígeno y nitrógeno.
En todas las CNSFRs observadas, las T([Siii]) estimadas son sustancialmente menores que en las galaxias Hii, estando entre 5400 y 6700 K. Para una de las regiones observadas, la línea de emisión auroral de [Siii] 6312 Å fue detectada proporcionando una medida de la temperatura electrónica de T([Siii]) = 8400 K, consistente con nuestra calibración empírica, aunque ligeramente mayor que la predicha.
Las abundancias totales de oxígeno derivadas para nuestras regiones están entre 8.42 y 8.85 en términos de 12+log(O/H) (Z/Z entre 0.6 y 1.6). En contraste con el caso de las galaxias Hii para las cuales las abundancias de O/H están dominadas por O/H, en todas las CNSFRs, la abundancia de O/H está dominada por la contribución de O/H, como también es el caso para las regiones Hii de alta metalicidad. Para nuestras regiones circunnucleares, sin embargo, también el cociente de S/S es mayor que uno, a diferencia del caso de las regiones Hii de alta metalicidad de disco para las cuales, en general, las abundancias de azufre están dominadas por S/H.
Con respecto a los cocientes relativos de abundancias, para las CNSFRs, los cocientes de N/O derivados son, en promedio, mayores que los encontrados en las regiones Hii de alta metalicidad de disco y no parecen seguir la tendencia de N/O vs. O/H que marca el comportamiento secundario del nitrógeno. Los cocientes de S/O se distribuyen en un intervalo muy estrecho entre 0.6 y 0.8 del valor solar.
A pesar de las diferencias en los entornos donde tienen lugar los procesos de formación estelar en las galaxias Hii y en las CNSFRs, sus estructuras de ionización y las temperaturas de sus campos de radiación ionizantes, medidos a partir de sus valores de y ’, son muy similares, aunque muy diferentes de los de las regiones Hii de alta metalicidad de disco.
Teniendo en cuenta la distancia a nuestras galaxias Hii, medidas como parte del HST Key Project on the Extragalactic Distance Scale [2000ApJ...529..786Mtot], sus luminosidades H están en el rango entre 8.52 10 y 1.36 10 erg s, típico de esta clase de objetos [2006MNRAS.365..454H]. Este rango en luminosidades se superpone con los valores derivados para las CNSFRs, que van de 7.50 10 a 1.44 10 erg s, también típico de esta clase de objetos [tesismar]. A partir de estas luminosidades H, y utilizando la calibración dada por [1989ApJ...344..685K], encontramos tasas de formación estelar (SFRs) en el rango entre 0.007 y 10.7 M yr. En el caso de las CNSFRs estudiadas estos valores tienen un rango entre 0.006 y 0.11 M yr, superponiéndose claramente con los valores derivados para las galaxias Hii en su totalidad.
Hay una clara evidencia, tanto en las galaxias Hii como en las CNSFRs, de la presencia de poblaciones estelares compuestas: una población joven responsable de la ionización del medio gaseoso y una población subyacente, más vieja, responsable de las características de absorción fácilmente observables en las líneas del hidrógeno y, en algunos casos, en las del helio. La presencia de esta población más vieja reduce los anchos equivalentes de las líneas de emisión incrementando el continuo y absorbiendo algunas de las líneas. Este efecto es mayor en las CNSFRs. Más aún, la naturaleza compuesta de estas regiones significa que la formación estelar en los anillos es un proceso que ha tenido lugar durante periodos de tiempo mucho más largos que los que se deducen de las propiedades del gas ionizado.
Nuestras observaciones de alta disperisón nos han permitido medir los anchos de las líneas del gas y de las estrellas en CNSFRs en tres diferentes galaxias espirales: NGC 2903, NGC 3310 y NGC 3351. A partir de las líneas estelares de absorción del CaT en 8500 Å, hemos derivado las masas dinámicas de los cúmulos estelares, aplicando el teorema del virial y suponiendo que los sistemas son esféricamente simétricos, están ligados gravitatoriamente y tienen una distribución isotrópica de velocidades. Esto proporciona lḿites superiores para las masas dentro de los radios desde donde se emite la mitad de la luz (típicamente entre 3 y 5 pc) para cada nódulo observado. Utilizando las medidas de las dispersiones de velocidades estelares (31 - 66 km s) obtuvimos masas para los cúmulos individuales entre 1.4 10 y 1.1 10 M. Las masas dinámicas totales de las CNSFRs se toman como la “suma” de estos cúmulos estelares individuales y están entre 4.9 10 y 1.9 10 M.
Estas masas son alrededor de 10 veces más altas que las que se infieren a partir del número de fotones ionizantes que emergen de las regiones, utilizando modelos simples y robustos de poblaciones estelares, suponiendo que no hay pérdida de fotones y sin tener en consideración la absorción debida al polvo.
Un resultado inesperado a partir de nuestro estudio ha sido el hallazgo de la existencia de más de una componente en la velocidad del gas ionizado cuando se realizó un ajuste de componentes gausianas, tanto en las líneas de recombinación del hidrógeno como en las del [Oiii]. Una componente con una dispersión de velocidades sustancialmente menor que la medida a partir de las líneas estelares, está claramente presente en las líneas de recombinación de hidrógeno y también parece estar presente en las lńeas de [Oiii]. La componente estrecha de los ajustes de dos componentes gaussianas parece ser relativamente constante para todas las CNSFRs estudiadas, con un valor promedio estimado próximo a los 25 km s. Esta componente estrecha podría identificarse con el gas ionizado en un disco rotante, mientras que las estrellas y la fracción del gas (responsable de la componente ancha) relacionado con las regiones de formación estelar estarían principalmente soportadas por presión dinámica [2004A&A...424..447P].
El hecho de que las líneas de emisión muestren componentes de velocidad correspondientes a sistemas cinemáticamente distintos, podría afectar algo a los resultados derivados a partir de las observaciones descritas anteriormente, entre otras, a las determinaciones de las abundancias del gas. Además, las masas derivadas a partir de las dispersiones de velocidades de H bajo la suposición de una única componente para el gas podría haber sido subestimada por un factor entre 2 y 4 aproximadamente.
La curva de rotación de las zonas centrales de las galaxias espirales de tipo temprano estudiadas parecen tener máximos y mínimos relativos en la misma posición que los anillos de formación estelar, como se encuentra en otras galaxias [1988ApJ...334..573T, 1999ApJ...512..623D], y la distribución de velocidades es consistente con la esperada para este tipo de galaxias [1987gady.book.....B].
En resumen, se han identificado dos lugares de formación estelar que difieren ampliamente en su contenido de metales. Concluimos que la formación estelar ‘masiva’ que ocurre en un medio de alta densidad y alta metalicidad, como el que se encuentra en las CNSFRs, tiene lugar en sistemas que satisfacen la definición de super cúmulos estelares y que forman complejos de formación estelar mayores. Estos complejos tienen luminosidades H, y por lo tanto masas de estrellas ionizantes, que se superponen en el extremo inferior con las encontradas en las galaxias Hii. El hecho de que las estructuras de ionización y las temperaturas de los campos de radiación ionizantes de las galaxias Hii y de las CNSFRs sean muy similares, apunta a que sus cúmulos ionizantes tienen la misma temperatura equivalente efectiva. Esto es contrario a lo que se espera a partir de modelos de evolución estelar, que predicen temperaturas estelares efectivas más bajas en regiones de alta metalicidad. Este punto merece un más detallado estudio.
Las regiones de formación estelar en los dos entornos estudiados muestran una contribución proveniente de una población estelar subyacente. Esta contribución es mayor en las CNSFRs y también la población estelar misma parece ser más evolucionada, como evidencia la presencia de supergigantes rojas que contribuyen sustancialmente a las líneas del CaT. El hecho de que los valores de N/O sean mucho mayores en las CNSFRs que en las galaxias Hii y en otras regiones de alta metalicidad, también apunta a la posibilidad de un cierto grado de evolución química y autoenriquecimiento en estas regiones.
Bibliography
- Abazajian et al., 2004 Abazajian, K., Adelman-McCarthy, J. K., Agüeros, M. A., Allam, S. S., Anderson, K., Anderson, S. F., Annis, J., Bahcall, N. A., Baldry, I. K., Bastian, S., and 143 coauthors: 2004, Astron. J. 128, 502
- Abazajian et al., 2005 Abazajian, K., Adelman-McCarthy, J. K., Agüeros, M. A., Allam, S. S., Anderson, K. S. J., Anderson, S. F., Annis, J., Bahcall, N. A., Baldry, I. K., Bastian, S., and 144 coauthors: 2005, Astron. J. 129, 1755
- Adelman-McCarthy et al., 2008 Adelman-McCarthy, J. K., Agüeros, M. A., Allam, S. S., Allende Prieto, C., Anderson, K. S. J., Anderson, S. F., Annis, J., Bahcall, N. A., Bailer-Jones, C. A. L., Baldry, I. K., and 153 coauthors: 2008, Astrophys. J., Suppl. Ser. 175, 297
- Adelman-McCarthy et al., 2006 Adelman-McCarthy, J. K., Agüeros, M. A., Allam, S. S., Anderson, K. S. J., Anderson, S. F., Annis, J., Bahcall, N. A., Baldry, I. K., Barentine, J. C., Berlind, A., and 131 coauthors: 2006, Astrophys. J., Suppl. Ser. 162, 38
- Allende-Prieto et al., 2001 Allende-Prieto, C., Lambert, D. L., and Asplund, M.: 2001, Astrophys. J. Letters 556, L63
- Alloin et al., 1979 Alloin, D., Collin-Souffrin, S., Joly, M., and Vigroux, L.: 1979, Astron. Astrophys. 78, 200
- Alloin and Nieto, 1982 Alloin, D. and Nieto, J.-L.: 1982, Astron. and Astrophys. Suppl. Sries 50, 491
- Aloisi et al., 1999 Aloisi, A., Tosi, M., and Greggio, L.: 1999, Astron. J. 118, 302
- Alonso-Herrero et al., 2001a Alonso-Herrero, A., Engelbracht, C. W., Rieke, M. J., Rieke, G. H., and Quillen, A. C.: 2001a, Astrophys. J. 546, 952
- Alonso-Herrero et al., 2000 Alonso-Herrero, A., Rieke, G. H., Rieke, M. J., and Scoville, N. Z.: 2000, Astrophys. J. 532, 845
- Alonso-Herrero et al., 2001b Alonso-Herrero, A., Ryder, S. D., and Knapen, J. H.: 2001b, Mon. Not. R. Astron. Soc. 322, 757
- Álvarez-Álvarez, 2002 Álvarez-Álvarez, M.: 2002, PhD Thesis, Universidad Autónoma de Madrid
- Arp and Sandage, 1985 Arp, H. and Sandage, A.: 1985, Astron. J. 90, 1163
- Asari et al., 2007 Asari, N. V., Cid Fernandes, R., Stasińska, G., Torres-Papaqui, J. P., Mateus, A., Sodré, L., Schoenell, W., and Gomes, J. M.: 2007, Mon. Not. R. Astron. Soc. 381, 263
- Asplund et al., 2005 Asplund, M., Grevesse, N., and Sauval, A. J.: 2005, in T. G. Barnes, III and F. N. Bash (eds.), Cosmic Abundances as Records of Stellar Evolution and Nucleosynthesis, Vol. 336 of Astronomical Society of the Pacific Conference Series, pp 25–+
- Athanassoula, 1992a Athanassoula, E.: 1992a, Mon. Not. R. Astron. Soc. 259, 328
- Athanassoula, 1992b Athanassoula, E.: 1992b, Mon. Not. R. Astron. Soc. 259, 345
- Badnell, 2006 Badnell, N. R.: 2006, Astron. Astrophys. 447, 389
- Bagnuolo, 1976 Bagnuolo, Jr., W. G.: 1976, Ph.D. thesis, AA(California Inst. of Tech., Pasadena.)
- Baldwin et al., 1981 Baldwin, J. A., Phillips, M. M., and Terlevich, R.: 1981, Publ. Astron. Soc. Pac. 93, 5
- Baldwin et al., 1982 Baldwin, J. A., Spinrad, H., and Terlevich, R.: 1982, Mon. Not. R. Astron. Soc. 198, 535
- Balick and Heckman, 1981 Balick, B. and Heckman, T.: 1981, Astron. Astrophys. 96, 271
- Balick and Sneden, 1976 Balick, B. and Sneden, C.: 1976, Astrophys. J. 208, 336
- Balzano, 1983 Balzano, V. A.: 1983, Astrophys. J. 268, 602
- Barker, 1980 Barker, T.: 1980, Astrophys. J. 240, 99
- Barmby et al., 2000 Barmby, P., Huchra, J. P., Brodie, J. P., Forbes, D. A., Schroder, L. L., and Grillmair, C. J.: 2000, Astron. J. 119, 727
- Barth et al., 1995 Barth, A. J., Ho, L. C., Filippenko, A. V., and Sargent, W. L.: 1995, Astron. J. 110, 1009
- Bastian et al., 2005 Bastian, N., Gieles, M., Lamers, H. J. G. L. M., Scheepmaker, R. A., and de Grijs, R.: 2005, Astron. Astrophys. 431, 905
- Bastian et al., 2006 Bastian, N., Saglia, R. P., Goudfrooij, P., Kissler-Patig, M., Maraston, C., Schweizer, F., and Zoccali, M.: 2006, Astron. Astrophys. 448, 881
- Benedict et al., 2002 Benedict, G. F., Howell, D. A., Jørgensen, I., Kenney, J. D. P., and Smith, B. J.: 2002, Astron. J. 123, 1411
- Benjamin et al., 1999 Benjamin, R. A., Skillman, E. D., and Smits, D. P.: 1999, Astrophys. J. 514, 307
- Binney and Tremaine, 1987 Binney, J. and Tremaine, S.: 1987, Galactic dynamics, Princeton, NJ, Princeton University Press, 1987, 747 p.
- Boer and Schulz, 1993 Boer, B. and Schulz, H.: 1993, Astron. Astrophys. 277, 397
- Bosch and Meza, 2001 Bosch, G. and Meza, A.: 2001, in Revista Mexicana de Astronomia y Astrofisica Conference Series, Vol. 11 of Revista Mexicana de Astronomia y Astrofisica, vol. 27, pp 29–+
- Bosch et al., 2001 Bosch, G., Selman, F., Melnick, J., and Terlevich, R.: 2001, Astron. Astrophys. 380, 137
- Bosch et al., 2008 Bosch, G., Terlevich, E., and Terlevich, R.: 2008, Mon. Not. R. Astron. Soc.(submitted)
- Bottinelli et al., 1984 Bottinelli, L., Gouguenheim, L., Paturel, G., and de Vaucouleurs, G.: 1984, Astron. and Astrophys. Suppl. Sries 56, 381
- Bournaud et al., 2004 Bournaud, F., Duc, P.-A., Amram, P., Combes, F., and Gach, J.-L.: 2004, Astron. Astrophys. 425, 813
- Bresolin, 2007 Bresolin, F.: 2007, Astrophys. J. 656, 186
- Bresolin et al., 2004 Bresolin, F., Garnett, D. R., and Kennicutt, Jr., R. C.: 2004, Astrophys. J. 615, 228
- Bresolin and Kennicutt, 1997 Bresolin, F. and Kennicutt, Jr., R. C.: 1997, Astron. J. 113, 975
- Bresolin et al., 1999 Bresolin, F., Kennicutt, Jr., R. C., and Garnett, D. R.: 1999, Astrophys. J. 510, 104
- Bresolin et al., 2005 Bresolin, F., Schaerer, D., González-Delgado, R. M., and Stasińska, G.: 2005, Astron. Astrophys. 441, 981
- Brocklehurst, 1971 Brocklehurst, M.: 1971, Mon. Not. R. Astron. Soc. 153, 471
- Bushouse, 1987 Bushouse, H. A.: 1987, Astrophys. J. 320, 49
- Bushouse et al., 1998 Bushouse, H. A., Telesco, C. M., and Werner, M. W.: 1998, Astron. J. 115, 938
- Bushouse et al., 1988 Bushouse, H. A., Werner, M. W., and Lamb, S. A.: 1988, Astrophys. J. 335, 74
- Butler and Zeippen, 1994 Butler, K. and Zeippen, C. J.: 1994, Astron. and Astrophys. Suppl. Sries 108, 1
- Carlson et al., 1998 Carlson, M. N., Holtzman, J. A., Watson, A. M., Grillmair, C. J., Mould, J. R., Ballester, G. E., Burrows, C. J., Clarke, J. T., Crisp, D., Evans, R. W., Gallagher, III, J. S., Griffiths, R. E., Hester, J. J., Hoessel, J. G., Scowen, P. A., Stapelfeldt, K. R., Trauger, J. T., and Westphal, J. A.: 1998, Astron. J. 115, 1778
- Castellanos et al., 2002 Castellanos, M., Díaz, A. I., and Terlevich, E.: 2002, Mon. Not. R. Astron. Soc. 329, 315
- Cepa and Beckman, 1990 Cepa, J. and Beckman, J. E.: 1990, Astrophys. J. 349, 497
- Cerviño et al., 2002 Cerviño, M., Valls-Gabaud, D., Luridiana, V., and Mas-Hesse, J. M.: 2002, Astron. Astrophys. 381, 51
- Cid Fernandes et al., 2007 Cid Fernandes, R., Asari, N. V., Sodré, L., Stasińska, G., Mateus, A., Torres-Papaqui, J. P., and Schoenell, W.: 2007, Mon. Not. R. Astron. Soc. 375, L16
- Cid Fernandes et al., 2001 Cid Fernandes, R., Heckman, T., Schmitt, H., Delgado, R. M. G., and Storchi-Bergmann, T.: 2001, Astrophys. J. 558, 81
- Cid Fernandes et al., 2005 Cid Fernandes, R., Mateus, A., Sodré, L., Stasińska, G., and Gomes, J. M.: 2005, Mon. Not. R. Astron. Soc. 358, 363
- Colina et al., 1997 Colina, L., García Vargas, M. L., Mas-Hesse, J. M., Alberdi, A., and Krabbe, A.: 1997, Astrophys. J. Letters 484, L41+
- Colina et al., 2002 Colina, L., González-Delgado, R., Mas-Hesse, J. M., and Leitherer, C.: 2002, Astrophys. J. 579, 545
- Combes and Gerin, 1985 Combes, F. and Gerin, M.: 1985, Astron. Astrophys. 150, 327
- Crockett et al., 2006 Crockett, N. R., Garnett, D. R., Massey, P., and Jacoby, G.: 2006, Astrophys. J. 637, 741
- de Robertis et al., 1987 de Robertis, M. M., Dufour, R. J., and Hunt, R. W.: 1987, Royal Astronomical Society of Canada, Journal 81, 195
- de Vaucouleurs, 1963 de Vaucouleurs, G.: 1963, Astrophys. J., Suppl. Ser. 8, 31
- de Vaucouleurs et al., 1991 de Vaucouleurs, G., de Vaucouleurs, A., Corwin, Jr., H. G., Buta, R. J., Paturel, G., and Fouque, P.: 1991, Third Reference Catalogue of Bright Galaxies, Volume 1-3, XII, 2069 pp. 7 figs.. Springer-Verlag Berlin Heidelberg New York
- Denicoló et al., 2002 Denicoló, G., Terlevich, R., and Terlevich, E.: 2002, Mon. Not. R. Astron. Soc. 330, 69
- Denicoló et al., 2002 Denicoló, G., Terlevich, R., and Terlevich, E.: 2002, Mon. Not. R. Astron. Soc. 330, 69
- Devereux, 1989 Devereux, N. A.: 1989, Astrophys. J. 346, 126
- Devereux et al., 1992 Devereux, N. A., Kenney, J. D., and Young, J. S.: 1992, Astron. J. 103, 784
- Díaz, 1989 Díaz, A. I.: 1989, in J. E. Beckman and B. E. J. Pagel (eds.), Evolutionary Phenomena in Galaxies, pp 377–397
- Díaz, 1988 Díaz, A. I.: 1988, Mon. Not. R. Astron. Soc. 231, 57
- Díaz, 1998 Díaz, A. I.: 1998, Astron. Astrophys. Suppl. Ser. 263, 143
- Díaz et al., 2000a Díaz, A. I., Álvarez-Álvarez, M., Terlevich, E., Terlevich, R., Portal, M. S., and Aretxaga, I.: 2000a, Mon. Not. R. Astron. Soc. 311, 120
- Díaz et al., 2000b Díaz, A. I., Castellanos, M., Terlevich, E., and Luisa García-Vargas, M.: 2000b, Mon. Not. R. Astron. Soc. 318, 462
- Díaz and Pérez-Montero, 2000 Díaz, A. I. and Pérez-Montero, E.: 2000, Mon. Not. R. Astron. Soc. 312, 130
- Díaz et al., 1985 Díaz, A. I., Pagel, B. E. J., and Wilson, I. R. G.: 1985, Mon. Not. R. Astron. Soc. 212, 737
- Díaz and Pérez-Montero, 1999 Díaz, A. I. and Pérez-Montero, E.: 1999, in J. R. Walsh and M. R. Rosa (eds.), Chemical Evolution from Zero to High Redshift, pp 134–+
- Díaz et al., 2006 Díaz, A. I., Terlevich, E., Castellanos, M., and Hägele, G. F.: 2006, astro-ph/0610787
- Díaz et al., 2007 Díaz, Á. I., Terlevich, E., Castellanos, M., and Hägele, G. F.: 2007, Mon. Not. R. Astron. Soc. 382, 251
- Díaz et al., 1987 Díaz, A. I., Terlevich, E., Pagel, B. E. J., Víilchez, J. M., and Edmunds, M. G.: 1987, Mon. Not. R. Astron. Soc. 226, 19
- Díaz et al., 1989 Díaz, A. I., Terlevich, E., and Terlevich, R.: 1989, Mon. Not. R. Astron. Soc. 239, 325
- Díaz et al., 1991 Díaz, A. I., Terlevich, E., Vílchez, J. M., Pagel, B. E. J., and Edmunds, M. G.: 1991, Mon. Not. R. Astron. Soc. 253, 245
- Díaz et al., 1999 Díaz, R., Carranza, G., Dottori, H., and Goldes, G.: 1999, Astrophys. J. 512, 623
- Dopita et al., 2002 Dopita, M. A., Pereira, M., Kewley, L. J., and Capaccioli, M.: 2002, Astrophys. J., Suppl. Ser. 143, 47
- Dors et al., 2008 Dors, Jr., O. L., Storchi-Bergmann, T., Riffel, R. A., and Schimdt, A. A.: 2008, astro-ph-0802.2070
- Drake and Testa, 2005 Drake, J. J. and Testa, P.: 2005, Nature 436, 525
- Ellison et al., 2001 Ellison, S. L., Yan, L., Hook, I. M., Pettini, M., Wall, J. V., and Shaver, P.: 2001, Astron. Astrophys. 379, 393
- Elmegreen and Elmegreen, 1986 Elmegreen, B. G. and Elmegreen, D. M.: 1986, Astrophys. J. 311, 554
- Elmegreen et al., 2002 Elmegreen, D. M., Chromey, F. R., McGrath, E. J., and Ostenson, J. M.: 2002, Astron. J. 123, 1381
- Elmegreen et al., 1997 Elmegreen, D. M., Chromey, F. R., Santos, M., and Marshall, D.: 1997, Astron. J. 114, 1850
- Elmegreen et al., 2006 Elmegreen, D. M., Elmegreen, B. G., Kaufman, M., Sheth, K., Struck, C., Thomasson, M., and Brinks, E.: 2006, Astrophys. J. 642, 158
- Elmegreen et al., 2001 Elmegreen, D. M., Kaufman, M., Elmegreen, B. G., Brinks, E., Struck, C., Klarić, M., and Thomasson, M.: 2001, Astron. J. 121, 182
- Elmegreen and Salzer, 1999 Elmegreen, D. M. and Salzer, J. J.: 1999, Astron. J. 117, 764
- Ercolano et al., 2007 Ercolano, B., Bastian, N., and Stasińska, G.: 2007, Mon. Not. R. Astron. Soc. 379, 945
- Esteban et al., 2004 Esteban, C., Peimbert, M., García-Rojas, J., Ruiz, M. T., Peimbert, A., and Rodríguez, M.: 2004, Mon. Not. R. Astron. Soc. 355, 229
- Falco et al., 1999 Falco, E. E., Kurtz, M. J., Geller, M. J., Huchra, J. P., Peters, J., Berlind, P., Mink, D. J., Tokarz, S. P., and Elwell, B.: 1999, Publ. Astron. Soc. Pac. 111, 438
- Ferland et al., 1998 Ferland, G. J., Korista, K. T., Verner, D. A., Ferguson, J. W., Kingdon, J. B., and Verner, E. M.: 1998, Publ. Astron. Soc. Pac. 110, 761
- French, 1980 French, H. B.: 1980, Astrophys. J. 240, 41
- Friedli and Benz, 1995 Friedli, D. and Benz, W.: 1995, Astron. Astrophys. 301, 649
- Galavis et al., 1995 Galavis, M. E., Mendoza, C., and Zeippen, C. J.: 1995, Astron. and Astrophys. Suppl. Sries 111, 347
- Gallagher et al., 2001 Gallagher, S. C., Charlton, J. C., Hunsberger, S. D., Zaritsky, D., and Whitmore, B. C.: 2001, Astron. J. 122, 163
- García-Rojas, 2006 García-Rojas, J.: 2006, PhD Thesis, Universidad de La Laguna
- García Vargas and Díaz, 1994 García Vargas, M. L. and Díaz, A. I.: 1994, Astrophys. J., Suppl. Ser. 91, 553
- García-Rojas and Esteban, 2007 García-Rojas, J. and Esteban, C.: 2007, Astrophys. J. 670, 457
- García-Rojas et al., 2005 García-Rojas, J., Esteban, C., Peimbert, A., Peimbert, M., Rodríguez, M., and Ruiz, M. T.: 2005, Mon. Not. R. Astron. Soc. 362, 301
- García-Rojas et al., 2006 García-Rojas, J., Esteban, C., Peimbert, M., Costado, M. T., Rodríguez, M., Peimbert, A., and Ruiz, M. T.: 2006, Mon. Not. R. Astron. Soc. 368, 253
- García-Rojas et al., 2004 García-Rojas, J., Esteban, C., Peimbert, M., Rodríguez, M., Ruiz, M. T., and Peimbert, A.: 2004, Astrophys. J., Suppl. Ser. 153, 501
- García-Vargas et al., 1995 García-Vargas, M. L., Bressan, A., and Díaz, A. I.: 1995, Astron. and Astrophys. Suppl. Sries 112, 35
- Garnett, 1992 Garnett, D. R.: 1992, Astron. J. 103, 1330
- Garnett, 2002 Garnett, D. R.: 2002, Astrophys. J. 581, 1019
- Garnett et al., 2004 Garnett, D. R., Kennicutt, Jr., R. C., and Bresolin, F.: 2004, Astrophys. J. Letters 607, L21
- Garnett et al., 1997 Garnett, D. R., Shields, G. A., Skillman, E. D., Sagan, S. P., and Dufour, R. J.: 1997, Astrophys. J. 489, 63
- Gil de Paz et al., 2003 Gil de Paz, A., Madore, B. F., and Pevunova, O.: 2003, Astrophys. J., Suppl. Ser. 147, 29
- González-Delgado et al., 2005 González-Delgado, R. M., Cerviño, M., Martins, L. P., Leitherer, C., and Hauschildt, P. H.: 2005, Mon. Not. R. Astron. Soc. 357, 945
- González-Delgado et al., 1998 González-Delgado, R. M., Heckman, T., Leitherer, C., Meurer, G., Krolik, J., Wilson, A. S., Kinney, A., and Koratkar, A.: 1998, Astrophys. J. 505, 174
- González-Delgado and Pérez, 1996 González-Delgado, R. M. and Pérez, E.: 1996, Mon. Not. R. Astron. Soc. 281, 781
- González-Delgado et al., 1995 González-Delgado, R. M., Pérez, E., Díaz, A. I., García-Vargas, M. L., Terlevich, E., and Vílchez, J. M.: 1995, Astrophys. J. 439, 604
- González-Delgado et al., 1994 González-Delgado, R. M., Pérez, E., Tenorio-Tagle, G., Vílchez, J. M., Terlevich, E., Terlevich, R., Telles, E., Rodríguez-Espinosa, J. M., Mas-Hesse, M., García-Vargas, M. L., Díaz, A. I., Cepa, J., and Castañeda, H.: 1994, Astrophys. J. 437, 239
- Graham and et al., 1997 Graham, J. A. and et al.: 1997, Astrophys. J. 477, 535
- Grevesse and Sauval, 1998 Grevesse, N. and Sauval, A. J.: 1998, Space Science Reviews 85, 161
- Groves et al., 2006 Groves, B. A., Heckman, T. M., and Kauffmann, G.: 2006, Mon. Not. R. Astron. Soc. 371, 1559
- Gu et al., 2006 Gu, Q., Melnick, J., Fernandes, R. C., Kunth, D., Terlevich, E., and Terlevich, R.: 2006, Mon. Not. R. Astron. Soc. 366, 480
- Guseva et al., 2007 Guseva, N. G., Izotov, Y. I., Papaderos, P., and Fricke, K. J.: 2007, Astron. Astrophys. 464, 885
- Guseva et al., 2000 Guseva, N. G., Izotov, Y. I., and Thuan, T. X.: 2000, Astrophys. J. 531, 776 (GIT00)
- Guseva et al., 2006 Guseva, N. G., Izotov, Y. I., and Thuan, T. X.: 2006, Astrophys. J. 644, 890
- Guseva et al., 2003a Guseva, N. G., Papaderos, P., Izotov, Y. I., Green, R. F., Fricke, K. J., Thuan, T. X., and Noeske, K. G.: 2003a, Astron. Astrophys. 407, 75
- Guseva et al., 2003b Guseva, N. G., Papaderos, P., Izotov, Y. I., Green, R. F., Fricke, K. J., Thuan, T. X., and Noeske, K. G.: 2003b, Astron. Astrophys. 407, 91
- Guseva et al., 2003c Guseva, N. G., Papaderos, P., Izotov, Y. I., Green, R. F., Fricke, K. J., Thuan, T. X., and Noeske, K. G.: 2003c, Astron. Astrophys. 407, 105
- Guzmán et al., 1998 Guzmán, R., Jangren, A., Koo, D. C., Bershady, M. A., and Simard, L.: 1998, Astrophys. J. Letters 495, L13+
- Guzmán et al., 1996 Guzmán, R., Koo, D. C., Faber, S. M., Illingworth, G. D., Takamiya, M., Kron, R. G., and Bershady, M. A.: 1996, Astrophys. J. Letters 460, L5+
- Hägele et al., 2007 Hägele, G. F., Díaz, A. I., Cardaci, M. V., Terlevich, E., and Terlevich, R.: 2007, Mon. Not. R. Astron. Soc. 378, 163
- Hägele et al., 2008 Hägele, G. F., Díaz, Á. I., Terlevich, E., Terlevich, R., Pérez-Montero, E., and Cardaci, M. V.: 2008, Mon. Not. R. Astron. Soc. 383, 209
- Hägele et al., 2006 Hägele, G. F., Pérez-Montero, E., Díaz, A. I., Terlevich, E., and Terlevich, R.: 2006, Mon. Not. R. Astron. Soc. 372, 293
- Harper and Low, 1973 Harper, Jr., D. A. and Low, F. J.: 1973, Astrophys. J. Letters 182, L89+
- Haynes et al., 1998 Haynes, M. P., van Zee, L., Hogg, D. E., Roberts, M. S., and Maddalena, R. J.: 1998, Astron. J. 115, 62
- Henry, 1989 Henry, R. B. C.: 1989, Mon. Not. R. Astron. Soc. 241, 453
- Ho and Filippenko, 1996a Ho, L. C. and Filippenko, A. V.: 1996a, Astrophys. J. Letters 466, L83+
- Ho and Filippenko, 1996b Ho, L. C. and Filippenko, A. V.: 1996b, Astrophys. J. 472, 600
- Ho et al., 1997 Ho, L. C., Filippenko, A. V., and Sargent, W. L. W.: 1997, Astrophys. J., Suppl. Ser. 112, 315
- Holtzman et al., 1992 Holtzman, J. A., Faber, S. M., Shaya, E. J., Lauer, T. R., Groth, J., Hunter, D. A., Baum, W. A., Ewald, S. P., Hester, J. J., Light, R. M., Lynds, C. R., O’Neil, Jr., E. J., and Westphal, J. A.: 1992, Astron. J. 103, 691
- Holweger, 2001 Holweger, H.: 2001, in R. F. Wimmer-Schweingruber (ed.), Joint SOHO/ACE workshop ”Solar and Galactic Composition”, Vol. 598 of American Institute of Physics Conference Series, pp 23–+
- Hoyos and Díaz, 2006 Hoyos, C. and Díaz, A. I.: 2006, Mon. Not. R. Astron. Soc. 365, 454
- Hubble, 1926 Hubble, E. P.: 1926, Astrophys. J. 64, 321
- Huchra, 1977 Huchra, J. P.: 1977, Astrophys. J. 217, 928
- Israelian and Rebolo, 2001 Israelian, G. and Rebolo, R.: 2001, Astrophys. J. Letters 557, L43
- Izotov et al., 1999 Izotov, Y. I., Chaffee, F. H., Foltz, C. B., Green, R. F., Guseva, N. G., and Thuan, T. X.: 1999, Astrophys. J. 527, 757
- Izotov et al., 2001a Izotov, Y. I., Chaffee, F. H., and Green, R. F.: 2001a, Astrophys. J. 562, 727
- Izotov et al., 2001b Izotov, Y. I., Chaffee, F. H., and Schaerer, D.: 2001b, Astron. Astrophys. 378, L45 (ICS01)
- Izotov et al., 1997a Izotov, Y. I., Lipovetsky, V. A., Chaffee, F. H., Foltz, C. B., Guseva, N. G., and Kniazev, A. Y.: 1997a, Astrophys. J. 476, 698
- Izotov et al., 2004a Izotov, Y. I., Papaderos, P., Guseva, N. G., Fricke, K. J., and Thuan, T. X.: 2004a, Astron. Astrophys. 421, 539
- Izotov et al., 2004b Izotov, Y. I., Stasińska, G., Guseva, N. G., and Thuan, T. X.: 2004b, Astron. Astrophys. 415, 87 (IT04)
- Izotov et al., 2006 Izotov, Y. I., Stasińska, G., Meynet, G., Guseva, N. G., and Thuan, T. X.: 2006, Astron. Astrophys. 448, 955
- Izotov and Thuan, 1998a Izotov, Y. I. and Thuan, T. X.: 1998a, Astrophys. J. 497, 227
- Izotov and Thuan, 1998b Izotov, Y. I. and Thuan, T. X.: 1998b, Astrophys. J. 500, 188 (IT98)
- Izotov and Thuan, 2004 Izotov, Y. I. and Thuan, T. X.: 2004, Astrophys. J. 602, 200
- Izotov et al., 1994 Izotov, Y. I., Thuan, T. X., and Lipovetsky, V. A.: 1994, Astrophys. J. 435, 647 (ITL94)
- Izotov et al., 1997b Izotov, Y. I., Thuan, T. X., and Lipovetsky, V. A.: 1997b, Astrophys. J., Suppl. Ser. 108, 1 (ITL97)
- Jamet et al., 2005 Jamet, L., Stasińska, G., Pérez, E., González-Delgado, R. M., and Vílchez, J. M.: 2005, Astron. Astrophys. 444, 723
- Jarrett et al., 2003 Jarrett, T. H., Chester, T., Cutri, R., Schneider, S. E., and Huchra, J. P.: 2003, Astron. J. 125, 525
- Jiménez-Benito et al., 2000 Jiménez-Benito, L., Díaz, A. I., Terlevich, R., and Terlevich, E.: 2000, Mon. Not. R. Astron. Soc. 317, 907
- Jogee et al., 2005 Jogee, S., Scoville, N., and Kenney, J. D. P.: 2005, Astrophys. J. 630, 837
- Kauffmann et al., 2003 Kauffmann, G., Heckman, T. M., Tremonti, C., Brinchmann, J., Charlot, S., White, S. D. M., Ridgway, S. E., Brinkmann, J., Fukugita, M., Hall, P. B., Ivezić, Ž., Richards, G. T., and Schneider, D. P.: 2003, Mon. Not. R. Astron. Soc. 346, 1055
- Kenney et al., 1992 Kenney, J. D. P., Wilson, C. D., Scoville, N. Z., Devereux, N. A., and Young, J. S.: 1992, Astrophys. J. Letters 395, L79
- Kennicutt et al., 2003 Kennicutt, R. C., Bresolin, F., and Garnett, D. R.: 2003, Astrophys. J. 591, 801(KBG03)
- Kennicutt, 1989 Kennicutt, Jr., R. C.: 1989, Astrophys. J. 344, 685
- Kennicutt, 1992 Kennicutt, Jr., R. C.: 1992, Astrophys. J., Suppl. Ser. 79, 255
- Kennicutt, 1998a Kennicutt, Jr., R. C.: 1998a, Ann. Rev. Astron. Astrophys. 36, 189
- Kennicutt, 1998b Kennicutt, Jr., R. C.: 1998b, Astrophys. J. 498, 541
- Kennicutt and Garnett, 1996 Kennicutt, Jr., R. C. and Garnett, D. R.: 1996, Astrophys. J. 456, 504
- Kennicutt et al., 1989 Kennicutt, Jr., R. C., Keel, W. C., and Blaha, C. A.: 1989, Astron. J. 97, 1022
- Kennicutt et al., 1987 Kennicutt, Jr., R. C., Roettiger, K. A., Keel, W. C., van der Hulst, J. M., and Hummel, E.: 1987, Astron. J. 93, 1011
- Kewley et al., 2001 Kewley, L. J., Dopita, M. A., Sutherland, R. S., Heisler, C. A., and Trevena, J.: 2001, Astrophys. J. 556, 121
- Kewley and Ellison, 2008 Kewley, L. J. and Ellison, S. L.: 2008, ArXiv e-prints 801
- Kingdon and Ferland, 1995 Kingdon, J. and Ferland, G. J.: 1995, Astrophys. J. 442, 714
- Knapen et al., 1992 Knapen, J. H., Beckman, J. E., Cepa, J., van der Hulst, T., and Rand, R. J.: 1992, Astrophys. J. Letters 385, L37
- Kniazev et al., 2003 Kniazev, A. Y., Grebel, E. K., Hao, L., Strauss, M. A., Brinkmann, J., and Fukugita, M.: 2003, Astrophys. J. Letters 593, L73
- Kniazev et al., 2004 Kniazev, A. Y., Pustilnik, S. A., Grebel, E. K., Lee, H., and Pramskij, A. G.: 2004, Astrophys. J., Suppl. Ser. 153, 429
- Kobulnicky et al., 1999 Kobulnicky, H. A., Kennicutt, Jr., R. C., and Pizagno, J. L.: 1999, Astrophys. J. 514, 544
- Koo et al., 1994 Koo, D. C., Bershady, M. A., Wirth, G. D., Stanford, S. A., and Majewski, S. R.: 1994, Astrophys. J. Letters 427, L9
- Koo et al., 1995 Koo, D. C., Guzmán, R., Faber, S. M., Illingworth, G. D., Bershady, M. A., Kron, R. G., and Takamiya, M.: 1995, Astrophys. J. Letters 440, L49
- Kouwenhoven and de Grijs, 2007 Kouwenhoven, M. B. N. and de Grijs, R.: 2007, astro-ph/0710.1207
- Kregel and Sancisi, 2001 Kregel, M. and Sancisi, R.: 2001, Astron. Astrophys. 376, 59
- Kroupa, 2002 Kroupa, P.: 2002, Science 295, 82
- Kunth and Östlin, 2000 Kunth, D. and Östlin, G.: 2000, Astron. Astrophys. Rev 10, 1
- Kunth and Sargent, 1983 Kunth, D. and Sargent, W. L. W.: 1983, Astrophys. J. 273, 81
- Kurtz and Mink, 1998 Kurtz, M. J. and Mink, D. J.: 1998, Publ. Astron. Soc. Pac. 110, 934
- Lamareille et al., 2004 Lamareille, F., Mouhcine, M., Contini, T., Lewis, I., and Maddox, S.: 2004, Mon. Not. R. Astron. Soc. 350, 396
- Larsen et al., 2001 Larsen, S. S., Brodie, J. P., Elmegreen, B. G., Efremov, Y. N., Hodge, P. W., and Richtler, T.: 2001, Astrophys. J. 556, 801
- Larsen et al., 2004 Larsen, S. S., Brodie, J. P., and Hunter, D. A.: 2004, Astron. J. 128, 2295
- Larson and Tinsley, 1978 Larson, R. B. and Tinsley, B. M.: 1978, Astrophys. J. 219, 46
- Lee et al., 2004 Lee, J. C., Salzer, J. J., and Melbourne, J.: 2004, Astrophys. J. 616, 752 (L04)
- Leitherer and Heckman, 1995 Leitherer, C. and Heckman, T. M.: 1995, Astrophys. J., Suppl. Ser. 96, 9
- Leitherer et al., 1992 Leitherer, C., Robert, C., and Drissen, L.: 1992, Astrophys. J. 401, 596
- Leitherer et al., 1999 Leitherer, C., Schaerer, D., Goldader, J. D., Delgado, R. M. G., Robert, C., Kune, D. F., de Mello, D. F., Devost, D., and Heckman, T. M.: 1999, Astrophys. J., Suppl. Ser. 123, 3
- Lennon and Burke, 1994 Lennon, D. J. and Burke, V. M.: 1994, Astron. and Astrophys. Suppl. Sries 103, 273
- Liu and Kennicutt, 1995 Liu, C. T. and Kennicutt, Jr., R. C.: 1995, Astrophys. J. 450, 547
- Liu, 2006 Liu, X.-W.: 2006, in M. J. Barlow and R. H. Méndez (eds.), Planetary Nebulae in our Galaxy and Beyond, Vol. 234 of IAU Symposium, pp 219–226
- Liu et al., 2006 Liu, X.-W., Barlow, M. J., Zhang, Y., Bastin, R. J., and Storey, P. J.: 2006, Mon. Not. R. Astron. Soc. 368, 1959
- Liu et al., 2001 Liu, X.-W., Luo, S.-G., Barlow, M. J., Danziger, I. J., and Storey, P. J.: 2001, Mon. Not. R. Astron. Soc. 327, 141
- Liu et al., 2000 Liu, X.-W., Storey, P. J., Barlow, M. J., Danziger, I. J., Cohen, M., and Bryce, M.: 2000, Mon. Not. R. Astron. Soc. 312, 585
- López, 2005a López, J.: 2005a, MSc Thesis, INAOE
- López, 2005b López, J.: 2005b, MSc Thesis, INAOE
- Luridiana et al., 2003 Luridiana, V., Peimbert, A., Peimbert, M., and Cerviño, M.: 2003, Astrophys. J. 592, 846
- Luridiana et al., 1999 Luridiana, V., Peimbert, M., and Leitherer, C.: 1999, Astrophys. J. 527, 110
- Macchetto et al., 1990 Macchetto, F., Colina, L., Golombek, D., Perryman, M. A. C., and di Serego Alighieri, S.: 1990, Astrophys. J. 356, 389
- Maoz et al., 2001 Maoz, D., Barth, A. J., Ho, L. C., Sternberg, A., and Filippenko, A. V.: 2001, Astron. J. 121, 3048
- Maoz et al., 1996 Maoz, D., Barth, A. J., Sternberg, A., Filippenko, A. V., Ho, L. C., Macchetto, F. D., Rix, H.-W., and Schneider, D. P.: 1996, Astron. J. 111, 2248
- Marconi et al., 2006 Marconi, A., Pastorini, G., Pacini, F., Axon, D. J., Capetti, A., Macchetto, D., Koekemoer, A. M., and Schreier, E. J.: 2006, Astron. Astrophys. 448, 921
- Mas-Hesse and Kunth, 1991 Mas-Hesse, J. M. and Kunth, D.: 1991, Astron. and Astrophys. Suppl. Sries 88, 399
- Mas-Hesse et al., 2003 Mas-Hesse, J. M., Kunth, D., Tenorio-Tagle, G., Leitherer, C., Terlevich, R. J., and Terlevich, E.: 2003, Astrophys. J. 598, 858
- Mateus et al., 2007 Mateus, A., Sodré, L., Cid Fernandes, R., and Stasińska, G.: 2007, Mon. Not. R. Astron. Soc. 374, 1457
- Mateus et al., 2006 Mateus, A., Sodré, L., Cid Fernandes, R., Stasińska, G., Schoenell, W., and Gomes, J. M.: 2006, Mon. Not. R. Astron. Soc. 370, 721
- McCall and Schmidt, 1986 McCall, M. L. and Schmidt, F. H.: 1986, Astrophys. J. 311, 548
- McCrady et al., 2003 McCrady, N., Gilbert, A. M., and Graham, J. R.: 2003, Astrophys. J. 596, 240
- McCrady and Graham, 2007 McCrady, N. and Graham, J. R.: 2007, Astrophys. J. 663, 844
- McGaugh, 1991 McGaugh, S. S.: 1991, Astrophys. J. 380, 140
- Melbourne et al., 2004 Melbourne, J., Phillips, A., Salzer, J. J., Gronwall, C., and Sarajedini, V. L.: 2004, Astron. J. 127, 686 (M04)
- Melnick et al., 1999 Melnick, J., Tenorio-Tagle, G., and Terlevich, R.: 1999, Mon. Not. R. Astron. Soc. 302, 677
- Melnick et al., 1985a Melnick, J., Terlevich, R., and Eggleton, P. P.: 1985a, Mon. Not. R. Astron. Soc. 216, 255
- Melnick et al., 1985b Melnick, J., Terlevich, R., and Moles, M.: 1985b, Revista Mexicana de Astronomia y Astrofisica 11, 91
- Melnick et al., 1988 Melnick, J., Terlevich, R., and Moles, M.: 1988, Mon. Not. R. Astron. Soc. 235, 297
- Melnick et al., 2000 Melnick, J., Terlevich, R., and Terlevich, E.: 2000, Mon. Not. R. Astron. Soc. 311
- Mengel et al., 2005 Mengel, S., Lehnert, M. D., Thatte, N., and Genzel, R.: 2005, Astron. Astrophys. 443, 41
- Mengel et al., 2008 Mengel, S., Lehnert, M. D., Thatte, N. A., Vacca, W. D., Whitmore, B., and Chandar, R.: 2008, ArXiv e-prints 805
- Meurer et al., 1995 Meurer, G. R., Heckman, T. M., Leitherer, C., Kinney, A., Robert, C., and Garnett, D. R.: 1995, Astron. J. 110, 2665
- Meynet et al., 1994 Meynet, G., Maeder, A., Schaller, G., Schaerer, D., and Charbonnel, C.: 1994, Astron. and Astrophys. Suppl. Sries 103, 97
- Miller et al., 1997 Miller, B. W., Whitmore, B. C., Schweizer, F., and Fall, S. M.: 1997, Astron. J. 114, 2381
- Miller and Mathews, 1972 Miller, J. S. and Mathews, W. G.: 1972, Astrophys. J. 172, 593
- Mollá et al., 2006 Mollá, M., Vílchez, J. M., Gavilán, M., and Díaz, A. I.: 2006, Mon. Not. R. Astron. Soc. 372, 1069
- Morgan, 1958 Morgan, W. W.: 1958, Publ. Astron. Soc. Pac. 70, 364
- Morisset et al., 2004 Morisset, C., Schaerer, D., Bouret, J.-C., and Martins, F.: 2004, Astron. Astrophys. 415, 577
- Mould et al., 2000 Mould, J. R., Huchra, J. P., Freedman, W. L., Kennicutt, Jr., R. C., Ferrarese, L., Ford, H. C., Gibson, B. K., Graham, J. A., Hughes, S. M. G., Illingworth, G. D., Kelson, D. D., Macri, L. M., Madore, B. F., Sakai, S., Sebo, K. M., Silbermann, N. A., and Stetson, P. B.: 2000, Astrophys. J. 529, 786
- Mulder and van Driel, 1996 Mulder, P. S. and van Driel, W.: 1996, Astron. Astrophys. 309, 403
- Mulder et al., 1995 Mulder, P. S., van Driel, W., and Braine, J.: 1995, Astron. Astrophys. 300, 687
- Nagao et al., 2006 Nagao, T., Maiolino, R., and Marconi, A.: 2006, Astron. Astrophys. 459, 85
- Nelson and Whittle, 1995 Nelson, C. H. and Whittle, M.: 1995, Astrophys. J., Suppl. Ser. 99, 67
- Noeske et al., 2005 Noeske, K. G., Papaderos, P., Cairós, L. M., and Fricke, K. J.: 2005, Astron. Astrophys. 429, 115
- Oke, 1990 Oke, J. B.: 1990, Astron. J. 99, 1621
- Oke and Gunn, 1983 Oke, J. B. and Gunn, J. E.: 1983, Astrophys. J. 266, 713
- Olive and Skillman, 2001 Olive, K. A. and Skillman, E. D.: 2001, New Astronomy 6, 119
- Olive and Skillman, 2004 Olive, K. A. and Skillman, E. D.: 2004, Astrophys. J. 617, 29
- Origlia et al., 2001 Origlia, L., Leitherer, C., Aloisi, A., Greggio, L., and Tosi, M.: 2001, Astron. J. 122, 815
- Origlia et al., 2004 Origlia, L., Ranalli, P., Comastri, A., and Maiolino, R.: 2004, Astrophys. J. 606, 862
- Osterbrock, 1989 Osterbrock, D. E.: 1989, Astrophysics of gaseous nebulae and active galactic nuclei, Mill Valley, CA, University Science Books
- Osterbrock et al., 1996 Osterbrock, D. E., Fulbright, J. P., Martel, A. R., Keane, M. J., Trager, S. C., and Basri, G.: 1996, Publ. Astron. Soc. Pac. 108, 277
- Östlin et al., 2004 Östlin, G., Cumming, R. J., Amram, P., Bergvall, N., Kunth, D., Márquez, I., Masegosa, J., and Zackrisson, E.: 2004, Astron. Astrophys. 419, L43
- Pagel et al., 1979 Pagel, B. E. J., Edmunds, M. G., Blackwell, D. E., Chun, M. S., and Smith, G.: 1979, Mon. Not. R. Astron. Soc. 189, 95
- Pagel et al., 1992 Pagel, B. E. J., Simonson, E. A., Terlevich, R. J., and Edmunds, M. G.: 1992, Mon. Not. R. Astron. Soc. 255, 325
- Palacios et al., 1997 Palacios, J., García-Vargas, M. L., Díaz, A., Terlevich, R., and Terlevich, E.: 1997, Astron. Astrophys. 323, 749
- Pasquali and Castangia, 2008 Pasquali, A. and Castangia, P.: 2008, Mon. Not. R. Astron. Soc. 385, 468
- Pastorini et al., 2007 Pastorini, G., Marconi, A., Capetti, A., Axon, D. J., Alonso-Herrero, A., Atkinson, J., Batcheldor, D., Carollo, C. M., Collett, J., Dressel, L., Hughes, M. A., Macchetto, D., Maciejewski, W., Sparks, W., and van der Marel, R.: 2007, Astron. Astrophys. 469, 405
- Pastoriza et al., 1993 Pastoriza, M. G., Dottori, H. A., Terlevich, E., Terlevich, R., and Diaz, A. I.: 1993, Mon. Not. R. Astron. Soc. 260, 177
- Pauldrach et al., 2001 Pauldrach, A. W. A., Hoffmann, T. L., and Lennon, M.: 2001, Astron. Astrophys. 375, 161
- Peimbert, 2003 Peimbert, A.: 2003, Astrophys. J. 584, 735
- Peimbert et al., 2002 Peimbert, A., Peimbert, M., and Luridiana, V.: 2002, Astrophys. J. 565, 668
- Peimbert et al., 2005 Peimbert, A., Peimbert, M., and Ruiz, M. T.: 2005, Astrophys. J. 634, 1056
- Peimbert, 1967 Peimbert, M.: 1967, Astrophys. J. 150, 825
- Peimbert, 1971 Peimbert, M.: 1971, Boletin de los Observatorios Tonantzintla y Tacubaya 6, 29
- Peimbert and Costero, 1969 Peimbert, M. and Costero, R.: 1969, Boletin de los Observatorios Tonantzintla y Tacubaya 5, 3
- Peimbert and Peimbert, 2003 Peimbert, M. and Peimbert, A.: 2003, in Revista Mexicana de Astronomia y Astrofisica Conference Series, Vol. 16, pp 113–116
- Peimbert and Peimbert, 2006 Peimbert, M. and Peimbert, A.: 2006, in M. J. Barlow and R. H. Méndez (eds.), Planetary Nebulae in our Galaxy and Beyond, Vol. 234 of IAU Symposium, pp 227–234
- Peimbert et al., 2007 Peimbert, M., Peimbert, A., Esteban, C., García-Rojas, J., Bresolin, F., Carigi, L., Ruiz, M. T., and López-Sánchez, A. R.: 2007, in Revista Mexicana de Astronomia y Astrofisica Conference Series, Vol. 29 of Revista Mexicana de Astronomia y Astrofisica Conference Series, pp 72–79
- Peimbert et al., 2000 Peimbert, M., Peimbert, A., and Ruiz, M. T.: 2000, Astrophys. J. 541, 688
- Peimbert et al., 2004 Peimbert, M., Peimbert, A., Ruiz, M. T., and Esteban, C.: 2004, Astrophys. J., Suppl. Ser. 150, 431
- Peimbert and Torres-Peimbert, 1992 Peimbert, M. and Torres-Peimbert, S.: 1992, Astron. Astrophys. 253, 349
- Pérez et al., 2000 Pérez, E., Márquez, I., Marrero, I., Durret, F., González Delgado, R. M., Masegosa, J., Maza, J., and Moles, M.: 2000, Astron. Astrophys. 353, 893
- Pérez-Montero and Díaz, 2003 Pérez-Montero, E. and Díaz, A. I.: 2003, Mon. Not. R. Astron. Soc. 346, 105 (PMD03)
- Pérez-Montero and Díaz, 2005 Pérez-Montero, E. and Díaz, A. I.: 2005, Mon. Not. R. Astron. Soc. 361, 1063
- Pérez-Montero and Díaz, 2007 Pérez-Montero, E. and Díaz, A. I.: 2007, Mon. Not. R. Astron. Soc. 377, 1195
- Pérez-Montero et al., 2006 Pérez-Montero, E., Díaz, A. I., Vílchez, J. M., and Kehrig, C.: 2006, Astron. Astrophys. 449, 193
- Pérez-Montero et al., 2007 Pérez-Montero, E., Hägele, G. F., Contini, T., and Díaz, Á. I.: 2007, Mon. Not. R. Astron. Soc. 381, 125
- Pérez-Olea, 1996 Pérez-Olea, D.: 1996, PhD Thesis, Universidad Autónoma de Madrid
- Pettini et al., 2001 Pettini, M., Shapley, A. E., Steidel, C. C., Cuby, J.-G., Dickinson, M., Moorwood, A. F. M., Adelberger, K. L., and Giavalisco, M.: 2001, Astrophys. J. 554, 981
- Pettini et al., 2000 Pettini, M., Steidel, C. C., Adelberger, K. L., Dickinson, M., and Giavalisco, M.: 2000, Astrophys. J. 528, 96
- Phillips et al., 1984 Phillips, M. M., Pagel, B. E. J., Edmunds, M. G., and Díaz, A.: 1984, Mon. Not. R. Astron. Soc. 210, 701
- Pilyugin, 2000 Pilyugin, L. S.: 2000, Astron. Astrophys. 362, 325
- Pilyugin, 2007 Pilyugin, L. S.: 2007, Mon. Not. R. Astron. Soc. 375, 685
- Pilyugin et al., 2006 Pilyugin, L. S., Thuan, T. X., and Vílchez, J. M.: 2006, Mon. Not. R. Astron. Soc. 367, 1139
- Pilyugin et al., 2004 Pilyugin, L. S., Vílchez, J. M., and Contini, T.: 2004, Astron. Astrophys. 425, 849
- Piner et al., 1995 Piner, B. G., Stone, J. M., and Teuben, P. J.: 1995, Astrophys. J. 449, 508
- Pizzella et al., 2004 Pizzella, A., Corsini, E. M., Vega Beltrán, J. C., and Bertola, F.: 2004, Astron. Astrophys. 424, 447
- Planesas et al., 1997 Planesas, P., Colina, L., and Pérez-Olea, D.: 1997, Astron. Astrophys. 325, 81
- Popescu and Hopp, 2000 Popescu, C. C. and Hopp, U.: 2000, Astron. and Astrophys. Suppl. Sries 142, 247
- Porter et al., 2005 Porter, R. L., Bauman, R. P., Ferland, G. J., and MacAdam, K. B.: 2005, Astrophys. J. Letters 622, L73
- Prada et al., 1994 Prada, F., Greve, A., and McKeith, C. D.: 1994, Astron. Astrophys. 288, 396
- Pradhan, 1976 Pradhan, A. K.: 1976, Mon. Not. R. Astron. Soc. 177, 31
- Puxley et al., 1990 Puxley, P. J., Hawarden, T. G., and Mountain, C. M.: 1990, Astrophys. J. 364, 77
- Ramsbottom et al., 1996 Ramsbottom, C. A., Bell, K. L., and Stafford, R. P.: 1996, Atomic Data and Nuclear Data Tables 63, 57
- Rieke and Lebofsky, 1978 Rieke, G. H. and Lebofsky, M. J.: 1978, Astrophys. J. Letters 220, L37
- Rieke et al., 1993 Rieke, G. H., Loken, K., Rieke, M. J., and Tamblyn, P.: 1993, Astrophys. J. 412, 99
- Rieke and Low, 1972 Rieke, G. H. and Low, F. J.: 1972, Astrophys. J. Letters 176, L95+
- Roberts et al., 1979 Roberts, Jr., W. W., Huntley, J. M., and van Albada, G. D.: 1979, Astrophys. J. 233, 67
- Rodríguez and Rubin, 2004 Rodríguez, M. and Rubin, R. H.: 2004, in IAU Symp. 217, Recycling Intergallactic and Interstellar Matter, ed. P. A. Duc, J. Braine, and E. Brinks (San Francisco: ASP), pp 188–+ (astro–ph/0312246)
- Rola et al., 1997 Rola, C. S., Terlevich, E., and Terlevich, R. J.: 1997, Mon. Not. R. Astron. Soc. 289, 419
- Rosa-González et al., 2007 Rosa-González, D., Schmitt, H. R., Terlevich, E., and Terlevich, R.: 2007, Astrophys. J. 654, 226
- Rubin et al., 2002 Rubin, R. H., Bhatt, N. J., Dufour, R. J., Buckalew, B. A., Barlow, M. J., Liu, X.-W., Storey, P. J., Balick, B., Ferland, G. J., Harrington, J. P., and Martin, P. G.: 2002, Mon. Not. R. Astron. Soc. 334, 777
- Rubin et al., 1975 Rubin, V. C., Peterson, C. J., and Ford, Jr., W. K.: 1975, Astrophys. J. 199, 39
- Ruiz et al., 2003 Ruiz, M. T., Peimbert, A., Peimbert, M., and Esteban, C.: 2003, Astrophys. J. 595, 247
- Sakamoto et al., 1999 Sakamoto, K., Okumura, S. K., Ishizuki, S., and Scoville, N. Z.: 1999, Astrophys. J. 525, 691
- Salpeter, 1955 Salpeter, E. E.: 1955, Astrophys. J. 121, 161
- Sánchez-Portal et al., 2000 Sánchez-Portal, M., Díaz, Á. I., Terlevich, R., Terlevich, E., Álvarez Álvarez, M., and Aretxaga, I.: 2000, Mon. Not. R. Astron. Soc. 312, 2
- Sargent, 1970 Sargent, W. L. W.: 1970, Astrophys. J. 160, 405
- Sargent and Searle, 1970 Sargent, W. L. W. and Searle, L.: 1970, Astrophys. J. Letters 162, L155+
- Schulte-Ladbeck et al., 1998 Schulte-Ladbeck, R. E., Crone, M. M., and Hopp, U.: 1998, Astrophys. J. Letters 493, L23+
- Searle and Sargent, 1972 Searle, L. and Sargent, W. L. W.: 1972, Astrophys. J. 173, 25
- Searle et al., 1973 Searle, L., Sargent, W. L. W., and Bagnuolo, W. G.: 1973, Astrophys. J. 179, 427
- Sérsic and Pastoriza, 1965 Sérsic, J. L. and Pastoriza, M.: 1965, Publ. Astron. Soc. Pac. 77, 287
- Sérsic and Pastoriza, 1967 Sérsic, J. L. and Pastoriza, M.: 1967, Publ. Astron. Soc. Pac. 79, 152
- Shaw and Dufour, 1995 Shaw, R. A. and Dufour, R. J.: 1995, Publ. Astron. Soc. Pac. 107, 896
- Sheth et al., 2005 Sheth, K., Vogel, S. N., Regan, M. W., Thornley, M. D., and Teuben, P. J.: 2005, Astrophys. J. 632, 217
- Shields and Kennicutt, 1995 Shields, J. C. and Kennicutt, Jr., R. C.: 1995, Astrophys. J. 454, 807
- Siegel et al., 2005 Siegel, E. R., Guzmán, R., Gallego, J. P., Orduña López, M., and Rodríguez-Hidalgo, P.: 2005, Mon. Not. R. Astron. Soc. 356, 1117
- Skillman and Kennicutt, 1993 Skillman, E. D. and Kennicutt, Jr., R. C.: 1993, Astrophys. J. 411, 655 (SK93)
- Skillman et al., 1994 Skillman, E. D., Televich, R. J., Kennicutt, Jr., R. C., Garnett, D. R., and Terlevich, E.: 1994, Astrophys. J. 431, 172 (S94)
- Smith et al., 2005 Smith, B. J., Struck, C., Appleton, P. N., Charmandaris, V., Reach, W., and Eitter, J. J.: 2005, Astron. J. 130, 2117
- Smith et al., 1996 Smith, D. A., Neff, S. G., Bothun, G. D., Fanelli, M. N., Offenberg, J. D., Waller, W. H., Bohlin, R. C., O’Connell, R. W., Roberts, M. S., Smith, A. M., and Stecher, T. P.: 1996, Astrophys. J. Letters 473, L21+
- Smith et al., 2002 Smith, L. J., Norris, R. P. F., and Crowther, P. A.: 2002, Mon. Not. R. Astron. Soc. 337, 1309
- Stasińska and Izotov, 2003 Stasińska, G. and Izotov, Y.: 2003, Astron. Astrophys. 397, 71
- Stasińska, 1978 Stasińska, G.: 1978, Astron. Astrophys. 66, 257
- Stasińska, 1980 Stasińska, G.: 1980, Astron. Astrophys. 84, 320
- Stasińska, 1990 Stasińska, G.: 1990, Astron. and Astrophys. Suppl. Sries 83, 501
- Stasińska, 2005 Stasińska, G.: 2005, Astron. Astrophys. 434, 507
- Stasińska, 2006 Stasińska, G.: 2006, Astron. Astrophys. 454, L127
- Stasińska and Leitherer, 1996 Stasińska, G. and Leitherer, C.: 1996, Astrophys. J., Suppl. Ser. 107, 661
- Stauffer, 1982 Stauffer, J. R.: 1982, Astrophys. J., Suppl. Ser. 50, 517
- Storey and Hummer, 1995 Storey, P. J. and Hummer, D. G.: 1995, Mon. Not. R. Astron. Soc. 272, 41
- Stoughton and et al., 2002 Stoughton, C. and et al.: 2002, Astron. J. 123, 485
- Swartz et al., 2006 Swartz, D. A., Yukita, M., Tennant, A. F., Soria, R., and Ghosh, K. K.: 2006, Astrophys. J. 647, 1030
- Tayal and Gupta, 1999 Tayal, S. S. and Gupta, G. P.: 1999, Astrophys. J. 526, 544
- Telesco, 1988 Telesco, C. M.: 1988, Ann. Rev. Astron. Astrophys. 26, 343
- Telesco and Decher, 1988 Telesco, C. M. and Decher, R.: 1988, Astrophys. J. 334, 573
- Telesco and Gatley, 1984 Telesco, C. M. and Gatley, I.: 1984, Astrophys. J. 284, 557
- Telesco and Harper, 1980 Telesco, C. M. and Harper, D. A.: 1980, Astrophys. J. 235, 392
- Telles et al., 1997 Telles, E., Melnick, J., and Terlevich, R.: 1997, Mon. Not. R. Astron. Soc. 288, 78
- Temporin et al., 2003 Temporin, S., Ciroi, S., Rafanelli, P., Radovich, M., Vennik, J., Richter, G. M., and Birkle, K.: 2003, Astrophys. J., Suppl. Ser. 148, 353
- Terlevich et al., 1990 Terlevich, E., Terlevich, R., Díaz, A. I., Pastoriza, M. G., and Dottori, H.: 1990, Mon. Not. R. Astron. Soc. 242, 48P
- Terlevich et al., 2003 Terlevich, E., Terlevich, R., and Melnick, J.: 2003, in J. M. Rodriguez-Espinoza, F. Garzon Lopez, and V. Melo Martin (eds.), Revista Mexicana de Astronomia y Astrofisica Conference Series, pp 213–215
- Terlevich et al., 1991 Terlevich, R., Melnick, J., Masegosa, J., Moles, M., and Copetti, M. V. F.: 1991, Astron. and Astrophys. Suppl. Sries 91, 285 (T91)
- Thronson and Greenhouse, 1988 Thronson, Jr., H. A. and Greenhouse, M. A.: 1988, Astrophys. J. 327, 671
- Tinsley, 1968 Tinsley, B. M.: 1968, Astrophys. J. 151, 547
- Tinsley, 1972 Tinsley, B. M.: 1972, Astron. Astrophys. 20, 383
- Tonry and Davis, 1979 Tonry, J. and Davis, M.: 1979, Astron. J. 84, 1511
- Trancho et al., 2007 Trancho, G., Bastian, N., Miller, B. W., and Schweizer, F.: 2007, Astrophys. J. 664, 284
- Tsamis et al., 2003 Tsamis, Y. G., Barlow, M. J., Liu, X.-W., Danziger, I. J., and Storey, P. J.: 2003, Mon. Not. R. Astron. Soc. 338, 687
- Tsamis and Péquignot, 2005 Tsamis, Y. G. and Péquignot, D.: 2005, Mon. Not. R. Astron. Soc. 364, 687
- Ugryumov et al., 2003 Ugryumov, A. V., Engels, D., Pustilnik, S. A., Kniazev, A. Y., Pramskij, A. G., and Hagen, H.-J.: 2003, Astron. Astrophys. 397, 463
- van der Kruit, 1976 van der Kruit, P. C.: 1976, Astron. Astrophys. 49, 161
- van der Kruit and de Bruyn, 1976 van der Kruit, P. C. and de Bruyn, A. G.: 1976, Astron. Astrophys. 48, 373
- van Zee, 2000 van Zee, L.: 2000, Astrophys. J. Letters 543, L31
- Vázquez and Leitherer, 2005 Vázquez, G. A. and Leitherer, C.: 2005, Astrophys. J. 621, 695
- Vermeij and van der Hulst, 2002 Vermeij, R. and van der Hulst, J. M.: 2002, Astron. Astrophys. 391, 1081
- Vílchez et al., 1988 Vílchez, J. M., Pagel, B. E. J., Díaz, A. I., Terlevich, E., and Edmunds, M. G.: 1988, Mon. Not. R. Astron. Soc. 235, 633
- Vila-Costas and Edmunds, 1992 Vila-Costas, M. B. and Edmunds, M. G.: 1992, Mon. Not. R. Astron. Soc. 259, 121
- Vílchez and Esteban, 1996 Vílchez, J. M. and Esteban, C.: 1996, Mon. Not. R. Astron. Soc. 280, 720
- Vílchez and Pagel, 1988 Vílchez, J. M. and Pagel, B. E. J.: 1988, Mon. Not. R. Astron. Soc. 231, 257
- Wang et al., 2004 Wang, W., Liu, X.-W., Zhang, Y., and Barlow, M. J.: 2004, Astron. Astrophys. 427, 873
- Weaver and Woosley, 1993 Weaver, T. A. and Woosley, S. E.: 1993, Phys. Rep. 227, 65
- Wesson et al., 2005 Wesson, R., Liu, X.-W., and Barlow, M. J.: 2005, Mon. Not. R. Astron. Soc. 362, 424
- Whitmore and Schweizer, 1995 Whitmore, B. C. and Schweizer, F.: 1995, Astron. J. 109, 960
- Whitmore et al., 1993 Whitmore, B. C., Schweizer, F., Leitherer, C., Borne, K., and Robert, C.: 1993, Astron. J. 106, 1354
- Whitmore et al., 1999 Whitmore, B. C., Zhang, Q., Leitherer, C., Fall, S. M., Schweizer, F., and Miller, B. W.: 1999, Astron. J. 118, 1551
- Woods and Geller, 2007 Woods, D. F. and Geller, M. J.: 2007, Astron. J. 134, 527
- Woods et al., 2006 Woods, D. F., Geller, M. J., and Barton, E. J.: 2006, Astron. J. 132, 197
- Xu and Sulentic, 1991 Xu, C. and Sulentic, J. W.: 1991, Astrophys. J. 374, 407
- Zaritsky et al., 1994 Zaritsky, D., Kennicutt, Jr., R. C., and Huchra, J. P.: 1994, Astrophys. J. 420, 87
- Zeippen, 1982 Zeippen, C. J.: 1982, Mon. Not. R. Astron. Soc. 198, 111
- Zeippen et al., 1987 Zeippen, C. J., Le Bourlot, J., and Butler, K.: 1987, Astron. Astrophys. 188, 251
- Zepf et al., 1999 Zepf, S. E., Ashman, K. M., English, J., Freeman, K. C., and Sharples, R. M.: 1999, Astron. J. 118, 752
- Zwicky, 1966 Zwicky, F.: 1966, Astrophys. J. 143, 192
Acknowledgements
This work has been supported by Spanish DGICYT grants AYA-2004-02860-C03 and AYA- 2007-67965-C03-03. I acknowledge support from the Spanish MEC through FPU grants AP2003-1821. Furthermore, partial support from the Comunidad de Madrid under grant S-0505/ESP/ 000237 (ASTROCAM) is acknowledged. I thank the hospitality of the Institute of Astronomy, Cambridge, where part of this work was developed, and also thank the hospitality of the INAOE and the Laboratoire d’Astrophysique de Toulouse-Tarbes.
The WHT is operated in the island of La Palma by the Isaac Newton Group in the Spanish Observatorio del Roque de los Muchachos of the Instituto de Astrofísica de Canarias. We thank the Spanish allocation committee (CAT) for awarding observing time.
This research has made use of the NASA/IPAC Extragalactic Database (NED) which is operated by the Jet Propulsion Laboratory, California Institute of Technology, under contract with the National Aeronautics and Space Administration.
This research has made use of the SIMBAD database, operated at CDS, Strasbourg, France.
Chapter 2
We are grateful to Jorge García-Rojas and César Esteban for calculating the effects of the temperature fluctuations over the derived ionic and total abundances. We wish to express our gratitude to Fabian Rosales for calculating the ionic He abundances for our objects using Porter’s Helium emissivities.
Funding for the creation and distribution of the SDSS Archive has been provided by the Alfred P. Sloan Foundation, the Participating Institutions, the National Aeronautics and Space Administration, the National Science Foundation, the US Department of Energy, the Japanese Monbukagakusho, and the Max Planck Society. The SDSS Web site is http://www.sdss.org.
The SDSS is managed by the ARC for the Participating Institutions. The Participating Institutions are the University of Chicago, Fermilab, the Institute for Advanced Study, the Japan Participation Group, The Johns Hopkins University, the Korean Scientist Group, Los Alamos National Laboratory, the Max Planck Institute for Astronomy (MPIA), the Max Planck Institute for Astrophysics (MPA), New Mexico State University, the University of Pittsburgh, the University of Portsmouth, Princeton University, the United States Naval Observatory, and the University of Washington.
We are pleased to thank the staff at Calar Alto, and especially Felipe Hoyo, for their assistance during the observations. We also thank the Time Allocation Committee for awarding observing time.
When we mentioned to Bernard Pagel the title of the second paper of this chapter (“Precision abundance analysis of bright Hii galaxies”) he said, with his characteristic cheeky grin: “precision abundance? but that’s an oxymoron. It will be nice if you can do it”. Dear Bernard, you are sadly missed; we dedicate this work to your memory.
We are also grateful to the anonymous referees for his/her careful and constructive revision of the manuscripts of the two papers of this chapter.
Chapter 3
We would like to thank the referee of the paper, G. J. Ferland, for many valuable suggestions and comments which have helped us to improve this part of the work.
Chapter 4
We are indebted to Jesús López who provided the data on the SDSS sample prior to publication. We acknowledge fruitful discussions with Horacio Dottori, Enrique Pérez, Guillermo Bosch, Nate Bastian, Almudena Alonso-Herrero, Enrique Pérez-Montero and José Vílchez. We thank very much an anonymous referee for his/her careful examination of our manuscript of the published paper. We have found the report extremely thorough and undoubtedly it has helped to improve the contents of this part of the work.
Some of the data presented in this part of the thesis were obtained from the Multimission Archive at the Space Telescope Science Institute (MAST). STScI is operated by the Association of Universities for Research in Astronomy, Inc., under NASA contract NAS5-26555. Support for MAST for non-HST data is provided by the NASA Office of Space Science via grant NAG5-7584 and by other grants and contracts.
Chapter 5
We would like to thank Mike Beasley for providing the digital spectrum of the M 31 cluster, Roberto Cid Fernandes for very helpful discussions concerning subtraction procedures of the underlying absorptions and Roberto Terlevich for a careful reading of the manuscript of the paper. We also thank an anonymous referee for a very careful review of this work which lead to the improvement of the work.
This thesis is dedicated to the memory of Bernard Pagel who was always a source of inspiration and stimuli for me and my collaborators and with whom many of the matters addressed in this work were discussed over the last twenty years or so.
Agradecimientos
Hay mucha gente que ha hecho posible que esta tesis doctoral haya llegado no sólo a terminarse, sino que ha sido fundamental a la hora de darme su apoyo para que tomara la difícil decisión de viajar tan lejos para poder aprender muchísimas cosas, o al menos intentarlo, tanto en la parte relacionada con el trabajo científico como en mi crecimiento como persona. La lista es larga, y lamentablemente es muy posible que me olvide de alguien, pero a todos les agradezco por su apoyo, consciente o inconsciente, que me han dado a lo largo de todos estos años, que no son sólo los últimos cuatro, sino que se remonta a mucho antes de que hubiera terminado la licenciatura.
En primer lugar quiero agradecerle a Moni, por todo su amor y por haberme apoyado en los momentos difíciles cuando las cosas se hacían cuesta arriba. Gracias a sus consejos, su ayuda y su compañía estos años han sido los mejores de mi vida. Y por si todo esto fuera poco, ahora tenemos a Vale. Personita increíble que es como si siempre hubiera estado con nosotros y nos llena de una alegría inmensa. Ella también contribuyó estos últimos meses a que pudiera terminar mi trabajo, esperándome en casa con una sonrisa los primeros meses de su vida, cuando recién había nacido y yo llegaba tarde por la noche después de un día largo.
Mis padres, Nelly y Carlos, fueron los primeros en apoyarme para que me dedicara a lo que más me gustaba, y con sus maneras tan distintas de preocuparse por mí y de interesarse en lo que hacía me incentivaron en todo momento y me entusiasmaron y me dieron fuerzas para que estudiara astronomía y llevara adelante esta tesis. Mis hermanos, Jorge y Andrés, compartieron muchos momentos conmigo, incluso en los últimos tiempos que hemos estado tan lejos, al igual que mis cuñadas, Silvina y Adriana, y mis suegros, Rosa y Raúl. Y quien podría olvidarse de mis sobrinitas, Lucía, Camila y Clarita, sobre todo de Lu, que es la más grande y que siempre pregunta por lo que está haciendo el tío Guiye y por la “astronomía”. La verdad es que una de las cosas más duras durante este tiempo lejos de la familia ha sido el perderse un montón de cosas y el no haberlas visto crecer.
Una mención aparte se merecen mis directoras, Ángeles y Elena. Al principio no sabía muy bien que iba a pasar, y los miedos de ir casi al otro lado del mundo a invertir tantos años de mi vida eran bastante aterradores, a pesar de las excelentes referencias que tenía de ellas. Sin embargo, desde un primer momento se comportaron como mucho más que simples directoras de una tesis doctoral, mostrando que son excelentes personas y haciéndome sentir enseguida como parte de un grupo, casi una familia. Sobre todo Ángeles, con quien hemos compartido muchísimas cosas buenas, a la que consideramos con Moni mucho más que una amiga, ya es parte de nuestra familia, y es como una tía para Vale.
También tengo que mencionar en esta parte a Roberto y Enrique, quienes han contribuido a su manera y de distinta forma a la dirección de este trabajo. Roberto con sus discusiones llenas de ideas y su forma de hacer que uno deduzca las cosas y lleve su capacidad al límite, siempre generando un criterio propio y pensando al máximo las cosas tratando de no dejar escapar nada que se pueda deducir con lo que uno tiene a su disposición para realizar el trabajo. Enrique, que no sólo ha aportado ideas, sino que me ha enseñado mucho de su propia experiencia, y me ha dado las pautas para aprovechar las diferencias entre los lugares donde estudié para sacar el máximo provecho en mi formación. Un verdadero amigo de los que duran toda la vida, aunque sea a la distancia.
En este momento también quiero recordar a la gente que primero fueron profesores cuando estaba en la licenciatura y luego excelentes amigos, aquellos que fueron los primeros en alentarme y creer que podía hacer esto.
Primero que nadie, Ama, quien fue la primera en sugerirme que la espectroscopía y el grupo de estrellas masivas era el camino que debía seguir, allá lejos en el tiempo, cuando ella era Jefe de Trabajos prácticos de Estadística Aplicada y el alumno molesto que era yo no dejaba de hacerle preguntas. Y después, cuando ya eramos muy buenos amigos, fue la primera en aconsejarme que hacer el doctorado fuera era lo mejor que podía hacer si era lo que realmente quería y tenía las ganas y la fuerza necesaria para ello.
Guille y Rudolf, quienes primero fueron mis directores en la licenciatura y después en mi comienzos en el doctorado en La Plata, y que siempre me dieron su apoyo incondicional para venir a España, aunque eso significara, de momento, dejar de trabajar con ellos, y a los que puedo considerar afortunadamente como excelentes amigos. Más aún, quiero agradecer de corazón la confianza de Guille de recomendarme a Elena, y a través de ella a Ángeles, para que me aceptaran como su estudiante de doctorado. Yo sé lo importante que es eso y espero, y creo, no haberlo decepcionado. Sin esa confianza nada de todo esto podría haber sido posible.
A Carlos por haber sido mi punto de apoyo en La Plata durante estos años y con quien hemos seguido compartiendo muchas cosas a pesar de la distancia. A Nidia, quien fue mi profesor consejero en los últimos años de carrera, y me apoyó y animó a trabajar con Guille y Rudolf, sobre todo en los pocos momentos difíciles que tuvimos al principio, hasta que aprendimos a trabajar en equipo y aceptándonos tal cual somos. También quiero hacer un breve comentario a la memoria de Virpi, quien a su manera me ha dejado un legado imborrable, como a todos los que en algún momento tuvieron el privilegio de haber tenido trato con ella.
A los amigos que fueron compañeros durante la carrera, Gonzalo, Vero, Andrea, Javi, Faca, Julia, Richard, Nico, Seba, Diego, Rolo, Face, Claudia, Erika, Marcelo, Gaby y la gente del grupo de estrellas masivas en general, Ana María, Patricia y Roberto, y muchos otros, como también Damián, el rosarino cordobés. Y a los chicos de la Autónoma, muchos de los cuales fueron sólo compañeros esporádicos debido a situaciones particulares, pero no por eso menos importantes, Ruben, Jesús, Alcione, Chiqui, Latifa, Dani, María, Amelia, Mike, Raúl, Néstor, Jairo, Jose, Hector, Manuel, Marta, Yago, Luis, Marcelo, Mercedes, Marcos y Carlos. Y también a mucha gente que he conocido durante estos años y que de alguna u otra manera han puesto su granito de arena a todo esto, como Pepe Vílchez, Enrique Pérez, Valentina Luridiana, Miguel Cerviño, María Santos-Lleó, Horacio Dottori, Jesús López, Anna Lia Longinotti, Daniel Rosa-González. A los amigos de siempre, los de la infancia y que todavía nos mantenemos en contacto, a pesar de la distancia, Yulian, Santiago, Pipi. Lamentablemente, me debo estar olvidando de mucha gente, pero aunque no los mencione en estas pocas líneas, están presentes tácitamente en todo mi trabajo y en el esfuerzo realizado.
Y no me quiero olvidar de los miembros del jurado, aunque esté escribiendo estas líneas después de haber defendido la tesis, que me han dado del privilegio de ser los evaluadores de este trabajo a pesar del esfuerzo y el tiempo que les ha llevado. Ellos han sido Pepe Vílchez, Guillermo Tenorio-Tagle, Evan Skillman, Guille Bosch y Luis Colina.
A todos y cada uno, sinceramente, muchísimas gracias.
Bibliography
- Abazajian et al., 2004 Abazajian, K., Adelman-McCarthy, J. K., Agüeros, M. A., Allam, S. S., Anderson, K., Anderson, S. F., Annis, J., Bahcall, N. A., Baldry, I. K., Bastian, S., and 143 coauthors: 2004, Astron. J. 128, 502
- Abazajian et al., 2005 Abazajian, K., Adelman-McCarthy, J. K., Agüeros, M. A., Allam, S. S., Anderson, K. S. J., Anderson, S. F., Annis, J., Bahcall, N. A., Baldry, I. K., Bastian, S., and 144 coauthors: 2005, Astron. J. 129, 1755
- Adelman-McCarthy et al., 2008 Adelman-McCarthy, J. K., Agüeros, M. A., Allam, S. S., Allende Prieto, C., Anderson, K. S. J., Anderson, S. F., Annis, J., Bahcall, N. A., Bailer-Jones, C. A. L., Baldry, I. K., and 153 coauthors: 2008, Astrophys. J., Suppl. Ser. 175, 297
- Adelman-McCarthy et al., 2006 Adelman-McCarthy, J. K., Agüeros, M. A., Allam, S. S., Anderson, K. S. J., Anderson, S. F., Annis, J., Bahcall, N. A., Baldry, I. K., Barentine, J. C., Berlind, A., and 131 coauthors: 2006, Astrophys. J., Suppl. Ser. 162, 38
- Allende-Prieto et al., 2001 Allende-Prieto, C., Lambert, D. L., and Asplund, M.: 2001, Astrophys. J. Letters 556, L63
- Alloin et al., 1979 Alloin, D., Collin-Souffrin, S., Joly, M., and Vigroux, L.: 1979, Astron. Astrophys. 78, 200
- Alloin and Nieto, 1982 Alloin, D. and Nieto, J.-L.: 1982, Astron. and Astrophys. Suppl. Sries 50, 491
- Aloisi et al., 1999 Aloisi, A., Tosi, M., and Greggio, L.: 1999, Astron. J. 118, 302
- Alonso-Herrero et al., 2001a Alonso-Herrero, A., Engelbracht, C. W., Rieke, M. J., Rieke, G. H., and Quillen, A. C.: 2001a, Astrophys. J. 546, 952
- Alonso-Herrero et al., 2000 Alonso-Herrero, A., Rieke, G. H., Rieke, M. J., and Scoville, N. Z.: 2000, Astrophys. J. 532, 845
- Alonso-Herrero et al., 2001b Alonso-Herrero, A., Ryder, S. D., and Knapen, J. H.: 2001b, Mon. Not. R. Astron. Soc. 322, 757
- Álvarez-Álvarez, 2002 Álvarez-Álvarez, M.: 2002, PhD Thesis, Universidad Autónoma de Madrid
- Arp and Sandage, 1985 Arp, H. and Sandage, A.: 1985, Astron. J. 90, 1163
- Asari et al., 2007 Asari, N. V., Cid Fernandes, R., Stasińska, G., Torres-Papaqui, J. P., Mateus, A., Sodré, L., Schoenell, W., and Gomes, J. M.: 2007, Mon. Not. R. Astron. Soc. 381, 263
- Asplund et al., 2005 Asplund, M., Grevesse, N., and Sauval, A. J.: 2005, in T. G. Barnes, III and F. N. Bash (eds.), Cosmic Abundances as Records of Stellar Evolution and Nucleosynthesis, Vol. 336 of Astronomical Society of the Pacific Conference Series, pp 25–+
- Athanassoula, 1992a Athanassoula, E.: 1992a, Mon. Not. R. Astron. Soc. 259, 328
- Athanassoula, 1992b Athanassoula, E.: 1992b, Mon. Not. R. Astron. Soc. 259, 345
- Badnell, 2006 Badnell, N. R.: 2006, Astron. Astrophys. 447, 389
- Bagnuolo, 1976 Bagnuolo, Jr., W. G.: 1976, Ph.D. thesis, AA(California Inst. of Tech., Pasadena.)
- Baldwin et al., 1981 Baldwin, J. A., Phillips, M. M., and Terlevich, R.: 1981, Publ. Astron. Soc. Pac. 93, 5
- Baldwin et al., 1982 Baldwin, J. A., Spinrad, H., and Terlevich, R.: 1982, Mon. Not. R. Astron. Soc. 198, 535
- Balick and Heckman, 1981 Balick, B. and Heckman, T.: 1981, Astron. Astrophys. 96, 271
- Balick and Sneden, 1976 Balick, B. and Sneden, C.: 1976, Astrophys. J. 208, 336
- Balzano, 1983 Balzano, V. A.: 1983, Astrophys. J. 268, 602
- Barker, 1980 Barker, T.: 1980, Astrophys. J. 240, 99
- Barmby et al., 2000 Barmby, P., Huchra, J. P., Brodie, J. P., Forbes, D. A., Schroder, L. L., and Grillmair, C. J.: 2000, Astron. J. 119, 727
- Barth et al., 1995 Barth, A. J., Ho, L. C., Filippenko, A. V., and Sargent, W. L.: 1995, Astron. J. 110, 1009
- Bastian et al., 2005 Bastian, N., Gieles, M., Lamers, H. J. G. L. M., Scheepmaker, R. A., and de Grijs, R.: 2005, Astron. Astrophys. 431, 905
- Bastian et al., 2006 Bastian, N., Saglia, R. P., Goudfrooij, P., Kissler-Patig, M., Maraston, C., Schweizer, F., and Zoccali, M.: 2006, Astron. Astrophys. 448, 881
- Benedict et al., 2002 Benedict, G. F., Howell, D. A., Jørgensen, I., Kenney, J. D. P., and Smith, B. J.: 2002, Astron. J. 123, 1411
- Benjamin et al., 1999 Benjamin, R. A., Skillman, E. D., and Smits, D. P.: 1999, Astrophys. J. 514, 307
- Binney and Tremaine, 1987 Binney, J. and Tremaine, S.: 1987, Galactic dynamics, Princeton, NJ, Princeton University Press, 1987, 747 p.
- Boer and Schulz, 1993 Boer, B. and Schulz, H.: 1993, Astron. Astrophys. 277, 397
- Bosch and Meza, 2001 Bosch, G. and Meza, A.: 2001, in Revista Mexicana de Astronomia y Astrofisica Conference Series, Vol. 11 of Revista Mexicana de Astronomia y Astrofisica, vol. 27, pp 29–+
- Bosch et al., 2001 Bosch, G., Selman, F., Melnick, J., and Terlevich, R.: 2001, Astron. Astrophys. 380, 137
- Bosch et al., 2008 Bosch, G., Terlevich, E., and Terlevich, R.: 2008, Mon. Not. R. Astron. Soc.(submitted)
- Bottinelli et al., 1984 Bottinelli, L., Gouguenheim, L., Paturel, G., and de Vaucouleurs, G.: 1984, Astron. and Astrophys. Suppl. Sries 56, 381
- Bournaud et al., 2004 Bournaud, F., Duc, P.-A., Amram, P., Combes, F., and Gach, J.-L.: 2004, Astron. Astrophys. 425, 813
- Bresolin, 2007 Bresolin, F.: 2007, Astrophys. J. 656, 186
- Bresolin et al., 2004 Bresolin, F., Garnett, D. R., and Kennicutt, Jr., R. C.: 2004, Astrophys. J. 615, 228
- Bresolin and Kennicutt, 1997 Bresolin, F. and Kennicutt, Jr., R. C.: 1997, Astron. J. 113, 975
- Bresolin et al., 1999 Bresolin, F., Kennicutt, Jr., R. C., and Garnett, D. R.: 1999, Astrophys. J. 510, 104
- Bresolin et al., 2005 Bresolin, F., Schaerer, D., González-Delgado, R. M., and Stasińska, G.: 2005, Astron. Astrophys. 441, 981
- Brocklehurst, 1971 Brocklehurst, M.: 1971, Mon. Not. R. Astron. Soc. 153, 471
- Bushouse, 1987 Bushouse, H. A.: 1987, Astrophys. J. 320, 49
- Bushouse et al., 1998 Bushouse, H. A., Telesco, C. M., and Werner, M. W.: 1998, Astron. J. 115, 938
- Bushouse et al., 1988 Bushouse, H. A., Werner, M. W., and Lamb, S. A.: 1988, Astrophys. J. 335, 74
- Butler and Zeippen, 1994 Butler, K. and Zeippen, C. J.: 1994, Astron. and Astrophys. Suppl. Sries 108, 1
- Carlson et al., 1998 Carlson, M. N., Holtzman, J. A., Watson, A. M., Grillmair, C. J., Mould, J. R., Ballester, G. E., Burrows, C. J., Clarke, J. T., Crisp, D., Evans, R. W., Gallagher, III, J. S., Griffiths, R. E., Hester, J. J., Hoessel, J. G., Scowen, P. A., Stapelfeldt, K. R., Trauger, J. T., and Westphal, J. A.: 1998, Astron. J. 115, 1778
- Castellanos et al., 2002 Castellanos, M., Díaz, A. I., and Terlevich, E.: 2002, Mon. Not. R. Astron. Soc. 329, 315
- Cepa and Beckman, 1990 Cepa, J. and Beckman, J. E.: 1990, Astrophys. J. 349, 497
- Cerviño et al., 2002 Cerviño, M., Valls-Gabaud, D., Luridiana, V., and Mas-Hesse, J. M.: 2002, Astron. Astrophys. 381, 51
- Cid Fernandes et al., 2007 Cid Fernandes, R., Asari, N. V., Sodré, L., Stasińska, G., Mateus, A., Torres-Papaqui, J. P., and Schoenell, W.: 2007, Mon. Not. R. Astron. Soc. 375, L16
- Cid Fernandes et al., 2001 Cid Fernandes, R., Heckman, T., Schmitt, H., Delgado, R. M. G., and Storchi-Bergmann, T.: 2001, Astrophys. J. 558, 81
- Cid Fernandes et al., 2005 Cid Fernandes, R., Mateus, A., Sodré, L., Stasińska, G., and Gomes, J. M.: 2005, Mon. Not. R. Astron. Soc. 358, 363
- Colina et al., 1997 Colina, L., García Vargas, M. L., Mas-Hesse, J. M., Alberdi, A., and Krabbe, A.: 1997, Astrophys. J. Letters 484, L41+
- Colina et al., 2002 Colina, L., González-Delgado, R., Mas-Hesse, J. M., and Leitherer, C.: 2002, Astrophys. J. 579, 545
- Combes and Gerin, 1985 Combes, F. and Gerin, M.: 1985, Astron. Astrophys. 150, 327
- Crockett et al., 2006 Crockett, N. R., Garnett, D. R., Massey, P., and Jacoby, G.: 2006, Astrophys. J. 637, 741
- de Robertis et al., 1987 de Robertis, M. M., Dufour, R. J., and Hunt, R. W.: 1987, Royal Astronomical Society of Canada, Journal 81, 195
- de Vaucouleurs, 1963 de Vaucouleurs, G.: 1963, Astrophys. J., Suppl. Ser. 8, 31
- de Vaucouleurs et al., 1991 de Vaucouleurs, G., de Vaucouleurs, A., Corwin, Jr., H. G., Buta, R. J., Paturel, G., and Fouque, P.: 1991, Third Reference Catalogue of Bright Galaxies, Volume 1-3, XII, 2069 pp. 7 figs.. Springer-Verlag Berlin Heidelberg New York
- Denicoló et al., 2002 Denicoló, G., Terlevich, R., and Terlevich, E.: 2002, Mon. Not. R. Astron. Soc. 330, 69
- Denicoló et al., 2002 Denicoló, G., Terlevich, R., and Terlevich, E.: 2002, Mon. Not. R. Astron. Soc. 330, 69
- Devereux, 1989 Devereux, N. A.: 1989, Astrophys. J. 346, 126
- Devereux et al., 1992 Devereux, N. A., Kenney, J. D., and Young, J. S.: 1992, Astron. J. 103, 784
- Díaz, 1989 Díaz, A. I.: 1989, in J. E. Beckman and B. E. J. Pagel (eds.), Evolutionary Phenomena in Galaxies, pp 377–397
- Díaz, 1988 Díaz, A. I.: 1988, Mon. Not. R. Astron. Soc. 231, 57
- Díaz, 1998 Díaz, A. I.: 1998, Astron. Astrophys. Suppl. Ser. 263, 143
- Díaz et al., 2000a Díaz, A. I., Álvarez-Álvarez, M., Terlevich, E., Terlevich, R., Portal, M. S., and Aretxaga, I.: 2000a, Mon. Not. R. Astron. Soc. 311, 120
- Díaz et al., 2000b Díaz, A. I., Castellanos, M., Terlevich, E., and Luisa García-Vargas, M.: 2000b, Mon. Not. R. Astron. Soc. 318, 462
- Díaz and Pérez-Montero, 2000 Díaz, A. I. and Pérez-Montero, E.: 2000, Mon. Not. R. Astron. Soc. 312, 130
- Díaz et al., 1985 Díaz, A. I., Pagel, B. E. J., and Wilson, I. R. G.: 1985, Mon. Not. R. Astron. Soc. 212, 737
- Díaz and Pérez-Montero, 1999 Díaz, A. I. and Pérez-Montero, E.: 1999, in J. R. Walsh and M. R. Rosa (eds.), Chemical Evolution from Zero to High Redshift, pp 134–+
- Díaz et al., 2006 Díaz, A. I., Terlevich, E., Castellanos, M., and Hägele, G. F.: 2006, astro-ph/0610787
- Díaz et al., 2007 Díaz, Á. I., Terlevich, E., Castellanos, M., and Hägele, G. F.: 2007, Mon. Not. R. Astron. Soc. 382, 251
- Díaz et al., 1987 Díaz, A. I., Terlevich, E., Pagel, B. E. J., Víilchez, J. M., and Edmunds, M. G.: 1987, Mon. Not. R. Astron. Soc. 226, 19
- Díaz et al., 1989 Díaz, A. I., Terlevich, E., and Terlevich, R.: 1989, Mon. Not. R. Astron. Soc. 239, 325
- Díaz et al., 1991 Díaz, A. I., Terlevich, E., Vílchez, J. M., Pagel, B. E. J., and Edmunds, M. G.: 1991, Mon. Not. R. Astron. Soc. 253, 245
- Díaz et al., 1999 Díaz, R., Carranza, G., Dottori, H., and Goldes, G.: 1999, Astrophys. J. 512, 623
- Dopita et al., 2002 Dopita, M. A., Pereira, M., Kewley, L. J., and Capaccioli, M.: 2002, Astrophys. J., Suppl. Ser. 143, 47
- Dors et al., 2008 Dors, Jr., O. L., Storchi-Bergmann, T., Riffel, R. A., and Schimdt, A. A.: 2008, astro-ph-0802.2070
- Drake and Testa, 2005 Drake, J. J. and Testa, P.: 2005, Nature 436, 525
- Ellison et al., 2001 Ellison, S. L., Yan, L., Hook, I. M., Pettini, M., Wall, J. V., and Shaver, P.: 2001, Astron. Astrophys. 379, 393
- Elmegreen and Elmegreen, 1986 Elmegreen, B. G. and Elmegreen, D. M.: 1986, Astrophys. J. 311, 554
- Elmegreen et al., 2002 Elmegreen, D. M., Chromey, F. R., McGrath, E. J., and Ostenson, J. M.: 2002, Astron. J. 123, 1381
- Elmegreen et al., 1997 Elmegreen, D. M., Chromey, F. R., Santos, M., and Marshall, D.: 1997, Astron. J. 114, 1850
- Elmegreen et al., 2006 Elmegreen, D. M., Elmegreen, B. G., Kaufman, M., Sheth, K., Struck, C., Thomasson, M., and Brinks, E.: 2006, Astrophys. J. 642, 158
- Elmegreen et al., 2001 Elmegreen, D. M., Kaufman, M., Elmegreen, B. G., Brinks, E., Struck, C., Klarić, M., and Thomasson, M.: 2001, Astron. J. 121, 182
- Elmegreen and Salzer, 1999 Elmegreen, D. M. and Salzer, J. J.: 1999, Astron. J. 117, 764
- Ercolano et al., 2007 Ercolano, B., Bastian, N., and Stasińska, G.: 2007, Mon. Not. R. Astron. Soc. 379, 945
- Esteban et al., 2004 Esteban, C., Peimbert, M., García-Rojas, J., Ruiz, M. T., Peimbert, A., and Rodríguez, M.: 2004, Mon. Not. R. Astron. Soc. 355, 229
- Falco et al., 1999 Falco, E. E., Kurtz, M. J., Geller, M. J., Huchra, J. P., Peters, J., Berlind, P., Mink, D. J., Tokarz, S. P., and Elwell, B.: 1999, Publ. Astron. Soc. Pac. 111, 438
- Ferland et al., 1998 Ferland, G. J., Korista, K. T., Verner, D. A., Ferguson, J. W., Kingdon, J. B., and Verner, E. M.: 1998, Publ. Astron. Soc. Pac. 110, 761
- French, 1980 French, H. B.: 1980, Astrophys. J. 240, 41
- Friedli and Benz, 1995 Friedli, D. and Benz, W.: 1995, Astron. Astrophys. 301, 649
- Galavis et al., 1995 Galavis, M. E., Mendoza, C., and Zeippen, C. J.: 1995, Astron. and Astrophys. Suppl. Sries 111, 347
- Gallagher et al., 2001 Gallagher, S. C., Charlton, J. C., Hunsberger, S. D., Zaritsky, D., and Whitmore, B. C.: 2001, Astron. J. 122, 163
- García-Rojas, 2006 García-Rojas, J.: 2006, PhD Thesis, Universidad de La Laguna
- García Vargas and Díaz, 1994 García Vargas, M. L. and Díaz, A. I.: 1994, Astrophys. J., Suppl. Ser. 91, 553
- García-Rojas and Esteban, 2007 García-Rojas, J. and Esteban, C.: 2007, Astrophys. J. 670, 457
- García-Rojas et al., 2005 García-Rojas, J., Esteban, C., Peimbert, A., Peimbert, M., Rodríguez, M., and Ruiz, M. T.: 2005, Mon. Not. R. Astron. Soc. 362, 301
- García-Rojas et al., 2006 García-Rojas, J., Esteban, C., Peimbert, M., Costado, M. T., Rodríguez, M., Peimbert, A., and Ruiz, M. T.: 2006, Mon. Not. R. Astron. Soc. 368, 253
- García-Rojas et al., 2004 García-Rojas, J., Esteban, C., Peimbert, M., Rodríguez, M., Ruiz, M. T., and Peimbert, A.: 2004, Astrophys. J., Suppl. Ser. 153, 501
- García-Vargas et al., 1995 García-Vargas, M. L., Bressan, A., and Díaz, A. I.: 1995, Astron. and Astrophys. Suppl. Sries 112, 35
- Garnett, 1992 Garnett, D. R.: 1992, Astron. J. 103, 1330
- Garnett, 2002 Garnett, D. R.: 2002, Astrophys. J. 581, 1019
- Garnett et al., 2004 Garnett, D. R., Kennicutt, Jr., R. C., and Bresolin, F.: 2004, Astrophys. J. Letters 607, L21
- Garnett et al., 1997 Garnett, D. R., Shields, G. A., Skillman, E. D., Sagan, S. P., and Dufour, R. J.: 1997, Astrophys. J. 489, 63
- Gil de Paz et al., 2003 Gil de Paz, A., Madore, B. F., and Pevunova, O.: 2003, Astrophys. J., Suppl. Ser. 147, 29
- González-Delgado et al., 2005 González-Delgado, R. M., Cerviño, M., Martins, L. P., Leitherer, C., and Hauschildt, P. H.: 2005, Mon. Not. R. Astron. Soc. 357, 945
- González-Delgado et al., 1998 González-Delgado, R. M., Heckman, T., Leitherer, C., Meurer, G., Krolik, J., Wilson, A. S., Kinney, A., and Koratkar, A.: 1998, Astrophys. J. 505, 174
- González-Delgado and Pérez, 1996 González-Delgado, R. M. and Pérez, E.: 1996, Mon. Not. R. Astron. Soc. 281, 781
- González-Delgado et al., 1995 González-Delgado, R. M., Pérez, E., Díaz, A. I., García-Vargas, M. L., Terlevich, E., and Vílchez, J. M.: 1995, Astrophys. J. 439, 604
- González-Delgado et al., 1994 González-Delgado, R. M., Pérez, E., Tenorio-Tagle, G., Vílchez, J. M., Terlevich, E., Terlevich, R., Telles, E., Rodríguez-Espinosa, J. M., Mas-Hesse, M., García-Vargas, M. L., Díaz, A. I., Cepa, J., and Castañeda, H.: 1994, Astrophys. J. 437, 239
- Graham and et al., 1997 Graham, J. A. and et al.: 1997, Astrophys. J. 477, 535
- Grevesse and Sauval, 1998 Grevesse, N. and Sauval, A. J.: 1998, Space Science Reviews 85, 161
- Groves et al., 2006 Groves, B. A., Heckman, T. M., and Kauffmann, G.: 2006, Mon. Not. R. Astron. Soc. 371, 1559
- Gu et al., 2006 Gu, Q., Melnick, J., Fernandes, R. C., Kunth, D., Terlevich, E., and Terlevich, R.: 2006, Mon. Not. R. Astron. Soc. 366, 480
- Guseva et al., 2007 Guseva, N. G., Izotov, Y. I., Papaderos, P., and Fricke, K. J.: 2007, Astron. Astrophys. 464, 885
- Guseva et al., 2000 Guseva, N. G., Izotov, Y. I., and Thuan, T. X.: 2000, Astrophys. J. 531, 776 (GIT00)
- Guseva et al., 2006 Guseva, N. G., Izotov, Y. I., and Thuan, T. X.: 2006, Astrophys. J. 644, 890
- Guseva et al., 2003a Guseva, N. G., Papaderos, P., Izotov, Y. I., Green, R. F., Fricke, K. J., Thuan, T. X., and Noeske, K. G.: 2003a, Astron. Astrophys. 407, 75
- Guseva et al., 2003b Guseva, N. G., Papaderos, P., Izotov, Y. I., Green, R. F., Fricke, K. J., Thuan, T. X., and Noeske, K. G.: 2003b, Astron. Astrophys. 407, 91
- Guseva et al., 2003c Guseva, N. G., Papaderos, P., Izotov, Y. I., Green, R. F., Fricke, K. J., Thuan, T. X., and Noeske, K. G.: 2003c, Astron. Astrophys. 407, 105
- Guzmán et al., 1998 Guzmán, R., Jangren, A., Koo, D. C., Bershady, M. A., and Simard, L.: 1998, Astrophys. J. Letters 495, L13+
- Guzmán et al., 1996 Guzmán, R., Koo, D. C., Faber, S. M., Illingworth, G. D., Takamiya, M., Kron, R. G., and Bershady, M. A.: 1996, Astrophys. J. Letters 460, L5+
- Hägele et al., 2007 Hägele, G. F., Díaz, A. I., Cardaci, M. V., Terlevich, E., and Terlevich, R.: 2007, Mon. Not. R. Astron. Soc. 378, 163
- Hägele et al., 2008 Hägele, G. F., Díaz, Á. I., Terlevich, E., Terlevich, R., Pérez-Montero, E., and Cardaci, M. V.: 2008, Mon. Not. R. Astron. Soc. 383, 209
- Hägele et al., 2006 Hägele, G. F., Pérez-Montero, E., Díaz, A. I., Terlevich, E., and Terlevich, R.: 2006, Mon. Not. R. Astron. Soc. 372, 293
- Harper and Low, 1973 Harper, Jr., D. A. and Low, F. J.: 1973, Astrophys. J. Letters 182, L89+
- Haynes et al., 1998 Haynes, M. P., van Zee, L., Hogg, D. E., Roberts, M. S., and Maddalena, R. J.: 1998, Astron. J. 115, 62
- Henry, 1989 Henry, R. B. C.: 1989, Mon. Not. R. Astron. Soc. 241, 453
- Ho and Filippenko, 1996a Ho, L. C. and Filippenko, A. V.: 1996a, Astrophys. J. Letters 466, L83+
- Ho and Filippenko, 1996b Ho, L. C. and Filippenko, A. V.: 1996b, Astrophys. J. 472, 600
- Ho et al., 1997 Ho, L. C., Filippenko, A. V., and Sargent, W. L. W.: 1997, Astrophys. J., Suppl. Ser. 112, 315
- Holtzman et al., 1992 Holtzman, J. A., Faber, S. M., Shaya, E. J., Lauer, T. R., Groth, J., Hunter, D. A., Baum, W. A., Ewald, S. P., Hester, J. J., Light, R. M., Lynds, C. R., O’Neil, Jr., E. J., and Westphal, J. A.: 1992, Astron. J. 103, 691
- Holweger, 2001 Holweger, H.: 2001, in R. F. Wimmer-Schweingruber (ed.), Joint SOHO/ACE workshop ”Solar and Galactic Composition”, Vol. 598 of American Institute of Physics Conference Series, pp 23–+
- Hoyos and Díaz, 2006 Hoyos, C. and Díaz, A. I.: 2006, Mon. Not. R. Astron. Soc. 365, 454
- Hubble, 1926 Hubble, E. P.: 1926, Astrophys. J. 64, 321
- Huchra, 1977 Huchra, J. P.: 1977, Astrophys. J. 217, 928
- Israelian and Rebolo, 2001 Israelian, G. and Rebolo, R.: 2001, Astrophys. J. Letters 557, L43
- Izotov et al., 1999 Izotov, Y. I., Chaffee, F. H., Foltz, C. B., Green, R. F., Guseva, N. G., and Thuan, T. X.: 1999, Astrophys. J. 527, 757
- Izotov et al., 2001a Izotov, Y. I., Chaffee, F. H., and Green, R. F.: 2001a, Astrophys. J. 562, 727
- Izotov et al., 2001b Izotov, Y. I., Chaffee, F. H., and Schaerer, D.: 2001b, Astron. Astrophys. 378, L45 (ICS01)
- Izotov et al., 1997a Izotov, Y. I., Lipovetsky, V. A., Chaffee, F. H., Foltz, C. B., Guseva, N. G., and Kniazev, A. Y.: 1997a, Astrophys. J. 476, 698
- Izotov et al., 2004a Izotov, Y. I., Papaderos, P., Guseva, N. G., Fricke, K. J., and Thuan, T. X.: 2004a, Astron. Astrophys. 421, 539
- Izotov et al., 2004b Izotov, Y. I., Stasińska, G., Guseva, N. G., and Thuan, T. X.: 2004b, Astron. Astrophys. 415, 87 (IT04)
- Izotov et al., 2006 Izotov, Y. I., Stasińska, G., Meynet, G., Guseva, N. G., and Thuan, T. X.: 2006, Astron. Astrophys. 448, 955
- Izotov and Thuan, 1998a Izotov, Y. I. and Thuan, T. X.: 1998a, Astrophys. J. 497, 227
- Izotov and Thuan, 1998b Izotov, Y. I. and Thuan, T. X.: 1998b, Astrophys. J. 500, 188 (IT98)
- Izotov and Thuan, 2004 Izotov, Y. I. and Thuan, T. X.: 2004, Astrophys. J. 602, 200
- Izotov et al., 1994 Izotov, Y. I., Thuan, T. X., and Lipovetsky, V. A.: 1994, Astrophys. J. 435, 647 (ITL94)
- Izotov et al., 1997b Izotov, Y. I., Thuan, T. X., and Lipovetsky, V. A.: 1997b, Astrophys. J., Suppl. Ser. 108, 1 (ITL97)
- Jamet et al., 2005 Jamet, L., Stasińska, G., Pérez, E., González-Delgado, R. M., and Vílchez, J. M.: 2005, Astron. Astrophys. 444, 723
- Jarrett et al., 2003 Jarrett, T. H., Chester, T., Cutri, R., Schneider, S. E., and Huchra, J. P.: 2003, Astron. J. 125, 525
- Jiménez-Benito et al., 2000 Jiménez-Benito, L., Díaz, A. I., Terlevich, R., and Terlevich, E.: 2000, Mon. Not. R. Astron. Soc. 317, 907
- Jogee et al., 2005 Jogee, S., Scoville, N., and Kenney, J. D. P.: 2005, Astrophys. J. 630, 837
- Kauffmann et al., 2003 Kauffmann, G., Heckman, T. M., Tremonti, C., Brinchmann, J., Charlot, S., White, S. D. M., Ridgway, S. E., Brinkmann, J., Fukugita, M., Hall, P. B., Ivezić, Ž., Richards, G. T., and Schneider, D. P.: 2003, Mon. Not. R. Astron. Soc. 346, 1055
- Kenney et al., 1992 Kenney, J. D. P., Wilson, C. D., Scoville, N. Z., Devereux, N. A., and Young, J. S.: 1992, Astrophys. J. Letters 395, L79
- Kennicutt et al., 2003 Kennicutt, R. C., Bresolin, F., and Garnett, D. R.: 2003, Astrophys. J. 591, 801(KBG03)
- Kennicutt, 1989 Kennicutt, Jr., R. C.: 1989, Astrophys. J. 344, 685
- Kennicutt, 1992 Kennicutt, Jr., R. C.: 1992, Astrophys. J., Suppl. Ser. 79, 255
- Kennicutt, 1998a Kennicutt, Jr., R. C.: 1998a, Ann. Rev. Astron. Astrophys. 36, 189
- Kennicutt, 1998b Kennicutt, Jr., R. C.: 1998b, Astrophys. J. 498, 541
- Kennicutt and Garnett, 1996 Kennicutt, Jr., R. C. and Garnett, D. R.: 1996, Astrophys. J. 456, 504
- Kennicutt et al., 1989 Kennicutt, Jr., R. C., Keel, W. C., and Blaha, C. A.: 1989, Astron. J. 97, 1022
- Kennicutt et al., 1987 Kennicutt, Jr., R. C., Roettiger, K. A., Keel, W. C., van der Hulst, J. M., and Hummel, E.: 1987, Astron. J. 93, 1011
- Kewley et al., 2001 Kewley, L. J., Dopita, M. A., Sutherland, R. S., Heisler, C. A., and Trevena, J.: 2001, Astrophys. J. 556, 121
- Kewley and Ellison, 2008 Kewley, L. J. and Ellison, S. L.: 2008, ArXiv e-prints 801
- Kingdon and Ferland, 1995 Kingdon, J. and Ferland, G. J.: 1995, Astrophys. J. 442, 714
- Knapen et al., 1992 Knapen, J. H., Beckman, J. E., Cepa, J., van der Hulst, T., and Rand, R. J.: 1992, Astrophys. J. Letters 385, L37
- Kniazev et al., 2003 Kniazev, A. Y., Grebel, E. K., Hao, L., Strauss, M. A., Brinkmann, J., and Fukugita, M.: 2003, Astrophys. J. Letters 593, L73
- Kniazev et al., 2004 Kniazev, A. Y., Pustilnik, S. A., Grebel, E. K., Lee, H., and Pramskij, A. G.: 2004, Astrophys. J., Suppl. Ser. 153, 429
- Kobulnicky et al., 1999 Kobulnicky, H. A., Kennicutt, Jr., R. C., and Pizagno, J. L.: 1999, Astrophys. J. 514, 544
- Koo et al., 1994 Koo, D. C., Bershady, M. A., Wirth, G. D., Stanford, S. A., and Majewski, S. R.: 1994, Astrophys. J. Letters 427, L9
- Koo et al., 1995 Koo, D. C., Guzmán, R., Faber, S. M., Illingworth, G. D., Bershady, M. A., Kron, R. G., and Takamiya, M.: 1995, Astrophys. J. Letters 440, L49
- Kouwenhoven and de Grijs, 2007 Kouwenhoven, M. B. N. and de Grijs, R.: 2007, astro-ph/0710.1207
- Kregel and Sancisi, 2001 Kregel, M. and Sancisi, R.: 2001, Astron. Astrophys. 376, 59
- Kroupa, 2002 Kroupa, P.: 2002, Science 295, 82
- Kunth and Östlin, 2000 Kunth, D. and Östlin, G.: 2000, Astron. Astrophys. Rev 10, 1
- Kunth and Sargent, 1983 Kunth, D. and Sargent, W. L. W.: 1983, Astrophys. J. 273, 81
- Kurtz and Mink, 1998 Kurtz, M. J. and Mink, D. J.: 1998, Publ. Astron. Soc. Pac. 110, 934
- Lamareille et al., 2004 Lamareille, F., Mouhcine, M., Contini, T., Lewis, I., and Maddox, S.: 2004, Mon. Not. R. Astron. Soc. 350, 396
- Larsen et al., 2001 Larsen, S. S., Brodie, J. P., Elmegreen, B. G., Efremov, Y. N., Hodge, P. W., and Richtler, T.: 2001, Astrophys. J. 556, 801
- Larsen et al., 2004 Larsen, S. S., Brodie, J. P., and Hunter, D. A.: 2004, Astron. J. 128, 2295
- Larson and Tinsley, 1978 Larson, R. B. and Tinsley, B. M.: 1978, Astrophys. J. 219, 46
- Lee et al., 2004 Lee, J. C., Salzer, J. J., and Melbourne, J.: 2004, Astrophys. J. 616, 752 (L04)
- Leitherer and Heckman, 1995 Leitherer, C. and Heckman, T. M.: 1995, Astrophys. J., Suppl. Ser. 96, 9
- Leitherer et al., 1992 Leitherer, C., Robert, C., and Drissen, L.: 1992, Astrophys. J. 401, 596
- Leitherer et al., 1999 Leitherer, C., Schaerer, D., Goldader, J. D., Delgado, R. M. G., Robert, C., Kune, D. F., de Mello, D. F., Devost, D., and Heckman, T. M.: 1999, Astrophys. J., Suppl. Ser. 123, 3
- Lennon and Burke, 1994 Lennon, D. J. and Burke, V. M.: 1994, Astron. and Astrophys. Suppl. Sries 103, 273
- Liu and Kennicutt, 1995 Liu, C. T. and Kennicutt, Jr., R. C.: 1995, Astrophys. J. 450, 547
- Liu, 2006 Liu, X.-W.: 2006, in M. J. Barlow and R. H. Méndez (eds.), Planetary Nebulae in our Galaxy and Beyond, Vol. 234 of IAU Symposium, pp 219–226
- Liu et al., 2006 Liu, X.-W., Barlow, M. J., Zhang, Y., Bastin, R. J., and Storey, P. J.: 2006, Mon. Not. R. Astron. Soc. 368, 1959
- Liu et al., 2001 Liu, X.-W., Luo, S.-G., Barlow, M. J., Danziger, I. J., and Storey, P. J.: 2001, Mon. Not. R. Astron. Soc. 327, 141
- Liu et al., 2000 Liu, X.-W., Storey, P. J., Barlow, M. J., Danziger, I. J., Cohen, M., and Bryce, M.: 2000, Mon. Not. R. Astron. Soc. 312, 585
- López, 2005a López, J.: 2005a, MSc Thesis, INAOE
- López, 2005b López, J.: 2005b, MSc Thesis, INAOE
- Luridiana et al., 2003 Luridiana, V., Peimbert, A., Peimbert, M., and Cerviño, M.: 2003, Astrophys. J. 592, 846
- Luridiana et al., 1999 Luridiana, V., Peimbert, M., and Leitherer, C.: 1999, Astrophys. J. 527, 110
- Macchetto et al., 1990 Macchetto, F., Colina, L., Golombek, D., Perryman, M. A. C., and di Serego Alighieri, S.: 1990, Astrophys. J. 356, 389
- Maoz et al., 2001 Maoz, D., Barth, A. J., Ho, L. C., Sternberg, A., and Filippenko, A. V.: 2001, Astron. J. 121, 3048
- Maoz et al., 1996 Maoz, D., Barth, A. J., Sternberg, A., Filippenko, A. V., Ho, L. C., Macchetto, F. D., Rix, H.-W., and Schneider, D. P.: 1996, Astron. J. 111, 2248
- Marconi et al., 2006 Marconi, A., Pastorini, G., Pacini, F., Axon, D. J., Capetti, A., Macchetto, D., Koekemoer, A. M., and Schreier, E. J.: 2006, Astron. Astrophys. 448, 921
- Mas-Hesse and Kunth, 1991 Mas-Hesse, J. M. and Kunth, D.: 1991, Astron. and Astrophys. Suppl. Sries 88, 399
- Mas-Hesse et al., 2003 Mas-Hesse, J. M., Kunth, D., Tenorio-Tagle, G., Leitherer, C., Terlevich, R. J., and Terlevich, E.: 2003, Astrophys. J. 598, 858
- Mateus et al., 2007 Mateus, A., Sodré, L., Cid Fernandes, R., and Stasińska, G.: 2007, Mon. Not. R. Astron. Soc. 374, 1457
- Mateus et al., 2006 Mateus, A., Sodré, L., Cid Fernandes, R., Stasińska, G., Schoenell, W., and Gomes, J. M.: 2006, Mon. Not. R. Astron. Soc. 370, 721
- McCall and Schmidt, 1986 McCall, M. L. and Schmidt, F. H.: 1986, Astrophys. J. 311, 548
- McCrady et al., 2003 McCrady, N., Gilbert, A. M., and Graham, J. R.: 2003, Astrophys. J. 596, 240
- McCrady and Graham, 2007 McCrady, N. and Graham, J. R.: 2007, Astrophys. J. 663, 844
- McGaugh, 1991 McGaugh, S. S.: 1991, Astrophys. J. 380, 140
- Melbourne et al., 2004 Melbourne, J., Phillips, A., Salzer, J. J., Gronwall, C., and Sarajedini, V. L.: 2004, Astron. J. 127, 686 (M04)
- Melnick et al., 1999 Melnick, J., Tenorio-Tagle, G., and Terlevich, R.: 1999, Mon. Not. R. Astron. Soc. 302, 677
- Melnick et al., 1985a Melnick, J., Terlevich, R., and Eggleton, P. P.: 1985a, Mon. Not. R. Astron. Soc. 216, 255
- Melnick et al., 1985b Melnick, J., Terlevich, R., and Moles, M.: 1985b, Revista Mexicana de Astronomia y Astrofisica 11, 91
- Melnick et al., 1988 Melnick, J., Terlevich, R., and Moles, M.: 1988, Mon. Not. R. Astron. Soc. 235, 297
- Melnick et al., 2000 Melnick, J., Terlevich, R., and Terlevich, E.: 2000, Mon. Not. R. Astron. Soc. 311
- Mengel et al., 2005 Mengel, S., Lehnert, M. D., Thatte, N., and Genzel, R.: 2005, Astron. Astrophys. 443, 41
- Mengel et al., 2008 Mengel, S., Lehnert, M. D., Thatte, N. A., Vacca, W. D., Whitmore, B., and Chandar, R.: 2008, ArXiv e-prints 805
- Meurer et al., 1995 Meurer, G. R., Heckman, T. M., Leitherer, C., Kinney, A., Robert, C., and Garnett, D. R.: 1995, Astron. J. 110, 2665
- Meynet et al., 1994 Meynet, G., Maeder, A., Schaller, G., Schaerer, D., and Charbonnel, C.: 1994, Astron. and Astrophys. Suppl. Sries 103, 97
- Miller et al., 1997 Miller, B. W., Whitmore, B. C., Schweizer, F., and Fall, S. M.: 1997, Astron. J. 114, 2381
- Miller and Mathews, 1972 Miller, J. S. and Mathews, W. G.: 1972, Astrophys. J. 172, 593
- Mollá et al., 2006 Mollá, M., Vílchez, J. M., Gavilán, M., and Díaz, A. I.: 2006, Mon. Not. R. Astron. Soc. 372, 1069
- Morgan, 1958 Morgan, W. W.: 1958, Publ. Astron. Soc. Pac. 70, 364
- Morisset et al., 2004 Morisset, C., Schaerer, D., Bouret, J.-C., and Martins, F.: 2004, Astron. Astrophys. 415, 577
- Mould et al., 2000 Mould, J. R., Huchra, J. P., Freedman, W. L., Kennicutt, Jr., R. C., Ferrarese, L., Ford, H. C., Gibson, B. K., Graham, J. A., Hughes, S. M. G., Illingworth, G. D., Kelson, D. D., Macri, L. M., Madore, B. F., Sakai, S., Sebo, K. M., Silbermann, N. A., and Stetson, P. B.: 2000, Astrophys. J. 529, 786
- Mulder and van Driel, 1996 Mulder, P. S. and van Driel, W.: 1996, Astron. Astrophys. 309, 403
- Mulder et al., 1995 Mulder, P. S., van Driel, W., and Braine, J.: 1995, Astron. Astrophys. 300, 687
- Nagao et al., 2006 Nagao, T., Maiolino, R., and Marconi, A.: 2006, Astron. Astrophys. 459, 85
- Nelson and Whittle, 1995 Nelson, C. H. and Whittle, M.: 1995, Astrophys. J., Suppl. Ser. 99, 67
- Noeske et al., 2005 Noeske, K. G., Papaderos, P., Cairós, L. M., and Fricke, K. J.: 2005, Astron. Astrophys. 429, 115
- Oke, 1990 Oke, J. B.: 1990, Astron. J. 99, 1621
- Oke and Gunn, 1983 Oke, J. B. and Gunn, J. E.: 1983, Astrophys. J. 266, 713
- Olive and Skillman, 2001 Olive, K. A. and Skillman, E. D.: 2001, New Astronomy 6, 119
- Olive and Skillman, 2004 Olive, K. A. and Skillman, E. D.: 2004, Astrophys. J. 617, 29
- Origlia et al., 2001 Origlia, L., Leitherer, C., Aloisi, A., Greggio, L., and Tosi, M.: 2001, Astron. J. 122, 815
- Origlia et al., 2004 Origlia, L., Ranalli, P., Comastri, A., and Maiolino, R.: 2004, Astrophys. J. 606, 862
- Osterbrock, 1989 Osterbrock, D. E.: 1989, Astrophysics of gaseous nebulae and active galactic nuclei, Mill Valley, CA, University Science Books
- Osterbrock et al., 1996 Osterbrock, D. E., Fulbright, J. P., Martel, A. R., Keane, M. J., Trager, S. C., and Basri, G.: 1996, Publ. Astron. Soc. Pac. 108, 277
- Östlin et al., 2004 Östlin, G., Cumming, R. J., Amram, P., Bergvall, N., Kunth, D., Márquez, I., Masegosa, J., and Zackrisson, E.: 2004, Astron. Astrophys. 419, L43
- Pagel et al., 1979 Pagel, B. E. J., Edmunds, M. G., Blackwell, D. E., Chun, M. S., and Smith, G.: 1979, Mon. Not. R. Astron. Soc. 189, 95
- Pagel et al., 1992 Pagel, B. E. J., Simonson, E. A., Terlevich, R. J., and Edmunds, M. G.: 1992, Mon. Not. R. Astron. Soc. 255, 325
- Palacios et al., 1997 Palacios, J., García-Vargas, M. L., Díaz, A., Terlevich, R., and Terlevich, E.: 1997, Astron. Astrophys. 323, 749
- Pasquali and Castangia, 2008 Pasquali, A. and Castangia, P.: 2008, Mon. Not. R. Astron. Soc. 385, 468
- Pastorini et al., 2007 Pastorini, G., Marconi, A., Capetti, A., Axon, D. J., Alonso-Herrero, A., Atkinson, J., Batcheldor, D., Carollo, C. M., Collett, J., Dressel, L., Hughes, M. A., Macchetto, D., Maciejewski, W., Sparks, W., and van der Marel, R.: 2007, Astron. Astrophys. 469, 405
- Pastoriza et al., 1993 Pastoriza, M. G., Dottori, H. A., Terlevich, E., Terlevich, R., and Diaz, A. I.: 1993, Mon. Not. R. Astron. Soc. 260, 177
- Pauldrach et al., 2001 Pauldrach, A. W. A., Hoffmann, T. L., and Lennon, M.: 2001, Astron. Astrophys. 375, 161
- Peimbert, 2003 Peimbert, A.: 2003, Astrophys. J. 584, 735
- Peimbert et al., 2002 Peimbert, A., Peimbert, M., and Luridiana, V.: 2002, Astrophys. J. 565, 668
- Peimbert et al., 2005 Peimbert, A., Peimbert, M., and Ruiz, M. T.: 2005, Astrophys. J. 634, 1056
- Peimbert, 1967 Peimbert, M.: 1967, Astrophys. J. 150, 825
- Peimbert, 1971 Peimbert, M.: 1971, Boletin de los Observatorios Tonantzintla y Tacubaya 6, 29
- Peimbert and Costero, 1969 Peimbert, M. and Costero, R.: 1969, Boletin de los Observatorios Tonantzintla y Tacubaya 5, 3
- Peimbert and Peimbert, 2003 Peimbert, M. and Peimbert, A.: 2003, in Revista Mexicana de Astronomia y Astrofisica Conference Series, Vol. 16, pp 113–116
- Peimbert and Peimbert, 2006 Peimbert, M. and Peimbert, A.: 2006, in M. J. Barlow and R. H. Méndez (eds.), Planetary Nebulae in our Galaxy and Beyond, Vol. 234 of IAU Symposium, pp 227–234
- Peimbert et al., 2007 Peimbert, M., Peimbert, A., Esteban, C., García-Rojas, J., Bresolin, F., Carigi, L., Ruiz, M. T., and López-Sánchez, A. R.: 2007, in Revista Mexicana de Astronomia y Astrofisica Conference Series, Vol. 29 of Revista Mexicana de Astronomia y Astrofisica Conference Series, pp 72–79
- Peimbert et al., 2000 Peimbert, M., Peimbert, A., and Ruiz, M. T.: 2000, Astrophys. J. 541, 688
- Peimbert et al., 2004 Peimbert, M., Peimbert, A., Ruiz, M. T., and Esteban, C.: 2004, Astrophys. J., Suppl. Ser. 150, 431
- Peimbert and Torres-Peimbert, 1992 Peimbert, M. and Torres-Peimbert, S.: 1992, Astron. Astrophys. 253, 349
- Pérez et al., 2000 Pérez, E., Márquez, I., Marrero, I., Durret, F., González Delgado, R. M., Masegosa, J., Maza, J., and Moles, M.: 2000, Astron. Astrophys. 353, 893
- Pérez-Montero and Díaz, 2003 Pérez-Montero, E. and Díaz, A. I.: 2003, Mon. Not. R. Astron. Soc. 346, 105 (PMD03)
- Pérez-Montero and Díaz, 2005 Pérez-Montero, E. and Díaz, A. I.: 2005, Mon. Not. R. Astron. Soc. 361, 1063
- Pérez-Montero and Díaz, 2007 Pérez-Montero, E. and Díaz, A. I.: 2007, Mon. Not. R. Astron. Soc. 377, 1195
- Pérez-Montero et al., 2006 Pérez-Montero, E., Díaz, A. I., Vílchez, J. M., and Kehrig, C.: 2006, Astron. Astrophys. 449, 193
- Pérez-Montero et al., 2007 Pérez-Montero, E., Hägele, G. F., Contini, T., and Díaz, Á. I.: 2007, Mon. Not. R. Astron. Soc. 381, 125
- Pérez-Olea, 1996 Pérez-Olea, D.: 1996, PhD Thesis, Universidad Autónoma de Madrid
- Pettini et al., 2001 Pettini, M., Shapley, A. E., Steidel, C. C., Cuby, J.-G., Dickinson, M., Moorwood, A. F. M., Adelberger, K. L., and Giavalisco, M.: 2001, Astrophys. J. 554, 981
- Pettini et al., 2000 Pettini, M., Steidel, C. C., Adelberger, K. L., Dickinson, M., and Giavalisco, M.: 2000, Astrophys. J. 528, 96
- Phillips et al., 1984 Phillips, M. M., Pagel, B. E. J., Edmunds, M. G., and Díaz, A.: 1984, Mon. Not. R. Astron. Soc. 210, 701
- Pilyugin, 2000 Pilyugin, L. S.: 2000, Astron. Astrophys. 362, 325
- Pilyugin, 2007 Pilyugin, L. S.: 2007, Mon. Not. R. Astron. Soc. 375, 685
- Pilyugin et al., 2006 Pilyugin, L. S., Thuan, T. X., and Vílchez, J. M.: 2006, Mon. Not. R. Astron. Soc. 367, 1139
- Pilyugin et al., 2004 Pilyugin, L. S., Vílchez, J. M., and Contini, T.: 2004, Astron. Astrophys. 425, 849
- Piner et al., 1995 Piner, B. G., Stone, J. M., and Teuben, P. J.: 1995, Astrophys. J. 449, 508
- Pizzella et al., 2004 Pizzella, A., Corsini, E. M., Vega Beltrán, J. C., and Bertola, F.: 2004, Astron. Astrophys. 424, 447
- Planesas et al., 1997 Planesas, P., Colina, L., and Pérez-Olea, D.: 1997, Astron. Astrophys. 325, 81
- Popescu and Hopp, 2000 Popescu, C. C. and Hopp, U.: 2000, Astron. and Astrophys. Suppl. Sries 142, 247
- Porter et al., 2005 Porter, R. L., Bauman, R. P., Ferland, G. J., and MacAdam, K. B.: 2005, Astrophys. J. Letters 622, L73
- Prada et al., 1994 Prada, F., Greve, A., and McKeith, C. D.: 1994, Astron. Astrophys. 288, 396
- Pradhan, 1976 Pradhan, A. K.: 1976, Mon. Not. R. Astron. Soc. 177, 31
- Puxley et al., 1990 Puxley, P. J., Hawarden, T. G., and Mountain, C. M.: 1990, Astrophys. J. 364, 77
- Ramsbottom et al., 1996 Ramsbottom, C. A., Bell, K. L., and Stafford, R. P.: 1996, Atomic Data and Nuclear Data Tables 63, 57
- Rieke and Lebofsky, 1978 Rieke, G. H. and Lebofsky, M. J.: 1978, Astrophys. J. Letters 220, L37
- Rieke et al., 1993 Rieke, G. H., Loken, K., Rieke, M. J., and Tamblyn, P.: 1993, Astrophys. J. 412, 99
- Rieke and Low, 1972 Rieke, G. H. and Low, F. J.: 1972, Astrophys. J. Letters 176, L95+
- Roberts et al., 1979 Roberts, Jr., W. W., Huntley, J. M., and van Albada, G. D.: 1979, Astrophys. J. 233, 67
- Rodríguez and Rubin, 2004 Rodríguez, M. and Rubin, R. H.: 2004, in IAU Symp. 217, Recycling Intergallactic and Interstellar Matter, ed. P. A. Duc, J. Braine, and E. Brinks (San Francisco: ASP), pp 188–+ (astro–ph/0312246)
- Rola et al., 1997 Rola, C. S., Terlevich, E., and Terlevich, R. J.: 1997, Mon. Not. R. Astron. Soc. 289, 419
- Rosa-González et al., 2007 Rosa-González, D., Schmitt, H. R., Terlevich, E., and Terlevich, R.: 2007, Astrophys. J. 654, 226
- Rubin et al., 2002 Rubin, R. H., Bhatt, N. J., Dufour, R. J., Buckalew, B. A., Barlow, M. J., Liu, X.-W., Storey, P. J., Balick, B., Ferland, G. J., Harrington, J. P., and Martin, P. G.: 2002, Mon. Not. R. Astron. Soc. 334, 777
- Rubin et al., 1975 Rubin, V. C., Peterson, C. J., and Ford, Jr., W. K.: 1975, Astrophys. J. 199, 39
- Ruiz et al., 2003 Ruiz, M. T., Peimbert, A., Peimbert, M., and Esteban, C.: 2003, Astrophys. J. 595, 247
- Sakamoto et al., 1999 Sakamoto, K., Okumura, S. K., Ishizuki, S., and Scoville, N. Z.: 1999, Astrophys. J. 525, 691
- Salpeter, 1955 Salpeter, E. E.: 1955, Astrophys. J. 121, 161
- Sánchez-Portal et al., 2000 Sánchez-Portal, M., Díaz, Á. I., Terlevich, R., Terlevich, E., Álvarez Álvarez, M., and Aretxaga, I.: 2000, Mon. Not. R. Astron. Soc. 312, 2
- Sargent, 1970 Sargent, W. L. W.: 1970, Astrophys. J. 160, 405
- Sargent and Searle, 1970 Sargent, W. L. W. and Searle, L.: 1970, Astrophys. J. Letters 162, L155+
- Schulte-Ladbeck et al., 1998 Schulte-Ladbeck, R. E., Crone, M. M., and Hopp, U.: 1998, Astrophys. J. Letters 493, L23+
- Searle and Sargent, 1972 Searle, L. and Sargent, W. L. W.: 1972, Astrophys. J. 173, 25
- Searle et al., 1973 Searle, L., Sargent, W. L. W., and Bagnuolo, W. G.: 1973, Astrophys. J. 179, 427
- Sérsic and Pastoriza, 1965 Sérsic, J. L. and Pastoriza, M.: 1965, Publ. Astron. Soc. Pac. 77, 287
- Sérsic and Pastoriza, 1967 Sérsic, J. L. and Pastoriza, M.: 1967, Publ. Astron. Soc. Pac. 79, 152
- Shaw and Dufour, 1995 Shaw, R. A. and Dufour, R. J.: 1995, Publ. Astron. Soc. Pac. 107, 896
- Sheth et al., 2005 Sheth, K., Vogel, S. N., Regan, M. W., Thornley, M. D., and Teuben, P. J.: 2005, Astrophys. J. 632, 217
- Shields and Kennicutt, 1995 Shields, J. C. and Kennicutt, Jr., R. C.: 1995, Astrophys. J. 454, 807
- Siegel et al., 2005 Siegel, E. R., Guzmán, R., Gallego, J. P., Orduña López, M., and Rodríguez-Hidalgo, P.: 2005, Mon. Not. R. Astron. Soc. 356, 1117
- Skillman and Kennicutt, 1993 Skillman, E. D. and Kennicutt, Jr., R. C.: 1993, Astrophys. J. 411, 655 (SK93)
- Skillman et al., 1994 Skillman, E. D., Televich, R. J., Kennicutt, Jr., R. C., Garnett, D. R., and Terlevich, E.: 1994, Astrophys. J. 431, 172 (S94)
- Smith et al., 2005 Smith, B. J., Struck, C., Appleton, P. N., Charmandaris, V., Reach, W., and Eitter, J. J.: 2005, Astron. J. 130, 2117
- Smith et al., 1996 Smith, D. A., Neff, S. G., Bothun, G. D., Fanelli, M. N., Offenberg, J. D., Waller, W. H., Bohlin, R. C., O’Connell, R. W., Roberts, M. S., Smith, A. M., and Stecher, T. P.: 1996, Astrophys. J. Letters 473, L21+
- Smith et al., 2002 Smith, L. J., Norris, R. P. F., and Crowther, P. A.: 2002, Mon. Not. R. Astron. Soc. 337, 1309
- Stasińska and Izotov, 2003 Stasińska, G. and Izotov, Y.: 2003, Astron. Astrophys. 397, 71
- Stasińska, 1978 Stasińska, G.: 1978, Astron. Astrophys. 66, 257
- Stasińska, 1980 Stasińska, G.: 1980, Astron. Astrophys. 84, 320
- Stasińska, 1990 Stasińska, G.: 1990, Astron. and Astrophys. Suppl. Sries 83, 501
- Stasińska, 2005 Stasińska, G.: 2005, Astron. Astrophys. 434, 507
- Stasińska, 2006 Stasińska, G.: 2006, Astron. Astrophys. 454, L127
- Stasińska and Leitherer, 1996 Stasińska, G. and Leitherer, C.: 1996, Astrophys. J., Suppl. Ser. 107, 661
- Stauffer, 1982 Stauffer, J. R.: 1982, Astrophys. J., Suppl. Ser. 50, 517
- Storey and Hummer, 1995 Storey, P. J. and Hummer, D. G.: 1995, Mon. Not. R. Astron. Soc. 272, 41
- Stoughton and et al., 2002 Stoughton, C. and et al.: 2002, Astron. J. 123, 485
- Swartz et al., 2006 Swartz, D. A., Yukita, M., Tennant, A. F., Soria, R., and Ghosh, K. K.: 2006, Astrophys. J. 647, 1030
- Tayal and Gupta, 1999 Tayal, S. S. and Gupta, G. P.: 1999, Astrophys. J. 526, 544
- Telesco, 1988 Telesco, C. M.: 1988, Ann. Rev. Astron. Astrophys. 26, 343
- Telesco and Decher, 1988 Telesco, C. M. and Decher, R.: 1988, Astrophys. J. 334, 573
- Telesco and Gatley, 1984 Telesco, C. M. and Gatley, I.: 1984, Astrophys. J. 284, 557
- Telesco and Harper, 1980 Telesco, C. M. and Harper, D. A.: 1980, Astrophys. J. 235, 392
- Telles et al., 1997 Telles, E., Melnick, J., and Terlevich, R.: 1997, Mon. Not. R. Astron. Soc. 288, 78
- Temporin et al., 2003 Temporin, S., Ciroi, S., Rafanelli, P., Radovich, M., Vennik, J., Richter, G. M., and Birkle, K.: 2003, Astrophys. J., Suppl. Ser. 148, 353
- Terlevich et al., 1990 Terlevich, E., Terlevich, R., Díaz, A. I., Pastoriza, M. G., and Dottori, H.: 1990, Mon. Not. R. Astron. Soc. 242, 48P
- Terlevich et al., 2003 Terlevich, E., Terlevich, R., and Melnick, J.: 2003, in J. M. Rodriguez-Espinoza, F. Garzon Lopez, and V. Melo Martin (eds.), Revista Mexicana de Astronomia y Astrofisica Conference Series, pp 213–215
- Terlevich et al., 1991 Terlevich, R., Melnick, J., Masegosa, J., Moles, M., and Copetti, M. V. F.: 1991, Astron. and Astrophys. Suppl. Sries 91, 285 (T91)
- Thronson and Greenhouse, 1988 Thronson, Jr., H. A. and Greenhouse, M. A.: 1988, Astrophys. J. 327, 671
- Tinsley, 1968 Tinsley, B. M.: 1968, Astrophys. J. 151, 547
- Tinsley, 1972 Tinsley, B. M.: 1972, Astron. Astrophys. 20, 383
- Tonry and Davis, 1979 Tonry, J. and Davis, M.: 1979, Astron. J. 84, 1511
- Trancho et al., 2007 Trancho, G., Bastian, N., Miller, B. W., and Schweizer, F.: 2007, Astrophys. J. 664, 284
- Tsamis et al., 2003 Tsamis, Y. G., Barlow, M. J., Liu, X.-W., Danziger, I. J., and Storey, P. J.: 2003, Mon. Not. R. Astron. Soc. 338, 687
- Tsamis and Péquignot, 2005 Tsamis, Y. G. and Péquignot, D.: 2005, Mon. Not. R. Astron. Soc. 364, 687
- Ugryumov et al., 2003 Ugryumov, A. V., Engels, D., Pustilnik, S. A., Kniazev, A. Y., Pramskij, A. G., and Hagen, H.-J.: 2003, Astron. Astrophys. 397, 463
- van der Kruit, 1976 van der Kruit, P. C.: 1976, Astron. Astrophys. 49, 161
- van der Kruit and de Bruyn, 1976 van der Kruit, P. C. and de Bruyn, A. G.: 1976, Astron. Astrophys. 48, 373
- van Zee, 2000 van Zee, L.: 2000, Astrophys. J. Letters 543, L31
- Vázquez and Leitherer, 2005 Vázquez, G. A. and Leitherer, C.: 2005, Astrophys. J. 621, 695
- Vermeij and van der Hulst, 2002 Vermeij, R. and van der Hulst, J. M.: 2002, Astron. Astrophys. 391, 1081
- Vílchez et al., 1988 Vílchez, J. M., Pagel, B. E. J., Díaz, A. I., Terlevich, E., and Edmunds, M. G.: 1988, Mon. Not. R. Astron. Soc. 235, 633
- Vila-Costas and Edmunds, 1992 Vila-Costas, M. B. and Edmunds, M. G.: 1992, Mon. Not. R. Astron. Soc. 259, 121
- Vílchez and Esteban, 1996 Vílchez, J. M. and Esteban, C.: 1996, Mon. Not. R. Astron. Soc. 280, 720
- Vílchez and Pagel, 1988 Vílchez, J. M. and Pagel, B. E. J.: 1988, Mon. Not. R. Astron. Soc. 231, 257
- Wang et al., 2004 Wang, W., Liu, X.-W., Zhang, Y., and Barlow, M. J.: 2004, Astron. Astrophys. 427, 873
- Weaver and Woosley, 1993 Weaver, T. A. and Woosley, S. E.: 1993, Phys. Rep. 227, 65
- Wesson et al., 2005 Wesson, R., Liu, X.-W., and Barlow, M. J.: 2005, Mon. Not. R. Astron. Soc. 362, 424
- Whitmore and Schweizer, 1995 Whitmore, B. C. and Schweizer, F.: 1995, Astron. J. 109, 960
- Whitmore et al., 1993 Whitmore, B. C., Schweizer, F., Leitherer, C., Borne, K., and Robert, C.: 1993, Astron. J. 106, 1354
- Whitmore et al., 1999 Whitmore, B. C., Zhang, Q., Leitherer, C., Fall, S. M., Schweizer, F., and Miller, B. W.: 1999, Astron. J. 118, 1551
- Woods and Geller, 2007 Woods, D. F. and Geller, M. J.: 2007, Astron. J. 134, 527
- Woods et al., 2006 Woods, D. F., Geller, M. J., and Barton, E. J.: 2006, Astron. J. 132, 197
- Xu and Sulentic, 1991 Xu, C. and Sulentic, J. W.: 1991, Astrophys. J. 374, 407
- Zaritsky et al., 1994 Zaritsky, D., Kennicutt, Jr., R. C., and Huchra, J. P.: 1994, Astrophys. J. 420, 87
- Zeippen, 1982 Zeippen, C. J.: 1982, Mon. Not. R. Astron. Soc. 198, 111
- Zeippen et al., 1987 Zeippen, C. J., Le Bourlot, J., and Butler, K.: 1987, Astron. Astrophys. 188, 251
- Zepf et al., 1999 Zepf, S. E., Ashman, K. M., English, J., Freeman, K. C., and Sharples, R. M.: 1999, Astron. J. 118, 752
- Zwicky, 1966 Zwicky, F.: 1966, Astrophys. J. 143, 192
| SDSS J0021 | SDSS J0032 | SDSS J1624 | |||||
|---|---|---|---|---|---|---|---|
| (Å) | WHT | SDSS | WHT | SDSS | WHT | SDSS | |
| 4471 | 0.0860.006 | 0.0770.006 | 0.0760.004 | 0.0740.006 | 0.0860.003 | 0.0790.002 | |
| 5876 | 0.0960.005 | 0.0940.006 | 0.0960.004 | 0.0880.003 | 0.1040.002 | 0.0860.002 | |
| 6678 | 0.0870.004 | 0.0890.006 | 0.0890.004 | 0.0790.001 | 0.0940.005 | 0.0910.005 | |
| 7065 | 0.0940.005 | 0.1020.006 | 0.0860.009 | 0.0760.006 | 0.1040.008 | 0.0990.007 | |
| adopted | 0.0900.005 | 0.0900.009 | 0.0870.007 | 0.0800.005 | 0.0980.007 | 0.0850.009 | |
| 4686 | 0.00060.0001 | 0.00040.0001 | 0.00110.0001 | 0.00130.0001 | 0.00080.0001 | 0.00070.0001 | |
| (He/H) | 0.0910.005 | 0.0900.009 | 0.0880.007 | 0.0810.005 | 0.0980.007 | 0.0850.009 | |
Forbidden lines
We have derived appropriate fittings to the IONIC task results following the functional form given by Pagel et al. [1992MNRAS.255..325P]. In Figure 2.11 we show an example of these fittings, the abundance of the nitrogen one time ionized as function of its corresponding temperatures. The expressions for these functions are listed below:
where denotes the appropriate line electron temperature, in units of 10 K, corresponding to the assumed ionization structure as explained below.
-Oxygen The oxygen ionic abundance ratios, O/H and O/H, have been derived from the [Oii] 3727,29 Å and [Oiii] 4959, 5007 Å lines respectively using for each ion its corresponding temperature.
-Sulphur. In the same way, we have derived S/H and S/H, abundances using T([Sii]) and T([Siii]) values and the fluxes of the [Sii] emission lines at 6717,6731 Å and the near-IR [Siii] 9069, 9532 Å lines respectively.
-Nitrogen. The ionic abundance of nitrogen, N/H has been derived from the intensities of the 6548, 6584 Å lines and the derived electron temperature of [Nii] in the case of SDSS J0021 and SDSS J1624 for the WHT objects, and SDSS J1729 for the CAHA objects. For the rest of the objects the assumption T([Nii]) T([Oii]) has been made.
-Neon. Neon is only visible in all the spectra via the [Neiii] emission line at 3868 Å, then Ne has been derived using this line. For this ion we have taken the electron temperature of [Oiii], as representative of the high excitation zone (T([Neiii]) T([Oiii]); Peimbert and Costero 1969).
-Argon. The main ionization states of Ar in ionized regions are Ar and Ar. The abundance of Ar has been calculated from the measured [Ariii] 7136 Å line emission assuming that T([Ariii]) T([Siii]) [1992AJ....103.1330G], while the ionic abundance of Ar has been calculated from the emission line of [Ariv] 4740 Å under the assumption that T([Ariv]) T([Oiii]). We could have used the blended emission line [Ariv]+HeI at 4713 Å subtracting the helium contribution. However, due to the relative abundance of these species and the signal-to-noise ratio of this blended line, we prefer not to estimate this ionic abundance with such a large error.
-Iron. Finally, for iron we have used the emission line of [Feiii] 4658 Å to calculate Fe assuming T([Feiii]) T([Oiii]).
The ionic abundances of the different elements with respect to ionized hydrogen along with their corresponding errors are given in Tables LABEL:ion-absWHT and LABEL:ion-absCAHA for the WHT and CAHA objects, respectively.
2.5.2 Ionization correction factors and total abundances
For the three WHT objects and for three of the CAHA objects for which the Heii line has been measured, the total abundance of He has been found by adding directly the two ionic abundances:
As was pointed out by Skillman et al. [1994ApJ...431..172S], the potential fraction of unobservable neutral helium is a long lasting problem and represents a source of uncertainty in the derivation of the helium total abundance. The correction factor for He can be approximated by 1.0 for Hii regions ionized by very hot stars (T 40000 K). An estimate of the ionizing stellar temperature for our objects can be obtained from the parameter [1988MNRAS.231..257V]101010The parameter is defined as the ratio of the O/O to the S/S ionic ratios.. The values of log () are -0.35 for two of the observed WHT objects and -0.15 for the other one, and for these three CAHA objects are -0.10, -0.07 and -0.57. In all the cases much smaller than the upper limit of log (), 0.9, for which Pagel et al. [1992MNRAS.255..325P] claim that the correction factor for neutral helium is equal to 1.0.
In Tables 2.5.1 and LABEL:absHeCAHA we present the total helium abundance values for the WHT objects and for these three CAHA objects, respectively, together with their corresponding errors.
At the temperatures derived for our observed galaxies, most of the oxygen is in the form of O and O, therefore the approximation:
has been used.
This is not however the case for sulphur for which a relatively important contribution from S may be expected depending on the nebular excitation. The total sulphur abundance has been calculated using an ICF for S+S according to Barker’s (1980) formula, which is based on the photo-ionization models by Stasińska [1978A&A....66..257S]:
where = 2.5 gives the best fit to the scarce observational data on S abundances (Pérez-Montero et al., 2006).
Although it is customary to write Barker’s expression as a function of the O/(O+O) ionic fraction, it can be reformulated in terms of O/(O+O) since the errors associated to O are considerably smaller than for O. Then, the ICF for S+S is:
We have derived the N/O abundance ratio under the assumption that
and the N/H ratio as:
Classically, the total abundance of neon has been calculated assuming that:
Izotov et al. (2004) point out that this assumption can lead to an overestimate of Ne/H in objects with low excitation, where the charge transfer between O and H becomes important. Nevertheless, in our case, this assumption is probably justified given the high excitation of the observed objects.
For the CAHA objects, the ionization correction factor for neon has been calculated according to the expression given in Chapter §3:
where = O/(O+O). This expression has been derived from photo-ionization models [1998PASP..110..761F], taking as ionizing sources the spectral energy distribution of O and B stars [2001A&A...375..161P].
Given the high excitation of the observed objects there are no significant differences between the total neon abundance derived using this ICF and those estimated using the classical approximation: Ne/O Ne/O.
The total abundance of argon for the WHT objects, following the published values, has been calculated using the ICF(Ar+Ar) given by Izotov et al. (1994) which, in turn, has been derived from the photo-ionization models by Stasińska [1990A&AS...83..501S] as:
For the CAHA objects, as in the case of neon, the total abundance of argon has been calculated using the ionization correction factors (ICF(Ar) and the ICF(Ar+Ar)) given in Chapter §3. We have used the first one only when we cannot derive a value for Ar. The expressions for these ICFs are:
where = O/(O+O).
The ICF for iron twice ionized has been taken from Rodríguez and Rubin [2004IAUS..217..188R]:
In Tables LABEL:total-abs-WHT and LABEL:total-abs-CAHA we list all the total chemical abundances and the ICFs derived for elements heavier than helium for the WHT and CAHA objects, respectively.
2.6 Discussion
2.6.1 Comparison between the WHT and SDSS estimated parameters
In order to compare our results for the WHT objects with those provided by SDSS spectra, we have measured the emission line intensities and equivalent widths on the SLOAN spectra of the three observed objects in the same way as described in Section §2.3. In order to allow an easy comparison between the results on both sets of spectra, we have listed these values in Columns 6-8 of Tables LABEL:ratiostot_wht1-LABEL:ratiostot_wht3.
Strong emission line fluxes relative to H measured on WHT and SDSS spectra differ by less than 10% for SDSS J0032 and SDSS J1624 and about 30% for SDSS J0021. This is partially compensated by differences in the derived reddening constant so that reddening corrected emission line intensities relative to H differ by less that 10% for the [Oii] 3727,29 Å line, about 15% for the weak [Oiii] 4363 Å and [Siii] 6312 Å lines and only a few percent for the strong [Oiii] 5007 Å line. In fact, given the difference in aperture between both sets of observations, 0.5 and 3 arcsec for WHT and SDSS respectively, some differences are to be expected. While we have probably observed the bright cores of the galaxies where most of the light and present star formation is concentrated, the SDSS observations map a more extensive area which could include external diffuse zones. This is evidenced by the more conspicuous underlying stellar population detected in the WHT spectra which leads to lower values of the emission line equivalent widths. The best agreement between the two sets of measurements is found for SDSS J0032 which is probably the most compact object of the three. This is consistent with the fact that the difference in the measured H fluxes is only a factor of 2 and there is close agreement between the measured equivalent widths on the two spectra.
The SDSS spectra have been analyzed following the same methodology as explained in Sections §2.4 and §2.5 for the derivation of temperatures and abundances although, due to the different nature of the observations: different spectral coverage, signal-to-noise ratio and spectral resolution, some further assumptions had to be made. These refer mainly to the temperatures of the different ions. Regarding sulphur, the SDSS data do not reach the 9000-9600 Å range covered by the WHT spectra and therefore it was not possible to determine directly T([Siii]). The relation between t([Siii]) and t([Oiii]) is reproduced in Figure 2.5.1. The sample used for comparison is a compilation of published data for which measurements of the nebular and auroral lines of [Oiii] and [Siii] exist, thus allowing the simultaneous determination of T([Oiii]) and T([Siii]) (Pérez-Montero et al., 2006). The dashed line in the plot corresponds to the theoretical relation based on the grids of photo-ionization models described in Pérez-Montero and Díaz (2005),
which differs slightly from the semi-empirical relation by Garnett (1992) mostly due to the introduction of the new atomic coefficients for S from Tayal and Gupta (1999). The solid line in Figure 2.5.1 corresponds to the actual least-square fit to the data:
The individual errors have not been taken into account in performing the fit. This fit is different from that found by Garnett (1992) that seems to reproduce well the M101 Hii region data analyzed by Kennicutt, Bresolin and Garnett (2003; KBG03). This is mostly due to the larger temperature baseline that we use. The object with the highest T([Siii]) in KBG03 is NGC5471A (12800 K); our sample includes high excitation Hii galaxies with T([Siii]) up to 22000 K, while including at the same time KBG03 sample. The introduction of the high excitation objects make the relation steeper and increases the error of the calibration. This illustrates the danger of extrapolating relations found for a restricted range of values. We have used our empirical calibration in order to obtain T([Siii]) for the SDSS spectra. The estimated errors introduced by the calibration are of the order of 12% for T([Siii]), i.e. between 1400 and 1500 K for the observed WHT objects.
Likewise, the SDSS spectrum of SDSS J0032 does not include the lines of [Oii] at 3727,29 Å and therefore it was not possible to derive T([Oii]). Again, we have resorted to the model predicted relationship between T([Oii]) and T([Oiii]) found by Pérez-Montero and Díaz (2003) that takes explicitly into account the dependence of T([Oii]) on electron density. Three model sequences are represented in Figure 2.5.1 corresponding to three different values of the density: 10, 100 and 500 cm (dashed lines in the plot). The model sequence for N = 100 cm is very similar to the one derived from the models by Stasińska (1980). The sample used for comparison comprises the objects from Pérez-Montero and Díaz (2005) for which the derivation of T([Oii]) and T([Oiii]) has been possible. In this case, due to the dependence of T([Oii]) on electron density, there is no a single empirical calibration and it is not possible to give an estimate of the error introduced by the application of this procedure.
In the case of nitrogen, the [Nii] 5755 Å line could be measured only in the SDSS spectrum of SDSS J0021, due to poor signal to noise in the other two cases where the assumption T([Nii]) T([Oii]) has been made. This assumption is usually made in standard analysis techniques; however, there are not enough data for Hii galaxies to test it empirically (see discussion below and Figure 2.5.1).
Finally, the Balmer continuum temperature could not be calculated from the SDSS spectra due to lack of spectral coverage.
Concerning abundances, the S/H abundance ratios had to be calculated using the intensity of the weak auroral [Siii] line at 6312 Å and, in the case of SDSS J0032, the O/H abundance ratio was derived using the [Oii] 7319,7330 Å lines following the procedure described by Kniazev et al. (2004).
The values of electron density and temperatures, ionic and total abundances derived from the SDSS spectra are listed in Columns 3, 5 and 7 of Tables 2.8, LABEL:ion-absWHT and LABEL:total-abs-WHT, respectively, along with their corresponding errors in the cases where they have been derived from measured emission lines intensities. Otherwise, since the uncertainties introduced by the different assumptions made and the theoretical models used are impossible to quantify, no formal errors are given. These quantities should be considered as estimates and be used with caution.
For SDSS J0032 the values we have obtained for densities, temperatures and abundances from the WHT and SDSS spectra are in excellent agreement within the observational errors, as expected from the close agreement between the measured emission line intensities. For the other two objects, the agreement can be considered as satisfactory, taking into account the difference in aperture between both sets of observations.
2.6.2 Comparison with previous published data for the CAHA objects
Five of the seven CAHA Hii galaxies presented here (SDSS J1455, SDSS J1509,SDSS J1540, SDSS J1616 and SDSS J1729) have been previously studied by Izotov et al. [2006A&A...448..955I] from SDSS/DR3 spectra. SDSS J1509 was also analyzed by Peimbert and Torres-Peimbert [1992A&A...253..349P] together with SDSS J1528 using spectra in the 3400-7000 Å range obtained with the 2.1 m telescope at KPNO through a 3.2 arcsec slit. SDSS J1616 and SDSS J1729 have also been studied by Kniazev at al. [2004ApJS..153..429K] from SDSS/DR1 spectra. For each observed object the reddening corrected emission line intensities reported in these studies are given for comparison in Tables LABEL:ratiostot_1-LABEL:ratiostot_7. Only the line intensities with errors less than 40 per cent are listed.
A good general agreement between our measurements and the ones in the literature for the strong emission lines and most of the weak ones is found. There are however some noticeable differences.
For SDSS J1509, published values for the intensities of the lines bluer than H are larger than measured in this work. For the [Oii] 3727 Å line the discrepancy amounts to 37 % for the data by Izotov et al. [2006A&A...448..955I] and 22 % for those by Peimbert and Torres-Peimbert [1992A&A...253..349P]. In all cases the derived values of the reddening constant are similar. It is worth noting that in the SDSS image the object seems to have a 3 arcsec size (see Figures 2.1 and 2.2), thus the SDSS fiber aperture and the KPNO observations might contain a substantial part of the galaxy, while our data comes from the brightest central knot. This could explain part of the found differences.
In the case of SDSS J1528 the values given by Peimbert and Torres-Peimbert [1992A&A...253..349P] for the [Oi] 6300 Å and [Sii] 6717,6731 Å lines are larger and smaller respectively than measured in this work. This is most noticeable for the [Oi] line with their value being larger than ours by almost a factor of three.
For SDSS J1616, the [Neiii] 3868 Å line intensity given in Izotov et al. [2006A&A...448..955I] is larger than measured here by 33%. On the contrary, a smaller intensity than given here by about 30% is measured for this line in SDSS J1729 by Izotov et al. [2006A&A...448..955I].
2.6.3 Properties of the ionized gas: Gaseous physical conditions and element abundances
Densities and temperatures
Four electron temperatures – T([Oiii]), T([Oii]), T([Siii]) and T([Sii])– have been estimated in all the observed objects. In addition, T([Nii]) has been estimated in two of the WHT objects, SDSS J0021 and SDSS J1624, and one of the CAHA objects, SDSS J1729; [Nii] 5755 is detected, but has poor signal, in SDSS J0032, SDSS J1455, SDSS J1509, SDSS J1528 and SDSS J1657 and falls in the gap between the blue and red spectra for the other two CAHA objects (SDSS J1540 and SDSS J1616). The good quality of the data allows us to reach accuracies of the order of 1% for T([Oiii]), 3% for T([Oii]) and 5% in the case of T([Nii]), T([Sii]) and T([Siii]) for the WHT data, while in the case of the CAHA spectra the accuracies reach the order of 2%, 4%, 5% and 7% for T([Oiii]), T([Oii]), T([Siii]), and both T([Sii]) and T([Nii]), respectively. The worse measurement of a line temperature is T([Sii]) for SDSS J1616, with a 10% error.
Figure 2.5.1 shows the range of the measured line temperatures and electron density for the WHT objects, SDSS J0021, SDSS J0032 and SDSS J1624. The data for the latter two are very similar, although T([Nii]) could not be measured for SDSS J0032. The width of the bands corresponds to one error. In the two cases T([Oiii]) and T([Siii]) overlap to some extent, while T([Oii]) is lower than T([Oiii]) in the first case and slightly higher than T([Oiii]) in the second.
![[Uncaptioned image]](/html/0908.4285/assets/chapter2/0390_diag_col.png)
![[Uncaptioned image]](/html/0908.4285/assets/chapter2/0364_diag_col.png)
All the observed objects show temperatures within a relatively narrow range, between 10900 and 14000 K for T([Oiii]). This could be due to the adopted selection criteria, high H flux and large equivalent width of H, which tends to select objects with abundances and electron temperatures close to the median values shown by Hii galaxies. In Table 2.15 we have listed the previously reported t([Oiii]) values for the CAHA objects. We find a general good agreement between those values and our measurements. Only for two objects, SDSS J1509 and SDSS J1729, we find differences of 900 K –in average– and 1100 K, respectively. Figure 2.5.1 shows the relation between the [Oii] and [Oiii] temperatures measured for all these objects. Also shown in the Figure are the corresponding values for Hii galaxies as derived from the emission line intensities compiled from the literature. This derivation has been done following the same prescriptions given in the present work. These values are given in Table 2.16 together with the references that have been used. We have restricted our compilation to objects for which the temperatures could be derived with an accuracy better than 10%. An exception has been made for IZw18. In this case, the large errors in the derived [Oii] temperatures (30% and 40% for T([Oii]) in the NW and SE knots respectively), are probably related to the low oxygen abundance in this galaxy and hence the weakness of the involved emission lines. These points are labelled in the Figure and, due to their large values, no error bars in t([Oii]) are shown.
| t([Oiii]) | 12+log(O/H) | log(S/O) | log(N/O) | log(Ne/O) | log(Ar/O) ref. | ||
| SDSS J1455 | 1.36 0.04 | 8.03 0.03 | -1.65 | -1.37 | -0.73 | -2.45 | |
| SDSS J1509 | 1.16 0.05 | 8.22 0.04 | -1.78 | -1.40 | -0.69 | -2.50 | |
| 1.20 0.08 | 8.17 0.10 | — | -1.24 | -0.69 | — | ||
| 1.10 | 8.26 | — | -1.24 | — | — | ||
| SDSS J1528 | 1.10 | 8.26 | — | -1.46 | — | — | |
| SDSS J1540 | 1.04 0.07 | 8.26 0.07 | -1.78 | -1.34 | -0.80 | -2.36 | |
| 1.06 0.08 | 8.13 0.08 | — | — | — | — | ||
| SDSS J1616 | 1.39 0.05 | 7.98 0.04 | -1.52 | -1.56 | -0.69 | -2.33 | |
| SDSS J1729 | 1.15 0.04 | 8.21 0.03 | -1.76 | -1.18 | -0.74 | -2.40 | |
| 1.15 0.03 | 8.17 0.03 | — | — | — | — | ||
| Izotov et al. (2006); Peimbert and Torres-Peimbert (1992); Kniazev et al. (2004). | |||||||
| based on an empirical method from Pagel et al. [1979MNRAS.189...95P]. | |||||||
| Object | t([Oii]) | t([Oiii]) | t([Sii]) | t([Siii]) | Ref. |
| SBS0335-052 | 1.340.03 | 2.030.03 | – | – | ICS01 |
| SBS0832+699 | 0.950.09 | 1.660.03 | – | – | ITL94 |
| SBS1135+581 | 1.360.07 | 1.310.02 | 1.010.03 | – | ITL94 |
| SBS1152+579 | 1.420.09 | 1.630.02 | 1.700.10 | – | ITL94 |
| SBS1415+437 | 1.410.07 | 1.710.01 | 1.390.06 | – | IT98 |
| SBS0723+692A | 1.450.13 | 1.580.01 | 1.740.14 | – | ITL97 |
| SBS0749+568 | 1.080.06 | 1.520.08 | – | 1.780.23 | ITL97, PMD03 |
| SBS0907+543 | 1.520.09 | 1.440.04 | – | – | ITL97 |
| SBS0917+527 | 1.180.09 | 1.510.03 | 1.190.08 | – | ITL97 |
| SBS0926+606 | 1.310.05 | 1.430.02 | 1.070.06 | 1.490.13 | ITL97, PMD03 |
| SBS0940+544N | 1.330.13 | 2.030.04 | – | – | ITL97 |
| SBS1222+614 | 1.260.08 | 1.450.01 | 1.790.16 | – | ITL97 |
| SBS1256+351 | 1.320.07 | 1.350.01 | 0.970.04 | – | ITL97 |
| SBS1319+579A | 1.400.08 | 1.290.01 | 0.650.04 | – | ITL97 |
| SBS1319+579C | 1.270.07 | 1.230.03 | 0.770.06 | – | ITL97 |
| SBS1358+576 | 1.300.13 | 1.470.02 | 1.180.08 | – | ITL97 |
| SBS1533+574B | 1.390.09 | 1.240.03 | 0.780.07 | – | ITL97 |
| Pox36 | 0.920.05 | 1.250.06 | 0.790.05 | – | IT04 |
| CGC007-025 | 1.040.04 | 1.660.02 | 1.720.10 | – | IT04 |
| Mrk 450-1 | 1.230.05 | 1.160.01 | 1.040.04 | – | IT04 |
| Mrk 450-2 | 1.350.13 | 1.240.03 | 1.070.10 | – | IT04 |
| HS0029+1748 | 1.230.11 | 1.280.06 | – | – | IT04 |
| HS0122+0743 | 1.270.11 | 1.790.03 | 1.300.13 | – | IT04 |
| HS0128+2832 | 1.500.06 | 1.250.01 | 1.220.07 | – | IT04 |
| HS1203+3636A | 0.950.06 | 1.070.02 | 1.510.12 | – | IT04 |
| HS1214+3801 | 1.250.05 | 1.330.01 | 1.180.06 | – | IT04 |
| HS1312+3508 | 1.010.08 | 1.310.03 | – | – | IT04 |
| HS2359+1659 | 1.150.11 | 1.180.02 | – | – | IT04 |
| Mrk 35 | 0.970.03 | 1.020.01 | 1.060.02 | – | IT04 |
| UM 238 | 0.830.08 | 1.240.02 | 0.830.08 | – | IT04 |
| UM 439 | 1.230.10 | 1.280.06 | – | – | IT04 |
| IIZw 40 | 1.270.06 | 1.340.03 | – | 1.300.04 | GIT00,PMD03 |
| Mrk 22 | 1.160.09 | 1.350.03 | 0.960.08 | 1.940.21 | ITL94, PMD03 |
| Mrk 36 | 1.370.12 | 1.530.05 | – | 1.550.17 | IT98, PMD03 |
| UM 461 | 1.640.16 | 1.620.05 | – | 1.930.10 | IT98, PMD03 |
| UM 462 | 1.190.03 | 1.380.02 | 1.000.07 | 1.610.17 | IT98, PMD03 |
| Mrk5 | 1.320.08 | 1.220.06 | – | 1.300.11 | IT98, PMD03 |
| VIIZw 403 | 1.420.12 | 1.520.03 | – | 1.280.10 | ITL97, PMD03 |
| Mrk 209 | 1.280.08 | 1.620.01 | 1.250.13 | 1.590.13 | ITL97, PMD03 |
| Mrk 1434 | 1.240.08 | 1.550.02 | – | 1.720.14 | ITL97, PMD03 |
| Mrk 709 | 1.500.15 | 1.670.06 | – | 1.620.16 | T91, PMD03 |
| UGC 4483 | – | 1.680.06 | – | 1.570.17 | S94 |
| IZw18NW | 1.280.40 | 1.960.09 | – | 2.490.51 | SK93 |
| IZw18SE | 1.180.50 | 1.720.12 | – | 1.970.34 | SK93 |
| KISSR 1845 | 1.080.09 | 1.320.04 | – | – | M04 |
| KISSR 396 | 1.660.10 | 1.400.05 | – | – | M04 |
| KISSB 171 | 1.160.06 | 1.180.04 | – | – | L04 |
| KISSB 175 | 1.120.10 | 1.340.02 | – | – | L04 |
| KISSR 286 | 1.050.06 | 1.100.02 | – | – | L04 |
| T91: Terlevich et al. [1991A&AS...91..285T]; SK93: Skillman and Kennicutt [1993ApJ...411..655S]; | |||||
| S94: Skillman et al. [1994ApJ...431..172S]; ITL94: Izotov et al. [1994ApJ...435..647I]; | |||||
| ITL97: Izotov et al. [1997ApJS..108....1I]; IT98: Izotov and Thuan [1998ApJ...500..188I]; | |||||
| ICS01: Izotov et al. [2001A&A...378L..45I]; GIT00: Guseva et al. [2000ApJ...531..776G]; | |||||
| IT04: Izotov et al. [2004A&A...415...87I]; PMD03: Pérez-Montero and Díaz [2003MNRAS.346..105P]; | |||||
| M04: Melbourne et al. [2004AJ....127..686M]; L04: Lee et al. [2004ApJ...616..752L] | |||||
The relation between the [Oii] and [Oiii] temperatures does not show a clear trend, showing a scatter which is larger than observational errors. Given that the [Oii] temperature is somewhat dependent on density one could be tempted to adscribe this scatter to a density effect. The density effect can be seen by looking at the model sequences which are overplotted and which correspond to photo-ionization models from Pérez-Montero and Díaz (2003) for electron densities N = 10, 100 and 500 cm. Higher density models show lower values of t([Oii]) for a given t([Oiii]). The effect is more noticeable at high electron temperatures. In fact, the data points populate the region of the diagram spanned by model sequences with most objects located between the model sequences corresponding to N 100 and 500 cm. Our observed objects, however, lie between the model sequences for N 10 and 100 cm. This is actually consistent with the derived values of N([Sii]).
All in all, the data show that there is not a unique relation between the [Oii] and [Oiii] temperatures which allows a reliable derivation of one of this temperatures when the other one can not be secured. This is actually a standard procedure in principle adopted for the analysis of low resolution and poor signal-to-noise data and now extended to data of much higher quality. The solid line in Figure 2.5.1 shows the relation based on the photo-ionization models by Stasińska (1990), adopted in many abundance studies of ionized nebulae. A substantial part of the sample objects show [Oii] temperatures which are lower or higher than predicted by this relation for as much as 3000 K. At a value of T([Oiii] of 10000 K, this differences translate into higher and lower O/H ionic ratios, respectively, by a factor of 2.5. However, when using model sequences to predict [Oii] temperatures no uncertainties are attached to the t([Oii]) vs. t([Oiii]) relation and the outcome is a reported T([Oii]) which carries only the usually small observational error of T([Oiii]) which translates into very small errors in the oxygen ionic and total abundances. Thus it is possible to find in the literature values of T([Oii]) with quoted fractional errors lower than 1% and absolute errors actually less than that quoted for T([Oiii]) [1998ApJ...500..188I], which translate into ionic O/H ratios with errors of only 0.02 dex.
Recently, this procedure has been justified by Izotov et al. [2006A&A...448..955I] based on the comparison of a selected SDSS data sample of ”Hii-region like” objects with photo-ionization models computed by the authors. Different expressions of T([Oii]) as a function of T([Oiii]) are given for different metallicity regimes and it is argued that, despite a large scatter, the relation between T([Oii]) and T([Oiii]) derived from observations follows generally the one obtained by models. However, no clear trend is shown by the data and the large errors attached to the electron temperature determinations, in many cases around 2000 K for T([Oii]), actually preclude the test of such a statement. In fact, most of the data with the smallest error bars lie below and above the theoretical relation. While it may well be that these objects belong to a different family from typical Hii galaxies, this has not been actually shown to be the case. The model sequences of Izotov et al. [2006A&A...448..955I] for the cases of low and intermediate metallicities are shown in Figure 2.5.1 as green double dashed-dotted and the blue dashed-double dotted lines respectively. These models diverge from previous sequences at temperatures below 10000 K and above 18000 K. Of great concern is the model degenerate behaviour at high temperatures. Unfortunately, only one object in our sample has an [Oiii] temperature larger than 20000 K (SBS0940+544N, T([Oiii]) = 20300 400 K) and its [Siii] temperature has a 10% error. Therefore it is not possible with the present data to address this important issue.
Figure 2.5.1 shows the comparison between the t([Oii]) values derived from direct measurements with those derived from t([Oiii]) using [1990A&AS...83..501S] photo-ionization models. These values agree for seven of our observed objects, the value is higher than the measured one by 2200 K for the WHT object SDSS J0021, and lower and higher by 900 K for the CAHA objects SDSS J1657 and SDSS J1729, respectively. This difference for the WHT object translate into a lower O/H ionic ratio by a factor of 4 and a lower total oxygen abundance by 0.17 dex in the case of SDSS J0021. In the case of the CAHA objects SDSS J1657 and SDSS J1729, these differences translates into higher and lower O/H ionic ratios by factors of 1.32 and 1.26, respectively, and higher and lower total oxygen abundances by 0.05 and 0.06 dex, respectively.
In general, model predictions overestimate t([Oii]) and hence underestimate the O/H ratio. This is of relatively little concern in objects of high excitation for which O/O is less than 10%, but caution should be taken when dealing with lower excitation objects where total oxygen abundances could be underestimated by up to 0.2 dex.
In the usually assumed structure of ionized nebulae, low ionization lines arise from the same region and therefore the temperatures of [Oii], [Sii] and [Nii] are expected to show similar values, once allowance is made for a possible density effect for the first two. In Figure 2.5.1 we show the relation between t([Sii]) and t([Oii]) for the WHT and CAHA objects and those from the literature shown in Table 2.16. The relations derived by Pérez-Montero and Díaz (2003) using photo-ionization models for electron densities N = 10 and 100 cm are also shown. Our measurement for the [Sii] and [Oii] temperatures are located in the region predicted by the models, although any dependence on density is difficult to appreciate. Some objects however are seen to lie well above the one-to-one relation. These objects are: SBS1222+614, HS1203+3636A and CGC007-025. The latter one shows a value of the [Oiii] temperature close to the [Sii] one, with the [Oii] temperature being lower by about 6000 K. On the other hand, the other two objects show [Oiii] and [Oii] temperatures fitting nicely on the model sequence for N = 100 cm.
Regarding T([Nii]), the 5575 Å line is usually very weak and difficult to measure in Hii galaxies due to their low metallicities, and therefore only a few measurements exist and with very large errors, larger than 50 % in some cases (see Figure 2.5.1). If we restrict ourselves to the data with errors of less than 10 %, the [Oii] and [Nii] temperatures differ by at most 1500 K. More high quality data would be needed in order to confirm this usually assumed relation.
The situation seems to be better for the [Siii] temperature. Figure 2.5.1 shows the relation between t([Siii]) and t([Oiii]) for our objects and the compilation of published data on Hii galaxies for which measurements of the nebular and auroral lines of [Oiii] and [Siii] exist, thus allowing the simultaneous determination of T([Oiii]) and T([Siii]) (see Table 2.16). The solid line in the figure shows the model sequence from Pérez-Montero and Díaz (2005), which differs slightly from the semi-empirical relation by Garnett [1992AJ....103.1330G], while the other two lines correspond to the relations given by Izotov et al. [2006A&A...448..955I] for low and intermediate metallicity Hii regions. The three model sequences are coincident for temperatures in the range from 12000 and 17000 K, and very little, if any, metallicity dependence is predicted. Although the number of objects is small (only 25, including the galaxies in the present work) and the errors for the data found in the literature are large, most objects seem to follow the trend shown by model sequences. The most discrepant object is Mrk 22 that shows a [Siii] temperature larger than predicted by about 6000 K. Obviously, more high quality data are needed in order to confirm the relation between the [Oiii] and [Siii] temperatures and obtain an empirical fit with well determined rms errors.
Abundances
The abundances derived for the observed objects show the characteristic low values found in strong line Hii galaxies (Terlevich et al., 1991; Hoyos and Díaz, 2006; 12+log(O/H) = 8.0), within the errors. These values of 12+log(O/H) are between 7.93 and 8.19. The mean error values for the oxygen and neon abundances are 0.04 dex and slightly larger, 0.07, for sulphur and argon.
The three WHT objects have previous oxygen abundance determinations. They are part of the first edition of the SDSS Hii galaxies with oxygen abundance catalog, presented by Kniazev et al. [2004ApJS..153..429K]. These authors derived total oxygen abundances of 12+log(O/H) = 8.180.04 for SDSS J0021, 12+log(O/H) = 8.070.02 for SDSS J0032 and 12+log(O/H) = 8.170.01 for SDSS J1624, higher than ours by 0.17 dex, but consistent with the values we obtain from the analysis of the SDSS spectra for two of the objects: SDSS J0021 (12+log(O/H) = 8.190.03) and SDSS J1624 (12+log(O/H) = 8.140.02). For SDSS J0032, our analysis of its SDSS spectrum yields a total oxygen abundance 12+log(O/H) = 7.930.03, lower than theirs by 0.14 dex and closer to the value derived by Ugryumov et al. [2003A&A...397..463U] in their Hamburg/SAO Survey. The spectrum analyzed by Kniazev et al. [2004ApJS..153..429K] was extracted from the first SDSS data release. This might point to a difference in the calibration routines of SDSS spectra from one release to the other.
In the case of the CAHA objects, six of them have published abundance determinations which are listed in Table 2.15. Our results are in general good agreement with those in the literature. In the case of SDSS J1540 the difference between the value derived by Izotov et al. [2006A&A...448..955I] and ours is 0.19 dex, but our derived value is in agreement –within the errors– with that obtained by Kniazev et al. [2004ApJS..153..429K]. We have also found a small difference of 0.13 dex –in average– in the oxygen abundance of SDSS J1729. These differences are similar to those found for the WHT objects between our derived abundances using WHT spectra and the values estimated by Kniazev et al. [2004ApJS..153..429K].
The logarithmic N/O ratios found for the galaxies for which there are T([Oii]) and T([Nii]) determinations are -1.060.10 and -1.260.12 for the WHT data and is -1.270.05 for the CAHA one. It is worth noting that an analysis of the data along the lines discussed above, i. e. T([Oii]) derivation from T([Oiii]) according to Stasińska (1990) models and the assumption t([Oii]) = t([Nii]), would provide for SDSS J0021, an N/O ratio larger by a factor of 3 (log N/O = -0.64) and by a factor of 1.5 for SDSS J1729. For the rest of the galaxies, for which this assumption has been made, log(N/O) ratios are between -1.40 and -1.11 with an average error of 0.05. For all the objects, the derived values are on the high log(N/O) side of the distribution for this kind of objects (see upper panel of Figure 2.5.1). In general, the common procedure of obtaining t([Oii]) from t([Oiii]) using Stasińska’s (1990) relation and assuming t([Oii]) = t([Nii]), yields N/O ratios larger than using the measured t([Oii]) values, since according to Figure 2.5.1, in most cases, the model sequence over-predicts t([Oii]). An over-prediction of this temperature by a 30 % at T([Oii]) = 13000 K would increase the N/O ratio by a factor of 2. Therefore, the effect of our observed objects showing relatively high N/O ratios seems to be real.
![[Uncaptioned image]](/html/0908.4285/assets/chapter2/SO_O-HIIgal.png)
The log(S/O) ratios found for the objects are also listed in Tables LABEL:total-abs-WHT and LABEL:total-abs-CAHA. These values vary between -1.83 and -1.36 with an average error of 0.09, consistent with solar (log(S/O) = -1.36111111Oxygen from Allende-Prieto et al. (2001) and sulphur from [1998SSRv...85..161G].) within the observational errors, except for SDSS J0021, SDSS J1455 and SDSS J1528 for which S/O is lower by a factor of about 2.7 for the WHT object, the first one, and is lower by a factor of about 1.8 for the CAHA objects, the other two (see lower panel of Figure 2.5.1). Comparing with the Izotov et al. [2006A&A...448..955I] derived S/O logarithmic ratios for the CAHA objects (see Table 2.15) we find that for three of the observed objects their S/O ratios are lower than ours by us much as 0.4 dex or a factor of about 2.5.
![[Uncaptioned image]](/html/0908.4285/assets/chapter2/o_aro_3.png)
The logarithmic Ne/O ratio varies between -0.65 and -0.59 and between -0.84 and -0.66 for the WHT and CAHA objects, respectively. They have a constant value (see upper panel Figure 2.5.1) within the errors (Tables LABEL:total-abs-WHT and LABEL:total-abs-CAHA) consistent with solar one (log(Ne/O) = -0.61 dex121212Oxygen from Allende-Prieto et al. (2001) and neon from [1998SSRv...85..161G].), if the object with the lowest ratio is excluded. An excellent agreement with the literature is found.
The values calculated using the classical approximation for the ICF (Ne/O = Ne/O), although systematically larger, are within errors very close to those derived using the ICF for neon (see chapter §3). This is to be expected, given the high degree of ionization of the objects in the sample.
Finally, the Ar/O ratios found for the observed objects show a larger dispersion than in the case of Ne/O (see lower panel of Figure 2.5.1), with a mean value consistent with solar131313Oxygen from Allende-Prieto et al. (2001) and argon from [1998SSRv...85..161G].. Comparing our estimations for the logarithmic Ar/O ratios with those derived by Izotov et al. [2006A&A...448..955I], we find a good agreement for three objects, and larger values (0.31 and 0.29) for SDSS J1509 and SDSS J1540, respectively. We must note that for these two objects we have not been able to measure the ionic abundances of Ar.
S parameter
On the other hand, the measurement of the [Siii] IR lines allows the calculation of the sulphur abundance parameter S [1996MNRAS.280..720V]:
This parameter constitutes probably the best empirical abundance indicator for Hii galaxies, since contrary to what happens for the widely used O (R) parameter [1979MNRAS.189...95P, 1979A&A....78..200A], the calibration is linear up to solar abundances, thus solving the degeneration problem usually presented by this kind of objects. This is particularly dramatic for objects with log O 0.8 and 12+log(O/H) 8.0 which can show the same value of the abundance parameter while having oxygen abundances that differ by up to an order of magnitude. About 40 % of the observed Hii galaxies belong to this category (see Díaz and Pérez-Montero, 1999). The logarithm of the S parameter derived for our objects are given in the last row of Tables LABEL:total-abs-WHT and LABEL:total-abs-CAHA. Figure 2.22 shows the points corresponding to the observed objects in the log S vs. 12+log(O/H) diagram, together with their observational error. The rest of the data correspond to Hii galaxies from the compilation made by Pérez-Montero and Díaz (2005) together with the data of ten SDSS BCD galaxies presented by Kniazev et al. [2004ApJS..153..429K] and analyzed by Pérez-Montero et al. (2006; these objects are labeled as SDSS objects). The solid line shows the calibration by Pérez-Montero and Díaz (2005). Three objects are seen to clearly deviate from this line. Two of them correspond to galaxies from Kniazev et al. [2004ApJS..153..429K] for which no data on the [Oii] 3727 line exist and therefore the O/H ratio is derived from the red [Oii] 7325 lines. Both objects show low ionization parameters as estimated from the [Sii]/[Siii] ratio and relatively high values of O/H as derived from the [Nii]/H calibration [2002MNRAS.330.69D]. The third object is Mrk709 that shows similar characteristics (see Pérez-Montero and Díaz 2003). These objects might be affected by shocks and deserve further study. Actually the accuracy of the S calibration for Hii galaxies, as a family, is only 0.10 dex (see Pérez-Montero and Díaz, 2005). Clearly, more observations are needed in order to improve the S calibration and truly understand the origin of the observed dispersion.
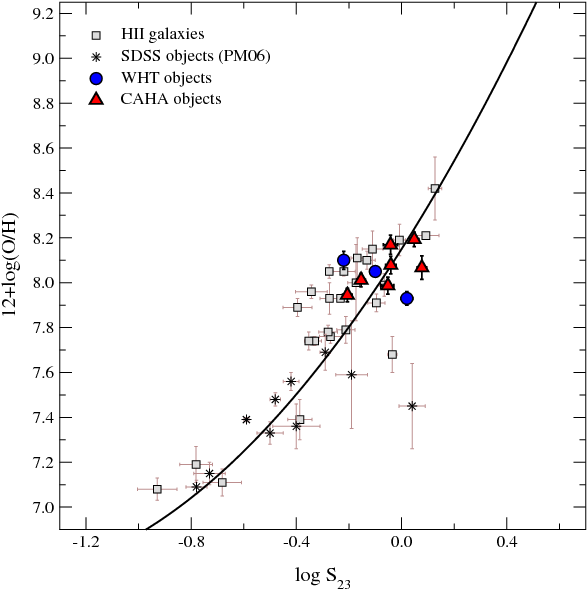
2.6.4 Ionization structure
The ionization structure of a nebula depends essentially on the shape of the ionizing continuum and the nebular geometry and can be traced by the ratio of successive stages of ionization of the different elements. With our data it is possible to use the O/O and the S/S to probe the nebular ionization structure. In fact, Vílchez and Pagel [1988MNRAS.231..257V] showed that the quotient of these two quantities that they called “softness parameter” and denoted by is intrinsically related to the shape of the ionizing continuum and depends on geometry only slightly. If the simplifying assumption of spherical geometry and constant filling factor is made, the geometrical effect can be represented by the ionization parameter which, in turn can be estimated from the [Oii]/[Oiii] ratio. Actually, the [Oii]/[Oiii] ratio depends on stellar effective temperature which, in turn, depends on metallicity, in the sense that for a given stellar mass, stars of higher metallicity have a lower effective temperature. Since the observed objects have similar values of this quotient, and show oxygen abundances in a very narrow range, we can assume they also share a common value for their ionization parameter. Under these circumstances, the value of points to the temperature of the ionizing radiation.
![[Uncaptioned image]](/html/0908.4285/assets/chapter2/etaprima_SO.png)
In Figure 2.5.1, upper panel, we show the relation between log(O/O) and log(S/S) for the WHT and CAHA objects (filled blue circle and red triangles, respectively, for values calculated using our methodology) and the Hii galaxies in Table 2.16. Besides, solid turquoise and dark green diamonds represent the values for the WHT and CAHA galaxies, respectively, derived using the conventional method. In this diagram diagonal lines correspond to constant values of the parameter which can be taken as an indicator of the ionizing temperature (Vílchez and Pagel, 1988). In this diagram Hii galaxies occupy the region with log between -0.35 and 0.2, which corresponds to high values of the ionizing temperature according to these authors. One of the observed objects, SDSS J1657, shows a very low value of =-0.6. This object however, had the [Oii] 7319,25 Å affected by atmospheric absorption lines. Unfortunately no previous data of this object exist apart form the SDSS spectrum. We have retrieved this spectrum and measured the [Oii] lines deriving a t([Oii]) = 1.230.21, the large error being due to the poor signal to noise in the [Oii] 7319,25 Å. This lower temperature would increase the value of O/O moving the data point corresponding to this object upwards in the upper panel of Figure 2.5.1. This would be consistent with the position of the object in the lower panel of the figure which shows log([Oii]/[Oiii]) vs. log([Sii]/[Siii]), which does not require explicit knowledge of the line temperatures involved in the derivation of the ionic ratios, and therefore does not depend on the method to derive or estimate these temperatures. The lower panel in Figure 2.5.1 shows the purely observational counterpart of the upper panel. In this diagram diagonal lines represent constant values of log ’ defined by Vílchez and Pagel (1988) as:
where t is the electron temperature in units of 10. and ’ are related through the electron temperature but very weakly, so that a change in temperature from 7000 to 14000 K implies a change in log by 0.1 dex, inside observational errors. Also, log ’ is always less than log . The value of log ’ for SDSS J1657 is -0.36 corresponding to = -0.09 for t = 1.23.
Inconsistencies between the values of and ’ are also found if the ionic ratios are derived using values of electron temperatures obtained following the prescriptions given by Izotov et al. (2006). These values are represented by solid diamonds in the upper panel of Figure 2.5.1 for the observed objects. In all cases, higher values of are obtained which, in conjunction with the measured values of ’, would indicate values of electron temperatures much lower than directly obtained. These higher values of would also imply ionizing temperatures lower than those shown by the measured ’ values.
An important conclusion is that metallicity calibrations based on abundances derived following the conventional method are probably bound to provide metallicities which are systematically too high and should therefore be revised.
2.6.5 Characteristics of the observed Hii galaxies
We have calculated the H luminosities [L(H)] for the observed Hii galaxies from our spectra, correcting the measured H fluxes [F(H)] for extinction according to the values found from the spectroscopic analysis and using their distances, D, taken from the literature, but we do not correct for aperture effects. The resulting values are listed in Table 2.17. These values are in the typical luminosity range found in Hii galaxies [2006MNRAS.365..454H].
| Galaxy | F(H) | D | L(H) | Q(H) | log u | Diameter | M | M(Hii) |
| (erg cm s) | (Mpc) | (erg s) | (ph s) | (pc) | ||||
| SDSS J0021 | 7.13E-14 | 399.5 | 1.36E+42 | 1.00E+54 | -2.33 | 353 | 648.04 | 480.78 |
| SDSS J0032 | 3.50E-14 | 69.1 | 2.00E+40 | 1.47E+52 | -2.43 | 681 | 10.20 | 7.82 |
| SDSS J1624 | 1.41E-13 | 133.4 | 2.99E+41 | 2.20E+53 | -2.57 | 1470 | 138.11 | 165.64 |
| SDSS J1455 | 4.14E-14 | 117.9 | 6.88E+40 | 5.06E+52 | -2.61 | 176 | 24.99 | 48.59 |
| SDSS J1509 | 3.78E-14 | 201.3 | 1.83E+41 | 1.35E+53 | -1.99 | 35 | 70.85 | 112.55 |
| SDSS J1528 | 5.00E-14 | 268.6 | 4.31E+41 | 3.17E+53 | -2.77 | 923 | 125.87 | 477.42 |
| SDSS J1540 | 1.52E-14 | 49.4 | 4.43E+39 | 3.26E+51 | -2.19 | 205 | 1.73 | 1.35 |
| SDSS J1616 | 3.79E-14 | 13.7 | 8.52E+38 | 6.26E+50 | -2.73 | 2207 | 0.46 | 0.24 |
| SDSS J1657 | 1.75E-14 | 161.2 | 5.44E+40 | 4.00E+52 | -2.42 | 281 | 21.91 | 33.45 |
| SDSS J1729 | 6.89E-14 | 66.9 | 3.69E+40 | 2.71E+52 | -2.48 | 1122 | 14.06 | 21.11 |
| from [2000ApJ...529..786Mtot]. Note: masses in 10 M. | ||||||||
We have derived the total number of ionizing photons from the H luminosities (see for example [1989agna.book.....O]):
The ionization parameter, = (H)/4cRN (where R is the radius of the ionized region and c is the speed of light), can be estimated from the [Sii]/[Siii] ratio [1991MNRAS.253..245D] as:
and ranges between -2.77 and -1.99 for our observed Hii galaxies.
From the estimated number of hydrogen ionizing photons, ionization parameter and electron density, it is possible to derive the angular size –in arcsec– of the emitting regions (; see [2002MNRAS.329..315C]).
Taking into account the object distances, in Table 2.17 we have listed these values in parsecs.
We have also derived the mass of ionizing stars, M, from the calculated number of hydrogen ionizing photons with the use of evolutionary models of ionizing clusters [1994ApJS...91..553G, 1996ApJS..107..661S] assuming that the regions are ionization bound and that no photons are absorbed by dust. A Salpeter IMF with upper and lower mass limits of 100 and 0.8 M respectively, has been assumed. According to these models, a relation exists between the degree of evolution of the cluster, as represented by its H emission line equivalent width and the number of hydrogen ionizing photons per unit solar mass [1998Ap&SS.263..143D, 2000MNRAS.318..462D].
The ionizing cluster masses thus derived are given in Table 2.17.
The amount of ionized gas (M) associated to each Hii galaxy has been obtained from our derived H luminosities using the relation given by [1990ApJ...356..389M] for an electron temperature of 10 K
2.6.6 The temperature fluctuation scheme
At the end of the 60s and beginning of the 70s, Peimbert [1967ApJ...150..825P], Peimbert and Costero [1969BOTT....5....3P], and Peimbert [1971BOTT....6...29P] established a complete analytical formulation to study the discrepancies between the abundances relative to hydrogen derived from recombination lines (RLs) and from collisionally excited lines (CELs) when a constant electron temperature is assumed. In the first of these works, Peimbert proposed that this discrepancy is due to spatial temperature variations which can be characterized by two parameters: the average temperature weighted by the square of the density over the volume considered, T, and the root mean square temperature fluctuation, t. They are given by
| (2.1) |
and
| (2.2) |
where N and N) are the local electron and ion densities of the observed emission lines, respectively; T is the local electron temperature; and is the observed volume [1967ApJ...150..825P].
It is possible to obtain the values of T and t using different methods. One possibility is to compare the electron temperatures obtained using two independent ways. Generally, temperatures originated in different zones of the nebula are used, one that represents the warmest regions and another representative of the coldest ones. In the absence of temperatures derived from recombination lines, the temperatures estimated from the hydrogen discontinuities, either from Balmer or Paschen series, representative of the temperature of the neutral gas, can be used.
We have followed Peimbert et al. (2000, 2002, 2004) and Ruíz et al. (2003) to derive the values of T and t for our WHT spectra by combining the Balmer temperature, T(Bac), and the temperature derived from the collisional [Oiii] lines, T([Oiii]), therefore assuming a simple one-zone ionization scheme. Then, the relation for these two temperatures is given by:
| (2.3) |
and
| (2.4) |
The solution of this system of equations for each WHT galaxy along with their corresponding errors are listed in table 2.18. In the case of the CAHA objects the spectra do not have enough signal-to-noise ratio to measure the Balmer jump with an acceptable accuracy. The temperature fluctuations are almost negligible for two of the WHT objects. They have t-values very similar to the ones derived by Luridiana et al. [2003ApJ...592..846L] by combining observations from the literature and photo-ionization models for some BCDs and extragalactic Hii regions. Guseva et al. [2006ApJ...644..890G] used the Balmer and Paschen jumps to determine the temperatures of the H zones of 22 low-metallicity Hii regions in 18 BCD galaxies, one extragalactic Hii region in M101 and 24 Hii emission-line galaxies selected from the DR3 of the SDSS. They found that these temperatures do not differ, in a statistical sense, from the temperatures of the [Oiii] zones, given t-values are close to zero. The greater t-value obtained for SDSS J0032 is in the range of the values derived for giant extragalactic Hii regions (see González-Delgado et al., 1994; Jamet et al., 2005; Peimbert et al., 2005) or Hii regions in the Magellanic Clouds, such as 30 Doradus, LMC N11B and SMC N66 [2003MNRAS.338..687T].
| name | T | t |
|---|---|---|
| SDSS J002101.03+005248.1 | 1.240.35 | 0.004 |
| SDSS J003218.60+150014.2 | 1.080.21 | 0.0660.026 |
| SDSS J162410.11-002202.5 | 1.240.30 | 0.001 |
| T in 10 K. Note that t is always greater than zero. | ||
In the limit of low densities and small optical depths, and for t much lower than one, the electronic temperature for helium, T(Heii), is proportional to and , the average value of the power of the temperature for the helium lines used to calculate the ionic abundances of He, and the corresponding one for H, respectively. Then, for different from , this temperature is given by equation (14) of Peimbert (1967):
| (2.5) |
The value of the power of the temperature for each helium line in the low density limit has been obtained from [1999ApJ...514..307B]. We have calculated as the average value of weighted according to the observational errors [2000ApJ...541..688P]. We have obtained values of equal to -1.37, -1.42, and -1.43 for SDSS J0021, SDSS J0032 and SDSS J1624, respectively. The value of has been obtained from Storey and Hummer [1995MNRAS.272...41S] and is equal to -0.89. The results for T(Heii) and their corresponding errors are listed in the last row of Table 2.8.
The temperature for H, T(H), can be calculated from equation (20) in Peimbert and Costero [1969BOTT....5....3P] as:
| (2.6) |
where we have taken = -0.89 as above. The derived values for T(H) and their errors are also given in Table 2.8.
The line temperature for a collisionally excited line, CEL, for t, (/kT-1/2) 0, and 0 is given by equation (20) of Peimbert and Costero [1969BOTT....5....3P]:
| (2.7) |
where = is the energy difference, in eV, between the upper (m) and lower (n) levels respectively of the atomic transition that produces the line.
For the case of t 0, and assuming a one-zone ionization scheme, we can derive the ionic abundances using the values calculated for t equal to zero, and equation (15) of Peimbert et al. [2004ApJS..150..431P]:
| (2.8) | |||||
where T() is given by equation (2.7). Using this expression, we have calculated the effect of the temperature fluctuations on the O/H abundance. In fact, given the high excitation of the object, this ionic abundance carries the highest weight in the total abundance of oxygen. The recalculated value is 12+log(O/H) = 8.090.12 which yields a total oxygen abundance 12+log(O/H) = 8.120.11. These values are higher than those given in Tables LABEL:ion-absWHT and LABEL:total-abs-WHT by 0.23 and 0.22 dex, respectively.
2.7 Summary and conclusions
We have performed a detailed analysis of newly obtained spectra of three and seven Hii galaxies observed with the 4.2 m WHT and the 3.5 CAHA telescopes, respectively. These galaxies were selected from the Sloan Digital Sky Survey Data Release 2 and 3, respectively. For the first set of galaxies the spectra cover from 3200 to 10550 Å in wavelength, while for the second group the data cover from 3400 to 10400 Å with a gap of approximately 100 Å between 5700 and 5800 Å. The WHT spectra have a FWHM resolution of about 1800 in the blue and 1700 in the red spectral regions, and the CAHA ones of about 1400 and 1200, respectively.
The high signal-to-noise ratio of the obtained spectra allows the measurement of four line electron temperatures: T([Oiii]), T([Siii]), T([Oii]) and T([Sii]), for all the objects of the sample with the addition of T([Nii]) for three of them, and the Balmer continuum temperature T(Bac) for the WHT objects. These measurements and a careful and realistic treatment of the observational errors yield total oxygen abundances with accuracies between 5 and 12%. The fractional error is as low as 1% for the ionic O/H ratio due to the small errors associated with the measurement of the strong nebular lines of [Oiii] and the derived T([Oiii]), but increases to up to 30% for the O/H ratio. The accuracies are lower in the case of the abundances of sulphur (of the order of 25% for S and 15% for S) due to the presence of larger observational errors both in the measured line fluxes and the derived electron temperatures. The error for the total abundance of sulphur is also larger than in the case of oxygen (between 15% and 30%) due to the uncertainties in the ionization correction factors.
This is in contrast with the unrealistically small errors quoted for line temperatures other than T([Oiii]) in the literature, in part due to the commonly assumed methodology of deriving them from the measured T([Oiii]) through a theoretical relation and calculating the errors simply by propagating statistically the T([Oiii]) ones. These relations are found from photo-ionization model sequences and no uncertainty is attached to them although large scatter is found when observed values are plotted; usually the line temperatures obtained in this way carry only the observational error found for the T([Oiii]) measurement and does not include the observed scatter, thus heavily underestimating the errors in the derived temperature.
In fact, no clear relation is found between T([Oiii]) and T([Oii]) for the existing sample of objects. A comparison between measured and model derived T([Oii]) shows than, in general, model predictions overestimate this temperature and hence underestimate the O/H ratio. This, though not very important for high excitation objects, could be of some concern for lower excitation ones for which total O/H abundances could be underestimated by up to 0.2 dex. It is worth noting that the objects observed with double-arm spectrographs, therefore implying simultaneous and spatially coincident observations over the whole spectral range, show less scatter in the T([Oiii]) - T([Oii] plane clustering around the N = 100 cm photo-ionization model sequence. On the other hand, this small scatter could partially be due to the small range of temperatures shown by these objects due to possible selection effects. This small temperature range does not allow either to investigate the metallicity effects found in the relations between the various line temperatures in recent photo-ionization models by Izotov et al. (2006).
Also, the observed objects, though showing Ne/O and Ar/O relative abundances typical of those found for a large Hii galaxy sample (Pérez-Montero et al., 2007; see Chapter §3), show higher than typical N/O abundance ratios that would be even higher if the [Oii] temperatures would be found from photo-ionization models. We therefore conclude that the approach of deriving the O temperature from the O one should be discouraged if an accurate abundance derivation is sought.
These issues could be addressed by re-observing the objects in Table 2.16, which cover an ample range in temperatures and metal content, with double arm spectrographs. This sample should be further extended to obtain a self consistent sample of about 50 objects with high signal-to-noise ratio and excellent spectrophotometry covering simultaneously from 3600 to 9900 Å. This simple and easily feasible project would provide important scientific return in the form of critical tests of photo-ionization models.
For the WHT objects, we have compared our obtained spectra with those downloaded from the SDSS DR3 finding a satisfactory agreement. The analysis of these spectra yields values of line temperatures and elemental ionic and total abundances which are in general agreement with those derived from the WHT spectra, although for most quantities, they can only be taken as estimates since, due to the lack of direct measurements of the required lines, theoretical models had to be used whose uncertainties are impossible to quantify. Unfortunately, the spectral coverage of SDSS precludes the simultaneous observation of the [Oii] 3727,29 Å and [Siii] 9069, 9532 Å lines, and therefore the analysis can never be complete.
The ionization structure found for the observed objects from the O/O and S/S ratios for all the observed galaxies, except one, cluster around a value of the “softness parameter” of 1 implying high values of the stellar ionizing temperature. For the discrepant object, showing a much lower value of , the intensity of the [Oii] 7319,25 Å lines are affected by atmospheric absorption lines. When the observational counterpart of the ionic ratios is used, this object shows a ionization structure similar to the rest of the observed ones. This simple exercise shows the potential of checking for consistency in both the and ’ plots in order to test if a given assumed ionization structure is adequate. In fact, these consistency checks show that the stellar ionizing temperatures found for the observed Hii galaxies using the ionization structure predicted by state of the art ionization models result too low when compared to those implied by the corresponding observed emission line ratios. Therefore, metallicity calibrations based on abundances derived according to this conventional method are probably bound to provide metallicities which are systematically too high and should be revised.
Finally, we have measured the Balmer continuum temperature for the three WHT objects and derived the temperature fluctuations as defined by Peimbert [1967ApJ...150..825P]. Only for one of the objects, the temperature fluctuation is significant and could lead to higher oxygen abundances by about 0.20 dex.
2.8 Relative reddening-corrected line intensities: Tables
| SDSS J0021 | |||||||
|---|---|---|---|---|---|---|---|
| WHT | SDSS | ||||||
| (Å) | f() | -EW | Error | -EW | Error | ||
| (Å) | (%) | (Å) | (%) | ||||
| 3697 H17 | 0.279 | 0.3 | 61 7 | 11.7 | — | — | — |
| 3704 H16+Hei | 0.277 | 0.7 | 146 14 | 9.9 | — | — | — |
| 3712 H15 | 0.275 | 0.5 | 117 18 | 15.5 | — | — | — |
| 3727 [Oii] | 0.271 | 71.1 | 16340 192 | 1.2 | 95.0 | 17886 198 | 1.1 |
| 3750 H12 | 0.266 | 1.3 | 288 27 | 9.4 | 1.8 | 299 37 | 12.4 |
| 3770 H11 | 0.261 | 1.7 | 377 30 | 7.8 | 2.0 | 329 37 | 11.3 |
| 3798 H10 | 0.254 | 2.0 | 422 28 | 6.7 | 2.2 | 385 37 | 9.5 |
| 3835 H9 | 0.246 | 3.2 | 654 63 | 9.7 | 4.0 | 635 71 | 11.1 |
| 3868 [Neiii] | 0.238 | 17.6 | 3881 81 | 2.1 | 21.6 | 3819 74 | 1.9 |
| 3889 Hei+H8 | 0.233 | 9.7 | 2033 113 | 5.6 | 11.2 | 1863 103 | 5.5 |
| 3968 [Neiii]+H7 | 0.216 | 15.2 | 2904 128 | 4.4 | 17.2 | 2708 148 | 5.5 |
| 4026 [Nii]+Hei | 0.203 | 0.8 | 152 17 | 10.9 | 0.6 | 104 12 | 11.9 |
| 4068 [Sii] | 0.195 | 0.8 | 138 12 | 8.6 | 0.8 | 125 12 | 9.7 |
| 4102 H | 0.188 | 15.5 | 2647 72 | 2.7 | 17.1 | 2488 78 | 3.1 |
| 4340 H | 0.142 | 33.6 | 4988 84 | 1.7 | 36.5 | 4689 92 | 2.0 |
| 4363 [Oiii] | 0.138 | 3.8 | 556 27 | 4.9 | 3.3 | 423 22 | 5.2 |
| 4471 Hei | 0.106 | 3.0 | 416 33 | 7.9 | 3.1 | 378 26 | 6.9 |
| 4658 [Feiii] | 0.053 | 0.8 | 102 7 | 7.1 | 0.9 | 108 13 | 12.3 |
| 4686 Heii | 0.045 | 0.5 | 68 6 | 8.1 | 0.3 | 36 3 | 7.0 |
| 4713 [Ariv]+Hei | 0.038 | 0.6 | 66 4 | 5.6 | 0.5 | 52 5 | 10.5 |
| 4740 [Ariv] | 0.031 | 0.4 | 49 6 | 12.4 | — | — | — |
| 4861 H | 0.000 | 97.0 | 10000 85 | 0.9 | 108.1 | 10000 91 | 0.9 |
| 4881 [Feiii] | -0.005 | — | — | — | 0.4 | 40 4 | 11.2 |
| 4921 Hei | -0.014 | 0.6 | 60 5 | 8.6 | 0.9 | 82 6 | 6.9 |
| 4959 [Oiii] | -0.024 | 151.5 | 15319 128 | 0.8 | 160.0 | 15032 98 | 0.6 |
| 4986 [Feiii] | -0.030 | 0.9 | 86 9 | 10.2 | 1.1 | 102 11 | 10.5 |
| 5007 [Oiii] | -0.035 | 439.4 | 43337 257 | 0.6 | 489.4 | 45163 261 | 0.6 |
| 5199 [Ni] | -0.078 | 1.5 | 117 13 | 11.2 | 1.4 | 112 9 | 8.1 |
| 5270 [Feiii] | -0.094 | — | — | — | 1.1 | 86 8 | 9.1 |
| 5755 [Nii] | -0.188 | 0.9 | 52 4 | 7.1 | 1.0 | 60 4 | 6.9 |
| 5876 Hei | -0.209 | 22.3 | 1265 65 | 5.2 | 22.0 | 1255 62 | 5.0 |
| 6300 [Oi] | -0.276 | 8.2 | 389 13 | 3.3 | 8.4 | 418 26 | 6.1 |
| 6312 [Siii] | -0.278 | 2.6 | 121 6 | 4.8 | 2.8 | 141 10 | 6.8 |
| 6364 [Oi] | -0.285 | 2.4 | 110 6 | 5.2 | 2.6 | 125 8 | 6.8 |
| 6548 [Nii] | -0.311 | — | — | — | — | — | — |
| 6563 H | -0.313 | 658.3 | 28858 273 | 0.9 | 607.1 | 28406 72 | 0.3 |
| 6584 [Nii] | -0.316 | 59.6 | 2604 86 | 3.3 | 50.8 | 2350 53 | 2.2 |
| 6678 Hei | -0.329 | 7.7 | 320 15 | 4.6 | 7.4 | 334 20 | 6.0 |
| 6717 [Sii] | -0.334 | 33.8 | 1360 47 | 3.4 | 35.4 | 1568 47 | 3.0 |
| 6731 [Sii] | -0.336 | 27.2 | 1073 46 | 4.3 | 26.9 | 1181 43 | 3.6 |
| 7065 Hei | -0.377 | 7.2 | 253 12 | 4.8 | 6.5 | 254 15 | 5.8 |
| 7136 [Ariii] | -0.385 | 18.5 | 619 24 | 3.9 | 17.5 | 631 25 | 4.0 |
| 7155 [Feii] | -0.387 | — | — | — | 0.8 | 27 3 | 12.5 |
| 7254 OI | -0.399 | — | — | — | 0.8 | 28 4 | 13.1 |
| 7281 Hei | -0.402 | 1.9 | 60 4 | 7.0 | 2.1 | 70 4 | 5.6 |
| 7319 [Oii] | -0.406 | 6.2 | 196 6 | 3.2 | 5.8 | 206 5 | 2.5 |
| 7330 [Oii] | -0.407 | 4.2 | 131 6 | 4.5 | 4.2 | 148 5 | 3.6 |
| 7378 [Niii] | -0.412 | 1.2 | 38 3 | 8.4 | 0.9 | 33 3 | 8.9 |
| 7412 [Niii] | -0.416 | 1.4 | 45 4 | 7.9 | — | — | — |
| 7751 [Ariii] | -0.451 | 5.1 | 139 10 | 6.9 | 6.1 | 186 14 | 7.4 |
| 8446 OI | -0.513 | 7.2 | 155 12 | 7.6 | — | — | — |
| 9069 [Siii] | -0.561 | 71.8 | 1193 60 | 5.0 | — | — | — |
| 9532 [Siii] | -0.592 | 504.4 | 2386 91 | 3.8 | — | — | — |
| I(H)(erg seg cm) | 2.47 10 | 3.38 10 | |||||
| c(H) | 0.51 0.01 | 0.18 0.01 | |||||
| possibly blend with an unknown line; [Oii] 3726 + 3729; [Feiii] 4986 + 4987; [Oii] 7318 + 7320; [Oii] 7330 + 7331. | |||||||
| SDSS J0032 | |||||||
|---|---|---|---|---|---|---|---|
| WHT | SDSS | ||||||
| (Å) | f() | -EW | Error | -EW | Error | ||
| (Å) | (%) | (Å) | (%) | ||||
| 3687 H19 | 0.281 | 0.6 | 103 9 | 8.5 | — | — | — |
| 3697 H17 | 0.279 | 0.9 | 144 12 | 8.6 | — | — | — |
| 3704 H16+Hei | 0.277 | 1.2 | 203 17 | 8.4 | — | — | — |
| 3712 H15 | 0.275 | 0.9 | 159 12 | 7.5 | — | — | — |
| 3727 [Oii] | 0.271 | 80.0 | 15728 138 | 0.9 | — | — | — |
| 3734 H13 | 0.270 | 1.2 | 197 15 | 7.5 | — | — | — |
| 3750 H12 | 0.266 | 1.3 | 212 16 | 7.7 | — | — | — |
| 3770 H11 | 0.261 | 2.3 | 366 17 | 4.6 | 3.0 | 510 37 | 7.3 |
| 3798 H10 | 0.254 | 2.8 | 448 25 | 5.7 | 3.5 | 587 40 | 6.8 |
| 3820 Hei | 0.249 | 0.4 | 74 11 | 14.3 | — | — | — |
| 3835 H9 | 0.246 | 4.4 | 651 54 | 8.3 | 3.7 | 665 51 | 7.7 |
| 3868 [Neiii] | 0.238 | 19.9 | 3720 95 | 2.6 | 19.6 | 4176 121 | 2.9 |
| 3889 Hei+H8 | 0.233 | 12.5 | 1958 123 | 6.3 | 10.7 | 2041 127 | 6.2 |
| 3968 [Neiii]+H7 | 0.216 | 17.0 | 2569 128 | 5.0 | 17.4 | 2723 166 | 6.1 |
| 4026 [Nii]+Hei | 0.203 | 0.8 | 142 10 | 7.1 | 0.9 | 168 20 | 12.1 |
| 4068 [Sii] | 0.195 | 1.1 | 191 10 | 5.1 | 0.8 | 148 13 | 9.1 |
| 4102 H | 0.188 | 17.2 | 2473 92 | 3.7 | 17.5 | 2609 85 | 3.3 |
| 4340 H | 0.142 | 33.8 | 4997 99 | 2.0 | 32.5 | 4730 89 | 1.9 |
| 4363 [Oiii] | 0.138 | 4.2 | 619 29 | 4.8 | 4.2 | 647 41 | 6.4 |
| 4471 Hei | 0.106 | 2.7 | 366 20 | 5.6 | 2.4 | 360 31 | 8.5 |
| 4658 [Feiii] | 0.053 | 0.7 | 91 8 | 9.1 | 0.7 | 99 8 | 8.1 |
| 4686 Heii | 0.045 | 1.0 | 129 8 | 6.3 | 1.0 | 144 12 | 8.6 |
| 4713 [Ariv]+Hei | 0.038 | 0.9 | 108 6 | 5.5 | 0.8 | 111 13 | 11.4 |
| 4740 [Ariv] | 0.031 | 0.4 | 49 6 | 12.9 | 0.3 | 29 3 | 11.9 |
| 4861 H | 0.000 | 89.6 | 10000 78 | 0.8 | 86.7 | 10000 90 | 0.9 |
| 4921 Hei | -0.014 | 0.8 | 86 6 | 6.5 | 0.9 | 109 10 | 9.6 |
| 4959 [Oiii] | -0.024 | 140.7 | 15819 125 | 0.8 | 138.6 | 16310 105 | 0.6 |
| 4986 [Feiii] | -0.030 | 1.4 | 155 14 | 9.1 | 1.5 | 179 17 | 9.2 |
| 5007 [Oiii] | -0.035 | 416.4 | 46072 238 | 0.5 | 412.8 | 47781 164 | 0.3 |
| 5015 Hei | -0.037 | 2.0 | 224 20 | 8.8 | 2.1 | 238 19 | 7.8 |
| 5199 [Ni] | -0.078 | 0.9 | 85 5 | 5.4 | 0.9 | 95 7 | 7.7 |
| 5755 [Nii] | -0.188 | — | — | — | — | — | — |
| 5876 Hei | -0.209 | 16.0 | 1240 56 | 4.5 | 15.0 | 1129 50 | 4.4 |
| 6300 [Oi] | -0.276 | 4.1 | 281 11 | 3.9 | 3.9 | 263 7 | 2.5 |
| 6312 [Siii] | -0.278 | 3.3 | 234 9 | 3.7 | 2.6 | 174 6 | 3.2 |
| 6364 [Oi] | -0.285 | 1.5 | 99 6 | 5.9 | 1.3 | 86 3 | 3.0 |
| 6548 [Nii] | -0.311 | 5.8 | 375 24 | 6.5 | 5.2 | 314 19 | 5.9 |
| 6563 H | -0.313 | 435.5 | 28481 174 | 0.6 | 462.8 | 28253 138 | 0.5 |
| 6584 [Nii] | -0.316 | 17.3 | 1119 49 | 4.4 | 15.1 | 920 30 | 3.3 |
| 6678 Hei | -0.329 | 5.2 | 325 18 | 5.4 | 4.8 | 287 7 | 2.4 |
| 6717 [Sii] | -0.334 | 30.3 | 1729 50 | 2.9 | 26.9 | 1562 33 | 2.1 |
| 6731 [Sii] | -0.336 | 21.9 | 1248 31 | 2.5 | 19.7 | 1141 24 | 2.1 |
| 7065 Hei | -0.377 | 4.2 | 218 21 | 9.6 | 3.9 | 195 13 | 6.6 |
| 7136 [Ariii] | -0.385 | 17.7 | 919 32 | 3.5 | 15.0 | 750 37 | 4.9 |
| 7155 [Feii] | -0.387 | 0.9 | 45 6 | 13.6 | — | — | — |
| 7281 Hei | -0.402 | 1.1 | 55 7 | 12.0 | 0.9 | 43 3 | 6.3 |
| 7319 [Oii] | -0.406 | 5.0 | 245 10 | 4.0 | 4.1 | 198 6 | 2.9 |
| 7330 [Oii] | -0.407 | 3.9 | 188 9 | 4.6 | 3.1 | 150 5 | 3.0 |
| 7751 [Ariii] | -0.451 | 5.1 | 233 23 | 10.1 | 3.9 | 166 10 | 6.1 |
| 8446 OI | -0.513 | 1.6 | 59 9 | 15.7 | 1.5 | 49 5 | 11.0 |
| 8468 P17 | -0.515 | 0.8 | 30 4 | 12.5 | — | — | — |
| 8599 P14 | -0.525 | 3.7 | 119 13 | 10.9 | 2.8 | 76 7 | 8.6 |
| 8865 P11 | -0.546 | 5.1 | 147 17 | 11.2 | 4.6 | 123 12 | 9.4 |
| 9014 P10 | -0.557 | 8.1 | 215 23 | 10.7 | — | — | — |
| 9069 [Siii] | -0.561 | 76.4 | 2173 96 | 4.4 | — | — | — |
| 9532 [Siii] | -0.592 | 188.7 | 4446 375 | 8.4 | — | — | — |
| 9547 P8 | -0.593 | 43.6 | 642 55 | 8.5 | — | — | — |
| I(H)(erg seg cm) | 1.23 10 | 3.17 10 | |||||
| c(H) | 0.11 0.01 | 0.22 0.01 | |||||
| possibly blend with an unknown line; [Oii] 3726 + 3729; [Feiii] 4986 + 4987; [Oii] 7318 + 7320; [Oii] 7330 + 7331. | |||||||
| SDSS J1624 | |||||||
|---|---|---|---|---|---|---|---|
| WHT | SDSS | ||||||
| (Å) | f() | -EW | Error | -EW | Error | ||
| (Å) | (%) | ||||||
| 3687 H19 | 0.281 | 0.3 | 52 6 | 10.9 | — | — | — |
| 3692 H18 | 0.280 | 0.4 | 64 6 | 9.7 | — | — | — |
| 3697 H17 | 0.279 | 0.8 | 114 11 | 9.2 | — | — | — |
| 3704 H16+Hei | 0.277 | 1.5 | 217 17 | 7.6 | — | — | — |
| 3712 H15 | 0.275 | 1.5 | 222 17 | 7.6 | — | — | — |
| 3727 [Oii] | 0.271 | 91.0 | 14707 221 | 1.5 | 96.8 | 14804 194 | 1.3 |
| 3750 H12 | 0.266 | 1.9 | 278 19 | 6.7 | 1.6 | 227 21 | 9.3 |
| 3770 H11 | 0.261 | 2.2 | 332 22 | 6.7 | 2.0 | 303 25 | 8.3 |
| 3798 H10 | 0.254 | 3.2 | 479 32 | 6.7 | 2.9 | 448 38 | 8.4 |
| 3820 Hei | 0.249 | 0.7 | 114 12 | 10.9 | 0.6 | 102 10 | 10.1 |
| 3835 H9 | 0.246 | 4.6 | 686 53 | 7.7 | 4.2 | 609 40 | 6.6 |
| 3868 [Neiii] | 0.238 | 25.8 | 4275 110 | 2.6 | 27.3 | 4443 101 | 2.3 |
| 3889 Hei+H8 | 0.233 | 12.8 | 1857 114 | 6.1 | 12.6 | 1784 113 | 6.3 |
| 3968 [Neiii]+H7 | 0.216 | 21.1 | 3212 184 | 5.7 | 20.5 | 2889 153 | 5.3 |
| 4026 [Nii]+Hei | 0.203 | 1.0 | 163 10 | 5.9 | 1.1 | 161 10 | 6.0 |
| 4068 [Sii] | 0.195 | 0.9 | 152 12 | 8.2 | 1.0 | 137 15 | 10.8 |
| 4102 H | 0.188 | 17.0 | 2581 76 | 3.0 | 19.7 | 2506 72 | 2.9 |
| 4340 H | 0.142 | 34.6 | 4570 82 | 1.8 | 39.8 | 4627 70 | 1.5 |
| 4363 [Oiii] | 0.138 | 5.0 | 698 23 | 3.4 | 5.0 | 603 14 | 2.3 |
| 4471 Hei | 0.106 | 3.1 | 418 16 | 3.8 | 3.4 | 386 13 | 3.2 |
| 4658 [Feiii] | 0.053 | 0.8 | 94 8 | 8.2 | 1.0 | 101 10 | 10.0 |
| 4686 Heii | 0.045 | 0.8 | 97 7 | 7.0 | 0.8 | 83 6 | 6.7 |
| 4713 [Ariv]+Hei | 0.038 | 2.0 | 115 10 | 8.4 | 1.0 | 99 8 | 7.8 |
| 4740 [Ariv] | 0.031 | 0.4 | 47 4 | 8.4 | 0.5 | 46 5 | 10.5 |
| 4861 H | 0.000 | 100.6 | 10000 105 | 1.1 | 117.3 | 10000 89 | 0.9 |
| 4881 [Feiii] | -0.005 | 0.3 | 25 3 | 10.3 | 0.3 | 89 9 | 10.6 |
| 4921 Hei | -0.014 | 1.0 | 98 4 | 4.3 | 0.8 | 76 7 | 8.7 |
| 4959 [Oiii] | -0.024 | 191.7 | 19383 141 | 0.7 | 220.1 | 19628 120 | 0.6 |
| 4986 [Feiii] | -0.030 | 1.3 | 126 8 | 6.6 | 1.2 | 104 7 | 6.3 |
| 5007 [Oiii] | -0.035 | 565.3 | 56424 278 | 0.5 | 659.6 | 58549 185 | 0.3 |
| 5015 Hei | -0.037 | 2.8 | 276 31 | 11.4 | 2.1 | 182 19 | 10.6 |
| 5159 [Feii] | -0.070 | 0.4 | 35 4 | 12.6 | — | — | — |
| 5199 [Ni] | -0.078 | 0.9 | 75 6 | 8.0 | 0.8 | 73 6 | 8.2 |
| 5270 [Feiii] | -0.094 | 0.6 | 49 5 | 10.2 | 0.5 | 35 3 | 7.9 |
| 5755 [Nii] | -0.188 | 0.4 | 26 2 | 8.4 | — | — | — |
| 5876 Hei | -0.209 | 20.4 | 1346 32 | 2.4 | 21.5 | 1133 27 | 2.4 |
| 6300 [Oi] | -0.276 | 5.5 | 301 7 | 2.2 | 6.4 | 284 6 | 2.2 |
| 6312 [Siii] | -0.278 | 3.3 | 177 5 | 2.7 | 3.3 | 146 5 | 3.1 |
| 6364 [Oi] | -0.285 | 2.0 | 106 3 | 3.0 | 2.2 | 97 3 | 3.3 |
| 6548 [Nii] | -0.311 | 6.8 | 338 17 | 5.1 | 6.8 | 284 12 | 4.1 |
| 6563 H | -0.313 | 566.3 | 27946 227 | 0.8 | 680.4 | 28199 125 | 0.4 |
| 6584 [Nii] | -0.316 | 18.8 | 927 24 | 2.6 | 19.3 | 797 14 | 1.8 |
| 6678 Hei | -0.329 | 7.7 | 346 20 | 5.9 | 8.5 | 338 20 | 5.9 |
| 6717 [Sii] | -0.334 | 29.2 | 1364 34 | 2.5 | 32.2 | 1251 25 | 2.0 |
| 6731 [Sii] | -0.336 | 21.3 | 985 26 | 2.7 | 23.6 | 912 19 | 2.1 |
| 7065 Hei | -0.377 | 6.2 | 261 18 | 6.9 | 7.2 | 246 16 | 6.6 |
| 7136 [Ariii] | -0.385 | 20.5 | 804 27 | 3.3 | 22.1 | 724 20 | 2.8 |
| 7254 OI | -0.399 | 0.4 | 15 1 | 9.2 | — | — | — |
| 7281 Hei | -0.402 | 1.5 | 57 4 | 7.3 | 1.6 | 52 3 | 6.6 |
| 7319 [Oii] | -0.406 | 5.5 | 214 7 | 3.1 | 6.3 | 199 5 | 2.5 |
| 7330 [Oii] | -0.407 | 4.5 | 176 6 | 3.3 | 5.2 | 163 4 | 2.7 |
| 7751 [Ariii] | -0.451 | 5.8 | 197 12 | 6.1 | 5.8 | 164 8 | 5.0 |
| 8392 P20 | -0.509 | 2.0 | 49 4 | 7.6 | 2.2 | 43 3 | 8.1 |
| 8413 P19 | -0.510 | 2.1 | 50 5 | 11.0 | — | — | — |
| 8438 P18 | -0.512 | 1.7 | 41 4 | 10.6 | 1.7 | 33 3 | 8.9 |
| 8446 OI | -0.513 | 2.3 | 57 4 | 7.7 | 3.1 | 64 3 | 4.9 |
| 8468 P17 | -0.515 | 1.9 | 45 4 | 9.7 | 2.0 | 39 4 | 9.1 |
| 8503 P16 | -0.518 | 5.2 | 110 12 | 10.8 | — | — | — |
| 8546 P15 | -0.521 | 3.5 | 71 8 | 11.1 | 3.5 | 58 5 | 9.2 |
| 8599 P14 | -0.525 | 2.7 | 65 6 | 9.3 | 4.1 | 79 7 | 9.1 |
| 8665 P13 | -0.531 | 3.6 | 78 6 | 8.3 | 5.7 | 98 7 | 7.5 |
| 8751 P12 | -0.537 | 6.0 | 122 11 | 9.2 | 5.9 | 109 9 | 8.7 |
| 8865 P11 | -0.546 | 9.0 | 175 18 | 10.4 | 8.2 | 147 15 | 10.1 |
| 9014 P10 | -0.557 | 8.3 | 175 31 | 17.6 | — | — | — |
| 9069 [Siii] | -0.561 | 66.8 | 704 49 | 7.0 | — | — | — |
| 9532 [Siii] | -0.592 | 220.1 | 4008 194 | 4.8 | — | — | — |
| 9547 P8 | -0.593 | 25.8 | 449 18 | 4.1 | — | — | — |
| I(H)(erg seg cm) | 5.03 10 | 8.10 10 | |||||
| c(H) | 0.52 0.01 | 0.39 0.01 | |||||
| possibly blend with an unknown line; [Oii] 3726 + 3729; [Feiii] 4986 + 4987; [Oii] 7318 + 7320; [Oii] 7330 + 7331. | |||||||
| SDSS J1455 | |||||
|---|---|---|---|---|---|
| (Å) | f() | -EW | Error | ||
| (Å) | (%) | ||||
| 3727 [Oii] | 0.271 | 91.6 | 11154164 | 1.5 | 10920400 |
| 3734 H13 | 0.270 | 1.1 | 13031 | 23.5 | — |
| 3750 H12 | 0.266 | 1.8 | 20448 | 23.8 | 27070 |
| 3770 H11 | 0.261 | 1.9 | 22227 | 12.2 | 47070 |
| 3798 H10 | 0.254 | 3.7 | 40739 | 9.6 | 52080 |
| 3820 Hei | 0.249 | 0.6 | 8116 | 20.2 | — |
| 3835 H9 | 0.246 | 5.0 | 57468 | 11.9 | 75070 |
| 3868 [Neiii] | 0.238 | 37.1 | 4792105 | 2.2 | 5230200 |
| 3889 Hei+H8 | 0.233 | 16.1 | 181699 | 5.4 | — |
| 3968 [Neiii]+H7 | 0.216 | 27.6 | 299671 | 2.4 | — |
| 4026 [Nii]+Hei | 0.203 | 1.2 | 14822 | 14.5 | — |
| 4068 [Sii] | 0.195 | 1.2 | 15811 | 6.8 | — |
| 4102 H | 0.188 | 24.4 | 258057 | 2.2 | 2590120 |
| 4340 H | 0.142 | 48.8 | 456270 | 1.5 | 4710180 |
| 4363 [Oiii] | 0.138 | 9.8 | 102235 | 3.4 | 99060 |
| 4471 Hei | 0.106 | 4.1 | 38023 | 6.2 | — |
| 4658 [Feiii] | 0.053 | 0.3 | 284 | 14.6 | 11040 |
| 4686 Heii | 0.045 | 0.8 | 759 | 11.4 | — |
| 4713 [Ariv]+Hei | 0.038 | 2.7 | 22317 | 7.6 | — |
| 4740 [Ariv] | 0.031 | 1.2 | 10314 | 13.2 | 11040 |
| 4861 H | 0.000 | 132.8 | 1000067 | 0.7 | 10000340 |
| 4881 [Feiii] | -0.005 | 0.3 | 256 | 24.2 | — |
| 4921 Hei | -0.014 | 1.3 | 9611 | 11.3 | — |
| 4959 [Oiii] | -0.024 | 254.3 | 20456134 | 0.7 | 21040680 |
| 4986 [Feiii] | -0.030 | 0.9 | 7118 | 25.0 | 9040 |
| 5007 [Oiii] | -0.035 | 782.2 | 61355336 | 0.5 | — |
| 5015 Hei | -0.037 | 3.1 | 23420 | 8.8 | — |
| 5199 [Ni] | -0.078 | 0.7 | 4810 | 19.9 | — |
| 5270 [Feiii] | -0.094 | 0.4 | 265 | 18.3 | — |
| 5755 [Nii] | -0.188 | — | — | 99.0 | — |
| 5876 Hei | -0.209 | 22.4 | 114035 | 3.0 | 109060 |
| 6300 [Oi] | -0.276 | 5.5 | 25711 | 4.2 | 21030 |
| 6312 [Siii] | -0.278 | 3.6 | 1606 | 3.9 | 15030 |
| 6364 [Oi] | -0.285 | 2.0 | 9519 | 19.8 | — |
| 6548 [Nii] | -0.311 | 6.2 | 27315 | 5.4 | — |
| 6563 H | -0.313 | 646.8 | 27756183 | 0.7 | 28190980 |
| 6584 [Nii] | -0.316 | 18.2 | 79219 | 2.4 | 75050 |
| 6678 Hei | -0.329 | 9.7 | 35038 | 10.9 | — |
| 6717 [Sii] | -0.334 | 21.9 | 100026 | 2.6 | 172070 |
| 6731 [Sii] | -0.336 | 14.5 | 78822 | 2.8 | — |
| 7065 Hei | -0.377 | 8.3 | 29312 | 4.3 | — |
| 7136 [Ariii] | -0.385 | 18.5 | 66230 | 4.6 | 59040 |
| 7281 Hei | -0.402 | 2.1 | 789 | 11.7 | — |
| 7319 [Oii] | -0.406 | 5.3 | 1819 | 5.0 | 29040 |
| 7330 [Oii] | -0.407 | 4.1 | 1428 | 5.9 | — |
| 7751 [Ariii] | -0.451 | 4.7 | 1549 | 5.6 | — |
| 8446 Oi | -0.513 | 1.7 | 468 | 18.4 | — |
| 8503 P16 | -0.518 | 2.6 | 5910 | 17.7 | — |
| 8546 P15 | -0.521 | — | — | 99.0 | — |
| 8599 P14 | -0.525 | — | — | 99.0 | — |
| 8665 P13 | -0.531 | 4.9 | 10518 | 17.1 | — |
| 8751 P12 | -0.537 | 7.9 | 14717 | 11.9 | — |
| 8865 P11 | -0.546 | 8.3 | 18122 | 12.4 | — |
| 9014 P10 | -0.557 | 11.4 | 26932 | 12.1 | — |
| 9069 [Siii] | -0.561 | 50.8 | 115459 | 5.1 | — |
| 9229 P9 | -0.572 | 33.0 | 40050 | 12.5 | — |
| 9532 [Siii] | -0.592 | 140.1 | 3278148 | 4.5 | — |
| 9547 P8 | -0.593 | 21.7 | 45569 | 15.1 | — |
| I(H)(erg seg cm) | 1.49 10 | ||||
| c(H) | 0.130.01 | 0.05 | |||
| possibly blend with an unknown line; [Oii] 3726 + 3729; [Feiii] 4986 + 4987; [Oii] 7318 + 7320; [Oii] 7330 + 7331. | |||||
| from Izotov et al. [2006A&A...448..955I]; they gave [Sii] 6717 + 6731 and [Oii] 7319 + 7330. | |||||
| SDSS J1509 | ||||||
|---|---|---|---|---|---|---|
| (Å) | f() | -EW | Error | |||
| (Å) | (%) | |||||
| 3727 [Oii] | 0.271 | 131.7 | 15318182 | 1.2 | 20970760 | 186201800 |
| 3734 H13 | 0.270 | 3.5 | 27856 | 20.3 | — | — |
| 3750 H12 | 0.266 | 2.1 | 20348 | 23.8 | 30080 | — |
| 3770 H11 | 0.261 | 2.4 | 23638 | 16.1 | 46080 | — |
| 3798 H10 | 0.254 | 4.7 | 41060 | 14.7 | 48090 | — |
| 3820 Hei | 0.249 | 0.6 | 6615 | 23.0 | — | — |
| 3835 H9 | 0.246 | 6.3 | 53759 | 11.0 | 71090 | — |
| 3868 [Neiii] | 0.238 | 32.5 | 3501109 | 3.1 | 4120180 | 3980380 |
| 3889 Hei+H8 | 0.233 | 16.4 | 162281 | 5.0 | — | — |
| 3968 [Neiii]+H7 | 0.216 | 20.6 | 2262113 | 5.0 | — | 2570250 |
| 4026 [Nii]+Hei | 0.203 | 1.4 | 15719 | 12.2 | — | — |
| 4068 [Sii] | 0.195 | 1.7 | 19919 | 9.6 | — | — |
| 4102 H | 0.188 | 26.8 | 242061 | 2.5 | 2730140 | 2820270 |
| 4340 H | 0.142 | 54.1 | 439576 | 1.7 | 4860200 | 4680450 |
| 4363 [Oiii] | 0.138 | 4.2 | 42021 | 5.1 | 50060 | 55080 |
| 4471 Hei | 0.106 | 5.1 | 45432 | 6.9 | — | — |
| 4658 [Feiii] | 0.053 | 1.1 | 10612 | 11.3 | 11050 | — |
| 4686 Heii | 0.045 | — | — | — | — | — |
| 4713 [Ariv]+Hei | 0.038 | — | — | — | — | — |
| 4740 [Ariv] | 0.031 | — | — | — | — | — |
| 4861 H | 0.000 | 123.4 | 1000074 | 0.7 | 10000350 | 10000960 |
| 4881 [Feiii] | -0.005 | — | — | — | — | — |
| 4921 Hei | -0.014 | 1.1 | 9912 | 12.1 | — | — |
| 4959 [Oiii] | -0.024 | 190.7 | 16751148 | 0.9 | 16610560 | 166001600 |
| 4986 [Feiii] | -0.030 | 1.3 | 11416 | 14.0 | 14040 | — |
| 5007 [Oiii] | -0.035 | 571.3 | 49942153 | 0.3 | — | 501204840 |
| 5015 Hei | -0.037 | 2.9 | 24926 | 10.5 | — | — |
| 5199 [Ni] | -0.078 | 1.4 | 10520 | 18.9 | — | — |
| 5270 [Feiii] | -0.094 | — | — | — | — | — |
| 5755 [Nii] | -0.188 | — | — | — | — | — |
| 5876 Hei | -0.209 | 21.6 | 126859 | 4.7 | 112070 | 1230120 |
| 6300 [Oi] | -0.276 | 7.7 | 45226 | 5.7 | 40040 | — |
| 6312 [Siii] | -0.278 | 2.8 | 1649 | 5.7 | 16040 | — |
| 6364 [Oi] | -0.285 | 2.6 | 14619 | 12.8 | — | — |
| 6548 [Nii] | -0.311 | 9.6 | 54128 | 5.3 | — | — |
| 6563 H | -0.313 | 522.6 | 27969141 | 0.5 | 285701020 | 281802720 |
| 6584 [Nii] | -0.316 | 25.4 | 138737 | 2.6 | 137070 | 1910180 |
| 6678 Hei | -0.329 | 7.2 | 39215 | 3.7 | — | — |
| 6717 [Sii] | -0.334 | 35.8 | 196648 | 2.4 | 2880110 | 2140210 |
| 6731 [Sii] | -0.336 | 27.1 | 148840 | 2.7 | — | 1780170 |
| 7065 Hei | -0.377 | 6.0 | 30219 | 6.2 | — | — |
| 7136 [Ariii] | -0.385 | 19.1 | 98229 | 3.0 | 79050 | 1200120 |
| 7281 Hei | -0.402 | — | — | — | — | — |
| 7319 [Oii] | -0.406 | 4.8 | 2039 | 4.6 | 41050 | — |
| 7330 [Oii] | -0.407 | 4.0 | 1678 | 5.1 | — | — |
| 7751 [Ariii] | -0.451 | 5.2 | 24216 | 6.7 | — | — |
| 8446 Oi | -0.513 | 1.6 | 6810 | 15.3 | — | — |
| 8503 P16 | -0.518 | — | — | — | — | — |
| 8546 P15 | -0.521 | — | — | — | — | — |
| 8599 P14 | -0.525 | 3.5 | 10033 | 32.9 | — | — |
| 8665 P13 | -0.531 | 4.0 | 11842 | 35.7 | — | — |
| 8751 P12 | -0.537 | 5.0 | 15447 | 30.6 | — | — |
| 8865 P11 | -0.546 | 11.4 | 29765 | 21.7 | — | — |
| 9014 P10 | -0.557 | 33.6 | 44793 | 20.8 | — | — |
| 9069 [Siii] | -0.561 | 82.1 | 2546120 | 4.7 | — | — |
| 9229 P9 | -0.572 | 27.2 | 59598 | 16.5 | — | — |
| 9532 [Siii] | -0.592 | 176.3 | 5181256 | 4.9 | — | — |
| 9547 P8 | -0.593 | 43.5 | 876129 | 14.7 | — | — |
| I(H)(erg seg cm) | 1.35 10 | |||||
| c(H) | 0.070.01 | 0.08 | 0.05 | |||
| possibly blend with an unknown line; [Oii] 3726 + 3729; [Feiii] 4986 + 4987; [Oii] 7318 + 7320; [Oii] 7330 + 7331. | ||||||
| from Izotov et al. [2006A&A...448..955I]; they gave [Sii] 6717 + 6731 and [Oii] 7319 + 7330. | ||||||
| from Peimbert and Torres-Peimbert [1992A&A...253..349P]. | ||||||
| SDSS J1528 | |||||
|---|---|---|---|---|---|
| (Å) | f() | -EW | Error | ||
| (Å) | (%) | ||||
| 3727 [Oii] | 0.271 | 177.4 | 22882294 | 1.3 | 223902160 |
| 3734 H13 | 0.270 | 2.8 | 29556 | 19.1 | — |
| 3750 H12 | 0.266 | 2.9 | 31564 | 20.3 | — |
| 3770 H11 | 0.261 | 5.0 | 51053 | 10.4 | — |
| 3798 H10 | 0.254 | 7.6 | 70970 | 9.9 | — |
| 3820 Hei | 0.249 | — | — | — | — |
| 3835 H9 | 0.246 | 7.6 | 82058 | 7.1 | — |
| 3868 [Neiii] | 0.238 | 39.0 | 4717180 | 3.8 | 5370520 |
| 3889 Hei+H8 | 0.233 | 21.1 | 215174 | 3.5 | — |
| 3968 [Neiii]+H7 | 0.216 | 35.3 | 3231143 | 4.4 | 3020290 |
| 4026 [Nii]+Hei | 0.203 | 1.9 | 20855 | 26.4 | — |
| 4068 [Sii] | 0.195 | 2.0 | 21418 | 8.3 | — |
| 4102 H | 0.188 | 41.6 | 282494 | 3.3 | 2820270 |
| 4340 H | 0.142 | 62.4 | 477376 | 1.6 | 4790460 |
| 4363 [Oiii] | 0.138 | 5.4 | 50022 | 4.4 | — |
| 4471 Hei | 0.106 | 5.8 | 46528 | 5.9 | — |
| 4658 [Feiii] | 0.053 | 1.6 | 12517 | 14.0 | — |
| 4686 Heii | 0.045 | — | — | — | — |
| 4713 [Ariv]+Hei | 0.038 | 1.0 | 7924 | 29.8 | — |
| 4740 [Ariv] | 0.031 | — | — | — | — |
| 4861 H | 0.000 | 171.4 | 10000116 | 1.2 | 10000960 |
| 4881 [Feiii] | -0.005 | — | — | — | — |
| 4921 Hei | -0.014 | 1.9 | 11417 | 14.8 | — |
| 4959 [Oiii] | -0.024 | 256.2 | 16557173 | 1.0 | 158501530 |
| 4986 [Feiii] | -0.030 | 2.0 | 12931 | 24.2 | — |
| 5007 [Oiii] | -0.035 | 764.2 | 48932292 | 0.6 | 478604620 |
| 5015 Hei | -0.037 | 5.4 | 32432 | 10.0 | — |
| 5199 [Ni] | -0.078 | — | — | — | — |
| 5270 [Feiii] | -0.094 | — | — | — | — |
| 5755 [Nii] | -0.188 | — | — | — | — |
| 5876 Hei | -0.209 | 28.5 | 122736 | 2.9 | — |
| 6300 [Oi] | -0.276 | 11.3 | 43818 | 4.0 | 1200180 |
| 6312 [Siii] | -0.278 | 4.3 | 16810 | 5.9 | — |
| 6364 [Oi] | -0.285 | 3.8 | 14512 | 8.1 | — |
| 6548 [Nii] | -0.311 | 19.4 | 72145 | 6.3 | — |
| 6563 H | -0.313 | 823.2 | 28888169 | 0.6 | 295102850 |
| 6584 [Nii] | -0.316 | 54.0 | 195943 | 2.2 | 1450140 |
| 6678 Hei | -0.329 | 10.3 | 35010 | 2.7 | — |
| 6717 [Sii] | -0.334 | 57.1 | 192375 | 3.9 | 1320200 |
| 6731 [Sii] | -0.336 | 43.7 | 142258 | 4.1 | 1120170 |
| 7065 Hei | -0.377 | 9.6 | 29717 | 5.6 | — |
| 7136 [Ariii] | -0.385 | 19.1 | — | 6.1 | — |
| 7281 Hei | -0.402 | 2.0 | 605 | 9.2 | — |
| 7319 [Oii] | -0.406 | 10.0 | 29617 | 5.7 | — |
| 7330 [Oii] | -0.407 | 8.2 | 23812 | 4.9 | — |
| 7751 [Ariii] | -0.451 | 8.1 | 21013 | 6.2 | — |
| 8446 Oi | -0.513 | — | — | — | — |
| 8503 P16 | -0.518 | — | — | — | — |
| 8546 P15 | -0.521 | — | — | — | — |
| 8599 P14 | -0.525 | 4.8 | 7213 | 18.4 | — |
| 8665 P13 | -0.531 | 5.7 | 10215 | 14.5 | — |
| 8751 P12 | -0.537 | 12.0 | 14516 | 10.7 | — |
| 8865 P11 | -0.546 | 24.5 | 19943 | 21.8 | — |
| 9014 P10 | -0.557 | — | — | — | — |
| 9069 [Siii] | -0.561 | 88.1 | 1688127 | 7.5 | — |
| 9229 P9 | -0.572 | 31.9 | 29286 | 29.3 | — |
| 9532 [Siii] | -0.592 | 506.6 | 4049289 | 7.1 | — |
| 9547 P8 | -0.593 | — | — | — | — |
| I(H)(erg seg cm) | 1.73 10 | ||||
| c(H) | 0.040.01 | 0.15 | |||
| possibly blend with an unknown line; [Oii] 3726 + 3729; [Feiii] 4986 + 4987; [Oii] 7318 + 7320; [Oii] 7330 + 7331. | |||||
| from Peimbert and Torres-Peimbert [1992A&A...253..349P]. | |||||
| SDSS J1540 | ||||||
|---|---|---|---|---|---|---|
| (Å) | f() | -EW | Error | |||
| (Å) | (%) | |||||
| 3727 [Oii] | 0.271 | 232.8 | 21793256 | 1.2 | — | — |
| 3734 H13 | 0.270 | 2.6 | 27248 | 17.7 | — | — |
| 3750 H12 | 0.266 | — | — | — | — | — |
| 3770 H11 | 0.261 | 2.7 | 31461 | 19.4 | — | — |
| 3798 H10 | 0.254 | 4.8 | 58193 | 16.0 | 76090 | 810280 |
| 3820 Hei | 0.249 | 1.5 | 16623 | 14.1 | — | — |
| 3835 H9 | 0.246 | 6.2 | 67885 | 12.5 | 92090 | 940260 |
| 3868 [Neiii] | 0.238 | 15.2 | 214282 | 3.8 | 186090 | — |
| 3889 Hei+H8 | 0.233 | 11.6 | 1445113 | 7.8 | — | — |
| 3968 [Neiii]+H7 | 0.216 | 21.9 | 2309144 | 6.3 | — | — |
| 4026 [Nii]+Hei | 0.203 | 20.6 | 250578 | 3.1 | — | — |
| 4068 [Sii] | 0.195 | 1.7 | 23118 | 7.9 | — | — |
| 4102 H | 0.188 | 23.7 | 258963 | 2.4 | 2570120 | 2590130 |
| 4340 H | 0.142 | 44.2 | 475361 | 1.3 | 4670170 | 4640100 |
| 4363 [Oiii] | 0.138 | 4.5 | 29117 | 6.0 | 22040 | 22050 |
| 4471 Hei | 0.106 | 4.7 | 46333 | 7.1 | — | — |
| 4658 [Feiii] | 0.053 | 0.7 | 7814 | 18.2 | — | — |
| 4686 Heii | 0.045 | — | — | — | — | — |
| 4713 [Ariv]+Hei | 0.038 | — | — | — | — | — |
| 4740 [Ariv] | 0.031 | — | — | — | — | — |
| 4861 H | 0.000 | 122.4 | 1000076 | 0.8 | 10000340 | 10000100 |
| 4881 [Feiii] | -0.005 | — | — | — | — | — |
| 4921 Hei | -0.014 | 1.2 | 10915 | 13.9 | — | — |
| 4959 [Oiii] | -0.024 | 114.4 | 1048075 | 0.7 | 9920340 | 983090 |
| 4986 [Feiii] | -0.030 | 0.9 | 8412 | 14.5 | 18040 | — |
| 5007 [Oiii] | -0.035 | 348.3 | 30942188 | 0.6 | — | 29000230 |
| 5015 Hei | -0.037 | 2.7 | 23516 | 7.0 | — | — |
| 5199 [Ni] | -0.078 | 2.0 | 15127 | 17.8 | — | — |
| 5270 [Feiii] | -0.094 | — | — | — | — | — |
| 5755 [Nii] | -0.188 | — | — | — | — | — |
| 5876 Hei | -0.209 | 19.2 | 115536 | 3.1 | 109060 | — |
| 6300 [Oi] | -0.276 | 6.4 | 33514 | 4.3 | 33030 | — |
| 6312 [Siii] | -0.278 | 2.6 | 13910 | 6.8 | 11030 | — |
| 6364 [Oi] | -0.285 | 2.3 | 12217 | 13.9 | — | — |
| 6548 [Nii] | -0.311 | 13.9 | 73534 | 4.7 | — | — |
| 6563 H | -0.313 | 581.9 | 28626162 | 0.6 | 287701010 | 28730220 |
| 6584 [Nii] | -0.316 | 42.2 | 211666 | 3.1 | 196090 | — |
| 6678 Hei | -0.329 | 6.8 | 31615 | 4.6 | — | — |
| 6717 [Sii] | -0.334 | 52.6 | 260952 | 2.0 | 4330130 | 245030 |
| 6731 [Sii] | -0.336 | 41.7 | 191950 | 2.6 | — | 180030 |
| 7065 Hei | -0.377 | 4.5 | 2009 | 4.4 | — | — |
| 7136 [Ariii] | -0.385 | 23.2 | 89252 | 5.8 | 88050 | — |
| 7281 Hei | -0.402 | 3.1 | 11510 | 8.9 | — | — |
| 7319 [Oii] | -0.406 | 6.3 | 27316 | 5.7 | 50040 | 46040 |
| 7330 [Oii] | -0.407 | 5.0 | 21612 | 5.8 | — | — |
| 7751 [Ariii] | -0.451 | 6.1 | 22326 | 11.6 | — | — |
| 8446 Oi | -0.513 | — | — | — | — | — |
| 8503 P16 | -0.518 | — | — | — | — | — |
| 8546 P15 | -0.521 | — | — | — | — | — |
| 8599 P14 | -0.525 | — | — | — | — | — |
| 8665 P13 | -0.531 | — | — | — | — | — |
| 8751 P12 | -0.537 | — | — | — | — | — |
| 8865 P11 | -0.546 | — | — | — | — | — |
| 9014 P10 | -0.557 | 12.9 | 23768 | 28.5 | — | — |
| 9069 [Siii] | -0.561 | 67.2 | 209562 | 3.0 | 2020100 | — |
| 9229 P9 | -0.572 | — | — | — | — | — |
| 9532 [Siii] | -0.592 | 236.8 | 5331331 | 6.2 | — | — |
| 9547 P8 | -0.593 | 29.0 | 573145 | 25.2 | — | — |
| I(H)(erg seg cm) | 0.53 10 | |||||
| c(H) | 0.220.01 | 0.07 | 0.07 | |||
| possibly blend with an unknown line; [Oii] 3726 + 3729; [Feiii] 4986 + 4987; [Oii] 7318 + 7320; [Oii] 7330 + 7331. | ||||||
| from Izotov et al. [2006A&A...448..955I]; they gave [Sii] 6717 + 6731 and [Oii] 7319 + 7330. | ||||||
| from Kniazev et al. [2004ApJS..153..429K]; they gave [Oii] 7319 + 7330. | ||||||
| SDSS J1616 | |||||
|---|---|---|---|---|---|
| (Å) | f() | -EW | Error | ||
| (Å) | (%) | ||||
| 3727 [Oii] | 0.271 | 33.5 | 8491196 | 2.3 | — |
| 3734 H13 | 0.270 | — | — | — | — |
| 3750 H12 | 0.266 | 1.8 | 377101 | 26.7 | — |
| 3770 H11 | 0.261 | 1.5 | 357113 | 31.7 | — |
| 3798 H10 | 0.254 | 2.1 | 44792 | 20.6 | — |
| 3820 Hei | 0.249 | — | — | — | — |
| 3835 H9 | 0.246 | 3.1 | 63890 | 14.1 | 790110 |
| 3868 [Neiii] | 0.238 | 17.2 | 4105166 | 4.0 | 5450230 |
| 3889 Hei+H8 | 0.233 | 7.3 | 1591112 | 7.0 | — |
| 3968 [Neiii]+H7 | 0.216 | 11.7 | 2563125 | 4.9 | — |
| 4026 [Nii]+Hei | 0.203 | 0.4 | 9415 | 15.5 | — |
| 4068 [Sii] | 0.195 | 0.5 | 10810 | 8.9 | — |
| 4102 H | 0.188 | 13.3 | 253067 | 2.6 | 2800150 |
| 4340 H | 0.142 | 26.7 | 459789 | 1.9 | 5000200 |
| 4363 [Oiii] | 0.138 | 4.5 | 85126 | 3.1 | 98080 |
| 4471 Hei | 0.106 | 2.5 | 40432 | 8.0 | — |
| 4658 [Feiii] | 0.053 | — | — | — | — |
| 4686 Heii | 0.045 | 2.1 | 32943 | 13.0 | 31060 |
| 4713 [Ariv]+Hei | 0.038 | — | — | — | — |
| 4740 [Ariv] | 0.031 | 0.5 | 6922 | 31.7 | — |
| 4861 H | 0.000 | 83.0 | 1000096 | 1.0 | 10000350 |
| 4881 [Feiii] | -0.005 | — | — | — | — |
| 4921 Hei | -0.014 | 0.9 | 11613 | 11.2 | — |
| 4959 [Oiii] | -0.024 | 156.5 | 20492147 | 0.7 | 20380680 |
| 4986 [Feiii] | -0.030 | — | — | — | — |
| 5007 [Oiii] | -0.035 | 480.7 | 61516371 | 0.6 | — |
| 5015 Hei | -0.037 | 1.8 | 22526 | 11.8 | — |
| 5199 [Ni] | -0.078 | — | — | — | — |
| 5270 [Feiii] | -0.094 | — | — | — | — |
| 5755 [Nii] | -0.188 | — | — | — | — |
| 5876 Hei | -0.209 | 13.7 | 106375 | 7.1 | 97060 |
| 6300 [Oi] | -0.276 | 1.7 | 10418 | 16.9 | 17040 |
| 6312 [Siii] | -0.278 | 3.2 | 18611 | 6.1 | 20040 |
| 6364 [Oi] | -0.285 | 0.9 | 5113 | 25.0 | — |
| 6548 [Nii] | -0.311 | 2.8 | 16013 | 8.2 | — |
| 6563 H | -0.313 | 517.2 | 27892145 | 0.5 | 281601000 |
| 6584 [Nii] | -0.316 | 8.0 | 43423 | 5.3 | 38040 |
| 6678 Hei | -0.329 | 5.9 | 29618 | 6.2 | — |
| 6717 [Sii] | -0.334 | 15.3 | 77423 | 2.9 | 140070 |
| 6731 [Sii] | -0.336 | 11.9 | 58122 | 3.8 | — |
| 7065 Hei | -0.377 | 5.1 | 22914 | 6.0 | — |
| 7136 [Ariii] | -0.385 | 17.4 | 73644 | 6.0 | 69050 |
| 7281 Hei | -0.402 | — | — | — | — |
| 7319 [Oii] | -0.406 | 3.4 | 13811 | 7.9 | 26040 |
| 7330 [Oii] | -0.407 | 2.2 | 907 | 8.1 | — |
| 7751 [Ariii] | -0.451 | 4.5 | 16621 | 12.7 | — |
| 8446 Oi | -0.513 | — | — | — | — |
| 8503 P16 | -0.518 | 2.6 | 6020 | 33.5 | — |
| 8546 P15 | -0.521 | 1.6 | 3814 | 37.5 | — |
| 8599 P14 | -0.525 | 5.6 | 10920 | 18.1 | — |
| 8665 P13 | -0.531 | 8.0 | 15331 | 20.5 | — |
| 8751 P12 | -0.537 | 8.1 | 18132 | 17.7 | — |
| 8865 P11 | -0.546 | 9.6 | 18234 | 18.4 | — |
| 9014 P10 | -0.557 | 24.4 | 31944 | 13.7 | — |
| 9069 [Siii] | -0.561 | 74.3 | 164762 | 3.8 | 147080 |
| 9229 P9 | -0.572 | 14.2 | 27251 | 18.9 | — |
| 9532 [Siii] | -0.592 | 74.3 | 4011153 | 3.8 | — |
| 9547 P8 | -0.593 | — | — | — | — |
| I(H)(erg seg cm) | 1.36 10 | ||||
| c(H) | 0.020.01 | 0.06 | |||
| possibly blend with an unknown line; [Oii] 3726 + 3729; [Feiii] 4986 + 4987; [Oii] 7318 + 7320; [Oii] 7330 + 7331. | |||||
| from Izotov et al. [2006A&A...448..955I]; they gave [Sii] 6717 + 6731 and [Oii] 7319 + 7330. | |||||
| SDSS J1657 | ||||
|---|---|---|---|---|
| (Å) | f() | -EW | Error | |
| (Å) | (%) | |||
| 3727 [Oii] | 0.271 | 120.1 | 18832230 | 1.2 |
| 3734 H13 | 0.270 | — | — | — |
| 3750 H12 | 0.266 | 1.9 | 23247 | 20.2 |
| 3770 H11 | 0.261 | 2.3 | 29340 | 13.8 |
| 3798 H10 | 0.254 | 4.1 | 50068 | 13.5 |
| 3820 Hei | 0.249 | — | — | — |
| 3835 H9 | 0.246 | 7.1 | 78093 | 11.9 |
| 3868 [Neiii] | 0.238 | 23.1 | 3262132 | 4.0 |
| 3889 Hei+H8 | 0.233 | 14.0 | 182695 | 5.2 |
| 3968 [Neiii]+H7 | 0.216 | 22.4 | 2456121 | 4.9 |
| 4026 [Nii]+Hei | 0.203 | 1.1 | 15516 | 10.4 |
| 4068 [Sii] | 0.195 | 1.4 | 19815 | 7.4 |
| 4102 H | 0.188 | 20.9 | 243265 | 2.7 |
| 4340 H | 0.142 | 43.1 | 441797 | 2.2 |
| 4363 [Oiii] | 0.138 | 4.5 | 52424 | 4.6 |
| 4471 Hei | 0.106 | 4.2 | 44333 | 7.4 |
| 4658 [Feiii] | 0.053 | 1.0 | 10716 | 14.9 |
| 4686 Heii | 0.045 | 1.2 | 12614 | 11.0 |
| 4713 [Ariv]+Hei | 0.038 | — | — | — |
| 4740 [Ariv] | 0.031 | — | — | — |
| 4861 H | 0.000 | 117.8 | 1000079 | 0.8 |
| 4881 [Feiii] | -0.005 | — | — | — |
| 4921 Hei | -0.014 | 0.8 | 7514 | 18.6 |
| 4959 [Oiii] | -0.024 | 152.5 | 14333127 | 0.9 |
| 4986 [Feiii] | -0.030 | 1.4 | 13528 | 20.5 |
| 5007 [Oiii] | -0.035 | 455.1 | 43082240 | 0.6 |
| 5015 Hei | -0.037 | 2.4 | 22223 | 10.1 |
| 5199 [Ni] | -0.078 | 2.0 | 15726 | 16.4 |
| 5270 [Feiii] | -0.094 | — | — | — |
| 5755 [Nii] | -0.188 | — | — | — |
| 5876 Hei | -0.209 | 18.9 | 111644 | 3.9 |
| 6300 [Oi] | -0.276 | 8.1 | 43816 | 3.7 |
| 6312 [Siii] | -0.278 | 3.7 | 2019 | 4.3 |
| 6364 [Oi] | -0.285 | 2.8 | 15218 | 11.8 |
| 6548 [Nii] | -0.311 | 9.4 | 46423 | 5.0 |
| 6563 H | -0.313 | 571.3 | 27772153 | 0.5 |
| 6584 [Nii] | -0.316 | 28.8 | 142847 | 3.3 |
| 6678 Hei | -0.329 | 6.7 | 31518 | 5.7 |
| 6717 [Sii] | -0.334 | 47.4 | 220757 | 2.6 |
| 6731 [Sii] | -0.336 | 32.2 | 159843 | 2.7 |
| 7065 Hei | -0.377 | 5.6 | 23510 | 4.4 |
| 7136 [Ariii] | -0.385 | 16.4 | 71726 | 3.6 |
| 7281 Hei | -0.402 | 0.9 | 417 | 18.2 |
| 7319 [Oii] | -0.406 | 12.3 | 30217 | 5.6 |
| 7330 [Oii] | -0.407 | 8.8 | 21114 | 6.5 |
| 7751 [Ariii] | -0.451 | 4.6 | 17722 | 12.3 |
| 8446 Oi | -0.513 | — | — | — |
| 8503 P16 | -0.518 | — | — | — |
| 8546 P15 | -0.521 | — | — | — |
| 8599 P14 | -0.525 | — | — | — |
| 8665 P13 | -0.531 | 7.7 | 14453 | 37.1 |
| 8751 P12 | -0.537 | 4.2 | 10129 | 28.2 |
| 8865 P11 | -0.546 | 8.5 | 21134 | 16.3 |
| 9014 P10 | -0.557 | 15.4 | 16736 | 21.5 |
| 9069 [Siii] | -0.561 | 59.2 | 140099 | 7.1 |
| 9229 P9 | -0.572 | 16.9 | 26347 | 18.0 |
| 9532 [Siii] | -0.592 | 157.3 | 3674257 | 7.0 |
| 9547 P8 | -0.593 | — | — | — |
| I(H)(erg seg cm) | 0.63 10 | |||
| c(H) | 0.050.01 | |||
| possibly blend with an unknown line; [Oii] 3726 + 3729; [Feiii] 4986 + 4987; [Oii] 7318 + 7320; [Oii] 7330 + 7331. | ||||
| SDSS J1729 | ||||||
|---|---|---|---|---|---|---|
| (Å) | f() | -EW | Error | |||
| (Å) | (%) | |||||
| 3727 [Oii] | 0.271 | 135.8 | 17622243 | 1.4 | — | — |
| 3734 H13 | 0.270 | 1.4 | 17554 | 31.0 | — | — |
| 3750 H12 | 0.266 | 4.2 | 39789 | 22.4 | 37070 | — |
| 3770 H11 | 0.261 | 7.6 | 71388 | 12.4 | 48070 | — |
| 3798 H10 | 0.254 | 5.2 | 59871 | 11.8 | 62060 | 370200 |
| 3820 Hei | 0.249 | — | — | — | — | — |
| 3835 H9 | 0.246 | 7.6 | 72164 | 8.8 | 90060 | 640140 |
| 3868 [Neiii] | 0.238 | 34.9 | 4787172 | 3.6 | 3730140 | — |
| 3889 Hei+H8 | 0.233 | 16.9 | 205883 | 4.0 | — | — |
| 3968 [Neiii]+H7 | 0.216 | 24.7 | 2969129 | 4.3 | — | — |
| 4026 [Nii]+Hei | 0.203 | 2.4 | 31130 | 9.7 | — | — |
| 4068 [Sii] | 0.195 | 0.9 | 12211 | 8.7 | — | — |
| 4102 H | 0.188 | 24.9 | 276563 | 2.3 | 2540100 | 2430100 |
| 4340 H | 0.142 | 48.7 | 483984 | 1.7 | 4760170 | 475080 |
| 4363 [Oiii] | 0.138 | 5.9 | 66030 | 4.5 | 51040 | 51040 |
| 4471 Hei | 0.106 | 5.2 | 51624 | 4.7 | — | — |
| 4658 [Feiii] | 0.053 | 0.8 | 9014 | 15.8 | — | — |
| 4686 Heii | 0.045 | — | — | — | — | — |
| 4713 [Ariv]+Hei | 0.038 | 0.7 | 7716 | 20.8 | — | — |
| 4740 [Ariv] | 0.031 | 0.4 | 4010 | 26.0 | — | — |
| 4861 H | 0.000 | 125.6 | 1000083 | 0.8 | 10000320 | 1000080 |
| 4881 [Feiii] | -0.005 | — | — | — | — | — |
| 4921 Hei | -0.014 | 1.4 | 12212 | 10.1 | — | — |
| 4959 [Oiii] | -0.024 | 185.8 | 17097146 | 0.9 | 16990540 | 1747090 |
| 4986 [Feiii] | -0.030 | 0.6 | 5618 | 31.8 | 8030 | — |
| 5007 [Oiii] | -0.035 | 555.4 | 51541418 | 0.8 | — | 52320300 |
| 5015 Hei | -0.037 | 1.9 | 17712 | 7.0 | — | — |
| 5199 [Ni] | -0.078 | — | — | — | — | — |
| 5270 [Feiii] | -0.094 | 0.7 | 5512 | 22.2 | — | — |
| 5755 [Nii] | -0.188 | 0.8 | 606 | 10.4 | — | — |
| 5876 Hei | -0.209 | 17.4 | 126137 | 2.9 | 113050 | — |
| 6300 [Oi] | -0.276 | 4.0 | 25316 | 6.3 | 26030 | — |
| 6312 [Siii] | -0.278 | 2.7 | 17611 | 6.4 | 17030 | — |
| 6364 [Oi] | -0.285 | 1.2 | 7811 | 13.6 | — | — |
| 6548 [Nii] | -0.311 | 12.5 | 77121 | 2.8 | — | — |
| 6563 H | -0.313 | 476.9 | 28700163 | 0.6 | 28510960 | 28530150 |
| 6584 [Nii] | -0.316 | 35.8 | 218952 | 2.4 | 208080 | — |
| 6678 Hei | -0.329 | 6.0 | 35512 | 3.4 | — | — |
| 6717 [Sii] | -0.334 | 21.7 | 128632 | 2.5 | 216080 | 122020 |
| 6731 [Sii] | -0.336 | 17.3 | 100930 | 2.9 | — | 95020 |
| 7065 Hei | -0.377 | 5.7 | 26518 | 6.9 | — | — |
| 7136 [Ariii] | -0.385 | 18.0 | 86441 | 4.8 | 95050 | — |
| 7281 Hei | -0.402 | 1.5 | 7511 | 15.0 | — | — |
| 7319 [Oii] | -0.406 | 4.6 | 2338 | 3.6 | 43040 | 39020 |
| 7330 [Oii] | -0.407 | 3.9 | 1949 | 4.5 | — | — |
| 7751 [Ariii] | -0.451 | 4.5 | 21010 | 4.7 | — | — |
| 8446 Oi | -0.513 | — | — | — | — | — |
| 8503 P16 | -0.518 | 3.0 | 10232 | 31.6 | — | — |
| 8546 P15 | -0.521 | — | — | — | — | — |
| 8599 P14 | -0.525 | 2.9 | 9617 | 18.1 | — | — |
| 8665 P13 | -0.531 | 4.7 | 14020 | 14.4 | — | — |
| 8751 P12 | -0.537 | 7.0 | 20535 | 16.9 | — | — |
| 8865 P11 | -0.546 | — | — | — | — | — |
| 9014 P10 | -0.557 | 8.1 | 23654 | 22.8 | — | — |
| 9069 [Siii] | -0.561 | 58.5 | 209295 | 4.5 | — | — |
| 9229 P9 | -0.572 | 19.9 | 40064 | 15.9 | — | — |
| 9532 [Siii] | -0.592 | 181.5 | 4718250 | 5.3 | — | — |
| 9547 P8 | -0.593 | 20.3 | 48069 | 14.3 | — | — |
| I(H)(erg seg cm) | 2.40 10 | |||||
| c(H) | 0.030.01 | 0.02 | 0.04 | |||
| possibly blend with an unknown line; [Oii] 3726 + 3729; [Feiii] 4986 + 4987; [Oii] 7318 + 7320; [Oii] 7330 + 7331. | ||||||
| from Izotov et al. [2006A&A...448..955I]; they gave [Sii] 6717 + 6731 and [Oii] 7319 + 7330. | ||||||
| from Kniazev et al. [2004ApJS..153..429K]; they gave [Oii] 7319 + 7330. | ||||||
Bibliography
- 2004 Abazajian, K., Adelman-McCarthy, J. K., Agüeros, M. A., Allam, S. S., Anderson, K., Anderson, S. F., Annis, J., Bahcall, N. A., Baldry, I. K., Bastian, S., and 143 coauthors: 2004, Astron. J. 128, 502
- 2005 Abazajian, K., Adelman-McCarthy, J. K., Agüeros, M. A., Allam, S. S., Anderson, K. S. J., Anderson, S. F., Annis, J., Bahcall, N. A., Baldry, I. K., Bastian, S., and 144 coauthors: 2005, Astron. J. 129, 1755
- 2008 Adelman-McCarthy, J. K., Agüeros, M. A., Allam, S. S., Allende Prieto, C., Anderson, K. S. J., Anderson, S. F., Annis, J., Bahcall, N. A., Bailer-Jones, C. A. L., Baldry, I. K., and 153 coauthors: 2008, Astrophys. J., Suppl. Ser. 175, 297
- 2006 Adelman-McCarthy, J. K., Agüeros, M. A., Allam, S. S., Anderson, K. S. J., Anderson, S. F., Annis, J., Bahcall, N. A., Baldry, I. K., Barentine, J. C., Berlind, A., and 131 coauthors: 2006, Astrophys. J., Suppl. Ser. 162, 38
- 2001 Allende-Prieto, C., Lambert, D. L., and Asplund, M.: 2001, Astrophys. J. Letters 556, L63
- 1979 Alloin, D., Collin-Souffrin, S., Joly, M., and Vigroux, L.: 1979, Astron. Astrophys. 78, 200
- 1982 Alloin, D. and Nieto, J.-L.: 1982, Astron. and Astrophys. Suppl. Sries 50, 491
- 1999 Aloisi, A., Tosi, M., and Greggio, L.: 1999, Astron. J. 118, 302
- 2001a Alonso-Herrero, A., Engelbracht, C. W., Rieke, M. J., Rieke, G. H., and Quillen, A. C.: 2001a, Astrophys. J. 546, 952
- 2000 Alonso-Herrero, A., Rieke, G. H., Rieke, M. J., and Scoville, N. Z.: 2000, Astrophys. J. 532, 845
- 2001b Alonso-Herrero, A., Ryder, S. D., and Knapen, J. H.: 2001b, Mon. Not. R. Astron. Soc. 322, 757
- 2002 Álvarez-Álvarez, M.: 2002, PhD Thesis, Universidad Autónoma de Madrid
- 1985 Arp, H. and Sandage, A.: 1985, Astron. J. 90, 1163
- 2007 Asari, N. V., Cid Fernandes, R., Stasińska, G., Torres-Papaqui, J. P., Mateus, A., Sodré, L., Schoenell, W., and Gomes, J. M.: 2007, Mon. Not. R. Astron. Soc. 381, 263
- 2005 Asplund, M., Grevesse, N., and Sauval, A. J.: 2005, in T. G. Barnes, III and F. N. Bash (eds.), Cosmic Abundances as Records of Stellar Evolution and Nucleosynthesis, Vol. 336 of Astronomical Society of the Pacific Conference Series, pp 25–+
- 1992a Athanassoula, E.: 1992a, Mon. Not. R. Astron. Soc. 259, 328
- 1992b Athanassoula, E.: 1992b, Mon. Not. R. Astron. Soc. 259, 345
- 2006 Badnell, N. R.: 2006, Astron. Astrophys. 447, 389
- 1976 Bagnuolo, Jr., W. G.: 1976, Ph.D. thesis, AA(California Inst. of Tech., Pasadena.)
- 1981 Baldwin, J. A., Phillips, M. M., and Terlevich, R.: 1981, Publ. Astron. Soc. Pac. 93, 5
- 1982 Baldwin, J. A., Spinrad, H., and Terlevich, R.: 1982, Mon. Not. R. Astron. Soc. 198, 535
- 1981 Balick, B. and Heckman, T.: 1981, Astron. Astrophys. 96, 271
- 1976 Balick, B. and Sneden, C.: 1976, Astrophys. J. 208, 336
- 1983 Balzano, V. A.: 1983, Astrophys. J. 268, 602
- 1980 Barker, T.: 1980, Astrophys. J. 240, 99
- 2000 Barmby, P., Huchra, J. P., Brodie, J. P., Forbes, D. A., Schroder, L. L., and Grillmair, C. J.: 2000, Astron. J. 119, 727
- 1995 Barth, A. J., Ho, L. C., Filippenko, A. V., and Sargent, W. L.: 1995, Astron. J. 110, 1009
- 2005 Bastian, N., Gieles, M., Lamers, H. J. G. L. M., Scheepmaker, R. A., and de Grijs, R.: 2005, Astron. Astrophys. 431, 905
- 2006 Bastian, N., Saglia, R. P., Goudfrooij, P., Kissler-Patig, M., Maraston, C., Schweizer, F., and Zoccali, M.: 2006, Astron. Astrophys. 448, 881
- 2002 Benedict, G. F., Howell, D. A., Jørgensen, I., Kenney, J. D. P., and Smith, B. J.: 2002, Astron. J. 123, 1411
- 1999 Benjamin, R. A., Skillman, E. D., and Smits, D. P.: 1999, Astrophys. J. 514, 307
- 1987 Binney, J. and Tremaine, S.: 1987, Galactic dynamics, Princeton, NJ, Princeton University Press, 1987, 747 p.
- 1993 Boer, B. and Schulz, H.: 1993, Astron. Astrophys. 277, 397
- 2001 Bosch, G. and Meza, A.: 2001, in Revista Mexicana de Astronomia y Astrofisica Conference Series, Vol. 11 of Revista Mexicana de Astronomia y Astrofisica, vol. 27, pp 29–+
- 2001 Bosch, G., Selman, F., Melnick, J., and Terlevich, R.: 2001, Astron. Astrophys. 380, 137
- 2008 Bosch, G., Terlevich, E., and Terlevich, R.: 2008, Mon. Not. R. Astron. Soc.(submitted)
- 1984 Bottinelli, L., Gouguenheim, L., Paturel, G., and de Vaucouleurs, G.: 1984, Astron. and Astrophys. Suppl. Sries 56, 381
- 2004 Bournaud, F., Duc, P.-A., Amram, P., Combes, F., and Gach, J.-L.: 2004, Astron. Astrophys. 425, 813
- 2007 Bresolin, F.: 2007, Astrophys. J. 656, 186
- 2004 Bresolin, F., Garnett, D. R., and Kennicutt, Jr., R. C.: 2004, Astrophys. J. 615, 228
- 1997 Bresolin, F. and Kennicutt, Jr., R. C.: 1997, Astron. J. 113, 975
- 1999 Bresolin, F., Kennicutt, Jr., R. C., and Garnett, D. R.: 1999, Astrophys. J. 510, 104
- 2005 Bresolin, F., Schaerer, D., González-Delgado, R. M., and Stasińska, G.: 2005, Astron. Astrophys. 441, 981
- 1971 Brocklehurst, M.: 1971, Mon. Not. R. Astron. Soc. 153, 471
- 1987 Bushouse, H. A.: 1987, Astrophys. J. 320, 49
- 1998 Bushouse, H. A., Telesco, C. M., and Werner, M. W.: 1998, Astron. J. 115, 938
- 1988 Bushouse, H. A., Werner, M. W., and Lamb, S. A.: 1988, Astrophys. J. 335, 74
- 1994 Butler, K. and Zeippen, C. J.: 1994, Astron. and Astrophys. Suppl. Sries 108, 1
- 1998 Carlson, M. N., Holtzman, J. A., Watson, A. M., Grillmair, C. J., Mould, J. R., Ballester, G. E., Burrows, C. J., Clarke, J. T., Crisp, D., Evans, R. W., Gallagher, III, J. S., Griffiths, R. E., Hester, J. J., Hoessel, J. G., Scowen, P. A., Stapelfeldt, K. R., Trauger, J. T., and Westphal, J. A.: 1998, Astron. J. 115, 1778
- 2002 Castellanos, M., Díaz, A. I., and Terlevich, E.: 2002, Mon. Not. R. Astron. Soc. 329, 315
- 1990 Cepa, J. and Beckman, J. E.: 1990, Astrophys. J. 349, 497
- 2002 Cerviño, M., Valls-Gabaud, D., Luridiana, V., and Mas-Hesse, J. M.: 2002, Astron. Astrophys. 381, 51
- 2007 Cid Fernandes, R., Asari, N. V., Sodré, L., Stasińska, G., Mateus, A., Torres-Papaqui, J. P., and Schoenell, W.: 2007, Mon. Not. R. Astron. Soc. 375, L16
- 2001 Cid Fernandes, R., Heckman, T., Schmitt, H., Delgado, R. M. G., and Storchi-Bergmann, T.: 2001, Astrophys. J. 558, 81
- 2005 Cid Fernandes, R., Mateus, A., Sodré, L., Stasińska, G., and Gomes, J. M.: 2005, Mon. Not. R. Astron. Soc. 358, 363
- 1997 Colina, L., García Vargas, M. L., Mas-Hesse, J. M., Alberdi, A., and Krabbe, A.: 1997, Astrophys. J. Letters 484, L41+
- 2002 Colina, L., González-Delgado, R., Mas-Hesse, J. M., and Leitherer, C.: 2002, Astrophys. J. 579, 545
- 1985 Combes, F. and Gerin, M.: 1985, Astron. Astrophys. 150, 327
- 2006 Crockett, N. R., Garnett, D. R., Massey, P., and Jacoby, G.: 2006, Astrophys. J. 637, 741
- 1987 de Robertis, M. M., Dufour, R. J., and Hunt, R. W.: 1987, Royal Astronomical Society of Canada, Journal 81, 195
- 1963 de Vaucouleurs, G.: 1963, Astrophys. J., Suppl. Ser. 8, 31
- 1991 de Vaucouleurs, G., de Vaucouleurs, A., Corwin, Jr., H. G., Buta, R. J., Paturel, G., and Fouque, P.: 1991, Third Reference Catalogue of Bright Galaxies, Volume 1-3, XII, 2069 pp. 7 figs.. Springer-Verlag Berlin Heidelberg New York
- 2002 Denicoló, G., Terlevich, R., and Terlevich, E.: 2002, Mon. Not. R. Astron. Soc. 330, 69
- 2002 Denicoló, G., Terlevich, R., and Terlevich, E.: 2002, Mon. Not. R. Astron. Soc. 330, 69
- 1989 Devereux, N. A.: 1989, Astrophys. J. 346, 126
- 1992 Devereux, N. A., Kenney, J. D., and Young, J. S.: 1992, Astron. J. 103, 784
- 1989 Díaz, A. I.: 1989, in J. E. Beckman and B. E. J. Pagel (eds.), Evolutionary Phenomena in Galaxies, pp 377–397
- 1988 Díaz, A. I.: 1988, Mon. Not. R. Astron. Soc. 231, 57
- 1998 Díaz, A. I.: 1998, Astron. Astrophys. Suppl. Ser. 263, 143
- 2000a Díaz, A. I., Álvarez-Álvarez, M., Terlevich, E., Terlevich, R., Portal, M. S., and Aretxaga, I.: 2000a, Mon. Not. R. Astron. Soc. 311, 120
- 2000b Díaz, A. I., Castellanos, M., Terlevich, E., and Luisa García-Vargas, M.: 2000b, Mon. Not. R. Astron. Soc. 318, 462
- 2000 Díaz, A. I. and Pérez-Montero, E.: 2000, Mon. Not. R. Astron. Soc. 312, 130
- 1985 Díaz, A. I., Pagel, B. E. J., and Wilson, I. R. G.: 1985, Mon. Not. R. Astron. Soc. 212, 737
- 1999 Díaz, A. I. and Pérez-Montero, E.: 1999, in J. R. Walsh and M. R. Rosa (eds.), Chemical Evolution from Zero to High Redshift, pp 134–+
- 2006 Díaz, A. I., Terlevich, E., Castellanos, M., and Hägele, G. F.: 2006, astro-ph/0610787
- 2007 Díaz, Á. I., Terlevich, E., Castellanos, M., and Hägele, G. F.: 2007, Mon. Not. R. Astron. Soc. 382, 251
- 1987 Díaz, A. I., Terlevich, E., Pagel, B. E. J., Víilchez, J. M., and Edmunds, M. G.: 1987, Mon. Not. R. Astron. Soc. 226, 19
- 1989 Díaz, A. I., Terlevich, E., and Terlevich, R.: 1989, Mon. Not. R. Astron. Soc. 239, 325
- 1991 Díaz, A. I., Terlevich, E., Vílchez, J. M., Pagel, B. E. J., and Edmunds, M. G.: 1991, Mon. Not. R. Astron. Soc. 253, 245
- 1999 Díaz, R., Carranza, G., Dottori, H., and Goldes, G.: 1999, Astrophys. J. 512, 623
- 2002 Dopita, M. A., Pereira, M., Kewley, L. J., and Capaccioli, M.: 2002, Astrophys. J., Suppl. Ser. 143, 47
- 2008 Dors, Jr., O. L., Storchi-Bergmann, T., Riffel, R. A., and Schimdt, A. A.: 2008, astro-ph-0802.2070
- 2005 Drake, J. J. and Testa, P.: 2005, Nature 436, 525
- 2001 Ellison, S. L., Yan, L., Hook, I. M., Pettini, M., Wall, J. V., and Shaver, P.: 2001, Astron. Astrophys. 379, 393
- 1986 Elmegreen, B. G. and Elmegreen, D. M.: 1986, Astrophys. J. 311, 554
- 2002 Elmegreen, D. M., Chromey, F. R., McGrath, E. J., and Ostenson, J. M.: 2002, Astron. J. 123, 1381
- 1997 Elmegreen, D. M., Chromey, F. R., Santos, M., and Marshall, D.: 1997, Astron. J. 114, 1850
- 2006 Elmegreen, D. M., Elmegreen, B. G., Kaufman, M., Sheth, K., Struck, C., Thomasson, M., and Brinks, E.: 2006, Astrophys. J. 642, 158
- 2001 Elmegreen, D. M., Kaufman, M., Elmegreen, B. G., Brinks, E., Struck, C., Klarić, M., and Thomasson, M.: 2001, Astron. J. 121, 182
- 1999 Elmegreen, D. M. and Salzer, J. J.: 1999, Astron. J. 117, 764
- 2007 Ercolano, B., Bastian, N., and Stasińska, G.: 2007, Mon. Not. R. Astron. Soc. 379, 945
- 2004 Esteban, C., Peimbert, M., García-Rojas, J., Ruiz, M. T., Peimbert, A., and Rodríguez, M.: 2004, Mon. Not. R. Astron. Soc. 355, 229
- 1999 Falco, E. E., Kurtz, M. J., Geller, M. J., Huchra, J. P., Peters, J., Berlind, P., Mink, D. J., Tokarz, S. P., and Elwell, B.: 1999, Publ. Astron. Soc. Pac. 111, 438
- 1998 Ferland, G. J., Korista, K. T., Verner, D. A., Ferguson, J. W., Kingdon, J. B., and Verner, E. M.: 1998, Publ. Astron. Soc. Pac. 110, 761
- 1980 French, H. B.: 1980, Astrophys. J. 240, 41
- 1995 Friedli, D. and Benz, W.: 1995, Astron. Astrophys. 301, 649
- 1995 Galavis, M. E., Mendoza, C., and Zeippen, C. J.: 1995, Astron. and Astrophys. Suppl. Sries 111, 347
- 2001 Gallagher, S. C., Charlton, J. C., Hunsberger, S. D., Zaritsky, D., and Whitmore, B. C.: 2001, Astron. J. 122, 163
- 2006 García-Rojas, J.: 2006, PhD Thesis, Universidad de La Laguna
- 1994 García Vargas, M. L. and Díaz, A. I.: 1994, Astrophys. J., Suppl. Ser. 91, 553
- 2007 García-Rojas, J. and Esteban, C.: 2007, Astrophys. J. 670, 457
- 2005 García-Rojas, J., Esteban, C., Peimbert, A., Peimbert, M., Rodríguez, M., and Ruiz, M. T.: 2005, Mon. Not. R. Astron. Soc. 362, 301
- 2006 García-Rojas, J., Esteban, C., Peimbert, M., Costado, M. T., Rodríguez, M., Peimbert, A., and Ruiz, M. T.: 2006, Mon. Not. R. Astron. Soc. 368, 253
- 2004 García-Rojas, J., Esteban, C., Peimbert, M., Rodríguez, M., Ruiz, M. T., and Peimbert, A.: 2004, Astrophys. J., Suppl. Ser. 153, 501
- 1995 García-Vargas, M. L., Bressan, A., and Díaz, A. I.: 1995, Astron. and Astrophys. Suppl. Sries 112, 35
- 1992 Garnett, D. R.: 1992, Astron. J. 103, 1330
- 2002 Garnett, D. R.: 2002, Astrophys. J. 581, 1019
- 2004 Garnett, D. R., Kennicutt, Jr., R. C., and Bresolin, F.: 2004, Astrophys. J. Letters 607, L21
- 1997 Garnett, D. R., Shields, G. A., Skillman, E. D., Sagan, S. P., and Dufour, R. J.: 1997, Astrophys. J. 489, 63
- 2003 Gil de Paz, A., Madore, B. F., and Pevunova, O.: 2003, Astrophys. J., Suppl. Ser. 147, 29
- 2005 González-Delgado, R. M., Cerviño, M., Martins, L. P., Leitherer, C., and Hauschildt, P. H.: 2005, Mon. Not. R. Astron. Soc. 357, 945
- 1998 González-Delgado, R. M., Heckman, T., Leitherer, C., Meurer, G., Krolik, J., Wilson, A. S., Kinney, A., and Koratkar, A.: 1998, Astrophys. J. 505, 174
- 1996 González-Delgado, R. M. and Pérez, E.: 1996, Mon. Not. R. Astron. Soc. 281, 781
- 1995 González-Delgado, R. M., Pérez, E., Díaz, A. I., García-Vargas, M. L., Terlevich, E., and Vílchez, J. M.: 1995, Astrophys. J. 439, 604
- 1994 González-Delgado, R. M., Pérez, E., Tenorio-Tagle, G., Vílchez, J. M., Terlevich, E., Terlevich, R., Telles, E., Rodríguez-Espinosa, J. M., Mas-Hesse, M., García-Vargas, M. L., Díaz, A. I., Cepa, J., and Castañeda, H.: 1994, Astrophys. J. 437, 239
- 1997 Graham, J. A. and et al.: 1997, Astrophys. J. 477, 535
- 1998 Grevesse, N. and Sauval, A. J.: 1998, Space Science Reviews 85, 161
- 2006 Groves, B. A., Heckman, T. M., and Kauffmann, G.: 2006, Mon. Not. R. Astron. Soc. 371, 1559
- 2006 Gu, Q., Melnick, J., Fernandes, R. C., Kunth, D., Terlevich, E., and Terlevich, R.: 2006, Mon. Not. R. Astron. Soc. 366, 480
- 2007 Guseva, N. G., Izotov, Y. I., Papaderos, P., and Fricke, K. J.: 2007, Astron. Astrophys. 464, 885
- 2000 Guseva, N. G., Izotov, Y. I., and Thuan, T. X.: 2000, Astrophys. J. 531, 776 (GIT00)
- 2006 Guseva, N. G., Izotov, Y. I., and Thuan, T. X.: 2006, Astrophys. J. 644, 890
- 2003a Guseva, N. G., Papaderos, P., Izotov, Y. I., Green, R. F., Fricke, K. J., Thuan, T. X., and Noeske, K. G.: 2003a, Astron. Astrophys. 407, 75
- 2003b Guseva, N. G., Papaderos, P., Izotov, Y. I., Green, R. F., Fricke, K. J., Thuan, T. X., and Noeske, K. G.: 2003b, Astron. Astrophys. 407, 91
- 2003c Guseva, N. G., Papaderos, P., Izotov, Y. I., Green, R. F., Fricke, K. J., Thuan, T. X., and Noeske, K. G.: 2003c, Astron. Astrophys. 407, 105
- 1998 Guzmán, R., Jangren, A., Koo, D. C., Bershady, M. A., and Simard, L.: 1998, Astrophys. J. Letters 495, L13+
- 1996 Guzmán, R., Koo, D. C., Faber, S. M., Illingworth, G. D., Takamiya, M., Kron, R. G., and Bershady, M. A.: 1996, Astrophys. J. Letters 460, L5+
- 2007 Hägele, G. F., Díaz, A. I., Cardaci, M. V., Terlevich, E., and Terlevich, R.: 2007, Mon. Not. R. Astron. Soc. 378, 163
- 2008 Hägele, G. F., Díaz, Á. I., Terlevich, E., Terlevich, R., Pérez-Montero, E., and Cardaci, M. V.: 2008, Mon. Not. R. Astron. Soc. 383, 209
- 2006 Hägele, G. F., Pérez-Montero, E., Díaz, A. I., Terlevich, E., and Terlevich, R.: 2006, Mon. Not. R. Astron. Soc. 372, 293
- 1973 Harper, Jr., D. A. and Low, F. J.: 1973, Astrophys. J. Letters 182, L89+
- 1998 Haynes, M. P., van Zee, L., Hogg, D. E., Roberts, M. S., and Maddalena, R. J.: 1998, Astron. J. 115, 62
- 1989 Henry, R. B. C.: 1989, Mon. Not. R. Astron. Soc. 241, 453
- 1996a Ho, L. C. and Filippenko, A. V.: 1996a, Astrophys. J. Letters 466, L83+
- 1996b Ho, L. C. and Filippenko, A. V.: 1996b, Astrophys. J. 472, 600
- 1997 Ho, L. C., Filippenko, A. V., and Sargent, W. L. W.: 1997, Astrophys. J., Suppl. Ser. 112, 315
- 1992 Holtzman, J. A., Faber, S. M., Shaya, E. J., Lauer, T. R., Groth, J., Hunter, D. A., Baum, W. A., Ewald, S. P., Hester, J. J., Light, R. M., Lynds, C. R., O’Neil, Jr., E. J., and Westphal, J. A.: 1992, Astron. J. 103, 691
- 2001 Holweger, H.: 2001, in R. F. Wimmer-Schweingruber (ed.), Joint SOHO/ACE workshop ”Solar and Galactic Composition”, Vol. 598 of American Institute of Physics Conference Series, pp 23–+
- 2006 Hoyos, C. and Díaz, A. I.: 2006, Mon. Not. R. Astron. Soc. 365, 454
- 1926 Hubble, E. P.: 1926, Astrophys. J. 64, 321
- 1977 Huchra, J. P.: 1977, Astrophys. J. 217, 928
- 2001 Israelian, G. and Rebolo, R.: 2001, Astrophys. J. Letters 557, L43
- 1999 Izotov, Y. I., Chaffee, F. H., Foltz, C. B., Green, R. F., Guseva, N. G., and Thuan, T. X.: 1999, Astrophys. J. 527, 757
- 2001a Izotov, Y. I., Chaffee, F. H., and Green, R. F.: 2001a, Astrophys. J. 562, 727
- 2001b Izotov, Y. I., Chaffee, F. H., and Schaerer, D.: 2001b, Astron. Astrophys. 378, L45 (ICS01)
- 1997a Izotov, Y. I., Lipovetsky, V. A., Chaffee, F. H., Foltz, C. B., Guseva, N. G., and Kniazev, A. Y.: 1997a, Astrophys. J. 476, 698
- 2004a Izotov, Y. I., Papaderos, P., Guseva, N. G., Fricke, K. J., and Thuan, T. X.: 2004a, Astron. Astrophys. 421, 539
- 2004b Izotov, Y. I., Stasińska, G., Guseva, N. G., and Thuan, T. X.: 2004b, Astron. Astrophys. 415, 87 (IT04)
- 2006 Izotov, Y. I., Stasińska, G., Meynet, G., Guseva, N. G., and Thuan, T. X.: 2006, Astron. Astrophys. 448, 955
- 1998a Izotov, Y. I. and Thuan, T. X.: 1998a, Astrophys. J. 497, 227
- 1998b Izotov, Y. I. and Thuan, T. X.: 1998b, Astrophys. J. 500, 188 (IT98)
- 2004 Izotov, Y. I. and Thuan, T. X.: 2004, Astrophys. J. 602, 200
- 1994 Izotov, Y. I., Thuan, T. X., and Lipovetsky, V. A.: 1994, Astrophys. J. 435, 647 (ITL94)
- 1997b Izotov, Y. I., Thuan, T. X., and Lipovetsky, V. A.: 1997b, Astrophys. J., Suppl. Ser. 108, 1 (ITL97)
- 2005 Jamet, L., Stasińska, G., Pérez, E., González-Delgado, R. M., and Vílchez, J. M.: 2005, Astron. Astrophys. 444, 723
- 2003 Jarrett, T. H., Chester, T., Cutri, R., Schneider, S. E., and Huchra, J. P.: 2003, Astron. J. 125, 525
- 2000 Jiménez-Benito, L., Díaz, A. I., Terlevich, R., and Terlevich, E.: 2000, Mon. Not. R. Astron. Soc. 317, 907
- 2005 Jogee, S., Scoville, N., and Kenney, J. D. P.: 2005, Astrophys. J. 630, 837
- 2003 Kauffmann, G., Heckman, T. M., Tremonti, C., Brinchmann, J., Charlot, S., White, S. D. M., Ridgway, S. E., Brinkmann, J., Fukugita, M., Hall, P. B., Ivezić, Ž., Richards, G. T., and Schneider, D. P.: 2003, Mon. Not. R. Astron. Soc. 346, 1055
- 1992 Kenney, J. D. P., Wilson, C. D., Scoville, N. Z., Devereux, N. A., and Young, J. S.: 1992, Astrophys. J. Letters 395, L79
- 2003 Kennicutt, R. C., Bresolin, F., and Garnett, D. R.: 2003, Astrophys. J. 591, 801(KBG03)
- 1989 Kennicutt, Jr., R. C.: 1989, Astrophys. J. 344, 685
- 1992 Kennicutt, Jr., R. C.: 1992, Astrophys. J., Suppl. Ser. 79, 255
- 1998a Kennicutt, Jr., R. C.: 1998a, Ann. Rev. Astron. Astrophys. 36, 189
- 1998b Kennicutt, Jr., R. C.: 1998b, Astrophys. J. 498, 541
- 1996 Kennicutt, Jr., R. C. and Garnett, D. R.: 1996, Astrophys. J. 456, 504
- 1989 Kennicutt, Jr., R. C., Keel, W. C., and Blaha, C. A.: 1989, Astron. J. 97, 1022
- 1987 Kennicutt, Jr., R. C., Roettiger, K. A., Keel, W. C., van der Hulst, J. M., and Hummel, E.: 1987, Astron. J. 93, 1011
- 2001 Kewley, L. J., Dopita, M. A., Sutherland, R. S., Heisler, C. A., and Trevena, J.: 2001, Astrophys. J. 556, 121
- 2008 Kewley, L. J. and Ellison, S. L.: 2008, ArXiv e-prints 801
- 1995 Kingdon, J. and Ferland, G. J.: 1995, Astrophys. J. 442, 714
- 1992 Knapen, J. H., Beckman, J. E., Cepa, J., van der Hulst, T., and Rand, R. J.: 1992, Astrophys. J. Letters 385, L37
- 2003 Kniazev, A. Y., Grebel, E. K., Hao, L., Strauss, M. A., Brinkmann, J., and Fukugita, M.: 2003, Astrophys. J. Letters 593, L73
- 2004 Kniazev, A. Y., Pustilnik, S. A., Grebel, E. K., Lee, H., and Pramskij, A. G.: 2004, Astrophys. J., Suppl. Ser. 153, 429
- 1999 Kobulnicky, H. A., Kennicutt, Jr., R. C., and Pizagno, J. L.: 1999, Astrophys. J. 514, 544
- 1994 Koo, D. C., Bershady, M. A., Wirth, G. D., Stanford, S. A., and Majewski, S. R.: 1994, Astrophys. J. Letters 427, L9
- 1995 Koo, D. C., Guzmán, R., Faber, S. M., Illingworth, G. D., Bershady, M. A., Kron, R. G., and Takamiya, M.: 1995, Astrophys. J. Letters 440, L49
- 2007 Kouwenhoven, M. B. N. and de Grijs, R.: 2007, astro-ph/0710.1207
- 2001 Kregel, M. and Sancisi, R.: 2001, Astron. Astrophys. 376, 59
- 2002 Kroupa, P.: 2002, Science 295, 82
- 2000 Kunth, D. and Östlin, G.: 2000, Astron. Astrophys. Rev 10, 1
- 1983 Kunth, D. and Sargent, W. L. W.: 1983, Astrophys. J. 273, 81
- 1998 Kurtz, M. J. and Mink, D. J.: 1998, Publ. Astron. Soc. Pac. 110, 934
- 2004 Lamareille, F., Mouhcine, M., Contini, T., Lewis, I., and Maddox, S.: 2004, Mon. Not. R. Astron. Soc. 350, 396
- 2001 Larsen, S. S., Brodie, J. P., Elmegreen, B. G., Efremov, Y. N., Hodge, P. W., and Richtler, T.: 2001, Astrophys. J. 556, 801
- 2004 Larsen, S. S., Brodie, J. P., and Hunter, D. A.: 2004, Astron. J. 128, 2295
- 1978 Larson, R. B. and Tinsley, B. M.: 1978, Astrophys. J. 219, 46
- 2004 Lee, J. C., Salzer, J. J., and Melbourne, J.: 2004, Astrophys. J. 616, 752 (L04)
- 1995 Leitherer, C. and Heckman, T. M.: 1995, Astrophys. J., Suppl. Ser. 96, 9
- 1992 Leitherer, C., Robert, C., and Drissen, L.: 1992, Astrophys. J. 401, 596
- 1999 Leitherer, C., Schaerer, D., Goldader, J. D., Delgado, R. M. G., Robert, C., Kune, D. F., de Mello, D. F., Devost, D., and Heckman, T. M.: 1999, Astrophys. J., Suppl. Ser. 123, 3
- 1994 Lennon, D. J. and Burke, V. M.: 1994, Astron. and Astrophys. Suppl. Sries 103, 273
- 1995 Liu, C. T. and Kennicutt, Jr., R. C.: 1995, Astrophys. J. 450, 547
- 2006 Liu, X.-W.: 2006, in M. J. Barlow and R. H. Méndez (eds.), Planetary Nebulae in our Galaxy and Beyond, Vol. 234 of IAU Symposium, pp 219–226
- 2006 Liu, X.-W., Barlow, M. J., Zhang, Y., Bastin, R. J., and Storey, P. J.: 2006, Mon. Not. R. Astron. Soc. 368, 1959
- 2001 Liu, X.-W., Luo, S.-G., Barlow, M. J., Danziger, I. J., and Storey, P. J.: 2001, Mon. Not. R. Astron. Soc. 327, 141
- 2000 Liu, X.-W., Storey, P. J., Barlow, M. J., Danziger, I. J., Cohen, M., and Bryce, M.: 2000, Mon. Not. R. Astron. Soc. 312, 585
- 2005a López, J.: 2005a, MSc Thesis, INAOE
- 2005b López, J.: 2005b, MSc Thesis, INAOE
- 2003 Luridiana, V., Peimbert, A., Peimbert, M., and Cerviño, M.: 2003, Astrophys. J. 592, 846
- 1999 Luridiana, V., Peimbert, M., and Leitherer, C.: 1999, Astrophys. J. 527, 110
- 1990 Macchetto, F., Colina, L., Golombek, D., Perryman, M. A. C., and di Serego Alighieri, S.: 1990, Astrophys. J. 356, 389
- 2001 Maoz, D., Barth, A. J., Ho, L. C., Sternberg, A., and Filippenko, A. V.: 2001, Astron. J. 121, 3048
- 1996 Maoz, D., Barth, A. J., Sternberg, A., Filippenko, A. V., Ho, L. C., Macchetto, F. D., Rix, H.-W., and Schneider, D. P.: 1996, Astron. J. 111, 2248
- 2006 Marconi, A., Pastorini, G., Pacini, F., Axon, D. J., Capetti, A., Macchetto, D., Koekemoer, A. M., and Schreier, E. J.: 2006, Astron. Astrophys. 448, 921
- 1991 Mas-Hesse, J. M. and Kunth, D.: 1991, Astron. and Astrophys. Suppl. Sries 88, 399
- 2003 Mas-Hesse, J. M., Kunth, D., Tenorio-Tagle, G., Leitherer, C., Terlevich, R. J., and Terlevich, E.: 2003, Astrophys. J. 598, 858
- 2007 Mateus, A., Sodré, L., Cid Fernandes, R., and Stasińska, G.: 2007, Mon. Not. R. Astron. Soc. 374, 1457
- 2006 Mateus, A., Sodré, L., Cid Fernandes, R., Stasińska, G., Schoenell, W., and Gomes, J. M.: 2006, Mon. Not. R. Astron. Soc. 370, 721
- 1986 McCall, M. L. and Schmidt, F. H.: 1986, Astrophys. J. 311, 548
- 2003 McCrady, N., Gilbert, A. M., and Graham, J. R.: 2003, Astrophys. J. 596, 240
- 2007 McCrady, N. and Graham, J. R.: 2007, Astrophys. J. 663, 844
- 1991 McGaugh, S. S.: 1991, Astrophys. J. 380, 140
- 2004 Melbourne, J., Phillips, A., Salzer, J. J., Gronwall, C., and Sarajedini, V. L.: 2004, Astron. J. 127, 686 (M04)
- 1999 Melnick, J., Tenorio-Tagle, G., and Terlevich, R.: 1999, Mon. Not. R. Astron. Soc. 302, 677
- 1985a Melnick, J., Terlevich, R., and Eggleton, P. P.: 1985a, Mon. Not. R. Astron. Soc. 216, 255
- 1985b Melnick, J., Terlevich, R., and Moles, M.: 1985b, Revista Mexicana de Astronomia y Astrofisica 11, 91
- 1988 Melnick, J., Terlevich, R., and Moles, M.: 1988, Mon. Not. R. Astron. Soc. 235, 297
- 2000 Melnick, J., Terlevich, R., and Terlevich, E.: 2000, Mon. Not. R. Astron. Soc. 311
- 2005 Mengel, S., Lehnert, M. D., Thatte, N., and Genzel, R.: 2005, Astron. Astrophys. 443, 41
- 2008 Mengel, S., Lehnert, M. D., Thatte, N. A., Vacca, W. D., Whitmore, B., and Chandar, R.: 2008, ArXiv e-prints 805
- 1995 Meurer, G. R., Heckman, T. M., Leitherer, C., Kinney, A., Robert, C., and Garnett, D. R.: 1995, Astron. J. 110, 2665
- 1994 Meynet, G., Maeder, A., Schaller, G., Schaerer, D., and Charbonnel, C.: 1994, Astron. and Astrophys. Suppl. Sries 103, 97
- 1997 Miller, B. W., Whitmore, B. C., Schweizer, F., and Fall, S. M.: 1997, Astron. J. 114, 2381
- 1972 Miller, J. S. and Mathews, W. G.: 1972, Astrophys. J. 172, 593
- 2006 Mollá, M., Vílchez, J. M., Gavilán, M., and Díaz, A. I.: 2006, Mon. Not. R. Astron. Soc. 372, 1069
- 1958 Morgan, W. W.: 1958, Publ. Astron. Soc. Pac. 70, 364
- 2004 Morisset, C., Schaerer, D., Bouret, J.-C., and Martins, F.: 2004, Astron. Astrophys. 415, 577
- 2000 Mould, J. R., Huchra, J. P., Freedman, W. L., Kennicutt, Jr., R. C., Ferrarese, L., Ford, H. C., Gibson, B. K., Graham, J. A., Hughes, S. M. G., Illingworth, G. D., Kelson, D. D., Macri, L. M., Madore, B. F., Sakai, S., Sebo, K. M., Silbermann, N. A., and Stetson, P. B.: 2000, Astrophys. J. 529, 786
- 1996 Mulder, P. S. and van Driel, W.: 1996, Astron. Astrophys. 309, 403
- 1995 Mulder, P. S., van Driel, W., and Braine, J.: 1995, Astron. Astrophys. 300, 687
- 2006 Nagao, T., Maiolino, R., and Marconi, A.: 2006, Astron. Astrophys. 459, 85
- 1995 Nelson, C. H. and Whittle, M.: 1995, Astrophys. J., Suppl. Ser. 99, 67
- 2005 Noeske, K. G., Papaderos, P., Cairós, L. M., and Fricke, K. J.: 2005, Astron. Astrophys. 429, 115
- 1990 Oke, J. B.: 1990, Astron. J. 99, 1621
- 1983 Oke, J. B. and Gunn, J. E.: 1983, Astrophys. J. 266, 713
- 2001 Olive, K. A. and Skillman, E. D.: 2001, New Astronomy 6, 119
- 2004 Olive, K. A. and Skillman, E. D.: 2004, Astrophys. J. 617, 29
- 2001 Origlia, L., Leitherer, C., Aloisi, A., Greggio, L., and Tosi, M.: 2001, Astron. J. 122, 815
- 2004 Origlia, L., Ranalli, P., Comastri, A., and Maiolino, R.: 2004, Astrophys. J. 606, 862
- 1989 Osterbrock, D. E.: 1989, Astrophysics of gaseous nebulae and active galactic nuclei, Mill Valley, CA, University Science Books
- 1996 Osterbrock, D. E., Fulbright, J. P., Martel, A. R., Keane, M. J., Trager, S. C., and Basri, G.: 1996, Publ. Astron. Soc. Pac. 108, 277
- 2004 Östlin, G., Cumming, R. J., Amram, P., Bergvall, N., Kunth, D., Márquez, I., Masegosa, J., and Zackrisson, E.: 2004, Astron. Astrophys. 419, L43
- 1979 Pagel, B. E. J., Edmunds, M. G., Blackwell, D. E., Chun, M. S., and Smith, G.: 1979, Mon. Not. R. Astron. Soc. 189, 95
- 1992 Pagel, B. E. J., Simonson, E. A., Terlevich, R. J., and Edmunds, M. G.: 1992, Mon. Not. R. Astron. Soc. 255, 325
- 1997 Palacios, J., García-Vargas, M. L., Díaz, A., Terlevich, R., and Terlevich, E.: 1997, Astron. Astrophys. 323, 749
- 2008 Pasquali, A. and Castangia, P.: 2008, Mon. Not. R. Astron. Soc. 385, 468
- 2007 Pastorini, G., Marconi, A., Capetti, A., Axon, D. J., Alonso-Herrero, A., Atkinson, J., Batcheldor, D., Carollo, C. M., Collett, J., Dressel, L., Hughes, M. A., Macchetto, D., Maciejewski, W., Sparks, W., and van der Marel, R.: 2007, Astron. Astrophys. 469, 405
- 1993 Pastoriza, M. G., Dottori, H. A., Terlevich, E., Terlevich, R., and Diaz, A. I.: 1993, Mon. Not. R. Astron. Soc. 260, 177
- 2001 Pauldrach, A. W. A., Hoffmann, T. L., and Lennon, M.: 2001, Astron. Astrophys. 375, 161
- 2003 Peimbert, A.: 2003, Astrophys. J. 584, 735
- 2002 Peimbert, A., Peimbert, M., and Luridiana, V.: 2002, Astrophys. J. 565, 668
- 2005 Peimbert, A., Peimbert, M., and Ruiz, M. T.: 2005, Astrophys. J. 634, 1056
- 1967 Peimbert, M.: 1967, Astrophys. J. 150, 825
- 1971 Peimbert, M.: 1971, Boletin de los Observatorios Tonantzintla y Tacubaya 6, 29
- 1969 Peimbert, M. and Costero, R.: 1969, Boletin de los Observatorios Tonantzintla y Tacubaya 5, 3
- 2003 Peimbert, M. and Peimbert, A.: 2003, in Revista Mexicana de Astronomia y Astrofisica Conference Series, Vol. 16, pp 113–116
- 2006 Peimbert, M. and Peimbert, A.: 2006, in M. J. Barlow and R. H. Méndez (eds.), Planetary Nebulae in our Galaxy and Beyond, Vol. 234 of IAU Symposium, pp 227–234
- 2007 Peimbert, M., Peimbert, A., Esteban, C., García-Rojas, J., Bresolin, F., Carigi, L., Ruiz, M. T., and López-Sánchez, A. R.: 2007, in Revista Mexicana de Astronomia y Astrofisica Conference Series, Vol. 29 of Revista Mexicana de Astronomia y Astrofisica Conference Series, pp 72–79
- 2000 Peimbert, M., Peimbert, A., and Ruiz, M. T.: 2000, Astrophys. J. 541, 688
- 2004 Peimbert, M., Peimbert, A., Ruiz, M. T., and Esteban, C.: 2004, Astrophys. J., Suppl. Ser. 150, 431
- 1992 Peimbert, M. and Torres-Peimbert, S.: 1992, Astron. Astrophys. 253, 349
- 2000 Pérez, E., Márquez, I., Marrero, I., Durret, F., González Delgado, R. M., Masegosa, J., Maza, J., and Moles, M.: 2000, Astron. Astrophys. 353, 893
- 2003 Pérez-Montero, E. and Díaz, A. I.: 2003, Mon. Not. R. Astron. Soc. 346, 105 (PMD03)
- 2005 Pérez-Montero, E. and Díaz, A. I.: 2005, Mon. Not. R. Astron. Soc. 361, 1063
- 2007 Pérez-Montero, E. and Díaz, A. I.: 2007, Mon. Not. R. Astron. Soc. 377, 1195
- 2006 Pérez-Montero, E., Díaz, A. I., Vílchez, J. M., and Kehrig, C.: 2006, Astron. Astrophys. 449, 193
- 2007 Pérez-Montero, E., Hägele, G. F., Contini, T., and Díaz, Á. I.: 2007, Mon. Not. R. Astron. Soc. 381, 125
- 1996 Pérez-Olea, D.: 1996, PhD Thesis, Universidad Autónoma de Madrid
- 2001 Pettini, M., Shapley, A. E., Steidel, C. C., Cuby, J.-G., Dickinson, M., Moorwood, A. F. M., Adelberger, K. L., and Giavalisco, M.: 2001, Astrophys. J. 554, 981
- 2000 Pettini, M., Steidel, C. C., Adelberger, K. L., Dickinson, M., and Giavalisco, M.: 2000, Astrophys. J. 528, 96
- 1984 Phillips, M. M., Pagel, B. E. J., Edmunds, M. G., and Díaz, A.: 1984, Mon. Not. R. Astron. Soc. 210, 701
- 2000 Pilyugin, L. S.: 2000, Astron. Astrophys. 362, 325
- 2007 Pilyugin, L. S.: 2007, Mon. Not. R. Astron. Soc. 375, 685
- 2006 Pilyugin, L. S., Thuan, T. X., and Vílchez, J. M.: 2006, Mon. Not. R. Astron. Soc. 367, 1139
- 2004 Pilyugin, L. S., Vílchez, J. M., and Contini, T.: 2004, Astron. Astrophys. 425, 849
- 1995 Piner, B. G., Stone, J. M., and Teuben, P. J.: 1995, Astrophys. J. 449, 508
- 2004 Pizzella, A., Corsini, E. M., Vega Beltrán, J. C., and Bertola, F.: 2004, Astron. Astrophys. 424, 447
- 1997 Planesas, P., Colina, L., and Pérez-Olea, D.: 1997, Astron. Astrophys. 325, 81
- 2000 Popescu, C. C. and Hopp, U.: 2000, Astron. and Astrophys. Suppl. Sries 142, 247
- 2005 Porter, R. L., Bauman, R. P., Ferland, G. J., and MacAdam, K. B.: 2005, Astrophys. J. Letters 622, L73
- 1994 Prada, F., Greve, A., and McKeith, C. D.: 1994, Astron. Astrophys. 288, 396
- 1976 Pradhan, A. K.: 1976, Mon. Not. R. Astron. Soc. 177, 31
- 1990 Puxley, P. J., Hawarden, T. G., and Mountain, C. M.: 1990, Astrophys. J. 364, 77
- 1996 Ramsbottom, C. A., Bell, K. L., and Stafford, R. P.: 1996, Atomic Data and Nuclear Data Tables 63, 57
- 1978 Rieke, G. H. and Lebofsky, M. J.: 1978, Astrophys. J. Letters 220, L37
- 1993 Rieke, G. H., Loken, K., Rieke, M. J., and Tamblyn, P.: 1993, Astrophys. J. 412, 99
- 1972 Rieke, G. H. and Low, F. J.: 1972, Astrophys. J. Letters 176, L95+
- 1979 Roberts, Jr., W. W., Huntley, J. M., and van Albada, G. D.: 1979, Astrophys. J. 233, 67
- 2004 Rodríguez, M. and Rubin, R. H.: 2004, in IAU Symp. 217, Recycling Intergallactic and Interstellar Matter, ed. P. A. Duc, J. Braine, and E. Brinks (San Francisco: ASP), pp 188–+ (astro–ph/0312246)
- 1997 Rola, C. S., Terlevich, E., and Terlevich, R. J.: 1997, Mon. Not. R. Astron. Soc. 289, 419
- 2007 Rosa-González, D., Schmitt, H. R., Terlevich, E., and Terlevich, R.: 2007, Astrophys. J. 654, 226
- 2002 Rubin, R. H., Bhatt, N. J., Dufour, R. J., Buckalew, B. A., Barlow, M. J., Liu, X.-W., Storey, P. J., Balick, B., Ferland, G. J., Harrington, J. P., and Martin, P. G.: 2002, Mon. Not. R. Astron. Soc. 334, 777
- 1975 Rubin, V. C., Peterson, C. J., and Ford, Jr., W. K.: 1975, Astrophys. J. 199, 39
- 2003 Ruiz, M. T., Peimbert, A., Peimbert, M., and Esteban, C.: 2003, Astrophys. J. 595, 247
- 1999 Sakamoto, K., Okumura, S. K., Ishizuki, S., and Scoville, N. Z.: 1999, Astrophys. J. 525, 691
- 1955 Salpeter, E. E.: 1955, Astrophys. J. 121, 161
- 2000 Sánchez-Portal, M., Díaz, Á. I., Terlevich, R., Terlevich, E., Álvarez Álvarez, M., and Aretxaga, I.: 2000, Mon. Not. R. Astron. Soc. 312, 2
- 1970 Sargent, W. L. W.: 1970, Astrophys. J. 160, 405
- 1970 Sargent, W. L. W. and Searle, L.: 1970, Astrophys. J. Letters 162, L155+
- 1998 Schulte-Ladbeck, R. E., Crone, M. M., and Hopp, U.: 1998, Astrophys. J. Letters 493, L23+
- 1972 Searle, L. and Sargent, W. L. W.: 1972, Astrophys. J. 173, 25
- 1973 Searle, L., Sargent, W. L. W., and Bagnuolo, W. G.: 1973, Astrophys. J. 179, 427
- 1965 Sérsic, J. L. and Pastoriza, M.: 1965, Publ. Astron. Soc. Pac. 77, 287
- 1967 Sérsic, J. L. and Pastoriza, M.: 1967, Publ. Astron. Soc. Pac. 79, 152
- 1995 Shaw, R. A. and Dufour, R. J.: 1995, Publ. Astron. Soc. Pac. 107, 896
- 2005 Sheth, K., Vogel, S. N., Regan, M. W., Thornley, M. D., and Teuben, P. J.: 2005, Astrophys. J. 632, 217
- 1995 Shields, J. C. and Kennicutt, Jr., R. C.: 1995, Astrophys. J. 454, 807
- 2005 Siegel, E. R., Guzmán, R., Gallego, J. P., Orduña López, M., and Rodríguez-Hidalgo, P.: 2005, Mon. Not. R. Astron. Soc. 356, 1117
- 1993 Skillman, E. D. and Kennicutt, Jr., R. C.: 1993, Astrophys. J. 411, 655 (SK93)
- 1994 Skillman, E. D., Televich, R. J., Kennicutt, Jr., R. C., Garnett, D. R., and Terlevich, E.: 1994, Astrophys. J. 431, 172 (S94)
- 2005 Smith, B. J., Struck, C., Appleton, P. N., Charmandaris, V., Reach, W., and Eitter, J. J.: 2005, Astron. J. 130, 2117
- 1996 Smith, D. A., Neff, S. G., Bothun, G. D., Fanelli, M. N., Offenberg, J. D., Waller, W. H., Bohlin, R. C., O’Connell, R. W., Roberts, M. S., Smith, A. M., and Stecher, T. P.: 1996, Astrophys. J. Letters 473, L21+
- 2002 Smith, L. J., Norris, R. P. F., and Crowther, P. A.: 2002, Mon. Not. R. Astron. Soc. 337, 1309
- 2003 Stasińska, G. and Izotov, Y.: 2003, Astron. Astrophys. 397, 71
- 1978 Stasińska, G.: 1978, Astron. Astrophys. 66, 257
- 1980 Stasińska, G.: 1980, Astron. Astrophys. 84, 320
- 1990 Stasińska, G.: 1990, Astron. and Astrophys. Suppl. Sries 83, 501
- 2005 Stasińska, G.: 2005, Astron. Astrophys. 434, 507
- 2006 Stasińska, G.: 2006, Astron. Astrophys. 454, L127
- 1996 Stasińska, G. and Leitherer, C.: 1996, Astrophys. J., Suppl. Ser. 107, 661
- 1982 Stauffer, J. R.: 1982, Astrophys. J., Suppl. Ser. 50, 517
- 1995 Storey, P. J. and Hummer, D. G.: 1995, Mon. Not. R. Astron. Soc. 272, 41
- 2002 Stoughton, C. and et al.: 2002, Astron. J. 123, 485
- 2006 Swartz, D. A., Yukita, M., Tennant, A. F., Soria, R., and Ghosh, K. K.: 2006, Astrophys. J. 647, 1030
- 1999 Tayal, S. S. and Gupta, G. P.: 1999, Astrophys. J. 526, 544
- 1988 Telesco, C. M.: 1988, Ann. Rev. Astron. Astrophys. 26, 343
- 1988 Telesco, C. M. and Decher, R.: 1988, Astrophys. J. 334, 573
- 1984 Telesco, C. M. and Gatley, I.: 1984, Astrophys. J. 284, 557
- 1980 Telesco, C. M. and Harper, D. A.: 1980, Astrophys. J. 235, 392
- 1997 Telles, E., Melnick, J., and Terlevich, R.: 1997, Mon. Not. R. Astron. Soc. 288, 78
- 2003 Temporin, S., Ciroi, S., Rafanelli, P., Radovich, M., Vennik, J., Richter, G. M., and Birkle, K.: 2003, Astrophys. J., Suppl. Ser. 148, 353
- 1990 Terlevich, E., Terlevich, R., Díaz, A. I., Pastoriza, M. G., and Dottori, H.: 1990, Mon. Not. R. Astron. Soc. 242, 48P
- 2003 Terlevich, E., Terlevich, R., and Melnick, J.: 2003, in J. M. Rodriguez-Espinoza, F. Garzon Lopez, and V. Melo Martin (eds.), Revista Mexicana de Astronomia y Astrofisica Conference Series, pp 213–215
- 1991 Terlevich, R., Melnick, J., Masegosa, J., Moles, M., and Copetti, M. V. F.: 1991, Astron. and Astrophys. Suppl. Sries 91, 285 (T91)
- 1988 Thronson, Jr., H. A. and Greenhouse, M. A.: 1988, Astrophys. J. 327, 671
- 1968 Tinsley, B. M.: 1968, Astrophys. J. 151, 547
- 1972 Tinsley, B. M.: 1972, Astron. Astrophys. 20, 383
- 1979 Tonry, J. and Davis, M.: 1979, Astron. J. 84, 1511
- 2007 Trancho, G., Bastian, N., Miller, B. W., and Schweizer, F.: 2007, Astrophys. J. 664, 284
- 2003 Tsamis, Y. G., Barlow, M. J., Liu, X.-W., Danziger, I. J., and Storey, P. J.: 2003, Mon. Not. R. Astron. Soc. 338, 687
- 2005 Tsamis, Y. G. and Péquignot, D.: 2005, Mon. Not. R. Astron. Soc. 364, 687
- 2003 Ugryumov, A. V., Engels, D., Pustilnik, S. A., Kniazev, A. Y., Pramskij, A. G., and Hagen, H.-J.: 2003, Astron. Astrophys. 397, 463
- 1976 van der Kruit, P. C.: 1976, Astron. Astrophys. 49, 161
- 1976 van der Kruit, P. C. and de Bruyn, A. G.: 1976, Astron. Astrophys. 48, 373
- 2000 van Zee, L.: 2000, Astrophys. J. Letters 543, L31
- 2005 Vázquez, G. A. and Leitherer, C.: 2005, Astrophys. J. 621, 695
- 2002 Vermeij, R. and van der Hulst, J. M.: 2002, Astron. Astrophys. 391, 1081
- 1988 Vílchez, J. M., Pagel, B. E. J., Díaz, A. I., Terlevich, E., and Edmunds, M. G.: 1988, Mon. Not. R. Astron. Soc. 235, 633
- 1992 Vila-Costas, M. B. and Edmunds, M. G.: 1992, Mon. Not. R. Astron. Soc. 259, 121
- 1996 Vílchez, J. M. and Esteban, C.: 1996, Mon. Not. R. Astron. Soc. 280, 720
- 1988 Vílchez, J. M. and Pagel, B. E. J.: 1988, Mon. Not. R. Astron. Soc. 231, 257
- 2004 Wang, W., Liu, X.-W., Zhang, Y., and Barlow, M. J.: 2004, Astron. Astrophys. 427, 873
- 1993 Weaver, T. A. and Woosley, S. E.: 1993, Phys. Rep. 227, 65
- 2005 Wesson, R., Liu, X.-W., and Barlow, M. J.: 2005, Mon. Not. R. Astron. Soc. 362, 424
- 1995 Whitmore, B. C. and Schweizer, F.: 1995, Astron. J. 109, 960
- 1993 Whitmore, B. C., Schweizer, F., Leitherer, C., Borne, K., and Robert, C.: 1993, Astron. J. 106, 1354
- 1999 Whitmore, B. C., Zhang, Q., Leitherer, C., Fall, S. M., Schweizer, F., and Miller, B. W.: 1999, Astron. J. 118, 1551
- 2007 Woods, D. F. and Geller, M. J.: 2007, Astron. J. 134, 527
- 2006 Woods, D. F., Geller, M. J., and Barton, E. J.: 2006, Astron. J. 132, 197
- 1991 Xu, C. and Sulentic, J. W.: 1991, Astrophys. J. 374, 407
- 1994 Zaritsky, D., Kennicutt, Jr., R. C., and Huchra, J. P.: 1994, Astrophys. J. 420, 87
- 1982 Zeippen, C. J.: 1982, Mon. Not. R. Astron. Soc. 198, 111
- 1987 Zeippen, C. J., Le Bourlot, J., and Butler, K.: 1987, Astron. Astrophys. 188, 251
- 1999 Zepf, S. E., Ashman, K. M., English, J., Freeman, K. C., and Sharples, R. M.: 1999, Astron. J. 118, 752
- 1966 Zwicky, F.: 1966, Astrophys. J. 143, 192
Chapter 3 Neon and Argon optical emission lines in ionized gaseous nebulae
3.1 Introduction
The chemical history of the Universe can be investigated by studying the behaviour of abundance ratios of different chemical species as a function of metallicity, which is the main indicator of the chemical evolution of a galaxy. If two elements are produced by stars of the same mass range, they will appear simultaneously in the interstellar medium (ISM) and hence their relative abundance will be constant. But if they are produced by stars of different mass ranges, they will be ejected into the ISM in different time scales. The chemical abundances of the elements heavier than hydrogen can be studied by measuring the fluxes of the absorption and emission lines in the spectra of stars and galaxies. Unluckily, only the collisional emission lines emitted by the ionized gas surrounding massive star clusters are detectable in most of galaxies. Since the brightest emission lines in the optical part of the spectrum are emitted by oxygen, this element has been taken as the main tracer of metallicity for these objects. Nevertheless, the depletion of some of the most important elements, including oxygen, onto dust grains, whose composition is difficult to ascertain, makes the determination of these abundances more uncertain. This is not the case for the elements that occupy the last group in the periodic table, that have an electronic configuration with the outer shell completely filled and they seldom associate to other elements and do not constitute part of the dust grains in the ISM. Therefore, although the presence of these grains can affect the determination of metallicity in other ways, affecting the photo-ionization equilibrium of the gas, the uncertainty due to depletion factors has not to be considered in the determination of the chemical abundances of the noble gases.
Neon and argon are products of the late stages in the evolution of massive stars. Neon is produced by carbon burning and is expected to track oxygen abundances very closely. The measurement of neon abundances in extragalactic Hii regions [2002ApJ...581.1019G] and planetary nebulae [1989MNRAS.241..453H] confirms this trend, despite the uncertainties in the derivation of the ionization correction factor of Ne. On the other hand, argon, like sulphur, is produced by oxygen burning and, again, it is expected to track O abundances. Nevertheless, as it is also the case for sulphur, there is some evidence of decreasing values of Ar/O for higher metallicities [2002ApJ...581.1019G]. The same trend has been observed for sulphur in halo metal poor stars [2001ApJ...557L..43I] and extragalactic Hii regions [1991MNRAS.253..245D, 2002ApJ...581.1019G, 2006A&A...449..193P]. This problem, perhaps, is related to the proximity of the production site of these elements to the stellar core and the yields would be sensitive to the conditions during the supernova explosion [1993PhR...227...65W].
The emission lines of Ne and Ar are not as intense as some of the other strong lines in the optical spectrum but there is a growing number of Hii regions for which there are measurements with good signal-to-noise ratio. This is the case of [Neiii] at 3869 Å, whose blue wavelength makes it observable in the optical spectrum of bright objects even at high redshifts, and of the emission line of [Ariii] at 7136 Å. The emission lines of these elements in the IR will supply a great deal of worthy additional information but, at the moment, the objects with observations of the fine-structure lines of [Ne ii], [Ne iii], [Ar ii], [Ar iii] are still very scarce. The derivation of the chemical abundances of these elements in Hii regions can be calculated by means of the previous determination of some electron collisional temperature and the previous knowledge of the ionization structure of the element whose abundance is required. The results of photo-ionization models point to a similar ionization structure of Ne and O on the one hand and S and Ar on the other (e.g. Pérez-Montero and Díaz, 2007). These facts make these lines suitable to be used as substitutes of the bright emission lines of oxygen and sulphur in empirical indicators of metallicity (e.g. Nagao et al., 2006) or diagnostic ratios to distinguish starbursts galaxies from active galactic nuclei (e.g. Rola et al., 1997).
In this Chapter, we investigate the element abundances of neon, argon and oxygen for a sample of objects that is described in Section §3.2. In Section §3.3, we derive the physical conditions of these objects, including the calculation of the electron temperatures involved in the derivation of Ne and Ar abundances. In Section §3.4, we describe the grid of photo-ionization models that we have used to derive a new set of ionization correction factors for these two elements. These new ICFs are described in the next Section, along with the discussion of the behaviour of Ne/O and Ar/O ratios and the use of the brightest emission lines of these two elements as empirical calibrators of metallicity and diagnostic ratios. Finally, we summarize our results and we present our conclusions.
3.2 Description of the sample
The sample includes emission-line objects observed in the optical part of the spectrum with the detection of, at least, one auroral line with high S/N ratio in order to derive electron temperatures directly and, hence, ionic chemical abundances with less uncertainty. We have compiled for this sample the strong lines of [Oii] at 3727 Å and [Oiii] at 4959 Å and 5007 Å in order to derive oxygen abundances. We have compiled as well the [Neiii] emission line at 3869 Å, the [Ariii] emission line at 7136 Å and the [Ariv] at 4740 Å to measure the respective ionic abundances of neon and argon. The compilation includes the objects used in [2005MNRAS.361.1063P], including Hii regions in our Galaxy and the Magellanic Clouds (MCs), Giant Extragalactic Hii regions (GEHRs) and Hii galaxies, with the addition of new objects which are listed in Table 3.1.
This list includes 12 Hii galaxies from the Sloan Digital Sky Survey (SDSS111The SDSS site is at www.sdss.org) with very low metallicities identified by Kniazev et al. [2003ApJ...593L..73K] and whose spectra have been re-analyzed to obtain the required line emission data. Among these galaxies, 11 do not have observations of the [Oii] emission line at 3727 Å, which is the case as well for 183 SDSS galaxies of the sample compiled by Izotov et al. [2006A&A...448..955I]. The compilation has therefore 633 Hii galaxies, 176 GEHRs and 44 Hii regions of the Galaxy and the Magellanic Clouds with a good determination of oxygen, neon and argon ionic abundances for those ions that have been observed.
| Reference | Object type | Objects |
| Bresolin et al., 2004 | M51 GEHRs | 10 |
| Bresolin et al., 2005 | GEHRs | 32 |
| Bresolin, 2007 | M101 GEHRs | 3 |
| Crockett et al., 2006 | M33 GEHRs | 6 |
| Garnett et al., 2004 | M51 GEHRs | 2 |
| Guseva et al., 2003a | SBS 1129+576 | 2 |
| Guseva et al., 2003b | HS 1442+650 | 2 |
| Guseva et al., 2003c | SBS 1415+437 | 2 |
| Hägele et al., 2006 (Chapter §2) | HiiG | 3 |
| Hägele et al., 2008 (Chapter §2) | HiiG | 7 |
| Izotov et al., 1997 | IZw18 | 2 |
| Izotov and Thuan, 1998 | SBS 0335-018 | 1 |
| Izotov et al., 1999 | HiiG | 3 |
| Izotov et al., 2001 | HiiG | 2 |
| Izotov et al., 2004a | HiiG | 3 |
| Izotov and Thuan, 2004 | HiiG | 33 |
| Izotov et al., 2006 | SDSS galaxies | 309 |
| Kniazev et al., 2004 | SDSS galaxies | 11 |
| Lee et al., 2004 | KISS galaxies | 13 |
| Melbourne et al., 2004 | KISS galaxies | 12 |
| Pérez-Montero and Díaz, 2005 | All | 361 |
| Van Zee, 2000 | UGCA92 | 2 |
| Vermeij et al., 2002 | DRH | 5 |
| GEHR denotes Giant Extragalactic Hii Regions, HiiG, Hii Galaxies | ||
| and DRH, Diffuse Hii Regions | ||
The emission line intensities have been taken directly from the literature once reddening corrected. The aperture effects of all the compiled observations are negligible due to the compact nature of the observed objects and the high excitation state of the more important involved emission lines.
3.3 Physical conditions
3.3.1 Electron density and temperatures
In order to derive oxygen, neon and argon abundances for the ions presenting the corresponding strong emission line we have selected objects allowing a direct determination of the electron temperature. All physical conditions have been derived from the appropriate ratios of emission lines and using the fittings to the values obtained from the task TEMDEN, in the case of electron densities and temperatures, and IONIC, in the case of ionic abundances, as was described in detail in Chapter §2.
Next, following the same procedure described in Pérez-Montero and Díaz [2003MNRAS.346..105P], we have used for the calculation of the chemical abundance the electron temperature associated to the zone where each ionic species stays. To do this we have applied different expressions for the relations between the electron temperature of each zone (see Chapter §2).
Electron densities have been calculated for a subsample of 361 objects from the ratio of [Sii] emission lines I(6717 Å)/I(6731 Å). It is representative of the low excitation zone of the ionized gas, and it is therefore used for the calculation of electron temperatures in this zone which depend on density. For the remaining objects, for which no data about [Sii] lines exist or for which non valid values are obtained, we have adopted a mean density of 50 particles per cm, according to the low density values found in the rest of Hii regions.
The electron temperature of O, representative of the high excitation zone of the ionized gas, has been derived from the ratio of [Oiii] emission lines (I(4959 Å)+I(5007 Å))/I(4363 Å) for a subsample of 771 objects, while for the rest we have used the relation with other measured electron temperatures in an inverse way as described below, 33 objects from T([Siii]), 20 from T([Oii]) and 4 from T([Nii]). In the latter case, the objects are M51 GEHRs of high metallicity from Bresolin et al. [2004ApJ...615..228B]. We have assumed as well the T([Oiii]) to be equal to T([Neiii]) and T([Ariv]) in order to calculate Ne and Ar abundances, respectively.
The electron temperature of O, representative of the low excitation zone of the ionized gas, has been derived from the ratio of the [Oii] emission lines (I(3727 Å)/I(7319 Å)+I(7330 Å)) for a subsample of 311 objects. The auroral lines of [Oii] present higher uncertainties because of their lower signal-to-noise ratio and a higher dependence on reddening correction, due to their larger wavelength distance to the closest hydrogen recombination emission line. Besides, they present a small contribution due to recombination, although in quantities not larger than the usual reported errors. Additionally, this ratio has a strong dependence on electron density (see Chapter §2), which makes the determination of this temperature and, hence, the determination of O abundances very uncertain. This can increase the uncertainty of total oxygen abundances, mostly in high metallicity - low excitation Hii regions [2005MNRAS.361.1063P]. For the rest of the objects, we have used the grid of relations between T([Oii]) and T([Oiii]) presented in Pérez-Montero and Díaz [2003MNRAS.346..105P], which takes into account the dependence of T([Oii]) on density and its corresponding uncertainty. For the same 4 objects of M51 for which neither T([Oiii]) nor T([Siii]) have been measured we have taken T([Nii]) as representative of the electron temperature of the low excitation zone using the ratio of [Nii] emission lines (I(6548 Å)+I(6584 Å))/I(5755 Å).
In the case of the electron temperature of Ar, we have assumed that the ionization structure of this ion is rather similar to that of S (see Chapter §2), whose electron temperature has intermediate values between the high and low excitation zones [1992AJ....103.1330G]. We have calculated directly the temperature of S from the ratio of [Siii] emission lines (I(9069 Å)+I(9532 Å))/I(6312 Å) for a subsample of 299 objects. For the rest of the objects we have taken relations of this temperature with t([Oiii]). In the case of low excitation objects (T 10000 K), based on photo-ionization models [2005MNRAS.361.1063P]:
while for the high excitation objects we have taken the empirical relation derived in Chapter §2 that accounts better for the high dispersion found in this relation for Hii galaxies:
3.3.2 Ionic abundances
Each ionic abundance has been calculated using the most prominent emission lines for each ion and the appropriate electron temperature. In the case of O, we have used the expression presented in Chapter §2 using the intensity of the [Oii] line at 3727 Å, the electron temperature t([Oii]), or any other value associated to the low excitation zone, and the electron density, N.
In the case of 11 of the 12 very low metallicity Hii galaxies identified by Kniazev et al. [2003ApJ...593L..73K] and also for a subsample of 183 Hii galaxies compiled from Izotov et al. [2006A&A...448..955I], which have no data on the [Oii] 3727 Å line, the O abundances have been measured from the emission lines of [Oii] at 7319 and 7330 Å using the following expression also derived from a fitting to the results of the IONIC task:
where n = 10 N.
For O abundances we use the expression for the [Oiii] emission lines at 4959 and 5007 Å, along with the electron temperature of [Oiii] (see Chapter §2). Then, we calculate the total abundance of oxygen in relation to hydrogen directly from these two ionic abundances.
Abundances of Ne have been calculated from the [Neiii] emission line at 3869 Å and the electron temperature of [Oiii] for a subsample of 773 objects using the same relation given in Chapter §2.
Finally, regarding Ar, we can measure Ar, from the [Ariii] emission line at 7136 Å and the electron temperature of [Siii] for a subsample of 572 objects using the expression previously given. It is possible to measure as well the lines of [Ariv] at 4713 and 4740 Å. Nevertheless, the first one usually appears blended with a line of Hei at 4711 Å that is difficult to correct, so it is better to use the second one to calculate the ionic abundance of Ar through the electron temperature of [Oiii]. This abundance has been calculated for a subsample of 253 objects with a simultaneous measurement of the [Ariii] and [Ariv] emission lines.
3.4 Photo-ionization models
A large grid of photo-ionization models has been calculated in order to check the validity of the ionization correction factors for Ne and Ar.
We have used the photo-ionization code Cloudy 06.02 [1998PASP..110..761F], taking as ionizing source the spectral energy distributions of O and B stars calculated with the code WM-Basic (version 2.11222Available at http://www.usm.uni-muenchen.de/people/adi/Programs/Programs.html, Pauldrach et al., 2001). We have assumed a spherical geometry, a constant density of 100 particles per cm and a standard fraction of dust grains in the interstellar medium. We have assumed as well that the gas has the same metallicity as the ionizing source, covering the values 0.05Z, 0.2Z, 0.4Z, Z and 2Z, taking as the solar metallicity the oxygen abundance measured by Allende-Prieto et al. (2001; 12+log(O/H) = 8.69). The rest of ionic abundances have been set to their solar proportions. A certain amount of depletion has been taken into account for the elements C, O, Mg, Si and Fe, considered for the formation of dust grains in the code. Although it is expected that the dust-to-gas ratio scales with metallicity [1995ApJ...454..807S], we have checked that different values of this ratio do not lead to variations in our results about the computed ICFs in quantities larger than the reported errors. Regarding other functional parameters we have considered different values of the ionization parameter (log U = -3.5, -3.0, -2.5 and -2.0) and the stellar effective temperature (T = 35000 K, 40000 K, 45000 K and 50000 K). This gives a total of 80 photo-ionization models to cover the conditions of different ionized gas nebulae. Atomic data, including collision strengths in the models are consistent with those used in the calculation of chemical abundances. We have checked as well the influence of varying dielectronic recombination rate coefficients in the code according to the most recent values (Badnell, 2006 and references therein), but we have not found any relevant variation in our results concerning the calculation of ICFs.
3.5 Discussion
3.5.1 Ionization correction factors (ICF)
ICFs stand for the unseen ionization stages of each element.
where is the element whose ICF is required and is the ionic species whose abundance is calculated by means of the detected emission lines.
In the case of neon, only the [Neiii] line at 3869 Å is detected in the optical spectrum in a large sample of objects. Since its ionization structure is quite similar to that of oxygen, the following approximation can be used:
that leads to:
This relation is shown as a thick dashed line in Figure 3.1. Nevertheless, Izotov et al. [2004A&A...415...87I] point out from a set of photo-ionization models that this approximation is less accurate in regions with a lower ionization parameter where the charge transfer reaction between O and H becomes more efficient. In this type of objects it is expected to find larger abundances of Ne in relation to O and, hence, the O/O ratio provides larger ICFs. This trend is confirmed with the set of photo-ionization models used by Izotov et al. (2006) that, besides, find a slight dependence of the ICF(Ne) on metallicity, with larger values of this ICF for high metallicity regions. This dependence is due to the addition of X-rays sources in their models with lower metallicity and not to a real dependence on metallicity or ionization parameter. The ICFs from Izotov et al. (2006) are shown as thin and thick black solid lines in Figure 3.1, low and mid and high metallicity, respectively. The fit of our models for the hottest stars (45000 K and 50000 K), whose effective temperatures reproduce better the radiation field in the most massive ionizing cluster is shown as a thick solid red line in Figure 3.1. It reveals the same overestimate of the classical approximation in low excitation objects. However, we do not find any noticeable dependence on the metallicity. This fit gives:
where x = O / (O+O), with a rms of 0.074 only.
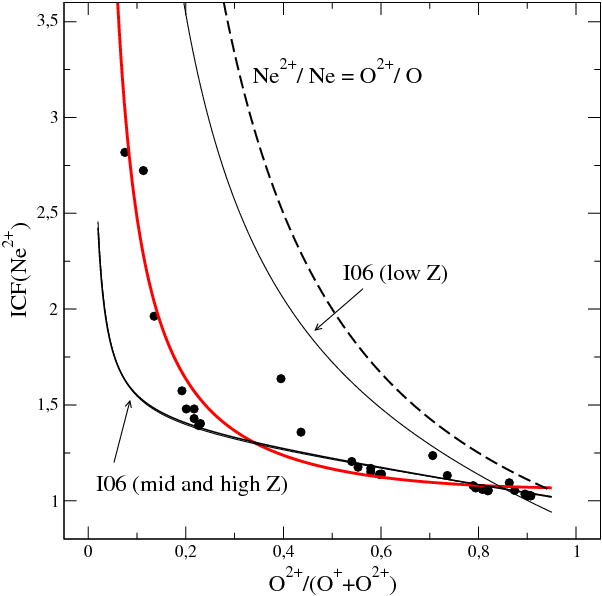
![[Uncaptioned image]](/html/0908.4285/assets/chapter3/ICFArIII_SIII-ajuste-mas40kK.png)
![[Uncaptioned image]](/html/0908.4285/assets/chapter3/ICFArIII+ArIV_SIII-ajuste-mas40kK.png)
Regarding argon, the ICF can vary depending on the availability of Ar abundances. Izotov et al. (1994) propose the following formula to calculate the total abundance of Ar using the ionic abundances of these two ions:
On the other hand, if only the emission line of [Ariii] is available, they propose the following expression:
Both formulae are shown as dashed lines in the upper panels of Figure 2.5.1 and 2.5.1, respectively. Nevertheless, these fits clearly overestimate the amount of total Ar compared with the expressions proposed by Izotov et al. (2006) who, as in the case of Ne, find a dependence with metallicity. These fits are shown in the upper panels of Figure 2.5.1 and 2.5.1 as thin solid lines for low, intermediate and high metallicities. Finally, the fits to our own models (thick red line in the Figures) are closer to these latter, but we do not find any relevant dependence of our models on metallicity. The expressions for the fits of these models are, as a function of x = O / (O+O):
with a rms of 0.011, shown as a thick solid red line in the upper panel of Figure 2.5.1, and
with a rms of 0.067, shown as a thick solid red line in the upper panel of Figure 2.5.1. It is possible, as well, to express these ICFs as a function of sulphur abundances. This allows to derive total argon abundances using red or near-IR observations only, in the case of ICF of Ar. Besides, these ICFs can be used in the subsample of SDSS objects whose [Oii] line at 3727 Å is not detected but which, on the contrary, have good detection of the [Siii] at 9069 Å. The fits of our models, as a function of x = S / (S+S) are:
with a rms of 0.019, which is shown as a thick solid red line in the lower panel of Figure 2.5.1, and
with a rms of 0.068, shown as a thick solid red line in the lower panel of Figure 2.5.1.