Mining the Galactic Halo for Very Metal-Poor Stars
Abstract
We study the age and metallicity distribution function (MDF) of metal-poor stars in the Milky Way halo as a function of galactocentric radius by combining N-body simulations and semi-analytical methods. We find that the oldest stars populate the innermost region, while extremely metal-poor stars are more concentrated within kpc. The MDF of [Fe/H] stars varies only very weakly within the central kpc, while the relative contribution of [Fe/H] stars strongly increases with , varying from within kpc kpc up to for kpc. This is due to the faster descent of the spatial distribution (as seen from Earth) of the more enriched population. This implies that the outer halo kpc is the best region to search for very metal-poor stars. Beyond kpc the density of [Fe/H] stars is maximum within dwarf galaxies. All these features are imprinted by a combination of (i) the virialization epoch of the star-forming haloes, and (ii) the metal enrichment history of the Milky Way environment.
keywords:
stars: formation, population II, supernovae: general - cosmology: theory - galaxies: evolution, stellar content -1 Introduction
Very metal-poor stars ([Fe/H]) represent the living fossils of the first stellar generations. Their observation is crucial, as they may provide fundamental insights on both the properties of the first stars and on the physical mechanisms governing the early stages of galaxy formation, such as feedback processes. An intrinsic problem that observers have to face is that old, very metal-poor stars, are extremely rare in the solar neighborhood, comprising no more that the of the stars within a few kpc of the Sun (Beers et al. 2005).
During the past years several surveys focused on such elusive stellar populations, both in the Milky Way (MW) halo and in nearby dwarf satellites, providing an increasing amount of data. At the moment, the metallicity distribution function (MDF) of Galactic halo stars (Beers et al. 2005) represents one of the most important observational constraints. Indeed, it consists of halo field stars observed within kpc of the Sun (Beers & Christlieb 2005), covering a huge metallicity range which spans from [Fe/H] down to [Fe/H]. Despite such a large sample, the number () of extremely metal-poor stars ([Fe/H]) turns out to be still insufficient to put solid constraints on the properties of the first stars (Tumlinson 2006, Salvadori, Schneider & Ferrara 2007), as the MDF is a rapidly increasing function of [Fe/H]. Hence, understanding where these stars are preferentially located is an urgent theoretical question.
Carollo et al. (2007) have recently done an accurate kinematic study of calibration stars of the SDSS Data Release 5, finding that the “outer” halo, kpc, includes a larger fraction of [Fe/H] stars and peaks at lower metallicity than the “inner” halo ( kpc). This evidence poses challenging questions about the physical origin of such segregation and the variation of the MDF with galactocentric radius.
In this study we investigate the spatial distribution of metal-poor halo stars by combining an high-resolution N-body simulation for the formation of the MW (Scannapieco et al. 2007), with a semi-analytical model (Salvadori, Schneider & Ferrara 2007, hereafter SFS07) that follows the stellar population history and the chemical enrichment of the Galaxy along its hierarchical tree, successfully reproducing several properties of the MW and its dwarf satellites (Salvadori, Ferrara & Schneider 2008, hereafter SFS08; Salvadori & Ferrara 2009).
2 Summary of the model
2.1 The N-body simulation
We briefly summarize the main features of the N-body simulation referring to Scannapieco et al. (2007), and references therein, for a detailed description. We simulate111We adopt a CDM cosmological model with , , , , and . a MW-analog galaxy with the GCD+ code (Kawata & Gibson 2003a) using a multi-resolution technique (Kawata & Gibson 2003b) to achieve high resolution in the regions of interest. The initial conditions at are constructed using the public software GRAFIC2 (Bertschinger 2001). The highest resolution region is a sphere with a radius 4 times the virial radius of the system (i.e. the MW) at , the dark matter (DM) particles mass and softening length are respectively and pc. The system consists on about particles within ; its virial mass and radius are respectively and kpc, roughly consistent with the observational estimates (, kpc) of the MW (Battaglia et al. 2005). The simulation data is output every Myr between and every Myr for . At each output a friend-of-friend group finder is used to identify the virialized DM haloes by assuming a linking parameter and a threshold number of particles of . A low-resolution simulation including gas physics and star formation (SF) has been used in order to confirm that the initial conditions will lead to a disk formation. While gas physics is essential to reproduce the spatial distribution of disk stars, an N-body approach is suitable to investigate the halo (and bulge) population we are mostly interested in.
2.2 The semi-analytical model
We briefly describe the basic features of the model implemented in the code GAMETE (GAlaxy MErger Tree & Evolution) referring the reader to SSF07 and SFS08 for more details. We trace the evolution of gas and stars inside each halo of the hierarchy (group of DM particles) by assuming the following hypotheses: (a) at the highest redshift of the merger tree, , the gas has a primordial composition; (b) stars can only form in haloes of mass () prior to (after) reionization, here assumed to be complete at ; (c) in each halo the SF rate is proportional to the mass of cold gas; (d) according to the critical metallicity scenario (Schneider et al. 2002, 2006) low-mass stars with a Larson Initial Mass Function form when the gas metallicity ; for massive Pop III stars form with a reference mass .

We describe the enrichment of gas within proto-Galactic haloes and diffused in the MW environment, or Galactic Medium (GM), by including a simple description of supernova (SN) feedback. Metals and gas are assumed to be instantaneously and homogeneously mixed with the gas (implications discussed in SSF07); we assume the Instantaneous Recycling Approximation (IRA, Tinsley 1980). At each time-step the mass of gas, metals and stars within each halo is equally distributed among all its DM particles, and such information propagated to the next integration step. The same procedure is applied to metals ejected into the GM; as a result, the chemical composition of newly virializing haloes depends on the enrichment level of the GM out of which they form. Finally, the properties of long-living metal-poor stars hosted by each DM particle are stored to recover their spatial distribution at .
As a rough estimate of the impact of the perfect mixing assumption above we have also explored a simple case of inhomogeneous metal mixing. The latter is modeled by computing the instantaneous filling factor of the metal bubbles inside the critical MW volume Mpc3 and by randomly enriching a fraction of GM particles. Note that this only provides an upper limit on F, as a clustered system, such as the stars we are considering, will have a smaller filling factor. A simple Sedov-Taylor blastwave solution (Sec. 3.6 of SFS07) is used to estimate the bubble radii . This case is compared with the perfectly mixed one in Fig. 1 (lower panel on the left).
3 Results
The model is calibrated, i.e. the SF and SN wind efficiencies are fixed, by simultaneously reproducing the global properties of the MW (stellar/gas mass and metallicity) and the Galactic halo MDF as in SSF07.
3.1 The age-metallicity relation
A first test of our model results is a comparison with the observed stellar age-metallicity; the results are shown in the upper panel of Fig. 1. The simulated distribution can be virtually divided into three main regions defined by the prevailing formation mode of the stars contained within them.
The first region (age Gyr, or ) is populated by old stars covering almost the entire metallicity range, from [Fe/H] to [Fe/H], and which correspond to the observed bulge and halo components (see the rectangles in the panel). These stars formed in proto-galactic haloes associated to high () density fluctuations, that virialized during the early stages of Galaxy formation at . These first stellar generations enriched the interstellar medium (ISM) of their host galaxies up to [Fe/H] (a process we dub as self-enrichment), quenching the formation of additional very metal-poor stars. At the same time, metals are expelled by SN feedback in the GM, thus increasing its metallicity above by and allowing long-living metal-poor stars to form in newly virialized haloes accreting their gas from the GM. From to coeval formation of metal-poor and metal-rich stars occurs in different objects through accretion and self-enrichment processes. During this epoch [Fe/H] stars are produced via merging of self-enriched and accreted haloes. Unlike in Scannapieco et al. (2007), no [Fe/H] stars form below because of the GM mixing approximation assumed here.
The second region (Age Gyr, [Fe/H]) is filled by stars which almost span the entire range of ages and metallicities along a relation on which the iron-abundance increases with decreasing age (halo, bulge, thick and thin disk). These stars formed in accreting haloes; the minimum [Fe/H] value of the stellar distribution at different epochs reflects the iron evolution of the MW environment. Stars located in this area only represent of the total stellar mass at .
The third region ([Fe/H]) is populated by iron-rich stars formed in self-enriched haloes, which therefore span all the possible ages (bulge, thin and thick disk). The bulk of the stellar mass resides in this region and corresponds to the broad peak of the SF rate (, see for a representative SF history Fig. 1 of Evoli, Salvadori & Ferrara 2008). Note that the most iron-rich stars in the simulation with ages Gyr, are poorer in iron than those observed. This systematic effect may be a consequence of neglecting the contribution of SNIa to gas enrichment. However because this study is mostly concentrated on the spatial distribution of old and iron-poor Galactic halo stars this does not affect the main results. Even if we consider the possible existence of a “prompt” SNIa component, with lifetime of SNIa of Gyr (Mannucci, Della Valle & Panagia, 2006), this is typically longer than the evolutionary time-scale of SNII ( Gyr). Therefore, the iron produced by the first SNIa will only marginally contribute to pollute an ISM which has been already largely pre-enriched by several generations of SNII and Pop III stars.
In the following we will focus on the properties of old metal-poor [Fe/H] stars, whose features are unaffected by the lack of disk formation and SNIa contribution of our study. By excluding from our sample all the stars residing at distances kpc from the Galactic plane, we remove possible contamination by thin/thick disk stars.
3.2 Metallicity distribution
In the left lower panel of Fig. 1 the Galactic halo MDF observed by Beers et al. (2005) is compared with the simulated one at galactocentric distances . The agreement between the model results for a radial interval representative of the observed region and the data is very good. In the same panel we show for comparison the simulated MDF for the inhomogeneous mixing case (cyan histogram). The two mixing prescriptions only yield a marginal difference, mostly concentrated in the range [Fe/H] (see Sec. 4 for the discussion). These results encourage us to formulate explicit predictions for the radial dependence of the simulated MDF. To explore this point, we compare the same observational data with theoretical MDFs obtained in different radial bins and normalized to the number of observed stars. We note that the all-radii MDF (left upper panel) already provides a satisfactory match of the data implying that the observational sample obtained in the above -range provides a good proxy for the all-radii one. A marginal discrepancy at the low-Fe end of the distribution is found when comparing the observed data with theoretical MDFs derived for kpc (lower panels), which becomes more sensible as increases. In conclusion, we find that the MDF varies only very weakly with radius. On the contrary, and in agreement with recent findings by Carollo et al. (2007) and De Lucia & Helmi (2008), the relative contribution of [Fe/H] stars to the total MDF strongly depends on , varying from within kpc kpc, down to for kpc.
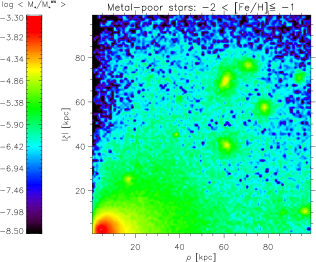
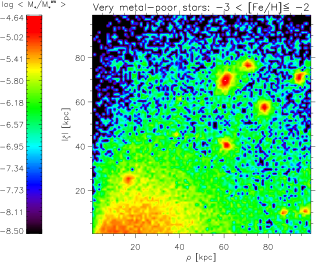
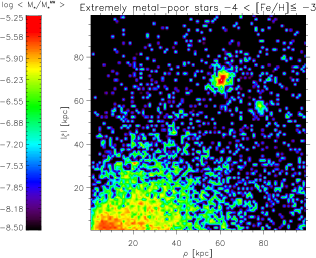
To better understand these features it is helpful to analyze Fig. 3, which offers a spatial visualization of the MDFs in the cylindrical coordinate plane, where is the rotation axis and . We show the results for the central kpc2 region. Each panel of the figure displays a subset of relic stars in a different metallicity range: metal-poor (MP), [Fe/H], very metal-poor (VMP), [Fe/H], extremely metal-poor (EMP), [Fe/H]. The colors show the total mass of stars contained in an annulus of radial width within kpc normalized to the total MW stellar mass.
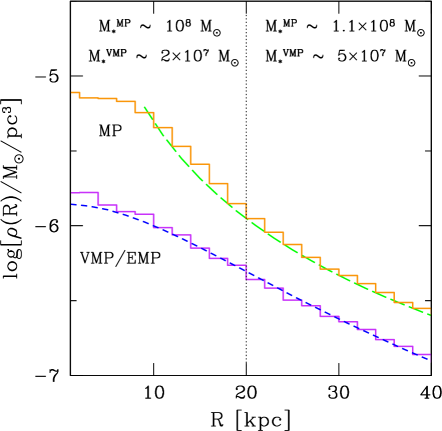
The stellar distribution closely follows the dark matter one, i.e. it is denser towards the center and in the 10 dwarf galaxies found in kpc kpc. The radial dependence of the MPs distribution (left panel) is very steep, varying by more than 2 orders of magnitude in the inner kpc; into the same region instead VMP/EMP stars (middle/right panels) are much more uniformly distributed and exhibit a central core. This is further illustrated in Fig. 2, which shows the average density profiles of MP and VMP/EMP stars as a function of the distance from the Earth, . While for kpc the density of MP stars closely follows a power-law in radius, , that of VMP/EMP stars is well approximated by a -function, , with and kpc. It follows that the relative contribution to the MDF of more pristine stellar generations becomes gradually more important at large distances (Fig. 1). Beyond kpc very metal-poor stars are mostly concentrated within dwarf satellites, which are clearly identified in Fig. 3. This is in agreement with well-known evidence that the MDF in dwarf galaxies is shifted towards lower-[Fe/H] with respect to the Galactic one (Helmi et al. 2006). Interestingly extremely metal-poor stars are found only in two dwarfs and, even in these objects, they represent a sub-dominant stellar population (). Beyond 60 kpc the number of EMPs drops implying that this population is more condensed within such a region.
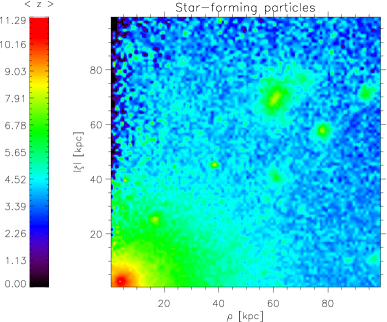
What determines the spatial distribution of stars with different [Fe/H]? In addition to the underlying structure formation governed by DM, there are two key ingredients: (i) the virialization epoch of the star-forming haloes, which affects the final distribution of DM and hence of stars; (ii) the metal enrichment history of the GM, setting the initial Fe-abundance of the ISM in newly virializing haloes. In Fig. 4 we show the average formation redshift of DM particles hosting [Fe/H] stars, , in the plane. The oldest stars populate the innermost region; moreover, gradually decreases with . Beyond kpc on average . As for the GM has been already enriched up to [Fe/H], extremely metal-poor stars become more rare in such outer regions; this explain their spatial condensation. Very metal-poor stars, instead, extend up to 100 kpc as [Fe/H] when . Finally, as metal-poor stars predominantly form via self-enrichment their spatial distribution is unaffected by the GM enrichment and it is solely determined by hierarchical history of collapsed structures.
A final remark concerns dwarf satellite galaxies. Beyond kpc the dwarf systems can be identified as clumps of high against the more uniform background. All satellites found in the simulation are “classical” dwarf galaxies, i.e. they have . Only two of them, corresponding to rare fluctuations, were hosting Pop III stars as they virialized and began to form stars when and . The powerful explosions following the evolution of Pop III stars222Massive Pop III stars evolve as pair-instability SN. For the explosion energy is erg caused the complete blow-away of gas and metals; long-living stars only form at later times when more pre-enriched gas is collected by the dwarfs through accretion and merging processes. No clear imprint of their pristine formation can be found in these galaxies, which have similar stellar populations ([Fe/H]) of “normal” dwarf satellites. Note however that these galaxies represent the most massive dwarfs we found with and . The remaining % of dwarfs correspond to fluctuations which virialize at later epochs when [Fe/H]. The lack of [Fe/H] stars (Helmi et al. 2006) is hence naturally explained in these objects which have a dark matter and stellar mass content consistent with that of the observed dwarf spheroidal galaxies.
4 Discussion
Old, [Fe/H] stars, are intrinsically rare in the Galaxy, representing only (i.e. ) of the total stellar mass. This makes the selection of VMP stars one of the major challenges of stellar surveys dovoted to their investigation. Our study shows that: (i) the density of [Fe/H] stars as a function of distance from Earth is very steep, following a power-law, , with ; on the contrary (ii) the density distribution of VMP/EMP stars exhibits a central core, closely following a -function, , with and kpc. Hence, though both populations are more concentrated towards the center, (iii) the relative contribution of [Fe/H] stars increases from in the inner halo (at Galactocentric distances kpc) to in the outer halo, in good agreement with the observational results by Carollo et al. (2007,2009)333The low-metallicity bias in their data sample, leading to an underestimate of the number of [Fe/H] stars, prevents a rigorous comparison between simulated and observed MDFs.. Our findings suggest that the outer halo between kpc kpc is the most promising region to search for VMP stars, though it is obvioulsy harder to find more distant stars in magnitude limited surveys.
The spatial distribution of very/extremely metal-poor stars is imprinted by two physical mechanisms: (i) the natural concentration of old stellar particles towards the more central region of the Galaxy; (ii) the gradual enrichment, through SN-driven outflows, of the MW environment out of which haloes virialize.
Our analysis predicts that the MDF of [Fe/H] stars weakly varies through the central kpc. Furthermore the all-radii MDF, including all the stars within kpc, satisfactory matches the data once normalized to the number of observed stars. Two immediate consequences arise from these results: (i) the observed sample, which only explored a small portion of the Galactic halo, is a good representation of the complete one; (ii) the results of semi-analytical models, which cannot incorporate the spatial information, can nevertheless be compared with the observations to give reasonable approximate results.
Beyond kpc the density of very metal-poor stars is maximum inside the “classical” () dwarf galaxies. We find that 8 out of 10 host [Fe/H] stars only, in agreement with observations by Helmi et al. (2006); in the remaining two extremely metal-poor stars represent a subdominant stellar population, making up only of the total stellar mass. Typically these galaxies virialize at , have a total mass (i.e. they are fluctuations of the density field), and stellar mass . Interestingly, no ultra faint dwarf galaxies () are found in our simulation, confirming that these newly-discovered satellites are probably left-overs of H2 cooling mini-haloes (Salvadori & Ferrara 2009), whose physics is not included in the present study.
We devote the final remark to our “perfect mixing” approximation. As the porosity increases rapidly with time ( for ), the MDFs from the inhomogeneous models are mostly consistent with those derived by using this approximation: the MDFs differences between the two mixing prescriptions (Fig. 1, left lower panel) are smaller than the error expected from averaging over different hierarchical merger histories (see Fig. 6 of SFS07). On the other hand, the true scatter in [Fe/H] at low metallicities and large radii may be substantially larger than in either of these models, as stars are strongly clustered towards the center of our simulation, which will reduce the true filling factor. The full physical modeling of metal mixing and diffusion remains one of the largest uncertainties in galaxy formation, and more work is required before one can draw definite conclusions.
Acknowledgements
We are grateful to A. Verdini for providing his carefully crafted IDL macros and to T. Beers, D. Carollo & N. Prantzos for careful reading of the draft and useful comments.
References
- [\citeauthoryearBeers & Christlieb2005] Beers T. C., Christlieb N., 2005, ARA&A, 43, 531
- [\citeauthoryearBeers et al2005] Beers T. C. et al., 2005, in From Lithium to Uranium: Elemental Tracers of Early Cosmic Evolution, IAUS 228, 175
- [\citeauthoryearBattaglia et al.2005] Battaglia G., et al., 2005, MNRAS, 364, 433
- [\citeauthoryearBertschinger2001] Bertschinger E., 2001, ApJS, 137, 1
- [\citeauthoryearCarollo et al.2007] Carollo D. et al, 2007, Nature, 450, 1020
- [\citeauthoryearCarollo et al.2009] Carollo D. et al, 2009, ApJ submitted (ArXive:0909.3019)
- [\citeauthoryearDe Lucia & Helmi2008] De Lucia G. & Helmi A., 2008, MNRAS, 391, 14
- [\citeauthoryearEvoli, Salvadori & Ferrara2008] Evoli C., Salvadori S. & Ferrara A., 2008, MNRAS, 390, L14
- [\citeauthoryearFreeman & Bland-Hawthorn2002] Freeman K. & Bland-Hawthorn J., 2002, ARA&A, 40, 487
- [\citeauthoryearHelmi et al.2006] Helmi A. et al., 2006, ApJ, 651, L121
- [\citeauthoryearKawata & Gibson2003] Kawata D. & Gibson B. K., 2003a, MNRAS, 340, 908
- [\citeauthoryearKawata & Gibson2003] Kawata D. & Gibson B. K., 2003b, MNRAS, 346, 135
- [\citeauthoryearMannucci et al.2006] Mannucci F., Della Valle M., Panagia N., 2006, MNRAS, 370, 773
- [\citeauthoryearSalvadori et al.2007] Salvadori S., Schneider R., Ferrara A., 2007, MNRAS, 381, 647
- [\citeauthoryearSalvadori et al.2008] Salvadori S., Ferrara A., Schneider R., 2008, MNRAS, 386, 348
- [\citeauthoryearSalvadori & Ferrara2009] Salvadori S. & Ferrara A., 2009, MNRAS, 395, L6
- [\citeauthoryearScannapieco et al.2006] Scannapieco E. et al., 2006, ApJ, 653, 285
- [\citeauthoryearSchneider et al.2002] Schneider R., Ferrara A., Natarajan P., Omukai K., 2002, ApJ, 571, 30
- [\citeauthoryearSchneider et al.2006] Schneider R., Omukai K., Inoue A. K., Ferrara A., 2006, MNRAS, 369, 1437
- [\citeauthoryearTinsley1980] Tinsley B. M., 1980, Evolution of Stars and Gas in Galaxies, 1980 Fundamentals of Cosmic Physics, 5, 287
- [\citeauthoryearTumlinson2006] Tumlinson J., 2006, ApJ, 641, 1