Properties of the phonon-induced pairing interaction in YBa2Cu3O7 within the local density approximation
Abstract
The properties of the phonon-induced interaction between electrons are studied using the local density approximation (LDA). Restricting the electron momenta to the Fermi surface we find generally that this interaction has a pronounced peak for large momentum transfers and that the interband contributions between bonding and antibonding band are of the same magnitude as the intraband ones. Results are given for various symmetry averages of this interaction over the Fermi surface. In particular, we find that the dimensionless coupling constant in the -wave channel , relevant for superconductivity, is only 0.022, i.e., even about ten times smaller than the small value of the -wave channel. Similarly, the LDA contribution to the resistivity is about a factor 10 times smaller than the observed resistivity suggesting that phonons are not the important low-energy excitations in high-Tc oxides.
pacs:
74.72.-h,63.20.kd,71.38.-k,71.15.MbI Introduction
The relevance of phonons for the low-energy properties of high-Tc oxides is presently rather controversially discussed. Some experiments suggest that the charge carriers near the Fermi surface interact only weakly with phonons. Examples are the magnitude and temperature dependence of the resistivity Ando and the rather small effects in the phonon spectrum caused in general by superconductivity near or below the transition temperature Tc Pintschovius . For instance, the superconductivity-induced softening and width of the zone-center buckling mode in YBa2Cu3O7 corresponds to a rather small electron-phonon (ep) coupling constant Friedl . The recently measured isotope dependence of angle-resolved photoemission spectra (ARPES) Iwasawa do not indicate any isotope dependence of the total electronic band width for binding energies down to 200 meV. This shows the inapplicability of a simple polaron picture, caused by a strong ep interaction, to cuprates because the associated band narrowing would be sensitive to different isotopes Alexandrov .
On the other hand, there exist many observations which have been taken as evidence for a substantial ep interaction in the cuprates. The measured isotope effects on the transition temperature Franck and the the superfluid density Keller , especially in underdoped samples, are two examples. Another example is the large width and softening observed in bond-stretching phonons in hole-doped cuprates in a very small region in -space Reznik . Similarly, the absence of a quasi-particle peak in strongly underdoped Ca2-xNaxCuO2Cl2 Shen1 as well as the doping dependence of a magnetic transition in the frequency-dependent conductivity were attributed to phonons Gunnarsson ; Mishchenko . Finally, electronic self-energy effects in the phonon energy region have been observed by ARPES Lanzara and by scanning tunneling microscopy Lee and interpreted in terms of a coupling of electrons to a bosonic mode. Whether this mode is related to phonons is presently unclear but if this is the case the ep coupling and phonons would certainly be important for the low-energy physics of cuprates.
Unfortunately, there exists for virtually every interpretation of experiments in favor or disfavor of phonons alternative explanations. For instance, the large isotope effects on Tc observed in the underdoped region do not indicate necessarily a large ep coupling but may be caused by the pseudogap Dahm . Similarly, the bosons which interact with electrons near the Fermi surface in the interpretation of ARPES data may be not phonons but, for instance, spin fluctuations spinfluct ; Dahm2 ; Manske . In view of these uncertainties it seems useful to investigate the properties of the ep coupling independently from any interpretation of experiments, i.e., from first-principles using the local density approximation (LDA). To this end we extend recent investigations on phonon-induced electronic self-energy effects Heid ; Giustino and study the momentum, frequency dependence and magnitude of the phonon-induced interaction between electrons in detail. Though our approach is based on the LDA and deals only with the stoichiometric case it takes many features of these systems such as the complicated phonon spectrum and screening properties self-consistently and realistically into account.
II Computation of the phonon-induced interaction
The retarded, phonon-induced electron-electron interaction, multiplied by -1 for convenience, is given in momentum space by Mahan ,
| (1) |
denotes the renormalized amplitude for a transition from the electronic state with momentum and band index to the state with momentum and band index creating (annihilating) a phonon with branch label and momentum . denote the phonon frequencies and a positive infinitesimal. The amplitudes are obtained within the LDA with the efficient linear-response technique Baroni ; Heid99 . We used a 36x36x4-mesh for the electronic momentum within the Brillouin zone of YBa2Cu3O7, while phonon frequencies and the self-consistent electron-phonon potential were calculated for transferred momenta on a coarser 12x12x4-mesh. Because even for this reduced mesh an exact calculation was numerically very demanding, we adopted a two-step procedure. First, phonon related quantities were calculated exactly by linear response on a 4x4x2-mesh. Details can be found in Refs. Bohnen, and Heid, . These quantities were then approximated on the 12x12x4-mesh by a Fourier-interpolation technique.
Under the usual assumptions it is sufficient to restrict the electronic momenta and in to the Fermi surface. Our momentum meshes allow to put practically right on the Fermi surface whereas was chosen as near as possible to the Fermi surface. Fermi surface averages were calculated including also a Gaussian for the one-particle energies with width . The Fermi surface in YBa2Cu3O7 consists essentially of three bands where ,, and denote the antibonding, bonding and chain band, respectively.
III Results
III.1 Momentum dependence
The upper panels of Fig. 1 show the intraband contribution to the static interaction . We used and , i.e., all electronic momenta are restricted to the plane . The left part in this figure refers to a fixed momentum at the nodal, the right part at the antinodal Fermi point. Symbols indicate electronic states whose energies differ from the Fermi energy by less than a certain threshold energy. The large filled circles refer to 0.1 eV, the small filled circles to 0.2 eV, the open circles to 0.3 eV. Lines approximate the Fermi surface and are obtained by a linear interpolation between neighboring mesh points. The position in -space of the mesh points corresponding to the different circles is shown in the insets together with the Fermi line depicted by a solid line. is presented as a function of the angle at between the vectors and . Varying between and means that , seen from the point , moves around the Fermi surface in the anticlockwise sense starting from the antinodal point . The angle is illustrated in the left inset. It is rather straightforward to construct a continuous curve for from the discrete points discarding only a very few points which correspond to momenta rather far away from the Fermi surface and thus should be omitted.
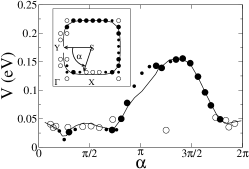
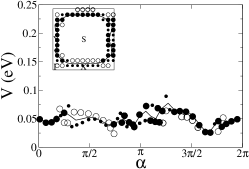
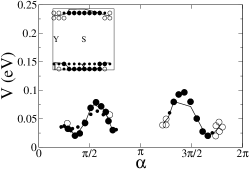
The right potential curve in Fig. 1 should be symmetric with respect to due to the orthorhombic symmetry which is roughly fulfilled for our discrete mesh. If tetragonal symmetry would apply the left potential curve should be symmetric with respect to which holds approximately. Finally, if depends only on the transferred momentum , the left potential curve, shifted rigidly by the angle , would coincide with the right potential curve. This is qualitatively the case, for instance, the two dominating maxima are close to each other after such a shift. Quantitatively there are, however, differences, for instance, the heights of the maxima differ by about 30% and the (small) values at zero momentum transfer by about a factor 3 after the shift. Remarkable is the large variation of by about a factor of 5 between small and large momentum transfers, i.e., between and in the case of the right potential curve. Interesting for the relation between state and transport relaxation times is that is larger for large than for small momentum transfers.
The lower panels in Fig. 1 show potential curves for interband scattering between the antibonding and bonding band. The curves are rather similar to those of the corresponding upper panels in this figure. The only qualitative difference occurs for in the right-hand panel where a pronounced forward scattering peak at the point emerges.
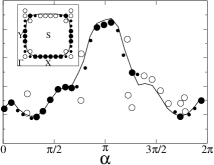
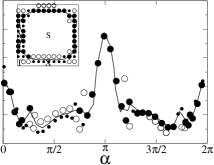
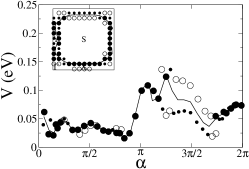
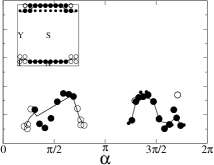
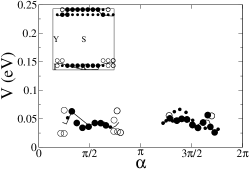
The upper and lower parts of Fig. 2 show potential curves in the same way as in Fig. 1, but for the and contributions, respectively. The intraband potential of the antibonding band looks similar as for the bonding band if is at the antinodal Fermi point but very different if is at the nodal point. In the latter case it is practically independent of and rather small. This means that depends in this case strongly on and not only on the transferred momentum which may reflect the strong interaction with the chain band. The interband contribution between the bonding and antibonding band, shown in the lower part of Fig. 2, looks qualitatively similar as the interband term between the antibonding and the bonding band of Fig. 1 exhibiting well-pronounced maxima at large momentum transfers. At small momentum transfers electrons near the nodal direction interact only weakly whereas those in the antinodal direction develop a second and rather sharp peak in at which, to a lesser degree, was also present in the intraband contribution of the antibonding band. The absolute magnitude of is in all considered cases similar which means that interband and intraband terms are comparable in magnitude.
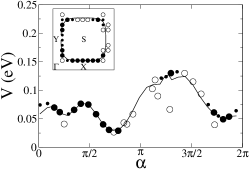
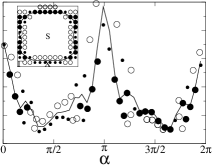
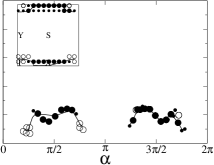
Fig. 3 shows potential curves for interband scattering between the band A and B, respectively, and the chain band C. Due to the geometry of the chain band the angle is restricted to some region around and . The potentials peak in general around these to values but the absolute values are rather small compared, for instance, to those in Fig. 1.
III.2 Frequency-dependence and magnitude of coupling constants
The dimensionless coupling function Mahan can be written in terms of as,
| (2) |
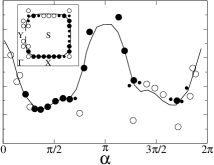
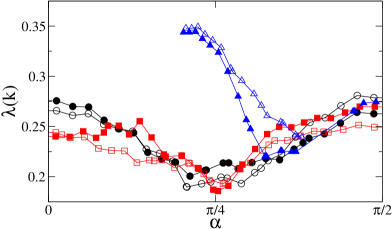
Fig. 4 shows for (red squares joined by straight lines), (black circles) and (blue triangles) for eV as a function of the angle . Using and yields two curves denoted by filled and empty symbols, respectively, which are close to each other illustrating the weak dependence of on . Both for the bonding and antibonding bands is approximately symmetric with respect to reflecting the tetragonal symmetry of isolated layers. Moreover, the coupling functions are smaller along the nodal direction by about 20 to 30 % compared to the antinodal direction which characterizes the anisotropy of in the layers. The Fermi surface of the chain band starts in our plot only somewhat below the nodal direction and yields a rather strong and rapidly varying coupling function reflecting the strong perturbation of tetragonal symmetry by the chains.
Dimensionless coupling constants with can be defined by
| (3) |
with the weight functions , , , , and . denotes the partial density of band in the symmetry channel . The second, third, and fourth columns in Table I show the calculated values for where we approximated the -functions in Eq. (3) by Gaussians with width eV. The fifth column contains , the sum of the three band contributions each weighted with the factor where is the total density of electronic states at the Fermi surface in the channel . These partial density factors enter the total coupling constant relevant for superconductivity.
| s | 0.234 | 0.238 | 0.270 | 0.246 |
|---|---|---|---|---|
| s’ | 0.093 | 0.075 | 0.079 | 0.084 |
| d | 0.011 | 0.034 | 0.032 | 0.022 |
| px | -0.020 | -0.042 | -0.022 | -0.028 |
| py | -0.027 | -0.047 | -0.051 | -0.037 |
The numbers in the columns 2-4 of Table I show that the coupling constants for the three bands are similar in magnitude for each symmetry component. The isotropic -wave component is in all cases substantially larger than those for the remaining “non-trivial” symmetries. According to Eq. (2) and thus also the above coupling constants contain both intraband () and interband () contributions. Keeping only the intraband parts diminishes substantially the numbers in the table. For instance, for the isotropic -wave channel (first line) the numbers for change to 0.090,0.069,0.074, respectively. This means that interband transitions contribute much more to the coupling functions than the intraband transitions. Considering eV instead of 0.2 eV does not change much our results: For instance, the first three numbers in the first line become 0.226,0.229,0.230, respectively. This suggests that our momentum nets are adequate for calculating average quantities such as .
The most interesting numbers in the table are those in the last column which determine the phonon contribution to superconductivity. Isotropic -wave dominates by far but this component is ineffective because of the strong Coulomb repulsion. In all other symmetry channels is very small. This holds in particular for the -wave channel where it is only 0.022, i.e., one order of magnitude smaller than the isotropic -wave value. This value is rather stable with respect to . For instance, it changes from 0.022 to 0.027 if eV is reduced to eV. Keeping only intraband contributions one obtains 0.021, i.e., the interband transitions are negligible in this case.
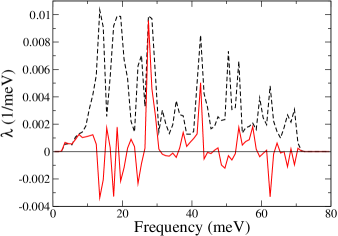
Using the Kramers-Kronig transformation for in Eq. (3) can be written as an integral from zero to infinity over a frequency-dependent coupling function . The same holds for the total functions and . Fig. 5 shows (black dashed line) and (red solid line), using a width of 1 meV for the phonons. In the case of the phonons give only positive contributions to which are spread out over the whole range of phonon frequencies. The spectrum is rather peaky because of the usual occurrence of density peaks. Nevertheless, it is clear that it is not possible to attribute the spectrum to a few distinguished phonons such as the breathing or buckling modes or bond-stretching modes. In the case of phonons give both positive and negative contributions to the spectrum which leads to large cancellations in the integral for and thus to a small value for . Such cancellations would be trivial in the case of a momentum-independent where they would occur for each phonon frequency separately. In our case depends substantially on its two momenta, yet, there are large cancellations, especially between phonons with different frequencies. A somewhat curious point is that the high-frequency part of is dominated by two peaks at around 40 and 65 meV corresponding roughly to the buckling and breathing phonon frequencies, respectively. However, these peaks have different signs and thus cancel each other to a large extent in . We note that the positive peak in at 27 meV is related to an oxygen buckling-type vibration with odd symmetry with respect to the CuO2 bilayer.
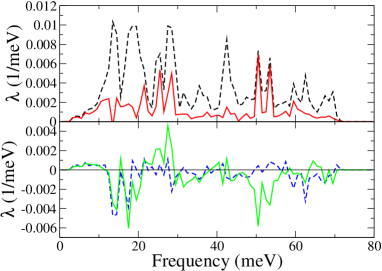
In Fig. 6 we show a comparison between the frequency dependence of the total coupling functions with and (upper panel) and with and (lower panel) symmetries. As expected the -wave coupling function is much larger throughout the whole frequency interval compared to the other symmetries. Remarkable is that the couplings with and symmetries are mainly negative over the whole frequency region and that they differ from each other reflecting the presence of the chain band and the broken tetragonal symmetry.
III.3 Resisitivity
The resistivity in -direction is determined by the transport coupling constant , given by Mahan
| (4) |
where denotes the average of over all pieces of the Fermi surface. Our calculation yields , , and . These values are close to illustrating the fact that the pronounced momentum dependence of V in Figs. 1-3 not necessarily reflects itself in the above coupling constants. Generalizing in Eq. (4) to a finite frequency and taking the imaginary part the right-hand side of this equation is proportional to the function from which the temperature dependence of the resistivity can be calculated using Eqs. (4) and (7) of Ref. Allen . The results are shown in Fig. 7.
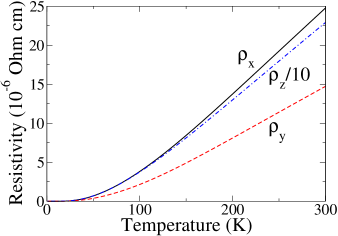
With increasing temperature the curves reach between 120-150 K a quasi-linear regime which approaches in a very smooth way the true linear region above the highest phonon frequency at around 1000K (not shown in Fig. 7). A typical experimental value is Ohm cm Ando , i.e., only about 10 % of the experimental scattering is due to phonons. Also the noticeable deviations from a linear law between Tc = 90K and about 150 K in the theoretical curves seems to be in conflict with the experiment for optimally doped samples.
IV Discussion
Our approach treats electronic correlations only in an approximate way and its applicability to real YBa2Cu3O7 may be questioned. Unfortunately, the calculation of corrections to our results due to strong electronic correlations is difficult and presently not very reliable. However, it seems very improbable that our main results, namely that and are about a factor 50 and 10 too small to account for Tc and , respectively, will be substantially changed by correlations. Experimental data on the width of some phonons are interesting in this respect. The anomalous broadening of the buckling phonon at the zone center has been quantitatively explained with LDA results for the ep-interaction, once a large anharmonic contribution was subtracted Friedl . On the other hand, bond-stretching phonons at low temperatures show anomalies around the wave vector in form of a sharp and localized softening and large widths Pintschovius which clearly are beyond the LDA Heid2 . At higher temperatures, where these anomalies are not present, the measured widths are still sizable. Assuming that these widths are entirely due to the ep-interaction our LDA calculation could only account for about 20 % of these widths. However, part of the widths could also be caused by anharmonicity like in Ref. Friedl . Furthermore, it is not clear how much these rather localized anomalies in -space contribute to Fermi surface averaged quantities like . A large increase of due to correlation-enhanced coupling to bond-stretching phonons could account for the missing scattering contribution found in the LDA calculation of . On the other hand, its temperature dependence would be in conflict with the observed linear temperature between Tc and room temperature because the onset of the linear dependence in Fig. 7 would be shifted to higher temperatures due to the high frequency of bond-stretching phonons.
References
- (1) Y. Ando, S. Komiya, K. Segawa, S. Ono, and Y. Kurita, Phys. Rev. Lett. 93, 267001 (2004).
- (2) L. Pintschovius, physica status solidi (b) 242, 30 (2005).
- (3) B. Friedl, C. Thomsen, and M. Cardona, Phys. Rev. Lett. 65, 915 (1990).
- (4) H. Iwasawa et al., Phys. Rev. Lett. 101, 157005 (2008).
- (5) A.S. Alexandrov and N.F. Mott, High Temperature Superconductors and other Superfluids, Taylor and Francis, London (1994).
- (6) J.P. Franck, in , ed. by D.M. Ginsberg (World Scientific, Singapore, 1994), p. 189.
- (7) H. Keller, in 114, 143 (2005), Springer-Verlag Berlin, 2005.
- (8) D. Reznik, G. Sangiovanni, O. Gunnarsson, and T.P. Devereaux, Nature 455, E6-E7 (2008).
- (9) K.M. Shen et al., Phys. Rev. Lett. 93, 267002 (2004).
- (10) O. Gunnarsson and O. Roesch, J. Phys.:Condens. Matter 20, 043201 (2008).
- (11) A.S. Mishchenko et al., Phys. Rev. Lett. 100, 166401 (2008).
- (12) A. Lanzara et al., Nature 412, 510 (2001).
- (13) J. Lee et al., Nature 442, 546 (2006).
- (14) T. Dahm, Phys. Rev. B 61, 6381 (2000).
- (15) For a recent review, see M. Eschrig, Adv. in Physics 55, 47, (2006).
- (16) T. Dahm et al., Nature Physics 5, 217 (2009).
- (17) D. Manske, Theory of Unconventional Superconductors, Springer, Berlin (2004).
- (18) R. Heid, K.-P. Bohnen, R. Zeyher, and D. Manske, Phys. Rev. Lett. 100, 137001 (2008).
- (19) F. Giustino, M.L. Cohen, and S.G. Louie, Nature 452, 975 (2008).
- (20) G.D. Mahan, Many-Particle Physics, Plenum Press, New York (1990).
- (21) S. Baroni et al., Rev. Mod. Phys. bf 73, 515 (2001).
- (22) R. Heid and K.-P. Bohnen, Phys. Rev. B 60, R 3709 (1999).
- (23) K.-P. Bohnen, R. Heid, and M. Krauss, Europhys. Lett. 64, 104 (2003).
- (24) P.B. Allen, W.E. Pickett, and H. Krakauer, Phys. Rev. B 37, 7482 (1988).
- (25) R. Heid, K.-P. Bohnen, and V. Pankoke, J. Supercond. Nov. Magn.20, 559 (2007).