Near-IR search for lensed supernovae behind galaxy clusters
Abstract
Context. Massive galaxy clusters at intermediate redshift can magnify the flux of distant background sources by several magnitudes.
Aims. We exploit this effect to search for lensed distant supernovae that may otherwise be too faint to be detected.
Methods. A supernova search was conducted at near infrared wavelengths using the ISAAC instrument at the VLT. The massive galaxy clusters Abell 1689, Abell 1835, and AC114 were observed for a total of 20 hours to search for supernovae in gravitationally magnified background galaxies. The observations were split into individual epochs of 2 hours of exposure time, separated by approximately one month. Image-subtraction techniques were used to search for transient objects with light curve properties consistent with supernovae, both in our new and archival ISAAC/VLT data. The limiting magnitude of the individual epochs was estimated by adding artificial stars to the subtracted images. Most of the epochs reach 90% detection efficiency at mag (Vega).
Results. Two transient objects, both in archival images of Abell 1689 and AC114, were detected. The transient in AC114 coincides – within the position uncertainty – with an X-ray source and is likely to be a variable AGN at the cluster redshift. The transient in Abell 1689 was found at mag, ″away from a galaxy with photometric redshift . The light curves and the colors of the transient are consistent with a reddened Type IIP supernova at redshift . The lensing model of Abell 1689 predicts 1.4 mag of magnification at the position of the transient, making it the most magnified supernova ever found and only the second supernova found behind a galaxy cluster.
Conclusions. Our pilot survey has demonstrated the feasibility to find distant gravitationally magnified supernovae behind massive galaxy clusters. One likely supernova was found behind Abell 1689, in accordance with the expectations for this survey, as shown in an accompanying analysis paper.
Key Words.:
supernovae: general – gravitational lensing – methods: observational – techniques: photometric1 Introduction
Gravitational lensing by massive galaxy clusters provides unique opportunities to study extremely distant background objects. The modeling of the most massive galaxy clusters at intermediate redshifts shows that the flux of background sources with lines-of-sight close to the critical lines can be magnified by more than 3 magnitudes. These powerful natural gravitational telescopes have been successfully used to identify and study gravitationally-lensed galaxies at very high redshift (e.g., Franx et al., 1997; Ellis et al., 2001; Hu et al., 2002; Kneib et al., 2004; Richard et al., 2006, 2008).
Repeated observations of massive galaxy clusters may also allow discovery of very distant supernovae (SNe) at redshifts beyond , which may be too faint to be detected without the lensing magnification (e.g., Kovner & Paczynski, 1988; Kolatt & Bartelmann, 1998; Saini et al., 2000; Sullivan et al., 2000; Gal-Yam et al., 2002; Gunnarsson & Goobar, 2003). Gal-Yam et al. (2002) have searched repeated observations of galaxy clusters from the archive and found several SNe, but only one of them in a background galaxy, which has a redshift close to that of the lensing cluster.
Detecting and studying SNe at very high redshifts is important for several reasons:
1. The progenitors of core-collapse (CC) SNe are massive short-lived stars. The CC SN rate thus reflects the ongoing star formation rate (SFR) and can be used to measure it. The first results on the SFR derived from CC SNe (Dahlen et al., 2004) show an increase in the range , consistent with the measurements from galaxy luminosity densities. The magnification provided by galaxy clusters may help to detect a population of CC SNe at for the first time and to obtain an independent measurement of the cosmic SFR in a redshift range where current theoretical predictions do not give consistent results (e.g., Dahlen et al., 2004; Mannucci et al., 2007; Kobayashi & Nomoto, 2008). It may also be possible to put constraints on the rates of the very luminous Type IIn and pair-production SNe, and on Type Ic hypernovae. In addition, there is growing evidence that Type IIP SNe could be calibrated as standard candles (Hamuy & Pinto, 2002; Nugent et al., 2006; Poznanski et al., 2009; Olivares, 2008) and may turn out to be more useful cosmological probes than Type Ia SNe (SNe Ia) at high redshift because SNe Ia may be very rare or even absent at (Kobayashi et al., 1998).
2. Type Ia SNe have been used to measure the cosmological parameters; however, the scenario(s) leading to the explosion of SNe Ia is still unknown. Models predict that different progenitor scenarios should have different delay times between the onset of star formation and the SN Ia explosion. By measuring the SN Ia rate and comparing with the SFR, it is possible to set constraints on , hence on progenitor scenarios (see e.g., Strolger et al., 2004). The predicted SN Ia rate is most sensitive to the delay time for , but, as for CC SNe, different SN Ia rate predictions significantly diverge at (Kobayashi et al., 1998; Dahlen et al., 2008; Mannucci et al., 2007; Kobayashi & Nomoto, 2008; Neill et al., 2006; Scannapieco & Bildsten, 2005). Strolger et al. (2004) and Dahlen et al. (2008) find a long delay time Gyr from the low number of SNe found at . This implies that SN Ia progenitors are old, low-mass stars and that there should be a steep decline in the SN Ia rate at (as in the model of Kobayashi et al. 1998). However, Mannucci et al. (2005) and Sullivan et al. (2006) present evidence for a dependence of the SN Ia rate on the SFR, thus relating a significant fraction of SNe Ia to young massive stellar populations. It is expected then that the SN Ia rate will increase at , although Mannucci et al. (2007) suggest that a considerable fraction of SNe Ia may be missed because of dust extinction. Measurement of the SN Ia rate at will thus be critical for distinguishing between the models.
3. Modeling of the mass distribution of the best-studied clusters shows that the magnification of lensed SNe can be estimated to an accuracy of mag or better depending on the SN location and the accuracy of the mass model (Kneib et al., 1996; Saini et al., 2000). Thus, lensed SNe can be used as distance indicators and significantly increase the leverage of the current SN Ia Hubble diagram.
4. The time delay between multiple images of highly magnified galaxies could be as shotr as weeks or months. Detection of multiple SN images is then possible, and the time delay between them could be used to constrain the Hubble parameter (Refsdal, 1964). Because of the transient nature of SNe, the uncertainty in the time delay will be small (Goobar et al., 2002; Mörtsell et al., 2005).
In this paper we describe a pilot near-infrared (NIR) survey designed to find gravitationally magnified SNe in galaxies behind the massive, well-studied galaxy clusters Abell 1689, Abell 1835 and AC114. Here, we describe the observing strategy, data reduction, and the SN search efficiency of the survey. In an accompanying paper (Goobar et al., 2009, hereafter Paper II) we present a detailed analysis of the survey and the implications for future deeper and wider surveys. A feasibility study of the potential for improving the mass models of clusters of galaxies and measuring cosmological parameters using lensed SNe will be presented in Riehm et al. (in preparation, Paper III). Throughout the paper we assume the concordance cosmological model with , , and , and we use magnitudes in the Vega system.
2 Observations
For this pilot survey, we selected three of the best-studied massive galaxy clusters at intermediate redshift: Abell 1689 (), Abell 1835 (), and AC114, also known as Abell~S1077 (). The mass distributions of these clusters have been extensively modeled (Broadhurst et al., 2005; Richard et al., 2006; Limousin et al., 2007) and the magnification maps can be computed as a function of source redshift. Deep multi-color optical and NIR observations are available for all clusters, including data, making it possible to compute photometric redshifts of most of the galaxies in the FOV. In addition, spectroscopic redshifts of multiple images of many strongly lensed background galaxies are available.
At the targeted redshifts, beyond , the UV/optical wavelengths, where most of the SN luminosity is emitted are redshifted to the near infrared (NIR) domain, and the search should be ideally done in the NIR. Even when including the lensing magnification, supernovae at are expected to be fainter than 23 mag in the NIR, and thus 8-m class telescope observations are needed. For the observations described in this paper, we used VLT/ISAAC (Moorwood et al., 1998). The Einstein radii of the three clusters at high redshift are ″, and the large-magnification regions fit well into the ISAAC 2.5′2.5′ field-of-view (FOV). In addition, archival NIR observations at VLT/ISAAC under excellent seeing conditions are available for all clusters and can be used as reference images for the SN search.
To test the feasibility of the project, we used archival VLT/ISAAC observations of Abell 1835 obtained with an filter111The filter is a broadband filter with central wavelength 1.06m and width 0.13m. It is most often used as an order-sorting filter for ISAAC NIR spectroscopy but is also offered as an imaging filter. (Richard et al., 2006). The observations were obtained in two runs one month apart and with total exposure times of and hours. The two combined images were subtracted and searched for transient sources. None were found, but these observations allowed us to test the data reduction and the image subtraction scheme on real data, and to realistically estimate the SN survey depth. By adding artificial stars we could establish that we would have a good detection efficiency down to mag. Using mag as the projected photometric depth of the survey, the cluster magnification map from Richard et al. (2006) and the absolute magnitudes of the different SN types, a first estimate of the number of SNe that could be detected in our survey was obtained following the procedure in Paper II. The results were encouraging and we estimated that a few SNe per cluster per year could be detected. For the highest redshifts, besides Type Ia SNe, the survey should be most sensitive to Type IIn and IIL SNe, which have very blue spectral energy distribution (SED) around maximum light. Close to peak brightness, Type IIP SNe should also be within reach. Since significant star formation may take place in the blue arcs of the strongly lensed galaxies behind the clusters, several magnified Type II SNe are expected in our survey, possibly with multiple images within our observational window.
After the preliminary study, we decided to observe our targets with 2 hours of total exposure time per observation with 30 days cadence over the period when the clusters were observable. The search was thus performed in a ‘rolling search’ scheme, where new SNe are discovered and old SNe are followed using the same observations. Abell 1689 and Abell 1835 were observed with the filter and AC114 with to be able to use the archival VLT/ISAAC observations as references. Details of our observations are given in Table 1 (the 2007 data), along with other NIR and optical data from the ESO archive. No spectral or multi-color observations were obtained and for this pilot run, the SN identification is done using the information on light curve shapes, absolute magnitudes and host galaxy type and redshift, if known.
3 Data reduction
Because of the presence of bright galaxies with extended halos at the cluster centers, the best observing strategy is beam-switching. However, this observing mode doubles the execution time needed for the observations. We therefore used a simple dithering scheme without beam-switching for separate sky measurements. The exposures were quasi-randomly dithered within a box of size 40″– larger than the typical size of the bright cluster galaxies – and we adopt a slightly revised version the reduction procedure described by Richard et al. (2006) in order to optimize the background subtraction and the detectability of faint point sources.
All images were first corrected for the ‘electrical ghost’ effect
with the recipe ghost within the ESO software library Eclipse222available at http://www.eso.org/projects/aot/eclipse/. The effect consists of an
additional signal, which on a given row is proportional to the sum of
the intensity along this row and the row 512 rows away. It has a
reproducible behavior and can be removed with a simple
algorithm333see http://www.eso.org/sci/facilities/paranal/
instruments/isaac/doc/drg/html/node33.html. Dark current and
flat-field corrections were applied using observations obtained as a
part of the ISAAC standard calibration plan. The most challenging
part of the NIR data reduction is the background subtraction. We
performed this with the XDIMSUM package in IRAF444All data
reduction and calibration was done in IRAF and with our own programs
written in IDL. IRAF is distributed by the National Optical Astronomy
Observatories, which are operated by the Association of Universities
for Research in Astronomy, Inc., under cooperative agreement with the
National Science Foundation. in a 3-step process:
| Date | Exposure | Seeing | 90% detection |
|---|---|---|---|
| [min] | [arcsec] | efficiency [mag] | |
| Abell 1689 – VLT/ISAAC -band | |||
| pointing 1 | |||
| 2003 02 09a | 159 | 0.52 | 24.28, transient |
| 2003 04 27 | 43 | 0.43 | 24.28, transient |
| 2004 01 13 | 43 | 0.52 | 23.58, non-detect |
| 2004 02 14 | 43 | 0.58 | 23.64, non-detect |
| pointing 2 | |||
| 2003 01 16 | 43 | 0.58 | 23.48 |
| 2003 02 15 | 43 | 0.50 | 23.60 |
| 2003 04 27 | 86 | 0.44 | 23.64 |
| 2004 01 12 | 43 | 0.55 | 23.64 |
| pointing to cluster core | |||
| 2007 04 08 | 117 | 0.64 | 23.95 |
| 2007 05 14/15 | 117 | 0.65 | 23.95 |
| 2007 06 06 | 39 | 0.70 | 23.15 |
| AC 114 – VLT/ISAAC -band | |||
| 2002 08 20 | 108 | 0.49 | 23.87 |
| 2007 07 13b | 234 | 0.43 | 24.04 |
| 2007 08 09 | 117 | 0.73 | 23.79 |
| 2007 09 02 | 117 | 0.55 | 23.83 |
| 2007 09 28 | 117 | 0.46 | 24.04 |
| Abell 1835 – VLT/ISAAC -band | |||
| area 1 | |||
| 2004 04 20 | 231 | 0.49 | 24.06 |
| 2004 05 15 | 135 | 0.62 | 24.06 |
| 2007 04 18 | 117 | 0.79 | 23.80 |
| 2007 05 18 | 78 | 0.74 | 23.83 |
| 2007 07 18 | 117 | 0.62 | 23.80 |
| area 2 | |||
| 2007 04 18 | 117 | 0.79 | 23.70 |
| 2007 05 14/18 | 60 | 0.80 | 23.45 |
| 2007 07 18 | 117 | 0.62 | 23.70 |
a – average of observations obtained on 5,11 and 15 February;
b – average of observations obtained on 11,12,13 and 15 July.
-
1.
For each image, the 8 exposures closest in time were scaled to the same mode and median combined to estimate the sky background. The combined image was scaled to the mode of the image from which the background is to be removed and was subtracted from it. The sky-subtracted images were then combined with integer pixel shifts to preserve the characteristics of the noise. The ISAAC pedestal is highly variable in time and is very difficult to remove accurately. In some of the images, significant residuals were found along the bottom and the middle rows of the array, where the readout of the two halves of the array starts. It was then necessary to correct for this effect before the final combination. At the first step this was done by simply taking a median along the image rows with clipping and subtracting it.
-
2.
The combined image from Step 1 was used to detect objects and create an object mask. For this XDIMSUM uses a simple method where all pixels above a given threshold, typically 2 times the standard deviation of the sky, are assumed to belong to objects. The mask is then deregistered to each individual image. The same operations as in Step 1 were then repeated, but now all pixels belonging to objects were excluded when performing the background estimation and residual pedestal subtraction. The only difference was that, instead of the median, the mode along the image rows was used to remove the residual pedestal.
-
3.
The combined image from Step 2 was used to create an improved object mask using the more sophisticated OBJMASK task. This task detects connected pixels and can also apply object growing, which in our case was important for masking the extended halos of the cluster galaxies. The background subtraction was repeated with the improved object mask to arrive at our final sky-subtracted images.
For the final combination, we assigned weights to the individual images in order to optimize the detection of faint point sources. The weights are inversely proportional to the product of the square of the seeing, the variance of the sky background and the multiplicative factor that brings the images to the same flux scale. The archival ISAAC observations, which we used as reference images and when possible to search for SNe, were reduced following the same recipe.
The photometric calibration of the images was obtained with standard stars from Persson et al. (1998) and a few from Hawarden et al. (2001) observed in each photometric night as part of the ISAAC standard calibration plan. Because the standard stars do not have calibrated magnitudes, we used -band magnitudes to calibrate the observations of Abell 1835 and Abell 1689. The majority of the Persson et al. (1998) stars have mag, which corresponds to late F to early G type stars. Synthetic and photometry was computed using spetrophotometry of F8V to G5V stars from Pickles (1998), a synthetic spectrum of the Sun from Kurucz web site555available at http://kurucz.harvard.edu and the Vega spectrum from Bohlin (2007), assuming all colors of Vega to be zero. The computed synthetic colors ranged between 0.1 and 0.2 mag, and we corrected the zero points estimated from the magnitudes of the Persson et al. (1998) stars by mag to derive the zero points. A correction of the same order was also estimated based on synthetic photometry of elliptical galaxies, as described in Richard et al. (2006).
4 The transient search and survey depth

To search for transient objects, the reference images were subtracted from our new images. The subtraction was done with Alard’s optimal image subtraction software (Alard & Lupton, 1998; Alard, 2000), slightly modified and kindly made available to us by B. Schmidt. The reference image is geometrically aligned to the new image, convolved by a kernel such that the two images have the same PSF, and then scaled and subtracted. The residual images were searched for transient sources with Sextractor v2.5 (Bertin & Arnouts, 1996). The images were first convolved with a Gaussian filter with FWHM equal to the seeing and then searched for sources consisting of at least four connected pixels above the background.
Because we expect most SNe to be very faint and close to the detection limit of the survey, we required the object to be detected in at least two epochs for a secure detection. Since SNe could have been recorded on the archival data that were used as reference, we also searched for negative peaks. Part of the archival observations were obtained during many separate runs and were also searched for transients.
The detected sources were carefully examined visually and obvious artifacts and clear spurious detections near the underexposed image edges discarded. The cores of the compact, bright cluster galaxies could often not be subtracted cleanly, so significant residuals were left. Therefore, all “detections” close to badly subtracted cluster galaxies were rejected. After these cuts, only a few detections per image were typically left for closer examination. None of these potential transients was detected in more than one epoch. The careful visual examination (including blinking of the subtracted and the original images) showed that all but two candidates could not be visually distinguished from the background noise. That none of the other potential candidates were picked up by Sextractor in another epoch makes us conclude that there was no evidence that any of these were real transient detections. The remaining two detections will be discussed in detail in the next section.
To estimate the detection limits of the survey, for each epoch the PSF was computed using stars in the fields and 50 artificial stars with magnitudes between 22 and 25 were randomly added to the subtracted images. For each epoch, this was repeated 200 times (10000 artificial stars), and the artificial stars were recovered with the same Sextractor parameters used to search for transients. The detection efficiency was then computed in 0.2 mag bins as the fraction between the number of recovered stars and the number of added stars. Because we expect to find SNe on faint galaxies (if visible at all) with surface brightnesses close to the background, we only considered the artificial stars away from bright objects in the field. In addition, because we expect to find rather faint SNe close to the detection limit, we only consider the central parts of the images that received at least 90% of the total exposure time. In Table 1, we show the 90% detection limits and in Fig. 1, the detection efficiency curves for AC114 are shown as an example.
We note several complications. For AC114 our first epoch had better seeing and photometric depth than the archival observations. We therefore used our first epoch as the main reference image for the search. A Type IIP SN that had nearly constant brightness during our observational window could still be detected as a negative source in the subtraction of the archival observations.
The archival observations of Abell 1689 have been obtained at 4 pointings in order to cover the whole cluster. Each pointing covers of our new images and so each quarter was then treated separately using the respective reference image. The four combined reference images have nearly the same seeing, and the detection efficiencies were nearly the same. In Table 1 we give the average detection limits.
All observations of Abell 1835 should have had the same pointing as the archival data, namely 1′ off the cluster center to avoid a very bright star falling into the FOV. However, a coordinate error meant that the observations were obtained at two pointings: the intended one and the one without the offset. The parts of the images that overlapped with the archival data were analyzed using the reference image from the archival data. The detection limits are given as “area 1” in Table 1. Those parts of the images that did not overlap with the archival data were analyzed using our observation on 18 July 2003 as the reference. This is “area 2” in Table 1. Because of the different photometric depth of the reference images, we obtain slightly shallower detection limits for area 2.
5 Results
The search yielded the detection of two transient objects, one in each of the fields of Abell 1689 and AC114. Both objects were detected in the archival images and not in our new survey images.
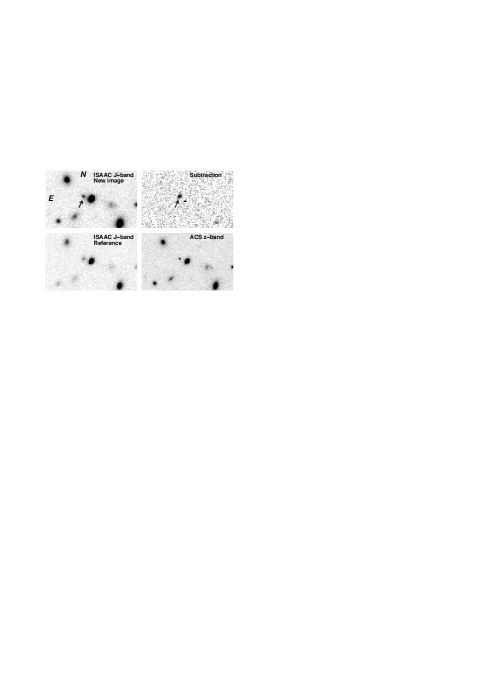
5.1 The AC114 transient
Stamps from the and -band (effectively corresponding to Gunn -band) images of the transient in AC114 are shown in Fig. 2. The transient is seen in all archival , , and images as a compact unresolved source. It is also present – barely resolved from the nearby galaxy – in the ground and band images, as well as on the -band images taken 14 November 2004. The coordinate matching of the -band to the image shows that the variable object coincides exactly with a compact barely resolved galaxy. It is also within the position errors of the X-ray source AC114-2 detected by Martini et al. (2006) in images. The spectrum of Martini et al. (2006) is relatively blue, which together with the detected X-ray emission suggest that the object is a variable AGN. Martini et al. (2006) measure a redshift of , which implies that the object is in AC114. We also subtracted the 2 epochs of archival ISAAC -band imaging obtained on 20 August 2002 (coeval with the -band observations) and 17 May 2004. The subtraction does not show a significant flux change. AGNs may vary slowly on time scales of years so the -band results do not necessarily contradict the AGN hypothesis. Given all the available evidence, a variable AGN seems the most likely explanation for the transient in AC114.
| Date | Magnitude | Filter | Telescope/ |
|---|---|---|---|
| [Vega] | Instrument | ||
| 2003 02 06 | 24.09 0.20 | VLT/FOSR2 | |
| 2003-02-9/10 | 23.93 0.08 | VLT/FOSR2 | |
| 2003-02-26/27 | 23.94 0.09 | VLT/FOSR2 | |
| 2003 02 09 | 23.24 0.08 | VLT/ISAAC | |
| 2003 04 27 | 23.73 0.16 | VLT/ISAAC | |
| 2004 01/02 | VLT/ISAAC | ||
| 2003 04 12 | 23.61 0.15 | VLT/ISAAC |
5.2 The Abell 1689 transient
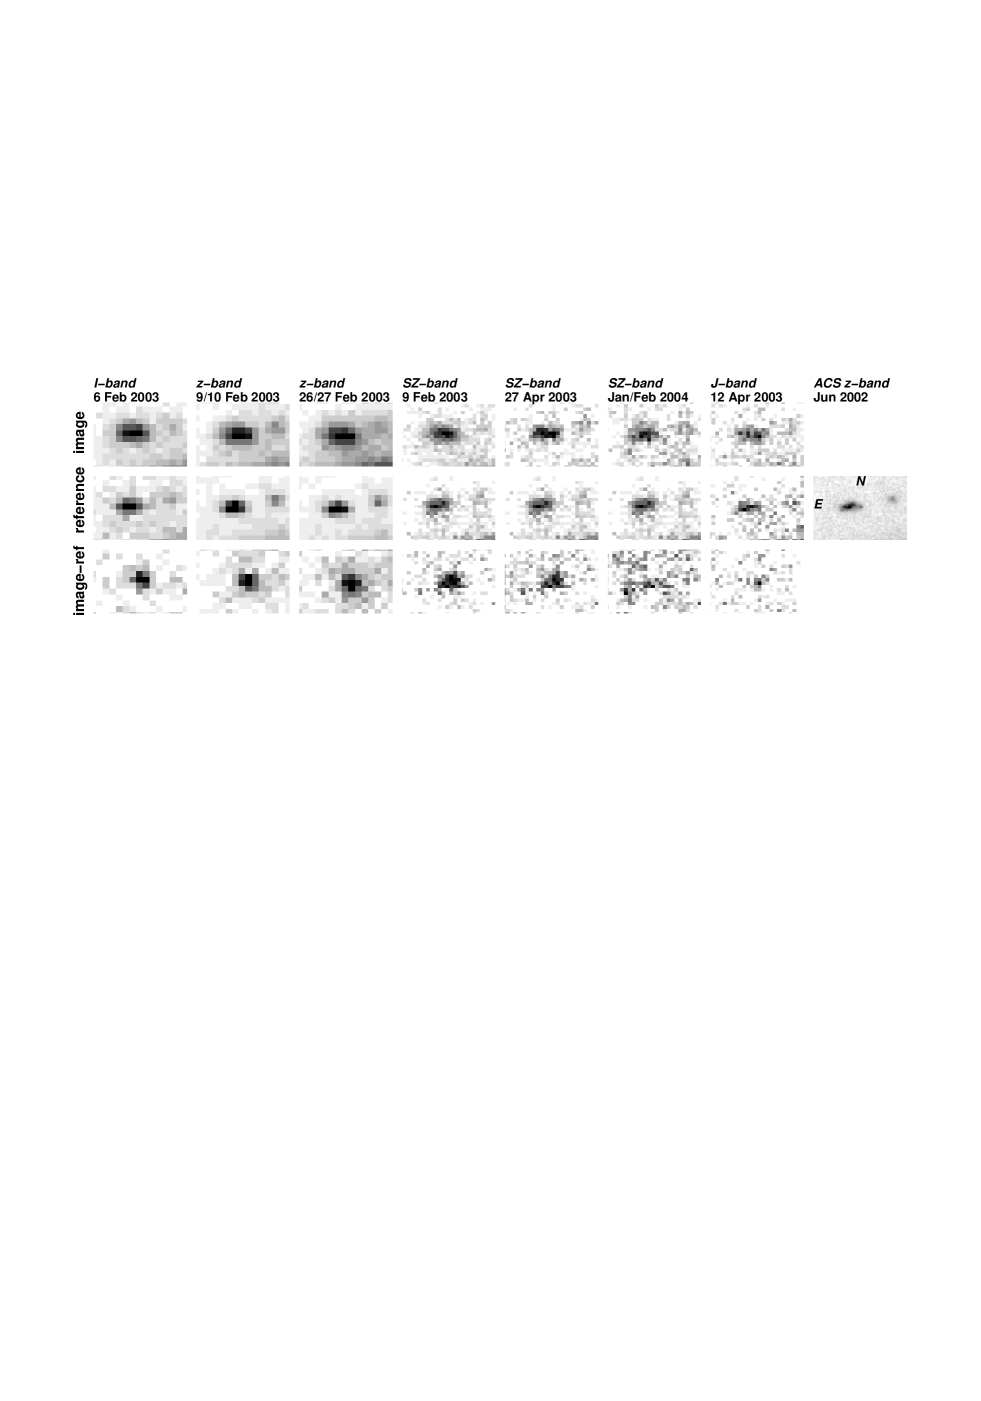
The transient in Abell 1689 was detected as a negative source in the -band subtractions that used a stack of all archival data as a reference image. The archival data were obtained in 4 runs between February 2003 and February 2004 (data under “pointing 1” in Table 1), which made it possible to build a light curve. The magnitude of the transient was on 9 February 2003. It was half a magnitude fainter on 27 April 2003 and was not detected in the combined January/February 2004 image. The 90% detection limit of the latter image is mag. However, the images with added artificial stars were examined and it was noticed that if the object location is known, objects down to 24.3–24.4 mag could be detected visually.
Abell 1689 has been observed on many occasions at the VLT, including times around the epoch at which the transient was detected. The cluster has also been observed with WFPC2 and ACS on . All these archival data made it possible to obtain four additional measurements of the magnitude of the transient in three bands – Bessell , Gunn , and the NIR band. The instrumental magnitudes of the transient were measured on reference-subtracted images with the PSF fitting technique using DAOPHOT in IRAF. The uncertainties were estimated by adding artificial stars with the same magnitude as the transient and measuring their magnitudes in exactly the same way as the transient. This procedure provides a more reliable error estimate than the formal output of DAOPHOT because the noise in the reference-subtracted images is correlated. As a by-product, we also obtain the accuracy with which the positions of artificial stars could be recovered, which we take as a measurement of the accuracy of the measured position of the transient. The magnitudes of the transient are listed in Table 2, and Table 3 lists details of the observations used. Stamps of the images where the transient was present, the references, and the difference between them are shown in Fig. 3. Also shown are the non-detection in the -band observations during January/February 2004 and the stamp from the ACS -band image.
The FORS2 -band observations were obtained in February, June, and July 2003 and in 2001. The deep April 2001 images served as a reference. The magnitude of the transient could only be measured in the February 2003 data and the rest were too shallow for the transient to be detected. The FORS2 Gunn observations were taken on 9, 10, 26, and 27 February 2003, but to increase the S/N, the images for 9, 10 and 26, 27 were combined. The -band image (obtained on 16 June 2002) was used as a reference and yielded very clean subtractions. For both epochs we measured the transient at about the same brightness of mag. The constant brightness of the transient could be further verified by subtracting the two FORS2 -images, which left no noticeable residuals.
The photometric calibration of the FORS2 -band data was obtained with Landolt (1992) standards observed during the same night. The night was photometric, but as a consistency check, we analyzed large number of additional FORS1/2 -band observations of Abell 1689 obtained during 2001 and 2003, most of which were acquisition images for spectroscopic observations. Most of the nights were photometric, and Landolt (1992) standards were also observed. We used them to calibrate a number of faint stars in the field assuming 0.04 mag per airmass atmospheric extinction in . The typical RMS of the calibrated stars was mag, confirming that the nights, including 6 February 2003, were photometric.
The calibration of the FORS2 Gunn observations was obtained through the primary white dwarf standard star GD 153 observed on the photometric night of 10 February 2003, immediately after the observations of Abell 1689666Stars with calibrated magnitudes from Hamuy et al. (2001) were also observed but were all saturated.. We used the synthetic magnitudes of GD 153 from Holberg & Bergeron (2006), together with the relation between the Landolt and the Gunn magnitudes derived by Krisciunas et al. (2004), to compute the band magnitude of GD 153, finding . Most of the uncertainty comes from the RMS around the relation of Krisciunas et al. (2004). We then computed the band magnitudes of the stars that were used to cross-check the band photometry. We assumed 0.04 magnitudes of extinction per airmass for the z-band. These stars were then used to calibrate the photometry of the transient in the combined 9-10 and 26-27 February 2003 images.
The single -band observation was obtained on 12 April 2004. As a reference, we used a -band image from VLT/HAWK-I that was obtained as part of our new program to search for SNe behind Abell 1689 (a sequel to the pilot ISAAC search we present here). ISAAC -band data from April and May 2003 were also available, but were too shallow to detect the transient.
The coordinates of the transient were inferred from astrometric solution using coordinates of the field objects from the Sloan Digital Sky Survey Data Release 6. The average of the six measured positions is 28170 (0.002) and °19′25128 (0.012), where the uncertainties are the standard deviation of the mean.
6 Discussion
| Date | Exposure | Seeing | Note |
|---|---|---|---|
| [min] | [arcsec] | ||
| VLT/ISAAC -band | |||
| 2003 02 09a | 159 | 0.52 | transient |
| 2003 04 27 | 43 | 0.43 | transient |
| 2004 01/02 | 86 | 0.55 | non-detection |
| VLT/ISAAC -band | |||
| 2003 04 12 | 132 | 0.47 | transient |
| VLT/FORS2 -band | |||
| 2003 02 06 | 36 | 0.66 | transient |
| VLT/FORS2 -band | |||
| 2003 02 09/10 | 256 | 0.60 | transient |
| 2003 02 26/27 | 324 | 0.70 | transient |
a – average of observations obtained on 5,11 and 15 February.
The search yielded two transient objects, one in the field of AC114 and one in Abell 1689. The transient in AC114 is very likely a variable AGN at the cluster redshift. Below we argue that the transient in Abell 1689 was probably a Type IIP SN at redshift and that other alternatives, including a supernova at the cluster redshift, are unlikely.
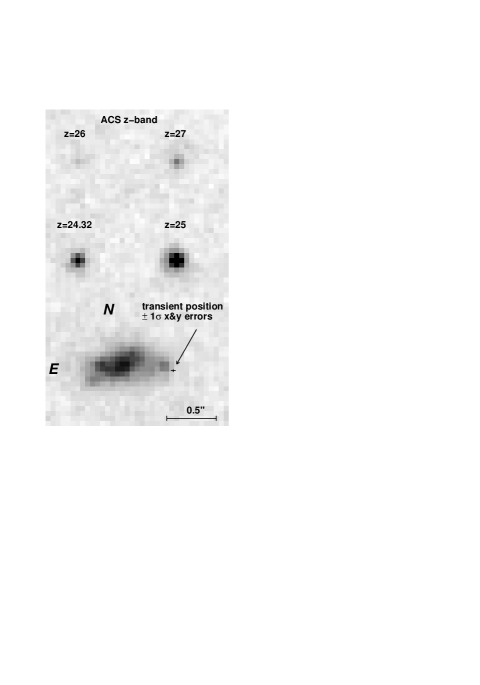
Figure 4 shows a zoom of the deep -band image (16600 s total exposure time; the other coeval deep F475W, F625W and F775W images show the same galaxy morphology) centered on the region near the position of the transient behind Abell 1689. Four artificial stars with magnitudes 24.32 (the transient magnitude on the ground based images), 25, 26, and 27 mag were also added to demonstrate the image depth. The uncertainty of the position of the transient, the standard deviation of the mean, was estimated from the coordinate transformations between the images where the transient was detected and the image. This uncertainty is pixels (1 pixel = 0.05″), which is consistent with the uncertainties of the individual position measurements pixels as computed by adding in quadrature the uncertainty of the positions of the transient as estimated from the recovered artificial stars, and the uncertainty of the coordinate transformations to the image.
The transient was not detected in the deep June 2002 images to a limiting magnitude , but a long blazar outbursts with an amplitude mag could, in principle, offer an alternative explanation of the transient. The synthetic , , and color indices of the QSO template of Glikman et al. (2006) match those of the transient, if the template is moderately reddened with and redshifted to . Some blazars do show repeated large-amplitude outbursts on a time scale of months to a few years, but most show variability with amplitude mag. However, the archival images taken in June 1996, June 1997, and April 2007 (the lattest coeval with our new ISAAC data), the deep 2001 VLT, and 2002 observations do not show any object at the position of the transient. Furthermore, the closest galaxy has an irregular shape, but the position of the transient is ″away from its center and does not coincide with any of the outer spots. Along with the non-detection of any X-ray source close to the transient position (Martini et al., 2006), the variable AGN hypothesis seems quite unlilkely.
A galactic origin for the transient is also unlikely. Any plausible candidate would be either bright enough to be detected in the deep ACS images (e.g. novae) or would have faded away faster than the transient (e.g. flaring late type stars). For example, WZ Sge-type dwarf novae are faint in quiescence, mag (Harrison et al., 2004), and may not be detected in the deep ACS image if farther away than 12-13 kpc. WZ Sge stars show large amplitude outbursts (up to mag), which may bring them above the detection limit. However, the duration of the outbursts is typically less that 80 days and the brightness decreases faster than observed in the Abell 1689 transient. Additional arguments against this scenario are the observed red colors of the transient and its magnitude. Dwarf novae at outburst have blue colors in contrast to the observed red colors of the transient. The absolute magnitude of WZ Sge at outburst maximum is (Harrison et al., 2004; Howell et al., 2004) and the observed would imply a distance of about 70 kpc, which is unlikely.
The slow decline of the light curve suggests a Type IIP supernova. The interaction of the expanding ejecta with circumstellar material in Type IIn or possibly in other SNe types (e.g. SNe 2002ic and 2005gj, Hamuy et al., 2003; Aldering et al., 2006) may also lead to slow luminosity decline. A Type Ia SN at a few months after maximum should also be considered as a possible candidate for the observed transient possibility. The brightness of prompt optical emission of gamma ray bursts typically declines much faster than the transient in Abell 1689 and the most plausible conclusion is that the transient was a supernova.
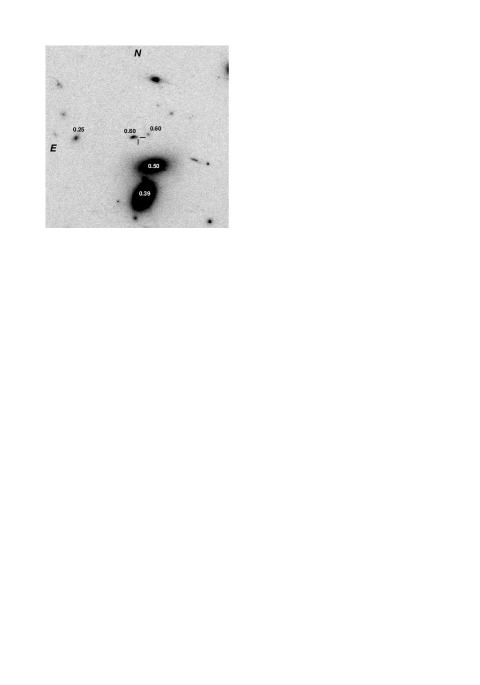
Figure 5 displays a 2020″region centered on the transient. At the cluster redshift, this corresponds to 6060 kpc. None of the galaxies close to the transient have spectroscopic redshifts. The photometric redshift of the closest galaxy based on -to--band photometry (for details see Paper II, ) is . The best-fitting template is based on single starburst evolved by 50 Myr and only slightly reddened. The other possible host galaxies, the faint objects right of the transient, and the two bright ellipticals have photometric redshifts between 0.4 and 0.6. Therefore core-collapse SN in a cluster or foreground galaxy is unlikely. Intercluster, hostless SN Ia at about 80-100 days past maximum light could match the observed brightness of the transient. However, the late-time ( days past maximum) brightness of SNe Ia typically declines by mag per 100 days and even faster between 70 and 150 days. Thus the transient should have declined by about 1 mag over the 77 days between the two observations, which is twice more than observed. Thus, we find it quite unlikely that the transient could be a supernova at the cluster redshift.
To further investigate the nature of the transient we fitted its measured magnitudes with several templates based on the well-observed Type IIP SNe 2004et (Sahu et al., 2006), 1999em (Hamuy et al., 2001; Krisciunas et al., 2009), 2003hn (Krisciunas et al., 2009), and 2001cy (Poznanski et al., 2009). The SNe were carefully selected to sample all light curve morphologies of Type IIP SNe. We also used 2005gj (Prieto et al., 2007), which had a slow decline in brightness after maximum light because of interaction with the circumstellar medium. The three SNe with NIR photometry (2003hn, 1999em, and 2005gj) also allowed us to test redshifts below 0.4. Because only 1999em have (few early) NIR spectra, the NIR magnitudes of these SNe were fitted with a cubic spline and the resulting fits were used to compute the cross-filter -corrections (Kim et al., 1996).
The templates were used to perform lightcurve fits on a grid of redshifts and reddening parameters. Since we only have six measurements, we tried three fixed values of and only allowed to vary, along with 3 other lightcurve parameters: redshift, time of maximum, and peak magnitude. The best fit, shown in Fig. 6, was obtained with the template based on SN 2001cy redshifted to and reddened by non-standard dust in the host galaxy with and . It should be noted that the uncertainty of the redshift estimated from the light curve fit is the formal error from the fit and may be somewhat underestimated. The lower panel of Fig. 6 show the as a function of the redshift for the three best-fitting templates, all for , as well as SN 2001cy for the standard Milky Way . It is interesting to note that the best fits were obtained for low and redshift around 0.6 and that lower redshifts result in much poorer fits. SNe 1999em and 2004et do not fit the data well because their and brightness are either constant or increases on the plateau phases, while the transient magnitude decreases.
The low best-fit value of deserves special comment. Recent studies of individual nearby SNe Ia and statistical analysis of large samples of SNe Ia (e.g., Elias-Rosa et al., 2006, 2008; Astier et al., 2006; Nobili & Goobar, 2008) and now also for Type IIP SNe (Poznanski et al., 2009; Olivares, 2008) find that dust in SN host galaxies has significantly lower than the average Milky Way value of . It is possible that the dust that obscured the transient had properties corresponding to low , possibly as a result of multiple scattering by circumstellar dust clouds (Goobar, 2008). It should be noted that in the fitting process, we used the Milky Way extinction law parametrization by Fitzpatrick (1999), which was derived using observations of stars obscured by dust with between 2.3 and 5.3777The other widely used parametrization of Cardelli et al. (1989) was obtained with stars obscured by dust with between 2.75 and 5.3. Any use of this parametrization to compute the extinction laws for thus involves extrapolation, which may be inaccurate, especially if . A more reliable approach may be to use a physical model of the interstellar dust (Weingartner & Draine, 2001), but this is beyond the scope of this paper.
To estimate the absolute magnitude of the transient, we correct the peak magnitude that we estimated from the light curve fit for the dust extinction and gravitational magnification of the cluster. For this we used the accurate parametric mass distribution model of Abell 1689 from Limousin et al. (2007). The model is based on strong lensing analysis and uses 34 multiply imaged systems, 24 of them with newly determined spectroscopic redshifts. As discussed by Limousin et al. (2007), the large number of constraints used to derive the mass model make Abell 1689 the most reliably reconstructed cluster to date. For more details on the mass model of Abell 1689 see Limousin et al. (2007).
The cluster magnification at the position of the transient for redshift is 1.36 mag, where the uncertainty is estimated from the uncertainties of the mass model. For redshift and , the magnifications are 1.13 and 1.60, respectively. The uncertainty from the mass model is much smaller than the uncertainty stemming from the photometric redshift estimation and we adopt a magnification of 1.4 mag to estimate the absolute magnitude of the transient. Taking the dust extinction into account, we find absolute magnitude of the transient , which is normal for a Type IIP SN (e.g., Richardson et al., 2002). The transient redshift inferred from the template fit matches the photometric redshift of the nearest galaxy very well, which is the most likely host of the SN. With its young stellar population inferred from the best photometric redshift fitting galaxy template and the irregular morphology, this galaxy is likely to produce core-collapse SNe.

7 Conclusions
We have presented the first dedicated rolling search for gravitationally magnified SNe behind galaxy clusters. The search was conducted in the near infrared wavelengths using the ISAAC instrument at the VLT. The massive galaxy clusters Abell 1689, Abell 1835 and AC114 were observed for a total of 20 hours, split into individual epochs of 2 hours exposure time each separated by approximately one month. Image subtraction was used to search for transient objects with light curves consistent with supernovae. The analysis of the combined data set of new observations, plus 20 more hours of archival data, yielded the detection of two transient objects, both found in archival images of Abell 1689 and AC114. The transient in AC114 coincides with an X-ray source and is probably a variable AGN at the cluster redshift. The transient in Abell 1689 was found with an magnitude of 23.24 and ″away from a galaxy with photometric redshift . The light curves and the colors of the transient are consistent with it being a reddened Type IIP supernova at redshift . The lensing model of Abell 1689 predicts 1.4 mag of magnification at the position of the transient, making it the most magnified supernova ever found and only the second supernova found behind a galaxy cluster. Without the magnification, this SN would not have been detected in our NIR search.
The limiting magnitude of the individual epochs was estimated by adding artificial stars to the subtracted images. Most of the epochs reach 90% detection efficiency at mag (Vega). The detailed analysis presented in the accompanying Paper II indicates that our survey should have detected between 0.8 and 1.6 SNe with the peak probability corresponding to Type IIP SNe at a redshift of . It is encouraging that this is what we actually found.
Our pilot survey has demonstrated the feasibility to find distant SNe gravitationally magnified by massive galaxy clusters. The survey reached a detection threshold of mag. A deeper survey of several clusters with an NIR camera with a larger field-of-view should yield an order of magnitude increase in the number of detected SNe, a significant fraction of which will be at redshifts (Paper II).
Acknowledgements.
VS acknowledges financial support from the Fundação para a Ciência e a Tecnologia. AG, VS and SN acknowledge support from the Gustafsson foundation. KP gratefully acknowledges support from the Wenner- Gren Foundation. AG and EM acknowledge financial support from the Swedish Research Council. JPK thanks CNRS for support, as well as the French-Israeli council for Research, Science and Technology Cooperation. We thank Dovi Poznanski for providing us the data for SN 2001cy.References
- Alard (2000) Alard, C. 2000, A&AS, 144, 363
- Alard & Lupton (1998) Alard, C. & Lupton, R. H. 1998, ApJ, 503, 325
- Aldering et al. (2006) Aldering, G., Antilogus, P., Bailey, S., et al. 2006, ApJ, 650, 510
- Astier et al. (2006) Astier, P., Guy, J., Regnault, N., et al. 2006, A&A, 447, 31
- Bertin & Arnouts (1996) Bertin, E. & Arnouts, S. 1996, A&AS, 117, 393
- Bohlin (2007) Bohlin, R. C. 2007, in Astronomical Society of the Pacific Conference Series, Vol. 364, The Future of Photometric, Spectrophotometric and Polarimetric Standardization, ed. C. Sterken, 315–+
- Broadhurst et al. (2005) Broadhurst, T., Benítez, N., Coe, D., et al. 2005, ApJ, 621, 53
- Cardelli et al. (1989) Cardelli, J. A., Clayton, G. C., & Mathis, J. S. 1989, ApJ, 345, 245
- Dahlen et al. (2008) Dahlen, T., Strolger, L.-G., & Riess, A. G. 2008, ApJ, 681, 462
- Dahlen et al. (2004) Dahlen, T., Strolger, L.-G., Riess, A. G., et al. 2004, ApJ, 613, 189
- Elias-Rosa et al. (2006) Elias-Rosa, N., Benetti, S., Cappellaro, E., et al. 2006, MNRAS, 369, 1880
- Elias-Rosa et al. (2008) Elias-Rosa, N., Benetti, S., Turatto, M., et al. 2008, MNRAS, 384, 107
- Ellis et al. (2001) Ellis, R., Santos, M. R., Kneib, J.-P., & Kuijken, K. 2001, ApJ, 560, L119
- Fitzpatrick (1999) Fitzpatrick, E. L. 1999, PASP, 111, 63
- Franx et al. (1997) Franx, M., Illingworth, G. D., Kelson, D. D., van Dokkum, P. G., & Tran, K.-V. 1997, ApJ, 486, L75+
- Gal-Yam et al. (2002) Gal-Yam, A., Maoz, D., & Sharon, K. 2002, MNRAS, 332, 37
- Glikman et al. (2006) Glikman, E., Helfand, D. J., & White, R. L. 2006, ApJ, 640, 579
- Goobar (2008) Goobar, A. 2008, ApJ, 686, L103
- Goobar et al. (2002) Goobar, A., Mörtsell, E., Amanullah, R., & Nugent, P. 2002, A&A, 393, 25
- Goobar et al. (2009) Goobar, A., Paech, K., Stanishev, V., et al. 2009, A&A, in press, (paper II; arXiv:0810.4932)
- Gunnarsson & Goobar (2003) Gunnarsson, C. & Goobar, A. 2003, A&A, 405, 859
- Hamuy et al. (2003) Hamuy, M., Phillips, M. M., Suntzeff, N. B., et al. 2003, Nature, 424, 651
- Hamuy & Pinto (2002) Hamuy, M. & Pinto, P. A. 2002, ApJ, 566, L63
- Hamuy et al. (2001) Hamuy, M., Pinto, P. A., Maza, J., et al. 2001, ApJ, 558, 615
- Harrison et al. (2004) Harrison, T. E., Johnson, J. J., McArthur, B. E., et al. 2004, AJ, 127, 460
- Hawarden et al. (2001) Hawarden, T. G., Leggett, S. K., Letawsky, M. B., Ballantyne, D. R., & Casali, M. M. 2001, MNRAS, 325, 563
- Holberg & Bergeron (2006) Holberg, J. B. & Bergeron, P. 2006, AJ, 132, 1221
- Howell et al. (2004) Howell, S. B., Henden, A. A., Landolt, A. U., & Dain, C. 2004, PASP, 116, 527
- Hu et al. (2002) Hu, E. M., Cowie, L. L., McMahon, R. G., et al. 2002, ApJ, 568, L75
- Kim et al. (1996) Kim, A., Goobar, A., & Perlmutter, S. 1996, PASP, 108, 190
- Kneib et al. (2004) Kneib, J.-P., Ellis, R. S., Santos, M. R., & Richard, J. 2004, ApJ, 607, 697
- Kneib et al. (1996) Kneib, J.-P., Ellis, R. S., Smail, I., Couch, W. J., & Sharples, R. M. 1996, ApJ, 471, 643
- Kobayashi & Nomoto (2008) Kobayashi, C. & Nomoto, K. 2008, ApJ, submitted, (arXiv:0801.0215)
- Kobayashi et al. (1998) Kobayashi, C., Tsujimoto, T., Nomoto, K., Hachisu, I., & Kato, M. 1998, ApJ, 503, L155+
- Kolatt & Bartelmann (1998) Kolatt, T. S. & Bartelmann, M. 1998, MNRAS, 296, 763
- Kovner & Paczynski (1988) Kovner, I. & Paczynski, B. 1988, ApJ, 335, L9
- Krisciunas et al. (2009) Krisciunas, K., Hamuy, M., Suntzeff, N. B., et al. 2009, AJ, 137, 34
- Krisciunas et al. (2004) Krisciunas, K., Phillips, M. M., Suntzeff, N. B., et al. 2004, AJ, 127, 1664
- Landolt (1992) Landolt, A. U. 1992, AJ, 104, 340
- Limousin et al. (2007) Limousin, M., Richard, J., Jullo, E., et al. 2007, ApJ, 668, 643
- Mannucci et al. (2007) Mannucci, F., Della Valle, M., & Panagia, N. 2007, MNRAS, 377, 1229
- Mannucci et al. (2005) Mannucci, F., della Valle, M., Panagia, N., et al. 2005, A&A, 433, 807
- Martini et al. (2006) Martini, P., Kelson, D. D., Kim, E., Mulchaey, J. S., & Athey, A. A. 2006, ApJ, 644, 116
- Moorwood et al. (1998) Moorwood, A., Cuby, J.-G., Biereichel, P., et al. 1998, The Messenger, 94, 7
- Mörtsell et al. (2005) Mörtsell, E., Dahle, H., & Hannestad, S. 2005, ApJ, 619, 733
- Neill et al. (2006) Neill, J. D., Sullivan, M., Balam, D., et al. 2006, AJ, 132, 1126
- Nobili & Goobar (2008) Nobili, S. & Goobar, A. 2008, A&A, 487, 19
- Nugent et al. (2006) Nugent, P., Sullivan, M., Ellis, R., et al. 2006, ApJ, 645, 841
- Olivares (2008) Olivares, F. 2008, ArXiv e-prints, M.Sci. Thesis, (arXiv:0810.5518)
- Persson et al. (1998) Persson, S. E., Murphy, D. C., Krzeminski, W., Roth, M., & Rieke, M. J. 1998, AJ, 116, 2475
- Pickles (1998) Pickles, A. J. 1998, PASP, 110, 863
- Poznanski et al. (2009) Poznanski, D., Butler, N., Filippenko, A. V., et al. 2009, ApJ, 694, 1067
- Prieto et al. (2007) Prieto, J. L., Garnavich, P. M., Phillips, M. M., et al. 2007, ArXiv e-prints, submitted to AJ, (ArXiv: 0706.4088)
- Refsdal (1964) Refsdal, S. 1964, MNRAS, 128, 307
- Richard et al. (2006) Richard, J., Pelló, R., Schaerer, D., Le Borgne, J.-F., & Kneib, J.-P. 2006, A&A, 456, 861
- Richard et al. (2008) Richard, J., Stark, D. P., Ellis, R. S., et al. 2008, ApJ, 685, 705
- Richardson et al. (2002) Richardson, D., Branch, D., Casebeer, D., et al. 2002, AJ, 123, 745
- Sahu et al. (2006) Sahu, D. K., Anupama, G. C., Srividya, S., & Muneer, S. 2006, MNRAS, 372, 1315
- Saini et al. (2000) Saini, T. D., Raychaudhury, S., & Shchekinov, Y. A. 2000, A&A, 363, 349
- Scannapieco & Bildsten (2005) Scannapieco, E. & Bildsten, L. 2005, ApJ, 629, L85
- Strolger et al. (2004) Strolger, L.-G., Riess, A. G., Dahlen, T., et al. 2004, ApJ, 613, 200
- Sullivan et al. (2000) Sullivan, M., Ellis, R., Nugent, P., Smail, I., & Madau, P. 2000, MNRAS, 319, 549
- Sullivan et al. (2006) Sullivan, M., Le Borgne, D., Pritchet, C. J., et al. 2006, ApJ, 648, 868
- Weingartner & Draine (2001) Weingartner, J. C. & Draine, B. T. 2001, ApJ, 548, 296