Gas Dynamics and Star Formation
in the Galaxy Pair NGC 1512/1510††thanks:
The observations were obtained with the Australia Telescope which is
funded by the Commonwealth of Australia for operations as a National
Facility managed by CSIRO.
Abstract
Here we present H i line and 20-cm radio continuum data of the nearby galaxy pair NGC 1512/1510 as obtained with the Australia Telescope Compact Array (ATCA). These are complemented by GALEX -, SINGG H- and Spitzer mid-infrared images, allowing us to compare the distribution and kinematics of the neutral atomic gas with the locations and ages of the stellar clusters within the system.
For the barred, double-ring galaxy NGC 1512 we find a very large H i disk, 4 its optical diameter, with two pronounced spiral/tidal arms. Both its gas distribution and the distribution of the star-forming regions are affected by gravitational interaction with the neighbouring blue compact dwarf galaxy NGC 1510. While the inner disk of NGC 1512 shows quite regular rotation, deviations are visible along the outer arms and at the position of NGC 1510. From the H i rotation curve of NGC 1512 we estimate a dynamical mass of M⊙, compared to an H i mass of = M⊙ (2% ).
The two most distant H i clumps, at radii of 80 kpc, show signs of star formation and are likely tidal dwarf galaxies (TDGs). Both lie along an extrapolation of the eastern-most H i arm, with the most compact H i cloud located at the tip of the arm.
The 20-cm radio continuum map indicates extended star formation activity not only in the central regions of both galaxies but also in between them. Star formation (SF) in the outer disk of NGC 1512 is revealed by deep optical- and two-color ultraviolet images. Using the latter we determine the properties of 200 stellar clusters and explore their correlation with dense H i clumps in the even larger 2XH i disk. Outside the inner star-forming ring of NGC 1512, which must contain a large reservoir of molecular gas, H i turns out to be an excellent tracer of SF activity.
The multi-wavelength analysis of the NGC 1512/1510 system, which is probably in the first stages of a minor merger having started 400 Myr ago, links stellar and gaseous galaxy properties on scales from one to 100 kpc.
keywords:
galaxies: individual (NGC 1512, NGC 1510), interaction, tidal dwarf galaxies, star formation, stellar ages1 Introduction
The Local Volume (LV), generally considered as the sphere of radius 10 Mpc centred on the Local Group, contains more than 500 galaxies. For the majority of these galaxies reliable distances are currently available (Karachentsev et al. 2004, 2008). Independent distances, such as those obtained from the luminosity of Cepheids, the tip of the red giant branch (TRGB), and surface brightness fluctuations (SBF) are an essential ingredient, together with accurate velocities and detailed multi-wavelength studies of each LV galaxy, for the assembly of a dynamic 3D view of the Local Universe. This, in turn, leads to a better understanding of the local flow field, the local mass density and the local star-formation density. Interferometric H i measurements, in particular, provide insight into the overall matter distribution (baryonic and non-baryonic) in the Local Volume.
The galaxy pair NGC 1512/1510 is located in the outskirts of the Local Volume and its study forms part of the ‘Local Volume H i Survey’ (LVHIS; Koribalski et al. 2008). Since no TRGB distance is currently available for NGC 1512, we use its Local Group velocity, = 712 km s-1, to compute a Hubble distance of 9.5 Mpc. — LVHIS is a large project111LVHIS project: www.atnf.csiro.au/research/LVHIS that aims to provide detailed H i distributions, velocity fields and star formation rates for a complete sample of nearby, gas-rich galaxies. With the Australia Telescope Compact Array (ATCA), we observed all LV galaxies that were detected in the H i Parkes All-Sky Survey (HIPASS; Barnes et al. 2001, Koribalski et al. 2004) and reside south of approx. –30° declination.
The closest neighbours to the NGC 1512/1510 system are (1) the edge-on spiral galaxy NGC 1495 (HIPASS J0358–44), (2) the galaxy pair NGC 1487 (HIPASS J0355–42) and (3) the galaxy ESO249-G026 (HIPASS J0354–43), all located at projected distances of more than 15. Within 3° (0.5 Mpc) we find 15 neighbours, suggesting that the NGC 1512/1510 system is part of a loose (spiral) galaxy group (LGG 108; Garcia 1993).
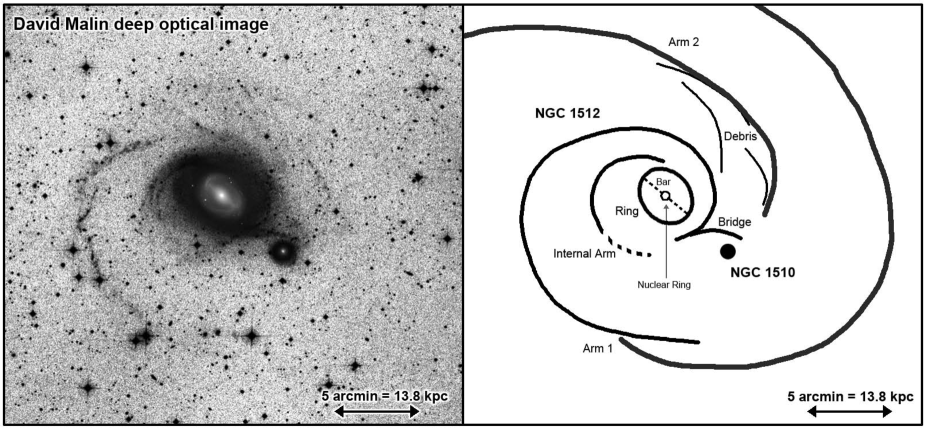
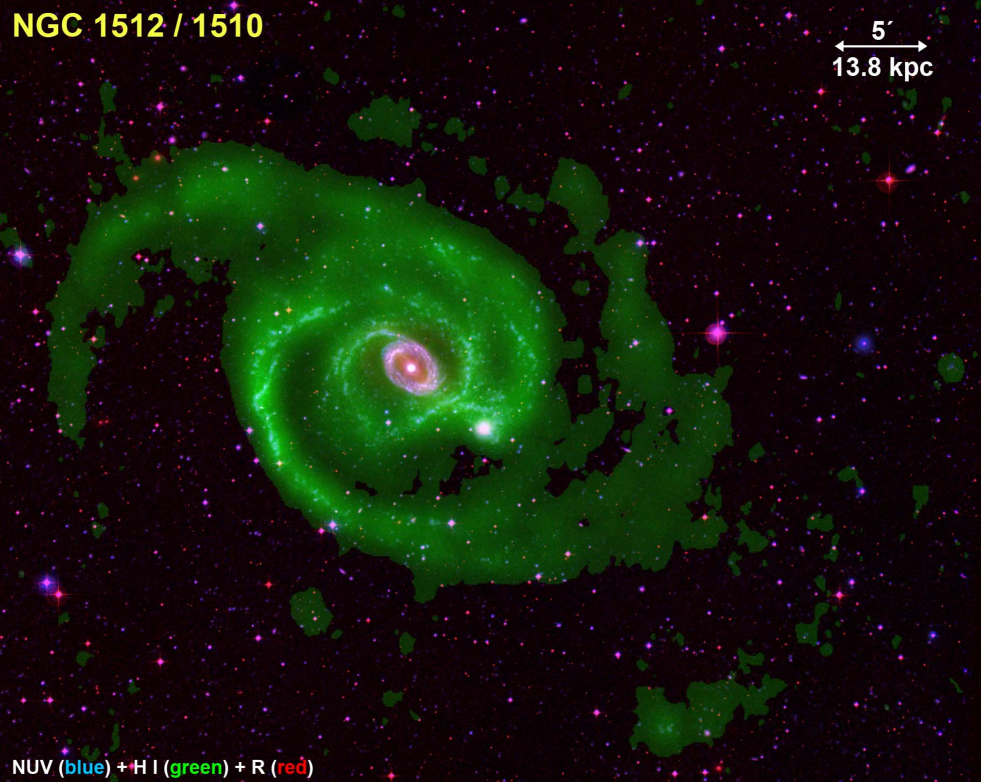
The barred galaxy NGC 1512 and the blue compact dwarf (BCD) galaxy NGC 1510 are an interacting galaxy pair, separated by only 5′ (13.8 kpc). At the adopted distance of 9.5 Mpc, 1′ corresponds to 2.76 kpc. Table 1 gives some basic properties of both galaxies.
| NGC 1512 | NGC 1510 | Ref. | |
| HIPASS J0403–43 | |||
| center position | (1) | ||
| (J2000) | –43° 21′ 03″ | –43° 24′ 01″ | |
| 2487, –482 | 2488, –482 | (1) | |
| [km s-1] | (2,1) | ||
| type | SB(r)ab | SA0 pec, BCD | (1) |
| optical diameter | (1) | ||
| ” (kpc2) | |||
| inclination | 51° | 57° | (1) |
| position angle | 90° | 90° | (1) |
| AB [mag] | 0.046 | 0.046 | (3) |
| [mag] | (4) | ||
| (4) | |||
| (4) | |||
| [mag] | (4) | ||
| [109 L⊙] | (4) | ||
| [km s-1] | (5) | ||
| [km s-1] | 712 | (5) | |
| distance [Mpc] | 9.5 | (5) | |
| [km s-1] | (5) | ||
| [km s-1] | (5) | ||
| [Jy km s-1] | (5) | ||
| [109 M⊙] | (5) | ||
The optical appearances of both galaxies are well described by Hawarden et al. (1979). NGC 1512 (IRAS 04022–4329) is a large, strongly barred galaxy with two prominent star-forming rings. Its morphological type is generally given as SB(r)a or SB(r)b. The companion, NGC 1510 (IRAS 04019–4332), is a much smaller, peculiar S0 or lenticular galaxy. Their respective optical diameters are and , i.e. NGC 1512’s stellar disk is about seven times larger than that of NGC 1510.
| ATCA configuration | H168 | 210 | 375 | 750A | 1.5A | 6A | 6B |
|---|---|---|---|---|---|---|---|
| date | 8-11-05 | 6-7-00 | 23-9-96 | 6-11-96 | 20-10-96 | 5-2-97 | 14-9-96 |
| ” | 8-7-00 | 24-9-96 | |||||
| ” | 3-12-96 | ||||||
| time on-source [min.] | 450 | 318 | 489 | 653 | 606 | 283 | 633 |
| 238 | 502 | ||||||
| 305 | |||||||
| primary calibrator | PKS 1934–638 (14.95 Jy) | ||||||
| phase calibrator | PKS 0438–436 ( 4.55 Jy) | ||||||
Beautiful multi-color HST images of NGC 1512 by Maoz et al. (2001) clearly show the structure of the nuclear region (20″ 1 kpc): a bright nucleus surrounded by a smooth, dusty disk which is enveloped by a highly ordered and narrow starburst ring of diameter with a position angle () of 90°. This nuclear ring is also evident in the map by Laurikainen et al. (2006) and in the Spitzer mid-infrared images obtained as part of the SINGS project (Kennicutt et al. 2003). The dust lanes hint at a tight inner spiral structure within the nuclear disk. Fabry-Perot H observations of NGC 1512 by Buta (1988) show that the nuclear ring has a rotational velocity of 200–220 km s-1 (assuming an inclination angle of 35°). Beyond the nuclear ring, which lies within the bulge (1′ = 2.8 kpc) at the centre of the bar, appears to be roughly constant.
H images of the inner region (4′ 11 kpc) of NGC 1512 (SINGG project; Meurer et al. 2006) reveal a second star-forming ring of approximate diameter at , ie. about ten times larger than the nuclear starburst ring; its width is . This inner ring is composed of dozens of independent H ii regions with typical sizes of . The bar, which has a length of 3′ (8.3 kpc), lies roughly along its major axis. Some enhancement of the star formation is seen at both ends of the bar where the spiral arms commence.
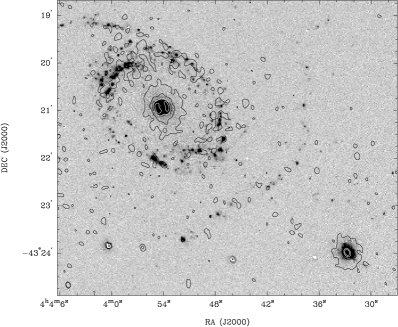
The optical data presented by Kinman (1978) and Hawarden et al. (1979) revealed, for the first time, signs of tidal interaction between NGC 1510 and NGC 1512. Sandage & Bedke (1994) describe NGC 1512 as an almost-normal SBb(r) where interaction with NGC 1510 distorts the outer thin arm pattern. The stellar spiral arms are most prominent in deep optical images (see Fig. 1) as well as the GALEX ultraviolet () images by Gil de Paz et al. (2007a), all of which give a stunning view of the star-forming regions in NGC 1512’s outer disk. A sketch identifying important stellar and H i features of the interacting system NGC 1512/1510 is provided on the right side of Fig. 1.
NGC 1510 is a low metallicity ( Z⊙) BCD galaxy (see also Section 4.6). Hawarden et al. (1979) suggested that its emission line spectrum and blue colors are the consequence of star formation activity in the material — basically H i gas — recently (300 Myr) accreted from NGC 1512, mimicing the properties of a red amorphous dwarf elliptical galaxy. This hypothesis is also supported by Eichendorf & Nieto (1984), who identified several low-metallicity star-forming regions in NGC 1510. One of them (the SW component) reveals a broad 4686 He ii line which is attributed to the presence of an important population of Wolf-Rayet (WR) stars in the burst. NGC 1510 is therefore classified as Wolf-Rayet galaxy (Conti 1991; Schaerer, Contini & Pindao 1999).
Hawarden et al. (1979) also present remarkable H i data for the galaxy pair. Their 24-pointing H i map obtained with the 64-m Parkes telescope reveals a large neutral hydrogen envelope around NGC 1512, encompassing its neighbour, NGC 1510. Koribalski et al. (2004) measure an integrated H i flux density of = Jy km s-1 for the galaxy pair, named HIPASS J0403–43 in the HIPASS Bright Galaxy Catalog (see Table 1). The detected H i emission is centered on NGC 1512 and significantly extended with respect to the Parkes gridded beam of 155. Hawarden et al. (1979) measured = Jy km s-1 (same as Reif et al. 1982), slightly lower than the HIPASS value.
Here we present high-resolution ATCA H i line and 20-cm radio continuum data of the galaxy pair NGC 1512/1510 as well as complimentary GALEX -, SINGG H- and Spitzer mid-infrared images. The paper is organised as follows: in Section 2 we summarise the observations and data reduction; in Section 3 we present the H i line and the 20-cm radio continuum results, including our discovery of two tidal dwarf galaxy candidates. The discussion in Section 4 exploits the available multi-wavelength data sets, comparing the H i gas density with the properties of star-forming regions out to radii of 80 kpc. Section 5 contains our conclusions and Section 6 a brief outlook towards H i surveys with the Australian SKA Pathfinder (ASKAP).
 |
 |
2 Observations and Data Reduction
H i line and 20-cm radio continuum observations of the galaxy pair
NGC 1512/1510 were obtained with the Australia Telescope Compact Array (ATCA)
using multiple configurations and four (overlapping) pointings. The observing
details are given in Table 2.
The first frequency band (IF1) was centered on 1415 MHz with a bandwidth of
8 MHz, divided into 512 channels. This gives a channel width of 3.3 km s-1 and
a velocity resolution of 4 km s-1. The ATCA primary beam is 336 at
1415 MHz. The second frequency band (IF2) was centered on 1384 MHz (20-cm)
with a bandwidth of 128 MHz divided into 32 channels.
The ATCA is a radio interferometer consisting of six 22-m dishes, creating
15 baselines in a single configuration, equipped with seven receiver systems
covering wavelengths from 3-mm to 20-cm. While five antennas (CA01 to CA05)
are movable along a 3-km long east-west track (and a 214-m long north-south
spur, allowing us to create hybrid arrays), one antenna (CA06) is fixed at
a distance of 3-km from the end of the track. By combining data from several
array configuration (see Table 2) we achieve excellent -coverage generated
by over 100 baselines ranging from 30-m to 6-km. Using Fourier transformation,
this allows us to make data cubes and images at a large range of angular
resolutions (up to 6″ at 20-cm) by choosing different weights for
short, medium and long baselines which in turn are sensitive to different
structure scales. The weighting of the data affects not only the resolution,
but also the rms noise and sensitivity to diffuse emission.
Data reduction was carried out with the miriad software package (Sault, Teuben & Wright 1995) using standard procedures. After calibration the IF1 data were split into a narrow band 20-cm radio continuum and an H i line data set using a first order fit to the line-free channels. H i cubes were made using ‘natural’ (na) and ‘robust’ (r=0) weighting of the uv-data in the velocity range covered by the H i emission using steps of 10 km s-1. The longest baselines to the distant antenna six (CA06) were excluded when making the low-resolution cubes. Broad-band 20-cm radio continuum images were made using ‘robust’ (r=0) and ‘uniform’ weighting of the IF2 uv-data. The data were analysed using miriad, apart from the rotation curve fit which was obtained using the gipsy software package (van der Hulst et al. 1992).
3 Results
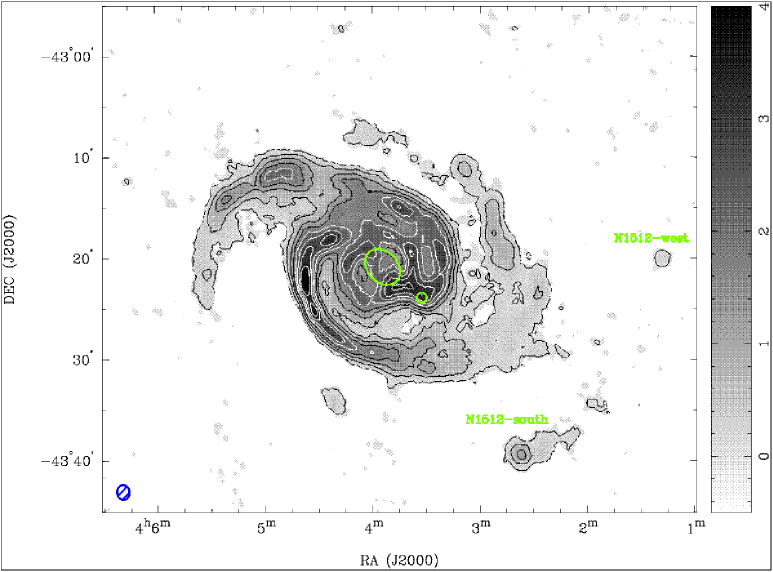
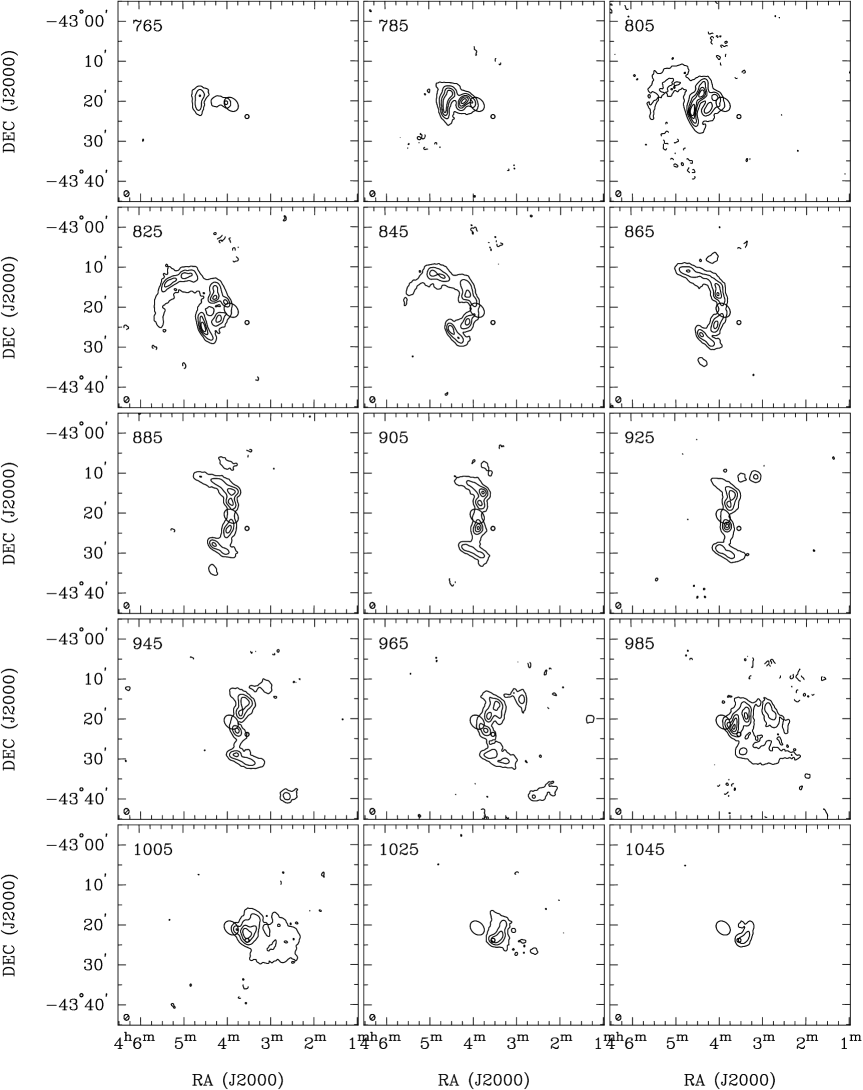
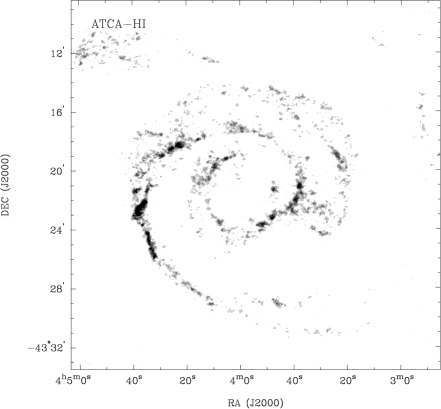
The NGC 1512/1510 galaxy pair is an impressive system. Our ATCA H i mosaic (see Figs. 2–4) shows a very extended gas distribution, spanning a diameter of 40′ (or 110 kpc). Two prominent spiral arms, which appear to wrap around 1.5 times, are among the most remarkable H i features. The brightness and width of both H i arms varies with radius: most notably, in the south, Arm 1 splits into three branches, followed by a broad region of H i debris towards the west before continuing on as a single feature towards the north. These disturbances in the outer disk of NGC 1512 are likely caused by tidal interaction with and accretion of the dwarf companion, NGC 1510.
Individual H i clouds belonging to the NGC 1512/1510 system are found out to projected radii of 30′ (83 kpc). The velocity gradient detected within the extended clumps agrees with that of the neighbouring spiral arms, suggesting that they are condensations within the outermost parts of the disk. Their H i properties and evidence for optical and counterparts are discussed in Section 3.3.
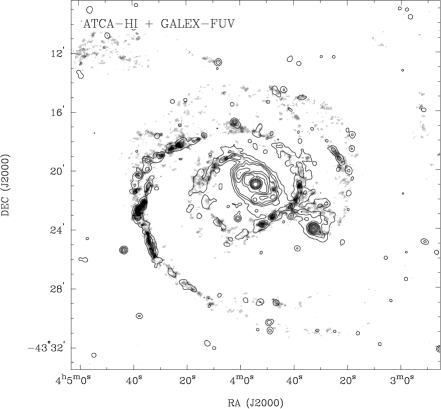
In regions of high H i column density, mostly within the arms and the bridge, star formation is most prominent. We will analyse the relation between the star formation rate and the H i column density in Section 4.3.
| NGC 1512 | |
| velocity range | 750 – 1070 km s-1 |
| 900 km s-1 | |
| inclination () | 35° |
| position angle () | 260° |
| 150–200 km s-1 | |
| H i flux density () | 268 Jy km s-1 |
| H i diameter | |
| H i/opt. diameter ratio | 4 |
| H i mass () | M⊙ |
| dynamical mass () | M⊙ |
| / | 1 |
| / | 50 |
| / | 0.02 |

3.1 H i in NGC 1512
The H i emission from the galaxy NGC 1512 covers a velocity range from about 750 to 1070 km s-1. We measure an integrated H i flux density of = 268 Jy km s-1, which agrees very well with the HIPASS reported by Koribalski et al. (2004; see Table 1). This agreement indicates that very little diffuse H i emission has been filtered out by the interferometric observation. Adopting a distance of 9.5 Mpc, the H i flux density corresponds to an H i mass of M⊙. The majority of the detected neutral gas clearly belongs to NGC 1512; this is evident from the center and symmetry of the gas distribution and the gas kinematics. The H i extent of NGC 1512 is at least a factor four larger than its optical size. The H i mass to blue luminosity ratio is 1. See Table 3 for a summary of the galaxy properties as determined from the ATCA H i data.

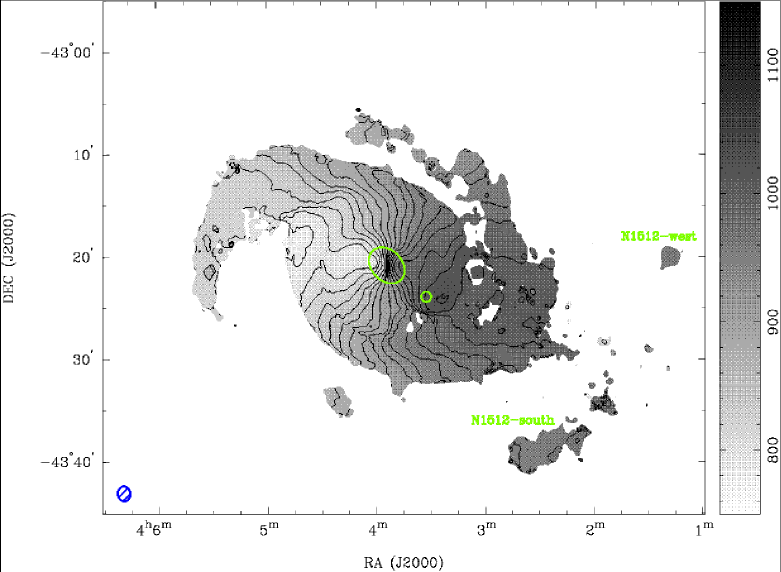
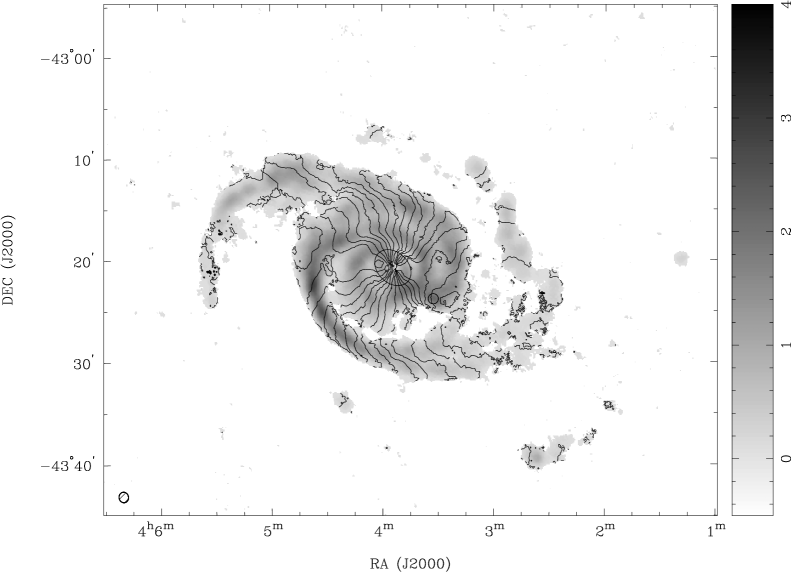
The interferometric H i data allow us to determine the gas dynamics of the system. In Fig. 4 we display the H i channel maps (smoothed to 20 km s-1 resolution) which show a relatively regular rotating inner disk of NGC 1512 and a more disturbed outer disk. Near the systemic velocity the change in the kinematics at a radius of 5′ appears particularly abrupt. The extent and kinematics of the (spiral) arm curving towards the east are spectacular, nearly matched by a broader, less well-defined arm curving towards the west. Another view of the galaxy kinematics is presented in Fig. 5 in form of a major axis position-velocity () diagram. This was obtained by summing the central 20′ along = 90° using a 3 cutoff to avoid adding excessive noise to the H i signal. It shows the line-of-sight rotation velocity of NGC 1512 as a function of radius. The observed decrease of the H i velocities beyond a radius of 8–10′, compared to the inner disk, is most likely caused by an increase in the inclination of the H i disk. This warping of the outer spiral/tidal arms – which is quite common in spiral galaxies – could be related to or potentially caused by the interaction with NGC 1510.
 |
 |
We used the gipsy program rotcur (Begeman 1987) to fit the H i rotation curve of the galaxy NGC 1512. As a first step, we tried to obtain its centre position and systemic velocity, , using five rings within the inner velocity field (). As the results did not converge, we proceeded with the GALEX peak position for NGC 1512, (J2000) = 542, –43° 20′ 565. With this centre position held fixed we find = km s-1. We might expect the kinematic centre position of the NGC 1512/1510 system to shift with radius from the core of NGC 1512 towards its interaction partner, NGC 1510 ( = 989 km s-1), now located 5′ to the southwest. Furthermore, we find the position angle, , of NGC 1512 appears reasonably constant around , while the inclination angle, , varies significantly. With the centre position, , and set to the values given above, we find the inclination angle to increase from 30° () to 46° (). The latter is consistent with the apparent change in the ellipticity (i.e. increasing major to minor axis ratio) of NGC 1512’s gas distribution with radius.
The resulting rotation curve, , is shown in Fig. 6. The maximum rotational velocities of 225 km s-1 are reached at radii between 300″ and 500″. Beyond that rapidly decreases, reaching 110 km s-1 at = 1200″ (55 kpc). The residual velocity field (see Fig. 7) shows deviations up to approximately 30 km s-1, most notably near the position of NGC 1510 and in the outer spiral/tidal arms. The inner disk also shows deviations along an eastern arc (similar to a one-armed spiral) which roughly agrees with the elongated star-forming spiral arm of NGC 1512 seen in the GALEX images. The passage of the companion would have unsettled the mass distribution, possibly causing a density wave or one-armed spiral (as seen in the residual velocity field).
We estimate a dynamical mass of about M⊙ for NGC 1512, based on a galaxy radius of = 55 kpc and a rotational velocity of = 150 km s-1. If the outer H i clouds at = 83 kpc are bound to NGC 1512, the dynamical mass increases to M⊙.
We note that the rotation velocity of NGC 1512 is comparable or higher (200 – 220 km s-1) in the nuclear ring than in the inner disk, and significantly higher than in the outer H i envelope. The to ratio indicates that 2% of the mass of NGC 1512 is in the form of H i gas. No estimate of the molecular gas mass in NGC 1512 or NGC 1510 is currently available.
 |
 |
 |
 |
 |
 |

3.2 H i in NGC 1510
NGC 1510 lies at a projected distance of 5′ (13.8 kpc) from the centre of NGC 1512. This places it well inside NGC 1512’s H i disk, which shows an enhancement of the H i column density at the position of NGC 1510. The offset in the residual velocity field of NGC 1512 (see Fig. 7) also suggests that NGC 1510 contains a small amount of H i gas and/or left the signature of its interaction with the inner disk of NGC 1512. Gallagher et al. (2005) speculate that NGC 1510 may have captured gas from NGC 1512, contributing to its enhanced SF activity. Assuming the H i distribution of NGC 1510 is unresolved in the H i maps shown here, we measure an H i flux density of 2 Jy km s-1, corresponding to an H i mass of M⊙. This estimate is very uncertain and does not account for any gas NGC 1510 may have lost during the interaction, and is likely to include some H i from the disk of NGC 1512. The estimated H i mass (if correct) is less than 1% of NGC 1512’s H i mass. The H i mass to blue luminosity ratio of NGC 1510 would be 0.07, within the range (0.02 – 0.8) observed for BCD galaxies (the average ratio is 0.3; Huchtmeier et al. 2005, 2007).
At the position of NGC 1510, the H i emission ranges from 970 to 1060 km s-1. Note that the optical systemic velocity of NGC 1510 is km s-1 (de Vaucouleurs et al. 1991, Lindblad & Jörsäter 1981), about 100 km s-1 higher than that of NGC 1512.
3.3 Tidal Dwarf Galaxy Candidates
Individual H i clouds belonging to the NGC 1512/1510 system are found out to projected radii of 30′ (83 kpc). Their velocities agree with the general rotation of the disk gas (see Figs. 2 & 4), suggesting that these clumps are condensations within the outermost parts of the disk. It is likely that they were or are embedded in a very low surface brightness disk that remains undetected in our observations.
In the following we study the three most isolated H i clouds which lie roughly along an extension of the eastern-most H i arm. The first cloud, at (J2000) = 204, –43° 34′ 167 (875 km s-1), is located only 142 (39 kpc) from the center of NGC 1512. We measure an approximate H i flux density of 0.56 Jy km s-1. No stellar counterpart is detected.
The second cloud, which is the brightest and most extended of the three H i cloud, is located at (J2000) = , –43° 39′ 32″ (H i peak position), 233 (64 kpc) from the center of NGC 1512. It has an H i peak flux of 1 Jy beam-1 and a total H i flux density 3 Jy km s-1 ( = M⊙). There is a clear velocity gradient along the cloud (940 – 970 km s-1) which agrees with the general rotation pattern of NGC 1512; its centre velocity is 950 km s-1. The deep optical image (see Fig. 8, top right) reveals the faint optical counterpart222The deep optical image of the NGC 1512/1510 system, obtained by David Malin, is partially shown in our Fig. 1 and is, in its full size (), available at www.aao.gov.au/images/deep_html/n1510_d.html .: a diffuse knot coinciding with the H i maximum, barely visible in the second-generation Digitised Sky Survey (DSS2). In addition, we find clear evidence of star formation in the GALEX and images (see also Section 4.2). Fig. 8 (top) shows the locations of the optical and ultraviolet emission with respect to the H i emission. We suggest that the core of this H i cloud (with an H i mass of km s-1) is a tidal dwarf galaxy (TDG) and refer to it as N1512-south.
The third H i cloud is located at (J2000) = , –43° 20′ 03″ (10″), 282 (78 kpc) from the center of NGC 1512. — Note that this puts it near the edge of the field well-mapped by our four overlapping ATCA pointings, and H i sensitivity is reduced; primary beam correction is tapered to avoid excessive noise. — We suggest that this compact H i cloud is a second, more evolved tidal dwarf galaxy in the NGC 1512/1510 system and refer to it as N1512-west. It has an H i flux density of at least 0.3 Jy km s-1 ( M⊙) and a centre velocity of 960 km s-1. Unfortunately, Malin’s deep optical image does not extend this far west of NGC 1512. Nevertheless, clear evidence of star formation is again found in the GALEX and images (see Fig. 8, bottom).
Both N1512-south and N1512-west are detected in the highest resolution () ATCA H i cubes. We find H i peak fluxes 10 mJy beam-1 over 15–30 km s-1. The resulting H i column densities are 1021 atoms cm-2 (or 8 M⊙ pc-2), i.e. near the local star formation threshold (e.g., Skillman 1987). H i data with higher angular & velocity resolution (and sensitivity) are needed to study the TDG candidates in more detail.
After careful calibration, we estimate colors of 0.35–0.43 mag for N1512-south (there are two distinct star forming knots within this TDG) and 0.45 mag for N1512-west (see also Section 4.2). Despite the large uncertainties (0.2 mag) in the color estimates in these areas (which are outside the published images by Gil de Paz et al. 2007a), we find that the derived average ages of the detected stellar populations within the TDGs are no younger than 150 Myr and possibly as old as 300 Myr. N1512-west appears to be slightly older (more evolved) than N1512-south which would be expected given its compactness and location at the outermost tip of the extrapolated eastern arm.
Following Braine et al. (2004) we can estimate the expected molecular gas mass (as traced by CO emission) of TDGs to be less than 30% of the H i mass, i.e. M⊙ (for N1512-west). Assuming a velocity width of 10 km s-1 (approx. half the width found in H i), a CO peak flux of 30 mK beam-1 would be expected with a typical single dish telescope.
If the star-forming H i clumps in the outskirts of the NGC 1512/1510 are indeed TDGs, we would expect to detect H emission from stars recently formed in the tidal debris. This young stellar population must exist in addition to the (on average) older population inferred from the GALEX colors.
 |
 |
 |
 |
3.4 20-cm Radio Continuum Emission
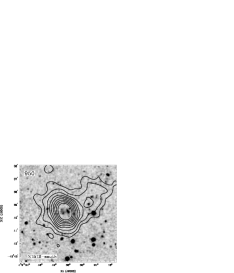
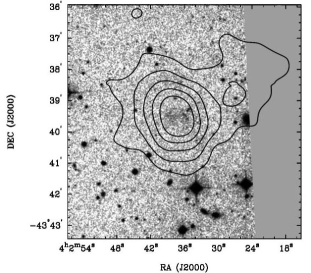
Figure 9 shows the 20-cm radio continuum emission towards the galaxy pair NGC 1512/1510 and its surroundings. Both galaxies are clearly detected. The field contains a large number of unresolved radio sources as well as a few head-tail and wide-angle tail radio galaxies (incl. PMN J040150.3–425911).
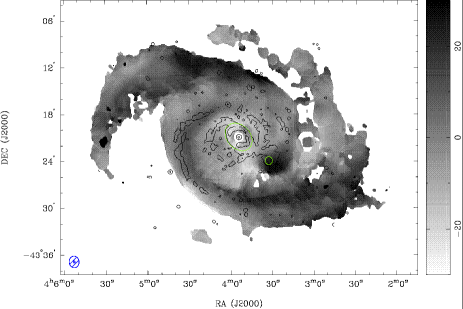
The barred spiral galaxy NGC 1512 shows extended continuum emission () and a bright core while the much smaller BCD galaxy NGC 1510 appears unresolved at 30″ resolution. The ‘fish’ shaped radio continuum emission is due to enhanced star-formation in the region between the two galaxies which corresponds to the tail of the fish. NGC 1512’s inner star-forming ring which is well defined in the optical-, H- and -images is embedded within the radio continuum emission (see Fig. 10). At high resolution, our surface brightness sensitivity is insufficient to fully map the structure of the inner ring, but NGC 1512’s nuclear ring is clearly detected as well as the extended disk of emission from NGC 1510.
To estimate the star formation rate (SFR) of a galaxy from our 20-cm data we use two approaches: (1) the formation rate of recent, high mass stars ( M⊙) is calculated using SFR [M⊙ yr-1] = (Condon et al. 2002), where is the distance in Mpc and the 20-cm radio continuum flux density in Jy. We measure = 38.8 mJy for NGC 1512 and 4.5 mJy for NGC 1510, resulting in 0.11 M⊙ yr-1 and 0.012 M⊙ yr-1, respectively. (2) In order to derive the formation rate of all stars ( M⊙) we multiply by 4.76 (see Condon et al. 2002), resulting in 0.50 M⊙ yr-1 (NGC 1512) and 0.06 M⊙ yr-1 (NGC 1510).
|
|
|---|---|
|
|
 |
|
4 Discussion
The H i diameter of the galaxy NGC 1512 is large (40′ or 110 kpc), but similar in size to the largest H i disks found in the Local Volume. For example, ATCA H i mosaics of the spiral galaxies M 83 (Koribalski et al. 2009) and Circinus (Curran et al. 2008) reveal diameters of 70′ (80 kpc) and 65′ (80 kpc), respectively. Even larger H i diameters have been found for some of the most H i-massive galaxies currently known, e.g. Malin 1 (Pickering et al. 1997), NGC 6872 (Horellou & Koribalski 2007), and HIZOA J0836–43 (Donley et al. 2006; Cluver et al. 2008). Possibly the deepest single-dish H i map recently obtained with the Arecibo multibeam system for the nearby spiral galaxy NGC 2903 also shows a very large H i envelope and a neighbouring H i cloud (Irwin et al. 2009).
A multi-wavelength study of the grand-design spiral galaxy M 83 (HIPASS J1337–29) and its neighbours — similar to the one presented here — is under way; first Parkes and ATCA H i results were presented by Koribalski (2005, 2007) and are shown on the LVHIS webpages. The H i gas dynamics of the Circinus galaxy (HIPASS J1413–65) were studied by Jones et al. (1999), using high resolution data, and more recently by Curran et al. (2008), using a low-resolution mosaic. Circinus appears to be rather isolated and is difficult to study in the optical due to its location behind the Galactic Plane.
4.1 The 2X-H i vs X-UV disk of NGC 1512
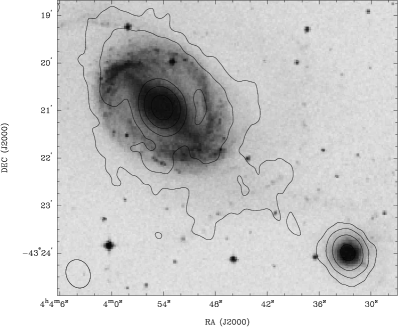
A multi-wavelength color-composite image of the NGC 1512/1510 system is shown in Fig. 11. The combination of the large-scale H i distribution with deep optical and emission maps is an excellent way to highlight the locations of star formation within the gaseous disk. NGC 1512’s H i envelope is four times larger than its optical size (see Table 1) and about twice as large as the stellar extent measured from Malin’s deep optical image and from the GALEX images.
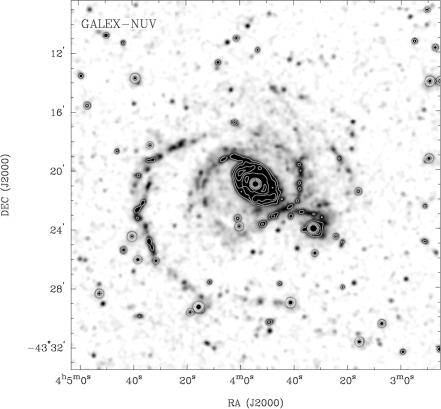
Calibrated (1350–1750Å) and (1750–2750Å) images are provided by Gil de Paz et al. (2007a) as part of the GALEX Atlas of Nearby Galaxies. The data were obtained on the 29th of December 2003, with an exposure time in both bands of 2380 seconds. The GALEX full field-of-view is 12 in diameter, and the pixel size is 15. The GALEX point-spread function in the central 05 has a FWHM of 5″.
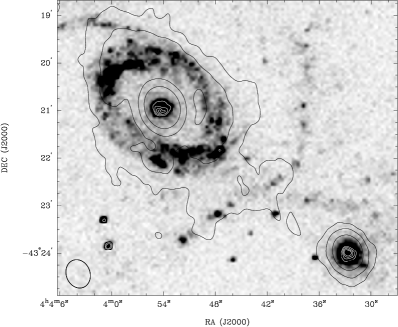
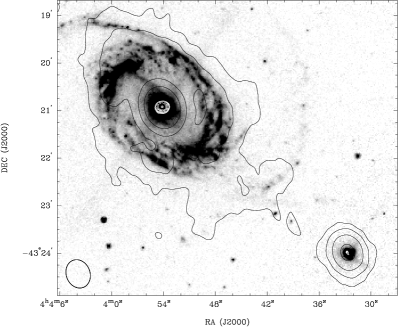
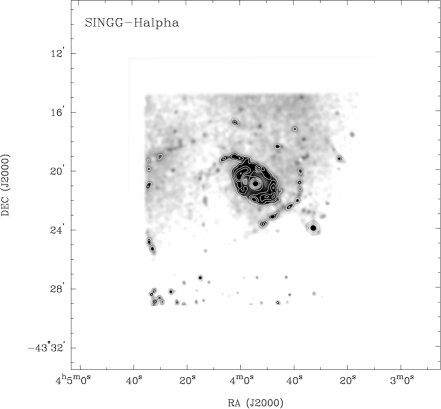
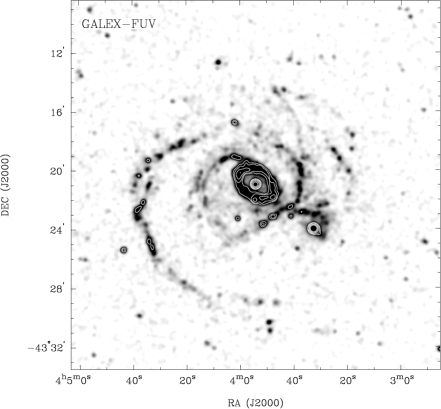
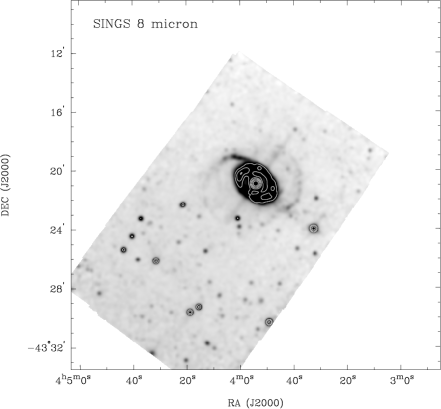
Figure 12 gives a multi-wavelength view of the NGC 1512/1510 system, shown with high resolution (15″ = 700 pc) over the main star-forming disk (similar in size to Fig. 1). Our main purpose here is to emphasize how the observed extent and distribution of stars and gas depend on the tracer. The H i distribution is by far the largest and extends well beyond the area shown here. The GALEX and images, shown here smoothed to an angular resolution of 15″, trace star forming regions out to a radius of 10′. Malin’s deep optical image (see Fig. 1) shows a very similar distribution. We expect that a deep H mosaic would also match this, as hinted at by the faint chains of H ii regions seen in the rather limited SINGG H image. The Spitzer 8m image allows us to see the inner spiral arms as they connect to the bar, but detects no emission in the outer disk. Most obviously missing is a map of the molecular gas in the system (e.g., as traced by CO(1–0) emission) which is expected to be similar to the H image.
The large gas reservoir provides copious fuel for star formation, which should be most prominent in areas of high column density (see Section 4.4). Given a high-sensitivity, high-resolution H i distribution, we can pinpoint the locations of star forming activity in the outer disks of galaxies.
The correspondence between regions of high H i column density and bright emission (see Fig. 12) is excellent throughout the extended disk of NGC 1512, apart from the central area which shows an H i depression (but must be rich in molecular gas). The large majority of the observed -complexes lie in regions where the H i column density is above atoms cm-2 (as measured in the high-resolution H i map). For comparison, the dwarf irregular galaxy ESO215-G?009 has a very extended H i disk (Warren et al. 2004) but no signs of significant star formation in the outer disk; its H i column density reaches above atoms cm-2 in only a few locations.
Deep GALEX images of nearby galaxies show that the profiles of many spiral galaxies extend beyond their H- or optical radius (Thilker et al. 2005; Gil de Paz et al. 2005, 2007b). In fact, Zaritsky & Christlein (2007) suggest that -disks exist in 30% of the local spiral galaxy population. We contend that these spectacular -disks must be located within even larger H i envelopes, here called -H i disks, which provide the fuel for continued star formation. Ultimately, it may just be a question of sensitivity that limits our observations of the outer edges of stellar and gaseous disks. We note that Irwin et al. (2009) detect H i gas out to column densities of atoms cm-2 (assuming the gas fills the 270″ beam).
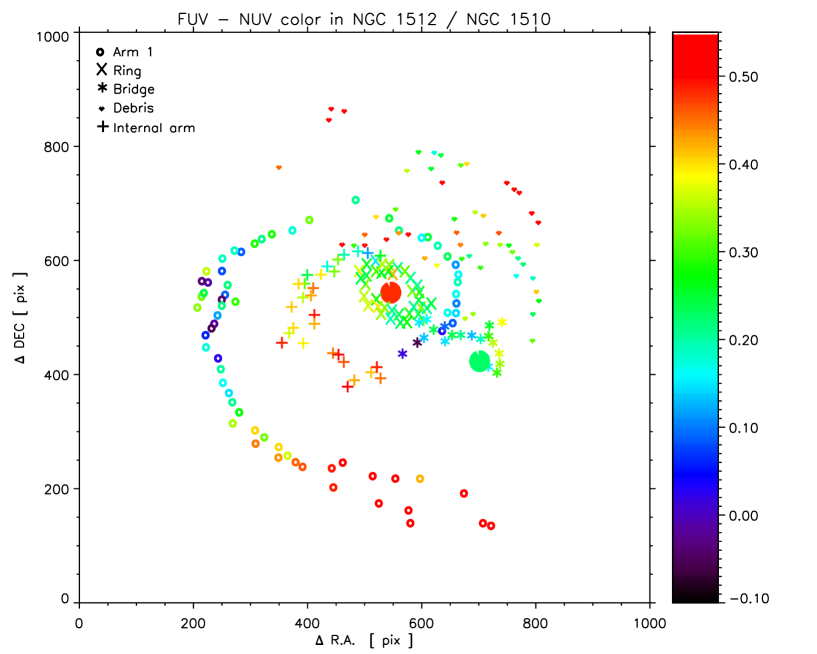
4.2 Stellar cluster ages
We use the GALEX and images to estimate the ages of the -rich star clusters in the NGC 1512/1510 system. This is done by integrating the counts per second (CPS) in 200 selected regions (100 arcsec2, average size = 320 arcsec2) using the same polygon for both images and applying (Morrissey et al. 2005), where = 18.82 mag and = 20.08 mag (all magnitudes are expressed in the AB system). We did not correct for extinction which is negligible when computing the color: .
Figure 13 shows the spatial distribution and color of the analysed star clusters. We use different symbols to identify five distinct areas within the system: the ring, the internal arm, the bridge to NGC 1510, the western debris and Arm 1 (see Fig. 1). The colors (blue to red) range from –0.06 (youngest stellar population) at the southern end of the bridge to +0.68 (oldest stellar population) for the farthest cluster in the NW region. Uncertainties in the color estimates strongly depend on the brightness of the star clusters (0.06 for the brightest and 0.50 for the weakest objects). For the analysed clusters in the NGC 1512/1510 system we adopt an uncertainty of 0.20.
As extinction is negligible when computing the colors (see above), higher values correspond to older ages for the last star-forming burst hosted by the -rich clusters. We have used the same procedure as described in Bianchi et al. (2005) and Hibbard et al. (2005) to estimate the age of the last star-forming event, assuming an instantaneous burst, and evolutionary synthesis models provided by Bruzual & Charlot (2003). Table 4 lists the results obtained for distinct areas.
| GALEX | ||||
| Region | min. | max. | median | Age (Myr) |
| NGC 1512 core | 0.48 | 320 | ||
| NGC 1510 | 0.24 | 150 | ||
| Ring | 0.15 | 0.42 | 130–180–300 | |
| Bridge | –0.06 | 0.39 | 10–120–270 | |
| Int. Arm | 0.12 | 0.51 | 80–270–330 | |
| Arm 1 | –0.05 | 0.66 | 10–170–380 | |
| Debris | 0.17 | 0.68 | 100–270–390 | |
While the colors suggest that the average stellar population in the core of NGC 1512 (red circle) is about twice as old as that of NGC 1510 (green circle), the high H emission in both galaxies also indicates significant recent star formation. We conclude that NGC 1512 and NGC 1510 contain both a young stellar population and an older, more evolved stellar population.
As shown in Fig. 13, there are definite color gradients along the spiral arms and other regions within the NGC 1512/1510 system. For example, while regions within the inner star-forming ring of NGC 1512 generally have similar colors, (age 180 Myr), slightly younger ages are found towards both ends of the bar, i.e. at the start of the inner arms. Regions located within the bridge between NGC 1512 and NGC 1510 are – on average – even younger, (age 120 Myr), with ages of 10 Myr (the youngest regions in the whole system) near NGC 1512, and 270 Myr near NGC 1510. As shown in Fig. 12, -bright regions close to NGC 1512 coincide well with the H i column density maxima; their young derived age is consistent with the H emission found in these knots. A -color gradient is also observed along the prominent eastern arm (Arm 1). In the eastern-most regions, which also show some H emission, we measure colors around –0.05 (age 10 Myr). As the arm curves towards the south, the -rich clusters appear to get older, reaching (age 380 Myr) within the two streams of the outermost regions.
Within the debris in the NW area, stellar clusters near NGC 1510 tend to have younger ages (, ages of 100–200 Myr) than those located towards the north of NGC 1512 (, ages of 300–400 Myr). The broadening of the H i spiral arm at the position of the NW debris suggests that something has dispersed both the neutral gas and the stellar component in this region. The age gradient found in the stellar clusters indicates that it probably is due to the gravitational interaction with the BCD galaxy NGC 1510.
The overall gas distribution together with the star formation history of the system provides some hints as to the gravitational interaction between the large spiral NGC 1512 and the BCD galaxy NGC 1510 and its effects on the surrounding medium. The youngest star forming regions are found mostly to the east & west of NGC 1512, while regions towards the north & south of NGC 1512 are generally older. This east-west (young) versus north-south (old) symmetry might indicate the passage of NGC 1510 as it is accreted by NGC 1512. This interaction might have (1) triggered the bar in NGC 1512 (unless this was the result of previous interactions or minor mergers) causing gas within the co-rotation radius to flow towards the nuclear region, thus providing fuel for continuous star formation, (2) affected the spiral arm pattern causing broadening and splitting as well as enhanced star formation, and (3) led to the ejection of material to large radii where it may become unbound, forming dense clumps able to form new stars. Evidence of the latter is the observation of two tidal dwarf galaxies at the outermost regions of the NGC 1512/1510 system.
| NGC 1512 | NGC 1510 | |
|---|---|---|
| [ erg s-1 Å-1] | ||
| [1040 erg s-1] | ||
| [1041 erg s-1] | (*) | |
| [1022 W Hz-1] | ||
| [1041 erg s-1] | ||
| [1019 W Hz-1] | ||
| (S07) | ||
| (K98) | ||
| (C07) | ||
| (K98) | ||
| () | ||
| () |
4.3 The global star formation rate
There are numerous ways to estimate the star formation rate (SFR) of a galaxy. To study the global and local SFRs, we use a range of line and continuum measurements at different wavelengths (ultraviolet, optical, infrared, and radio). A combination of these data together with an understanding of which stellar populations are detected at each wavelength is essential to obtain the full picture. Nevertheless, we are somewhat limited by the sensitivity, quality and field-of-view of the existing observations.
Star formation tends to be localised and varies within galaxies. While the
nuclear region and inner spiral arms of a galaxy are generally locations of
significant star formation, we also find new stars forming in other areas such
as interaction zones and occasionally in isolated clumps (presumably of high
molecular gas density) in the far outskirts of galaxies. The NGC 1512/1510
system is an excellent laboratory to study the locations and properties of
its many star forming regions, from the galaxy nuclei out to the largest radii
where detached H i clouds are found (see Section 3.3) as well as in the
interaction zone between the two galaxies.
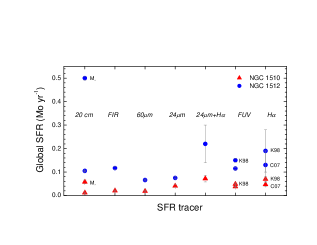
Here we use a range of tracers to study the global SFR of both NGC 1512 and NGC 1510 (results are summarised in Table 5 and Fig. 14), before investigating the local star formation activity within various parts of the NGC 1512/1510 system (see Section 4.4).
From our 20-cm radio continuum data we derive a recent global SFR of 0.105 M⊙ yr-1 for NGC 1512 and 0.012 M⊙ yr-1 for NGC 1510 (see Section 3.4). Another extinction-free SFR estimate is derived from the far-infrared () luminosity. Using the IRAS flux densities (Moshir et al. 1990) together with the relations given by Sanders & Mirabel (1996) and Kennicutt (1998), we derive 0.12 M⊙ yr-1 for NGC 1512 and 0.02 M⊙ yr-1 for NGC 1510.
emission comes from the thermal continuum re-radiation of dust grains which absorb the visible and radiation emitted by massive young stars. In contrast, radio continuum emission is mainly due to synchrotron radiation from relativistic electrons accelerated in the remnants of core-collapse supernovae, therefore also associated with the presence of massive stars. Both estimates trace the star formation activity in the last 100 Myr. However, as relativistic electrons have lifetimes of 100 Myr (Condon et al. 2002), we should expect that the 20-cm radio continuum emission traces SFRs with somewhat extended ages.
H emission traces the most massive, ionising stars, and timescales of 10 Myr, i.e. the most recent events of star formation in the galaxy. The H flux given by Meurer et al. (2006) was corrected for Galactic extinction but not for internal extinction or for the contribution of the [N ii] emission lines adjacent to H (see López-Sánchez & Esteban 2008)333As NGC 1510 is a low-metallicity galaxy, the contribution of the [N ii] emission to the H flux is expected to be negligible.. Using the relation by Kennicutt (1998), we find = 0.19 and 0.07 M⊙ yr-1 for NGC 1512 and NGC 1510, respectively. Slighter lower values, = 0.13 and 0.05 M⊙ yr-1, result when using the more recent Calzetti et al. (2007) calibration.
-emission probes star formation over timescales of 100 Myr, the life-time of the massive OB stars. Using the extinction-corrected GALEX -magnitude, , as given by Gil de Paz et al. (2007a), we derive the -flux as follows: [erg s-1 cm-2 Å-1] = . We have corrected for extinction assuming the Galactic value provided by Schlegel et al. (1998), = 0.011, and . Applying the Salim et al. (2007) relation between the luminosity and the SFR, we obtain = 0.12 and 0.04 M⊙ yr-1 for NGC 1512 and NGC 1510, respectively. For comparison, applying the Kennicutt (1998) relation results in values that are a 1.3 times higher. Here we prefer to use Salim et al. (2007) relation because it was derived using GALEX data.
The SINGS Legacy project (Kennicutt et al. 2003) provides Spitzer mid-infrared () images of NGC 1512/1510. emission, which traces the dust distribution within galaxies, also agrees well with the position of the -rich star clusters in the system. Because of its higher intrinsic brightness, the emission is mainly detected in the cores of both galaxies and in the inner ring of NGC 1512. Using the Spitzer 24m flux density measurements of NGC 1512 (Dale et al. 2007) and NGC 1510 (obtained by us; see Table 5) together with the relations by Calzetti et al. (2007) we derive = 0.075 M⊙ yr-1 for NGC 1512 and 0.041 M⊙ yr-1 for NGC 1510.
Combining the 24m luminosity (which traces the dust-absorbed star
formation) with the H luminosity (which probes the unobscured star
formation) we derive = 0.22 M⊙ yr-1 and 0.07 M⊙ yr-1 for NGC 1512 and NGC 1510, respectively.
Figure 14 shows the star formation rates as derived for NGC 1512 and NGC 1510
at various wavelength, arranged along the x-axis by the approximate timescales
in which the SFR is considered: from the H emission, tracing the very young
(10 Myr) star formation to the radio continuum emission, tracing the old
stellar population (100 Myr). We find that for NGC 1510 our derived SFR
estimates are in agreement (0.05 M⊙ yr-1). The fact that the SFR derived
from the 20-cm radio continuum flux considering all masses, ( M⊙) = 0.058 M⊙ yr-1, is close to the SFR found using , H and
24m data reinforces the starburst nature of this BCD galaxy.
For NGC 1512, the SFR estimates obtained from H, , 24m, and
20-cm radio continuum ( M⊙) data agree (0.12 M⊙ yr-1). However,
is about four times higher when we consider all masses. This can be
explained by the non-starbursting nature of NGC 1512, which has been forming
stars over a long period of time (Gyr).
Following Helou, Soifer & Rowan-Robinson (1985) we calculate the parameter
which is defined as the logarithmic ratio of the to 20-cm radio flux
density. We find = 2.25 and 2.44 for NGC 1512 and NGC 1510, respectively,
consistent with the mean value of 2.3 for normal spiral galaxies (Condon 1992).
This result confirms the star-forming nature of both galaxies.
Using the H flux given by Meurer et al. (2006) and the relation provided by Condon et al. (2002), we derive the thermal flux at 1.4 GHz for NGC 1512 and NGC 1510: 2.7 and 1.0 mJy, respectively. The ratio of the non-thermal to thermal radio emission, , is 1.1 and 0.54, respectively. The value derived for NGC 1512 agrees with that of typical star-forming galaxies (, Dopita et al. 2002) but is relatively low for NGC 1510. This indicates that the thermal emission from H ii regions in NGC 1510 is more important than the non-thermal emission from supernovae explosions (i.e., the starburst is very recent, and there has not been enough time to convert many massive stars into supernovae). This fact agrees with the detection of WR features in NGC 1510 (Eichendorf & Nieto 1984).
4.4 The local star formation activity
We have estimated the star formation rate of each -rich stellar cluster in the NGC 1512/1510 system using the extinction-corrected luminosity and the assumptions given before. In general, we find that regions closer to NGC 1512 display higher star formation activity, in agreement with their young ages (see Fig. 13).
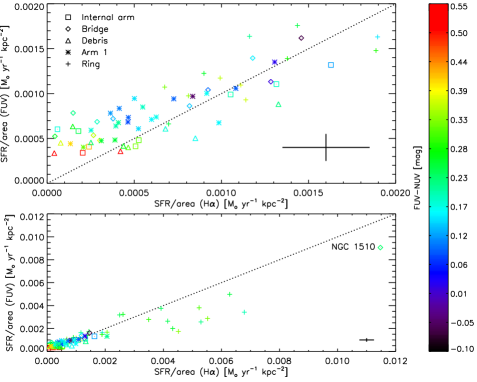
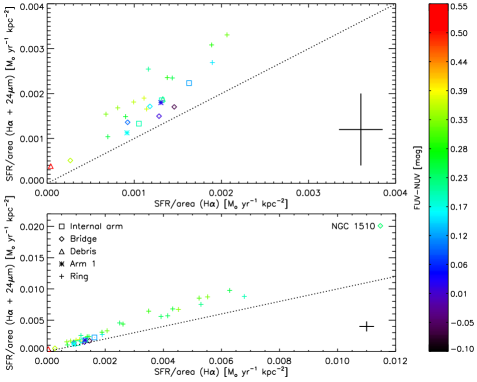
Considering only stellar clusters with both H and emission, we compare (C07) with (S07). Fig. 15 shows a good correlation between both estimates for small values of SFR/area (0.002 M⊙ yr-1 kpc-2), however, is always lower than for regions with high SFR/area (i.e. within the inner ring of NGC 1512 and in NGC 1510). Given that the ages of the latter are similar, this must be a consequence of internal extinction within these regions which are denser and possess a larger amount of dust, as seen in Spitzer images, than other areas. Fig. 16 confirms this as is systematically higher than .
Next, we investigate if the -rich clusters within the NGC 1512/1510 system do obey the Schmidt-Kennicutt scaling laws of star formation (Kennicutt 1998). Boissier et al. (2007), for example, find that the stellar and gas radial profiles of galaxies with disks follow such relations. Fig. 17 shows a comparison between /area and the H i mass density. — This analysis can be improved by adding high-resolution ATCA H i data, obtained for the southern THINGS project (Deanne, de Blok, et al.), to improve the sensitivity to small scale structure,
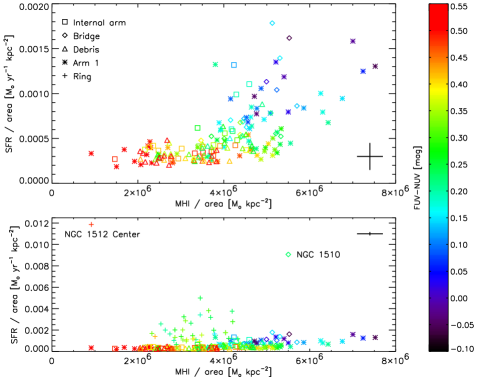


Overall, we find that /area increases with /area, i.e. the higher
the H i gas density the more stars are forming. However, this is not true for
regions located within the inner star-forming ring of NGC 1512, where there is
clearly a lack of H i gas (see Fig. 13). We conclude that in the inner region
of NGC 1512 a large amount of molecular gas must be present to boost the
overall gas density to the critial value or above.
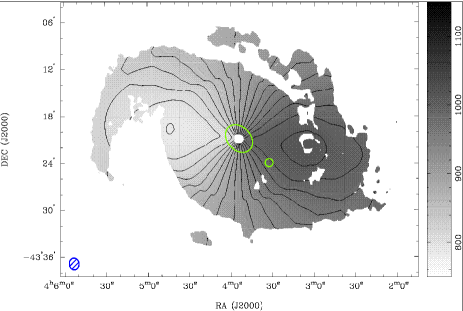
In the following we check if the Toomre Q gravitational stability criterion is satisfied at the locations of the -rich clusters. Ideally, we would use the H i velocity field (corrected for inclination) and the velocity dispersion of NGC 1512, to compute the critical gas density, (see Kennicutt 1989, Martin & Kennicutt 2001), at every pixel in the disk. Here is a scaling constant, is the velocity dispersion, and is the epicyclic frequency. The low-resolution H i distribution (0. moment) and the mean H i velocity field (1. moment) of NGC 1512 are shown in Fig. 3. The H i velocity dispersion (2. moment, not shown) varies between 7–22 km s-1 in the spiral/tidal arms of NGC 1512. As a first step, we compare the radially averaged H i gas distribution with the critical density and the radially averaged emission. For a flat rotation curve (i.e., () = constant), which is a reasonable assumption for (see Fig. 6), and a velocity dispersion of 6 km s-1 (as used in previous work), the above equation reduces to = 0.6 /, where is the radius in kpc. Using the derived H i inclination ( = 35°) and position angle ( = 265°), the de-projected H i radial surface density, of NGC 1512 is shown in Fig. 18. The critcal density was computed for = 0.7 and = 150 km s-1. We find that the radially averaged H i gas alone lies just below the computed critical density.
At radii less than 10 kpc, an increasing amount of molecular gas is needed to reach critical gas density and feed the star formation in the nuclear region and the inner ring. The radially integrated flux drops below the noise at = 28 kpc, the likely SF threshold.
In the inner region of NGC 1512, the gas motions are strongly affected by the
stellar bar, which would affect the critical density estimate.
Using NGC 1512’s angular velocity, () = ()/, we can also
determine the locations of the inner and outer Lindblad resonances:
, where is the
bar pattern speed and /. At kpc
(bar radius) its pattern speed is 50 km s-1 kpc-1, suggesting that
the ILR(s) lie at kpc, and the OLR at kpc.
Figure 19 shows the logarithmic ratio of the measured H i gas density, , to the critical density, , for all analysed -rich clusters together and within the previously defined distinct regions. Taking all clusters, a peak is found at , indicating that local star formation is, on average, happening at the local critical density. The measured H i densities are slightly higher than critical along Arm 1 (0.33) and within the NW debris (0.17), but significantly lower than critical in the inner star-forming ring (–0.44) where the molecular gas density must be high.
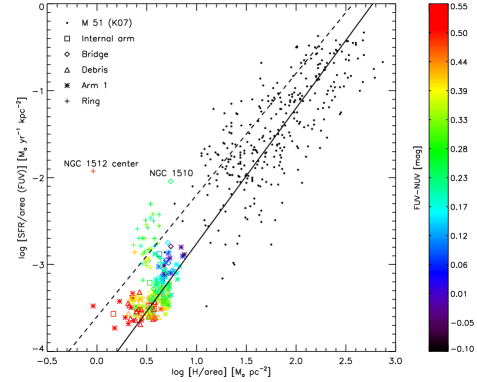
Finally, Fig. 20 shows – on a logarithmic scale – the density versus the gas density for -rich clusters in the NGC 1512/1510 system (derived here) and in the nearby Sbc galaxy M 51 (Kennicutt et al. 2007; for kpc). Because no molecular data are currently available for NGC 1512, only the H i gas density is shown. Regions within the inner star-forming ring of NGC 1512 (located at = 90″) are – as stated before – significantly offset. Tripling the H i mass of each region achieves an approximate alignement. For M 51, molecular data are taken into account and are found to be essential for the observed correlation (Kennicutt et al. 2007). Dong et al. (2008) found that the -selected regions in two small fields within the large gaseous disk of M 83, 20 kpc from its centre, follow a similar trend. Molecular gas was not taken into account (for comparison, see Martin & Kennicutt 2001).
4.5 Global chemical properties
Here we estimate the metallicities of NGC 1512 and NGC 1510 using data available in the literature. Calzetti et al. (2007) and Moustakas & Kennicutt (2006) give an oxygen abundance between 8.37 and 8.81, in units of 12+log(O/H), for the chemical abundance of NGC 1512. The first value was derived using optical spectroscopy and the Pilyugin & Thuan (2005) calibration. The second value was obtained comparing with the predictions given by the photoionised evolutionary synthesis models provided by Kobulnicky & Kewley (2004). However, some recent analysis using direct estimates of the electron temperature () of the ionised gas (e.g., López-Sánchez 2006) suggest that these models overestimate the oxygen abundance by 0.2 dex. We conclude that the metallicity of NGC 1512 is between 8.4 and 8.6, slightly lower than for the Milky Way, but within the range typical observed for spiral galaxies (Henry & Worthey 1999).
On the other hand, we have used the emission line intensity data for NGC 1510, provided by Storchi-Bergmann et al. (1995), to compute its chemical abundance. We used the HH ratio to correct the data for reddening and obtained (H) = 0.54. With the help of tasks in the iraf ‘nebular package’, we compute = 15700 K, using the [O iii] 5007/4363 ratio. Assuming an electron density of = 100 cm-3 we compute the ionic abundances for O+/H+ and O++/H+ and derive a total oxygen abundance of 12+log(O/H) = 7.95 (0.2 Z⊙), typical for BCD galaxies.
The large metallicity difference between NGC 1512 and NGC 1510 indicates that both galaxies have experienced a very different chemical evolution, and that NGC 1510 has been in a quiescent state for a long time while NGC 1512 was forming stars continuously.
The N/O ratio found in NGC 1510, log(N/O) –1.2, is rather high for a galaxy with its oxygen abundance. For comparison, Izotov & Thuan (2004) typically obtain log(N/O) –1.5 for low metallicity BCD galaxies. Similar results are also found for other BCD galaxies with a significant population of WR stars (Brinchmann et al. 2008). It is thought that the nitrogen enrichment is a consequence of a very recent chemical pollution event probably connected with the onset of WR winds (López-Sánchez et al. 2007). It may also be related to the interaction between galaxies (Pustilnik et al. 2004, López-Sánchez et al. 2009), but deeper optical spectroscopic data with a higher spectral resolution are needed to confirm this issue.
4.6 Interaction-induced star formation
Star formation depends on the gravitational instability of galaxy disks, both locally and globally. Minor mergers and tidal interactions affect the gas distribution and dynamics of galaxies, leading to the formation of bars, gas inflow as well as the ejection of gas, and – as a consequence – locally enhanced star formation. Together, these phenomena are key ingredients to the understanding of galaxy evolution. The often extended H i envelopes of spiral galaxies are particularly useful as sensitive tracers of tidal interactions and gas accretion. The gas distribution and dynamics are easily influenced by the environment, resulting in asymmetries, line broadening and/or splitting etc.
The development of a strong two-armed spiral pattern and star-forming regions in disk galaxies (here NGC 1512) which accrete low-mass dwarf companions (here NGC 1510) has been explored by Mihos & Hernquist (1994) using numerical simulations. Their models, which use a mass ratio of 10:1 for the disk galaxy and its companion, resemble the galaxy pair NGC 1512/1510 after 40 time units (i.e. years). At that stage, the model disk galaxy has developed a pronounced, slightly asymmetric two-armed spiral pattern with significant star-formation along the arms and the nuclear region.
Minor mergers are common. The Milky Way and the Andromeda galaxy are prominent examples; both have many satellites and show evidence for continuous accretion of small companions. The multitude of stellar streams detected in our Galaxy as well as some other galaxies (e.g., NGC 5907, Martinez-Delgado et al. 2008) are hinting at a rich accretion history. Minor mergers contribute significantly to galaxy assembly, accretion, and evolution.
5 Conclusions
We analysed the distribution and kinematics of the H i gas as well as the star formation activity in the galaxy pair NGC 1512/1510 and its surroundings.
For the barred, double-ring galaxy NGC 1512 we find a very large H i disk, about four times the optical diameter, with two pronounced spiral arms, possibly tidally induced by the interaction with the neighbouring blue compact dwarf galaxy NGC 1510. It is possible that the interaction also triggered the formation of the bar in NGC 1512 (unless the bar already existed, maybe from a previous accretion or interaction event) which would then cause gas to fall towards the nuclear regions, feeding the star formation, as well as induces torques in the outer spiral arms.
We detect two tidal dwarf galaxies with H i masses of M⊙ and clear signs of star formation in the outer-most regions of the system. The most distant TDG, N1512-west, is rather compact and lies at a distance of 80 kpc from the centre of NGC 1512, potentially at the tip of an extra polated eastern H i arm of NGC 1512. The second TDG, 1512-south, is forming within an extended H i cloud, and is located slightly closer (64 kpc), within the extrapolated eastern H i arm.
We regard these two TDGs as typical with respect to their H i mass, star forming activity and detachment from the interacting system. While TDGs are often found in major mergers, we find that they can form in mildly interacting system such as NGC 1512/1510. In this case, the interaction is effectly an accretion of a blue compact dwarf galaxy (NGC 1510) by the large spiral galaxy NGC 1512.
NGC 1512 hosts an extended disk with 200 of clusters with recent star formation activity. The comparison of our H i map with the GALEX images clearly shows that these clumps are located within the maxima of neutral gas density. We have derived the ages and star formation rates of the -rich clusters.
We find that generally only the youngest clusters are associated with high H i column densities, while in older clusters only diffuse H i gas is detected. This might suggest that as the hydrogen gas depleted, star formation stopped in the latter regions. As a consequence we expect to detect H emission in all high density H i regions or equivalent in all young clusters.
Our analysis supports a scenario in which the interaction between the BCD galaxy NGC 1510 and the large spiral galaxy NGC 1512 has triggered star formation activity in the outskirts of the disk and enhanced the tidal distortion in the H i arms. The interaction seems to occur in the north western areas of the system because of the broadening of the H i arm and the spread of the -rich star clusters in this region. The system is probably in the first stages of a minor merger which started 400 Myr ago.
6 Outlook
Future H i surveys, such as those planned with the Australian SKA Pathfinder (ASKAP; Johnston et al. 2008) will produce similar H i cubes and images than obtained here, but over much larger areas. E.g., the proposed shallow ASKAP H i survey of the sky will reach a sensitivity of 1 mJy beam-1 at an angular resolution of 30″ in a 12-h integration per field. Focal plane arrays will provide a very large, instantaneous field-of-view of . This means that H i images similar to those shown in this paper will be obtained for the entire Local Volume. Furthermore, the correlator bandwidth of 300 MHz (divided into 16,000 channels) will allow us to study the H i content of galaxies and their surroundings out to 60,000 km s-1 ( = 0.2). In addition, very deep 20-cm radio continuum images are obtained for the same area.
Acknowledgements
-
•
This research has made extensive use of the NASA/IPAC Extragalactic Database (NED) which is operated by the Jet Propulsion Laboratory, Caltech, under contract with the National Aeronautics and Space Administration.
-
•
The Digitised Sky Survey was produced by the Space Telescope Science Institute (STScI) and is based on photographic data from the UK Schmidt Telescope, the Royal Observatory Edinburgh, the UK Science and Engineering Research Council, and the Anglo-Australian Observatory.
-
•
We thank David Malin for permission to use the deep optical image of the NGC1512/1510 system.
References
- [2001] Barnes D.G., et al. 2001, MNRAS, 322, 486
- [1987] Begeman K.G., 1987, PhD Thesis, Kapteyn Institute
- [2005] Bianchi L., et al. 2005, ApJ, 619, 71
- [2007] Boissier S., et al. 2007, ApJS, 173, 524
- [2004] Braine J., Duc P.-A., Lisenfeld U., Brinks E., Charmandaris V., Leon S. 2004, in ‘Recycling Intergalactic and Interstellar Matter’, IAU Symposium 217, ed. P.A. Duc, J. Braine and E. Brinks, p. 518
- [2008] Brinchmann J., Kunth D., Durret F. 2008, A&A, 485, 657
- [2003] Bruzual G. & Charlot S. 2003, MNRAS, 344, 1000
- [1988] Buta R. 1988, ApJS, 66, 233
- [2007] Calzetti D., et al. 2007, ApJ, 666, 870
- [2008] Cluver, M.E., Jarrett, T.H., Appleton, P.N., Kraan-Korteweg, R.C., Woudt, P.A., Koribalski, B.S., Donley, J.L., Wakamatsu, K., Nagayama, T. 2008, ApJ, 686, L17
- [1992] Condon J.J. 1992, ARA&A, 30, 575
- [2002] Condon, J.J., Cotton, W.D. & Broderick, J.J. 2002, AJ, 124, 675
- [1991] Conti, P.S. 1991, ApJ, 377, 115
- [2008] Curran, S., Koribalski, B.S., Bains, I. 2008, MNRAS, 389, 63
- [1991] da Costa, L.N., Pellegrini, P.S., Davis, M., Meiksin, A., Sargent, W.L.W., Tonry, J.L. 1991, ApJS, 75, 935
- [2007] Dale, D.A., et al. 2007, ApJ, 655, 863
- [2008] Dong, H., Calzetti, D., Regan, M., Thilker, D., Bianchi, L., Meurer, G.R., Walter, F. 2008, AJ, 136, 479
- [2006] Donley, J.L., Koribalski, B.S., Staveley-Smith, L., Kraan-Korteweg, R.C., Schroeder, A., Henning, P.A. 2006, MNRAS, 369, 1741
- [2002] Dopita, M.A., Pereira, M., Kewley, L.J., Capaccioli, M. 2002, ApJS, 143, 47
- [2005] Gallagher, J.S. III, Grebel, E.K., Smith, L.J. 2005, IAU Colloquium No. 198, eds. H. Jerjen and B. Binggeli, p. 151
- [1993] Garcia, A.M. 1993, A&AS, 100, 47
- [2007a] Gil de Paz, A., et al. 2007a, ApJS, 173, 185
- [2007b] Gil de Paz, A., et al. 2007b, ApJ, 661, 115
- [1983] Eichendorf, W., Nieto, J.-L. 1984, A&A, 132, 342
- [1979] Hawarden, T.G., van Woerden, H., Goss, W.M., Mebold, U., Peterson, B.A. 1979, A&A, 76, 230
- [1985] Helou G., Soifer B.T., Rowan-Robinson M. 1985, ApJ, 298, L7
- [1999] Henry, R.B.C., Worthey, G. 1999, PASP 111, 919
- [2005] Hibbard, J.E., et al. 2005, ApJ, 619, L87
- [2007] Horellou, C., Koribalski, B.S. 2007, A&A, 464, 155
- [2005] Huchtmeier, W.K., Krishna, G., Petrosian, A. 2005, A&A, 434, 887
- [2007] Huchtmeier, W.K., Petrosian, A., Gopal-Krishna, Kunth, D. 2007, A&A, 462, 919
- [2008] Irwin, J., et al. 2009, ApJ, 692, 1447
- [2004] Izotov, Y.I. & Thuan, T.X. 204, ApJ, 616, 768
- [2008] Johnston, S., et al. 2008, Experimental Astronomy, 22, 151
- [1999] Jones, K.L., Koribalski, B.S., Elmoutties M., Haynes, R.F. 1999, MNRAS, 302, 649
- [2004] Karachentsev, I.D., Karachentseva, V.E., Huchtmeier, W.K., Makarov, D.I. 2004, AJ, 127, 2031
- [2008] Karachentsev, I.D., Karachentseva, V., Huchtmeier, W., Makarov, D., Kaisin, S., Sharina, M. 2008, in ‘Galaxies in the Local Volume, Sydney, 8–13 July 2007, eds. B.S. Koribalski & H. Jerjen, Springer, p. 21
- [1998] Kennicutt, R.C. 1998, ARA&A, 36, 189
- [2003] Kennicutt, R.C., et al. 2003, PASP, 115, 928
- [2007] Kennicutt, R.C., et al. 2007, ApJ 671, 333
- [1978] Kinman, T.D. 1978, AJ, 83, 764
- [2004] Kobulnicky, H.A., Kewley, L.J. 2004, ApJ, 617, 240
- [2004] Koribalski, B. et al. 2004, AJ, 128, 16
- [2005] Koribalski, B.S. 2005, PASA, 22, 333
- [2007] Koribalski, B.S. 2007, in ”Groups of Galaxies in the Nearby Universe”, ESO Workshop, eds. I. Saviane, V.D. Ivanov, and J. Borissova, Springer, p. 27
- [2008] Koribalski, B.S., et al. 2008, in ‘Galaxies in the Local Volume’, Sydney, 8–13 July 2007, eds. B.S. Koribalski & H. Jerjen, Springer, p. 41
- [2008] Koribalski, B.S., et al. 2009, in prep.
- [2006] Laurikainen, E., Salo, H., Buta, R., Knapen, J., Speltincx, T., Block, D. 2006, AJ, 132, 2634
- [1981] Lindblad, P.O., Jörsäter, S. 1981, A&A, 97, 56
- [2006] López-Sánchez, Á.R. 2006, PhD Thesis, University of La Laguna (Tenerife, Spain).
- [2007] López-Sánchez, Á.R. Esteban, C. García-Rojas, J., Peimbert, M., Rodríguez, M. 2007, ApJ, 656, 168
- [2008] López-Sánchez, Á.R. & Esteban, C., 2008, A&A, 491, 131
- [2009] López-Sánchez, Á.R., Esteban, C. & Mesa-Delgado, A. 2009, submitted
- [2001] Maoz, D., Barth, A., Ho, L.C., Sternberg, A., Filippenko, A.V. 2001, AJ, 121, 3048
- [2001] Martin, C.L., Kennicutt, R.C. Jr. 2001, ApJ, 555, 301
- [2008] Martinez-Delgado, D., et al. 2008, ApJ, 689, 184
- [2006] Meurer, G.R., et al. 2006, ApJS, 165, 307
- [1994] Mihos, J. C., Hernquist, L. 1994, ApJ, 425, L13
- [2005] Morrissey, P. & GALEX Science Team, 2005, BAAS, 37, 1454
- [1990] Moshir, M. et al. 1990, BAAS, 22, 1325
- [2006] Moustakas, J., Kennicutt, R.C. Jr. 2006, ApJ, 651, 155
- [1997] Pickering, T.E., Impey, C.D., van Gorkom, J.H., Bothun, G.D. 1997, AJ 114, 1858
- [2005] Pilyugin, L.S., Thuan, T.X. 2005, ApJ, 631, 231
- [2004] Pustilnik, S., Kniazev, A., Pramskij, A., Izotov, Y., Foltz, C., Brosch, N., Martin, J.-M., Ugryumov, A. 2004, A&A, 419, 469
- [1982] Reif K., Mebold U., Goss W.M., van Woerden H., Siegman B. 1982, A&AS, 50, 451
- [2007] Salim S., et al. 2007, ApJS, 173, 267
- [1994] Sandage A., Bedke J. 1994, The Carnegie Atlas of Galaxies
- [1996] Sanders D.B. & Mirabel I.F. 1996, ARA&A, 34, 749
- [1995] Sault R.J., Teuben P.J., Wright M.C.H. 1995, in ‘Astronomical Data Analysis Software and Systems IV’, ed. R. Shaw, H.E. Payne, J.J.E. Hayes, ASP Conf. Ser. 77, 433
- [1999] Schaerer D., Contini, T. & Pindao, M. 1999, A&AS, 136, 35
- [1998] Schlegel D.J., Finkbeiner D.P., Davis M. 1998, ApJ, 500, 525
- [1987] Skillman E.D. 1987, in NASA Conf. Publ. Vol. 2466, ‘Star Formation in Galaxies’, p. 263
- [1995] Storchi-Bergmann T., Kinney A.L., Challis P. 1995, ApJS, 98, 103
- [2005] Thilker D.A., et al. 2005, ApJ, 619, L79
- [1991] de Vaucouleurs G., de Vaucouleurs A., Corwin Jr. H.G., Buta R.J., Paturel G., Fouqué P. 1991, “Third Reference Catalogue of Bright Galaxies” (New York: Springer Verlag), [RC3]
- [1992] van der Hulst J.M., Terlouw, J.P., Begeman K., Zwitser W., Roelfsema P.R. 1992, in ‘Astronomical Data Analysis Software and Systems I’, ed. D.M. Worall, C. Biemesderfer, J. Barnes, ASP Conf. Ser. 25, 131
- [2004] Warren, B.E., Jerjen, H., Koribalsi, B.S. 2004, AJ 128, 1152
- [2007] Zaritsky D., Christlein D. 2007, AJ, 134, 135