Rotation Velocities for M-dwarfs111Based on observations obtained with the Hobby-Eberly Telescope, which is a joint project of the University of Texas at Austin, the Pennsylvania State University, Stanford University, Ludwig-Maximilians-Universität München, and Georg-August-Universität Göttingen.
Abstract
We present spectroscopic rotation velocities ( sin ) for 56 M dwarf stars using high resolution HET HRS red spectroscopy. In addition we have also determined photometric effective temperatures, masses and metallicities ([Fe/H]) for some stars observed here and in the literature where we could acquire accurate parallax measurements and relevant photometry. We have increased the number of known sin s for mid M stars by around 80% and can confirm a weakly increasing rotation velocity with decreasing effective temperature. Our sample of sin s peak at low velocities (3 km s-1). We find a change in the rotational velocity distribution between early M and late M stars, which is likely due to the changing field topology between partially and fully convective stars. There is also a possible further change in the rotational distribution towards the late M dwarfs where dust begins to play a role in the stellar atmospheres. We also link sin to age and show how it can be used to provide mid-M star age limits.
When all literature velocities for M dwarfs are added to our sample there are 198 with sin 10 km s-1 and 124 in the mid-to-late M star regime (M3.0-M9.5) where measuring precision optical radial-velocities is difficult. In addition we also search the spectra for any significant H emission or absorption. 43% were found to exhibit such emission and could represent young, active objects with high levels of radial-velocity noise. We acquired two epochs of spectra for the star GJ1253 spread by almost one month and the H profile changed from showing no clear signs of emission, to exhibiting a clear emission peak. Four stars in our sample appear to be low-mass binaries (GJ1080, GJ3129, Gl802 and LHS3080), with both GJ3129 and Gl802 exhibiting double H emission features. The tables presented here will aid any future M star planet search target selection to extract stars that will exhibit low radial-velocity jitter.
1 Introduction
In the past 10 years radial-velocity measurements in the optical have made great strides by utilising a number of techniques and methodologies to generate precisions of 3 m s-1 in the long term (e.g. Butler et al., 2006) and sub-m s-1 in the short term (e.g. Bouchy et al., 2005). Use of an iodine cell (e.g. Marcy & Butler, 1992) or ThAr gas lamp (e.g. Pepe et al., 2000) have allowed detection of around 300 extrasolar planets (exoplanets), with that number increasing each month (see http://exoplanet.eu/). A large parameter space has been studied but since these observations are limited to the optical regime, where M dwarfs are intrinsically faint, a vast amount of stars are left unobserved, particularly the M star population that constitutes the bulk of stars in the local galactic neighbourhood. Radial-velocity studies of early M dwarfs have detected planets well into the terrestrial-mass regime, down below 10M⊕ (e.g. Rivera et al., 2005; Udry et al., 2007; Mayor et al., 2009). There is considerably improved mass contrast with such stars (amplitude of a given mass planet Mstar0.5) and obtaining precision radial-velocities of these objects may enable Earth-mass planets to be detected in their habitable zones.
The largest uncertainty associated with precision radial-velocity measurements is that of stellar activity. The association between stellar activity and rotation velocity ( sin ) is well established (Noyes et al., 1984) and measuring this parameter is an excellent proxy of the level of activity. For a fixed resolution, S/N and calibration method, stars with higher rotational velocities have radial-velocity measurements with lower precision since the larger rotation serves to wash out the spectral features (Bouchy et al., 2001). Coupled to this, the combination of activity and rotation can cause false positives to appear in the data (e.g. Henry et al., 2002) but in general it serves to increase the level of jitter (Wright, 2005). However, the rotation-activity connection has been shown to saturate quickly around M stars, occuring at 5 km s-1 for M2 objects (Patten & Simon, 1996). Since we are probing later M stars (M3), where observations of various activity indicators have shown that the percentage of active stars will increase dramatically, up to 100% at M7 (Fleming et al., 2000; Mohanty et al., 2002), we are focused on selecting the slowest rotators within each spectral bin, in order to select the narrowest line profiles. An increase in radial-velocity uncertainty of around 3-4 times was found by Bouchy et al. when increasing the sin of stellar models from 1-10 km s-1. The larger uncertainty arises due to the loss of spectral information in the stars with higher sin since the blending factor is increased within the stellar forrest, to the detrement of the radial-velocity information.
Based on the above description any future precision radial-velocity planet search survey targeting cool M stars should have a fairly strict selection based on the rotation velocity of their sample stars, particularly when targeting Earth-mass planets in the habitable zones. For instance, a search employed using a PRVS-like instrument (Jones et al., 2008; Ramsey et al., 2008) would focus on selecting the brightest M stars with rotational velocities in the sub-10 km s-1 regime, which would allow high S/N spectra to be acquired in the shortest possible observational times, gaining in the number of M stars observed in a single observing run, and also allowing the highest precisions to be reached to detect the lowest mass rocky planets, in particular Earth-like planets in their habitable zones. We do note that such a 10 km s-1 upper limit should probably be raised when moving into the ultracool/brown dwarf regime to increase the number of such objects on any planet search sample since previous studies have shown that rotation velocities appear to systematically increase (e.g. Mohanty & Basri, 2003; Reiners & Basri, 2008).
2 Observations & Reduction
All observations in this study were made over the period 2006 December 252007 November 04 utilising the queue scheduling mode at the 9.2m Hobby-Eberly Telescope (HET; Ramsey et al., 1998) at McDonald Observatory in Texas. Using the High Resolution Spectrograph (HRS; Tull, 1998) red chip (8100-9900Å) operating at a resolution of R37,000 and spatial binning of 2x2, 53 objects were observed, ranging in spectral type from M3V to M6.5V. The HRS observing mode employed the use of two 3′′ fibers since the objects were so faint, with one on object and one on sky. Bright telluric standards taken from the HET list of rapidly rotating B stars were also observed on most of the nights, which allowed us to characterize the level of telluric contamination in the data. Since even close by mid-to-late M stars are relatively faint, our HRS integration times ranged in duration from 5-25 minutes and for some of the fainter objects multiple exposures were taken and combined to generate a high S/N spectrum. However, most of the sin measurements, when comparing the individual frames to the combined frame, were within 0.5 km s-1 since the deconvolution method we employ boosts the S/N in the final line profile used in the measurements.

The reduction of all data was performed using ccdpack and starlink techniques. First the bias and overscan signals were removed and the overscan region was clipped off each image. A master flatfield was created by median filtering all flats taken in the standard HRS calibration plan. This usually consisted of a few bias frames, flatfields and ThAr arc observations taken before and after the nights observing, however for one night no flats were observed and a flatfield from a night close to the observing night was used in the reduction. Also the number of flatfields were increased to 10 for the last six months or so of data, which significantly aids in fringe removal. Indeed, the fringing in the red chip of HRS can reach 10-20% and hence well exposed, high S/N Halogen flatfields are used to correct these.
The starlink package echomop (Mills et al., 1996) was used to extract the echelle data. Firstly, all 14 orders were located and traced using the master flatfield, and any stray pixels were clipped from this trace. The dekker limits were determined using the master flatfield to ensure the entire object order and the adjoining sky order are included in the reduction. The master flatfield was then normalized to determine the balance factors and these were multiplied into all other observations. The sky light was removed by utilising the sky fiber and subtracting out any sky lines that appeared in the object spectra. The orders were then extracted using an optimal extraction routine (Horne, 1986) and wavelength calibrated using the ThAr arc images.
A small portion of spectra for the M4.5V star G 121-028, centered on the sodium doublet at 8182-8194Å, is shown in Fig. 1 (solid line). The dashed spectrum is the telluric standard HD1839, which is a fast rotating B star, therefore all the strong features are due to telluric contamination. The sodium doublet is heavily blended with a number of telluric features, which without good sky subtraction, could serve to contaminate any measurement of the line properties. This is one of the reasons that we use a spectral deconvolution routine to help remove the telluric features in our final analysis. These final spectra have a limiting resolution of between 0.20-0.35Å (7-13 km s-1), which was determined individually for each star by deconvolving the telluric lines in each image.
3 sin Determination

All sin s in this work are determined by deriving an optimal line profile for each star, and then convolving a non-rotating template (LHS1950 is our template) with rotational profiles of various velocities to find the best match. A deconvolution method (Donati & Collier Cameron, 1997; Barnes et al., 1998; Collier Cameron et al., 2002) is used to determine the optimal line profile. A continuum fit is performed using the continuum routine in iraf to normalize the spectra and to provide inverse variance weights for the deconvolution procedure. This least squares deconvolution uses a line list which best matches the spectral type of each star. The wavelength positions and line depths used were taken from VALD (Vienna Atomic Line Database; Kupka & Ryabchikova, 1999). Any deficiencies in the line list data for cool M stars, such as missing opacities, should not affect the final sin values since the same list is used on the non-rotating template star LHS1950. The use of fewer model lines for deconvolution than actually observed will simply give rise to profiles with lower S/N than a more complete model would afford. The line strengths of the final profiles may also vary from star to star but can be corrected for by scaling the non-rotating template to the line strength of each stellar deconvolved profile. The method of least squares deconvolution is used to determine the mean line profile which when convolved with the line depth pattern gives the optimal match to the observed spectrum.

Fig. 2 represents the final deconvolved line profile for G 121-028 (solid line) with velocity on the -axis and normalized flux on the -axis. G 121-028 is one of the slower rotating stars in our sample ( sin =3.80.7 km s-1) as the narrow line profile shows. To determine the sin values we perform a Levenberg-Marquardt least squares minimisation using MPFIT in IDL (Markwardt, 2009) to find the best fit for each observed line profile. The fit is represented by the dashed line in the figure and for this example a reduced 2 (ν2) of 1.2 is found. This best fit is used to determine both the profile centroid and scaling factor. The centroid allows each star to be shifted to the rest frame for use in the template comparison, whilst the scaling factor allows us to scale our non-rotating template to match the profile strength of each star. LHS1950 was found to be our narrowest profile (determined from the full width at half maximum (FWHM) of the best fit to each profile) and hence below the resolution limit of the instrument. This template is then broadened in steps of 0.5 km s-1, between velocities of 0.5-50 km s-1, using a grid of rotational profiles with a limb darkening coefficient of 0.6. An example is shown in Fig. 3. A zoomed in region of the profile of G 121-028 is represented by the dotted curve, with template profiles marked by the solid curves. From inner to outer (narrowest to broadest) the solid curves have been broadened by rotational profiles of 3.5, 5.0 and 10.0 km s-1 respectively. This highlights the good fit between the inner profile compared to the outer profiles within the uncertainties and highlights the robust nature of the fitting technique. All rotational profiles are generated following the description in Gray (1992), and a 2 value is determined at each sin step.

Fig. 4 shows our 2 fit to the data points in the analysis of the star G 180-011. Each filled circle represents one of the 0.5 km s-1 steps used to broaden the template to fit the profile of G 180-011. The solid curve represents the best quadratic fit to the data, and following the procedure in Jenkins et al. (2008), the minimum of this curve is the measured sin , highlighted here by the vertical solid line. The vertical dotted, dot-dashed and dashed lines represent the 1, 2 and 3 internal uncertainties respectively. The 1 uncertainty value was determined by measuring the width of the curve at a 1 step (i.e. = + 1), after the curve has been broadened by a factor determined from the difference between the minimum of the ν2 and 1 (where ν2 is the best fit). Due to the nature of the dataset this factor has a median of only 2.1 and standard deviation of 1.5, indicating the goodness of the methodology. We employ this artificial broadening to the 2 curve to help alleviate uncertainties that are difficult to address in the analysis procedure e.g. macroturbulence variations, spectral type differences, etc. For G 180-011 shown in the figure the formal uncertainty is found to be 0.4 km s-1. We use this procedure to determine all 1 uncertainties quoted in Table 3.
The 1 uncertainties mentioned show we have good internal precision and since we have a few stars where multiple observations were taken we can test this in a brute force manner by looking at the values for these multiple measurements individually. When we do this we find that the sin s tend to agree to within the uncertainties determined by the 2 fitting procedure on each individual measurement. This gives us confidence in the analysis procedure. We note that for the star GJ1253 the sin values agree to within 1, which for this star was 1 km s-1, and as these were measured over two observations a month apart, they are probably the best indicator of the overall random uncertainties in the analysis procedure. Therefore, all velocities for objects 10 km s-1 are accurate to 1 km s-1. For the objects rotating much faster than this, particularly above 20 km s-1, it is difficult to fit their profiles to better than 10-20% at the adopted resolution and S/N and therefore this should be taken as the accuracy for such fast rotators.
3.1 Instrumental Profile
Although we estimate our resolution limit to be around 2.5 km s-1, we note that this is not the case for all of our sample. Since we use a fixed template spectrum that was measured on our first night and not on every night of our observations, there will be effects due to the changes of the instrumental response. To monitor this we used the telluric lines in each of our spectra as a proxy for the instrumental profile (IP). We assume that the intrinsic width of weak telluric lines are smaller than the instrumental resolution. We then performed the same fitting routine to these deconvolved profiles which returned an instrumental FWHM for each stellar spectrum. We decided not to use the arc lines for the IP measurements since the calibrations are taken through a different optical path than the science images and therefore would not accurately model the intrinsic instrumental width (see Tull, 1998 for HRS design). This procedure allowed us to determine that there was an increase in the instrumental width of almost a factor two between 2007 August 9th and 2007 October 17th due to poor thermal control in the HET spectrograph that lead to PSF instability through focus drift. The stars observed between these dates have a typical resolution limit of around 4-5 km s-1, therefore we employ a correction to each star to correct for the effects of the broadening of the IP.

Fig. 5 shows the average change in the FWHM of a selection six stars with the highest S/N ratios as a function of sin . Each of the data points mark the average of the FWHM difference (FWHM-FWHM0) for the six stars, along with the associated scatter of the values, after broadening by rotation profiles in steps of 0.5 km s-1, where FWHM0 is the initial FWHM before any broadening has been applied. The solid line shows the best straight line fit to the data that we employed to correct for the IP, and is described by 1.08-2.03, with an RMS scatter of only 0.46 km s-1.
To employ these corrections we determine the difference between the template telluric FWHM and that of each star. We then use the fit to determine which sin profile we must broaden the template profile by initially to correct for the changing IP width. Due to our resolution this only becomes significant on the data mentioned above where the IP almost doubled in width, leaving such stars with a resolution of 4.5 km s-1. These fits can also be used to determine the actual sin from the change in the FWHM compared to the template, at least in the low sin regime, and a test of this reveals agreement between both methods. The fits could be extended into the high sin regime in order to use this method to determine the rotation velocities for rapidly rotating stars also. All sin s and their associated uncertainties are shown in column 11 of Table 3, with the telluric FWHMs shown in column 12 for reference.

Fig. 6 shows the overall spread in the measured sin values as a function of the changing IP of the instrument. As mentioned above the change in the IP is monitored by measuring the FWHM of the telluric lines in each spectrum (FWHMTell) and from the plot there appears no significant correlation between measured rotation values and the width of the IP. The linear correlation coefficient (r) for the entire sample is -0.12 and is still only 0.36 when removing all stars with measured upper limits, which are represented in the figure by the downward pointing arrows. This test highlights the lack of any significant correlation between the measured sin s and the changing width of the IP. In fact, only one of the stars measured during the period of increased IP values is found to be above the detection threshold of our method, and as will be seen later, this correlates with the presence of H in emission in this star.
None of these objects have previously determined sin s with which to compare our values for an accuracy check. However, Rockenfeller et al. (2006) determined the -band variability for the star LHS2930 and found the period to be 132hrs. They also quote the radius of the star to be 0.33R⊙, from which we can estimate the rotation velocity assuming the variability is induced by the rotation of surface features such as star spots. Estimating this velocity in pure spherical geometry returns a value for the equatorial rotation velocity of 30 km s-1. We measure a velocity of 18.71.5 km s-1, which is significantly lower than the photometrically derived value. We note that the deconvolved line profile for this star is flagged as low S/N. However, given these values this would indicate the star is inclined to our line of sight by around 51o (39o). Marcy & Butler (1996) show that for random stellar alignments, 68% of stars will have inclinations to our line of sight of below 47o, with 95% having inclinations above 20o, placing LHS2930 in between this 1 and 2 result and in agreement with the 1 value within the estimated uncertainty.
3.2 H Absorption/Emission
In addition to selecting against stars with a large sin , one might also like to monitor each star’s magnetic activity through the absorption or emission in the H line. The correlation between H emission, age, activity and rotation velocity has been well studied (e.g. Mohanty & Basri, 2003; Reiners & Basri, 2008 and refs therein), however the magnetic field structure of M dwarfs, particularly slowly rotating M dwarfs, could be complex, with magnetically active regions rotating in and out of view and the presence of strong flaring events. Also there is the possibility that a small percentage of our M dwarfs are being viewed close to pole-on and instead of measuring their true sin , which could be very high, we measure a smaller value and place these in the good planet search target bracket. Therefore, we searched for any emission, and also significant absorption, in the H line (6562Å) in each of our target stars. 24 (43%) stars were found to show H emission, which includes the double profiles found for the active binary stars, and since such stars could be young and highly active, these may not be ideal stars to include in a precision radial-velocity planet search. Of these only six have rotation velocities below 10 km s-1 (12% of the total). However, we do caution that we might be viewing active regions on these stars, or flaring outbursts, since numerous M stars across the spectral domain have been found to exhibit such phenomena (e.g. see Tinney et al., 1998; Martín & Ardila, 2001; Osten et al., 2005). Further measurements may reveal these to vanish and therefore more epochs may be required to test if such stars have continuous H emission and are probably highly inclined young and active stars, or are simply going through a flaring event. Reiners (2009) has shown that flares only create significant noise at velocity precisions below 10 m s-1 for moderate events and at the level of a few hundreds of m s-1 for giant flares. However, giant flares are also heavily correlated with H variation and so can be easily removed from a radial-velocity campaign, albeit at the cost of precious observing time. Indeed, we may have viewed such a scenario in one of our stars GJ1253.

Fig. 7 shows two epochs of spectroscopic measurements of the region around the H line for the star GJ1253. The upper panel is the first observation, made on 08/30/2008, whereas the lower panel shows the same region only one month later (09/26/2008). In the first observation there is no indication of any H emission present, however only 27 days later when the second measurement was obtained, there is clear evidence for the H line in emission. Such a short period evolution of the line, coupled with the relatively low sin of the star ( 4.5 km s-1) may indicate that a small magnetic region is rotating in and out of view. If confirmed continuous monitoring of such H line changes could lead to the true rotation period of the star, removing the sin degeneracy and giving both the true velocity and, for any discovered companions, their true masses without the need for continuous photometric monitoring. Note that Byrne et al. (1996) found variable H emission in the active M star HK Aquarii which they attribute to prominence like clouds above the stellar surface that have characteristic timescales less than half the photometrically determined rotation period. It may be the case that such variability of H flux is mainly generated through flares or a changing magnetic field structure. Indeed, H variability for M stars is significant across the spectral domain, even on relatively short time scales (60 minutes). Lee et al. (2009) find that 80 of their mid-to-late M star sample exhibited statistically significant H variability. Therefore, if any correlation does exhist between H variability and rotation velocity the characteristics must be sufficiently large such that typical short period small scale variations do not mask it out.
Finally, we also searched for significant H absorption and found eight stars (14%) that show significant absorption. All of these have sin s that would meet our criteria for planet search selection, as would be expected from a rotation-activity connection. Only, 2 out of the 8 objects that exhibit significant H absorption are below our resolution limit, with a further 3 in agreement with the adopted resolution limit to within the estimated total uncertainty of the analysis technique. All stars with no H emission would meet our criteria for planet search selection, with the largest rotation rate of these coming from the M5 dwarf GJ1182 ( sin =6.80.5 km s-1). Column 13 of Table 3 shows the H emission flag, where either a detection was made or not, and stars with no significant emission which have asterisks show evidence for H absorption.
3.3 Spectroscopic Binaries
| Star | Spec Type | (km s-1) | sin pri (km s-1) | sin sec (km s-1) | H Emission | ||||
|---|---|---|---|---|---|---|---|---|---|
| GJ1080 | 12.81 | 8.98 | 8.50 | 8.22 | M3.0 | 28.440.28 | 3.0 | 3.0 | No |
| GJ3129 | 14.27 | 9.65 | 9.06 | 8.80 | M4.5 | 89.360.78 | 5.20.1 | 6.60.3 | Yes - Double |
| Gl802 | 14.67 | 9.56 | 9.06 | 8.75 | M5.0 | 150.031.19 | 6.40.4 | 4.5 | Yes - Double |
| LHS3080 | 14.28 | 9.67 | 9.11 | 8.82 | M4.5 | 18.350.32 | 3.0 | 3.80.1 | Yes - Single |
There is the possibility that stars with miss shapen profiles are spectroscopic binaries of similar spectral type or stars with powerful magnetic fields. Fig. 8 shows blended profiles found for both GJ1080 (upper panel) and LHS3080 (lower panel). It is clear that for both of these systems there is a primary deconvolved profile and a weaker secondary. To test if these are real rather than deconvolution artifacts, we split the spectra into two wavelength ranges, one spectrum covering the blue orders and one covering the red orders. By deconvolving both the red and blue spectra independently, we were able to confirm that these stars still exhibit double line profiles, lending weight to fact that the double profiles are due to real phenomena. The spectra for GJ1080 shows double-lined profiles for atomic and molecular lines. The double-lined profiles for LHS3080 were difficult to confirm by eye in the spectrum. Along with both of these, there are another two binary systems, those of GJ3129 and Gl802. Both of these stars have double profiles, but with much wider separations, even though they exhibit noisier spectra. These are more clear cases than the previous two since they also have double H emission profiles.
Gl802 was known to have a low-mass companion with an orbital period of 3.140.03 yrs (Pravdo et al., 2005), which was directly imaged by Lloyd et al. (2006). In addition, Ireland et al. (2008) has recently found this star to be part of a triple system, with a short period (19 hrs) spectroscopic companion. Our final deconvolution for this star is very noisy, in part due to the blended light from three different components with different spectral profiles. We do note however that there are two strong profiles in the final deconvolution (properties listed in Table 1) and potentially a further two weaker profiles. The weak profiles are only borderline significant due to the associated noise, but one might explain the short period binary found by Ireland et al. and the other, which is widely separated from the profile of Gl802A, could be an additional longer period companion.
McCarthy & Zuckerman (2004) surveyed both GJ3129 and LHS3080 as part of their AO campaign to detect substellar companions to a host of nearby young M dwarfs. They found no viable candidate to these stars between around 5′′ to 15′′ arcseconds. The lack of any viable detection around these, apparently young, stars is probably explained by the close separation of the objects, since the detectability of spectroscopic binaries are skewed towards short period companions. Indeed, the LHS3080 profiles are blended with each other and since the secondary profile is significantly weaker than the primary, it is probably a much later and fainter companion object. The properties of these spectroscopic binaries are listed in Table 1, which include the Hipparcos , 2MASS , and apparent magnitudes, their spectral types, the velocity separation of the double peaks along with their combined uncertainties, the sin estimates for both the primary star ( sin pri) and the secondary ( sin sec) and the H flag. Note the small uncertainties are an artifact of the blended fitting procedure and do not necessarily mean these values are more precise than the single profiles.

4 Temperature, Mass and Metallicity
When performing radial-velocity searches for exoplanets other characteristics of the star determine radial-velocity limits e.g. the stellar mass. The mass of the primary determines the lower limit to the planetary mass for a given radial-velocity amplitude and therefore knowledge of the mass of any planet search target star is essential. We have determined the stellar mass for the bulk of our sample by utilising relations between M star mass and their absolute magnitudes. To generate accurate absolute magnitudes we searched the Yale Trigonometric Parallax project (van Altena et al., 1995), the RECONS list (Henry et al., 2006) and any parallaxes in the Gliese Catalogue of Nearby Stars to obtain accurate parallax measurements for all our candidates. The parallaxes, along with their associated uncertainties, are shown in column 8 of Table 3 and these were used to determine the absolute magnitudes by converting them to distance and measuring the distance modulus. The photometry was acquired using both the Simbad222Simbad website: http://simbad.u-strasbg.fr/simbad/ and Vizier333Vizier website: http://webviz.u-strasbg.fr/viz-bin/VizieR astronomical databases. The near infrared photometry was taken from the 2MASS catalogue (Skrutskie et al., 2006) and the magnitudes were converted to using the calibrations in Carpenter (2001). The absolute and magnitudes were then input into the empirical mass relations from Delfosse et al. (2000), and two measurements of the mass for each star were determined. Both these measurements were averaged to get the final combined mass estimates for all objects with known parallax and their uncertainties were taken as the standard deviation of the two measurements. The uncertainties are typically 10-15%, with a few of the closest stars having uncertainties down to the 1% level. Both the masses and their uncertainties are shown in column 9 of Table 3.
Along with the mass, both the effective temperatures and metallicities ([Fe/H]) were estimated for the sample. The effective temperatures were determined using the relation taken from Casagrande et al. (2008) and has a typical internal uncertainty of 17K, however the uncertainty on the overall accuracy of the technique will probably be substantially larger than this. The values with question marks next to them flag highly suspect effective temperatures. The [Fe/H] abundances were firstly determined photometrically using the colour magnitude relation in Bonfils et al. (2005). They quote the typical uncertainty for this method as 0.2 dex which we assign to all our metallicities shown in column 10 of Table 3. Casagrande et al. also provide metallicities using their method and these agree with the Bonfils et al. values within the quoted uncertainties. Note that recently Johnson & Apps (2009) claim that the Bonfils et al. relation may underestimate the metallicities of M dwarfs by as much as 0.3 dex. Finally, Table 3 also shows each star’s and photometry.
5 Results: sin Distributions

Fig. 9 shows the distribution of early-to-late M star rotation rates against their spectral type. The filled circles represent the stars in this work and the open circles represent literature sin s (from Stauffer & Hartmann, 1986; Marcy & Chen, 1992; Delfosse et al., 1998; Gizis et al., 2002; Mohanty & Basri, 2003; Bailer-Jones, 2004; Fuhrmeister & Schmitt, 2004; Jones et al., 2005; Reiners, 2007; West & Basri, 2009). All literature sin s are shown in Table 4 along with any measured magnitudes, 2MASS , and photometry, spectral types, effective temperatures, parallaxes, masses and [Fe/H] abundances, all determined using the same methods outlined above.
There is a large spread in sin across the mid M star regime (M4.0-M6.5) compared with early M stars (M4). The mid M objects range from almost as high as over 50 km s-1 and down as low as essentially zero km s-1. The median dispersion of the sin distributions in the spectral type bins between M0-M3 is 3.700.79 km s-1, compared to the median dispersion of 9.008.31 km s-1 for bins at M4-M9.5. However, if we allow for a spectral typing uncertainty of 0.5 sub-types and exclude both the M0 and M9.5 spectral bins, since they could be contaminated by K and L dwarfs, we find the dispersions are 3.700.87 km s-1 and 9.004.37 km s-1 respectively. A K-S test is run to compare these distributions and this returns a D-statistic of 0.539, giving an extremely low probability of only 1.396x10⁻⁸% that the rotation rates for stars between M0.5-M3 are drawn from the same parent population as those between M4-M9. Also, a large fraction of stars with spectral types below M6.5, and particularly below the convective boundary region, only have measured upper limits. This will bias this result towards a non-correlation and so we can expect that with further detections at low velocities for these stars, this correlation will become more pronounced.
This step from low to high dispersions between M3 to M4 spectral types is thought to be due to the increased spin-down timescale towards decreasing mass (Delfosse et al., 1998; Mohanty & Basri, 2003) and that the spin-down timescale is a significant fraction of the age of the young disk. Indeed, Donati et al. (2008) and Morin et al. (2008) have shown that the magnetic field topologies of early M’s (M0-M3) and mid-M’s (M4) are significantly different, with the early M’s having mainly toroidal and non-axisymmetric poloidal fields, whereas the M4s mainly exhibit axisymmetric poloidal fields. This result indicates a change in the magnetic field properties at the classical boundary between partially radiative and fully convective envelopes. If the spin down times are governed by the magnetic fields in this regime then a differing sin distribution might be expected. It might be the case that axisymmetric poloidal fields interact with the stellar wind more weakly than the toroidal, non-axisymmetric fields, driving a less efficient braking mechanism. Interestingly, a probe of the spindown timescale and the mechanism driving it can be made if we take the Delfosse et al. and Mohanty & Basri sin and log(L/LBol) values (Mohanty & Basri show the activities in these two works to be in excellent agreement). We can use these values to trace the rotational history for the fully convective, mid-M star regime (M4-M7). When the stars are binned into their respective spectral types, the trend found between these two quantaties reveals a sharp saturation boundary (e.g. Fig. 9 in Mohanty & Basri). By using Eqn. 3.1 in West et al. (2009), one can use the activity values to gain a statistical insight into the age distribution of these samples. In particular, the saturation boundary changes as a function of spectral type, increasing in velocity with increasing spectral type. Table 2 shows the spectral type bins, along with the saturation boundary in velocity and activity lifetime () given in West et al. Due to the spindown of stars by the wind braking mechanism we can use this table to say that from a statistical footing, the average age of M4 stars with sin s 8 km s-1 is older than 5 Gyrs, M5s with velocities 10 km s-1, and M6s with velocities 12 km s-1, are older than 7 Gyrs and M7s with velocities 13 km s-1 are older than 8 Gyrs.
| Spectral Type | sin (km s-1) | (Gyr) |
|---|---|---|
| M4 | 8 | 5 |
| M5 | 10 | 7 |
| M6 | 12 | 7 |
| M7 | 13 | 8 |

Fig. 10 shows the sin values against spectral type for all stars in this study with a split made by their H status. The filled circles represent all stars with no significant H emission or absorption, the open circles represent stars with H absorption and the open stars represent objects with H emission. The rotation-activity connection suggests a correlation between H emission and the rotation velocity of cool M stars and this is clearly seen in this plot. All stars with sin 7 km s-1 are found to exhibit significant H emission. Indeed, we have just shown that, on average, mid-to-late M stars with velocities 8 km s-1 are still in their young, active phase of evolution. No stars later than M5 were found to exhibit H absorption, with five of these exhibiting no significant H emission (55%). Such numbers correlate with previous results which suggest a high frequency of active M stars towards the latest spectral types (e.g. Fleming et al., 2000; Mohanty et al., 2002), even though we find a similar fraction of active M stars in all of our spectral bins. However, in our final M6.5 bin both stars are found to exhibit H emission which agrees with the increasing trend of activity towards values approaching 100% at a spectral type of around M7. This increase in stars with H in emission towards later spectral types appears to be a product of the fraction of young disk stars in this regime and also the increase in activity lifetime with increasing spectral type. From Table 2 we see that both the activity lifetime and the time spent in a state of high rotation increases with increasing spectral type. Such trends would naturally give rise to a larger fraction of stars with H profiles in emission towards the latest M stars.
The filled stars in Fig. 9 represent the median values in each spectral bin along with their associated Poisson errors. The solid line connects the points and visually highlights the increasing trend towards later spectral types. Reid et al. (2002) suggest a flat distribution of rotation rates between stars of M6-M9, whereas larger samples indicate this may not be the case (Mohanty et al.; Reiners & Basri, 2008). The medians indicate a rising trend through the mid-to-late M dwarfs, flattening off towards the end. Due to the change in distributions at the fully convective boundary we perform two straight line fits to the medians in the spectral ranges M0-M3.5 and M4-M9. The best fit to the early M stars clearly shows a flat trend across the whole regime, whereas the fit to the late Ms show a rising trend, appearing to flatten towards the later M stars (note the curvature due to logarithmic plotting). The fits to the early and late M star samples are described by sin =0.09(0.30)xSpT+3.41(0.67) km s-1 and sin =2.10(0.53)xSpT-4.54(3.56) km s-1, with standard uncertainties, represented by the dotted lines in the plot, of 0.89 km s-1 and 2.79 km s-1 respectively. The total sample of less than 300 is still rather small, especially when binned. Indeed there appears a dearth of objects between M6.5-M8.5 with rotation rates above 15 km s-1, which may indicate another population change above M6.5. The evidence for this gap is weak at present due to the low number of stars in these spectral bins, therefore further observations and are needed and any biases studied to fully validate the existence of this feature.
At temperatures below around 2800K (approximately M6-M7 type objects) dust formation and opacity are important in stellar/substellar atmospheres (Tsuji et al., 1996; Jones & Tsuji, 1997; Tinney et al., 1998; Chabrier et al., 2000; Baraffe et al., 2002 and references therein). Berger et al. (2008) have shown that late-M stars mark a transition in the properties of the magnetic field and its dissipation, along with high temperature plasma being generated in the outer atmosphere. They go on to hypothesize that the stellar rotation may play a part in this process and indeed the difference shown here between the mid and late type M stars seems to add to this conclusion. A K-S test reveals a D-statistic of 0.639, or 5.413x10⁻⁶%, that stars in the range M0.0-M6.5 and those in the range M7.0-M9.5 are drawn from the same parent distribution. However, given that we have already shown there to be a large difference between early Ms (M0-M3.5), this will bias this probability test. When we remove all stars earlier than M4 we find a D statistic of 0.544, which relates to a probability of only 1.437x10⁻³% that these are drawn from the same parent population. This 5 result may indicate that at temperatures when dust opacity becomes important there is a change in the rotational braking mechanisms and hence the magnetic properties of ultracool dwarfs. This might give rise to the flattening trend indicated between M6.5-M9 stars, however a more comprehensive study is needed, particularly to decouple the age of these stars by studying the space motion to determine if they are young or old disk stars. Also the biases of the literature surveys are important. For instance, studies like those of West & Basri (2009) focus only on selecting inactive, and hence slowly rotating, late type M stars. In addition, current models show that the late M star regime can also be populated by young brown dwarfs. Finally, this relation also suffers from the lack of low sin detections already mentioned above, even more so given the M6.5 detection boundary. Therefore we expect this result might also become more pronounced with further low sin detections at spectral types below M6.5.
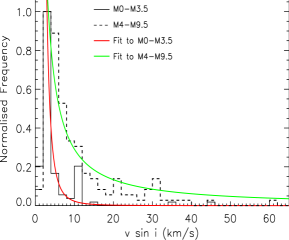
The normalized distribution of sin s are represented by the histograms in Fig. 11, where the solid histogram is for all stars in the spectral range between M0-M3.5 and the dashed histogram is for all stars in the range M4-M9.5. These include all values determined in this work combined with those in the literature. It is apparent that both distributions peak at low rotation rates (3 km s-1), with peak values of 55 and 42 stars respectively. We find that the total number of sin s 10 km s-1 is 198 and these should represent useful stars for future near infrared radial-velocity planet search projects such as PRVS. Bouchy et al. (2001) show that the information content drops by a factor of 3.5 between rotation velocities of 2-10 km s-1, making 10 km s-1 a reasonable M star radial-velocity selection cut. This sample is still large (124) when we include all mid-to-late M stars in the range M3-M9.5 (stars where obtaining optical precision radial-velocities becomes extremely difficult). Note the binary systems have been left out of Figs. 11 and 9 since the combined luminosities will generate inaccurate photometry and therefore inaccurate spectral types. Also, binary systems like these make radial-velocity exoplanet searches much harder since any small planetary signature is masked by the large short period binary velocity, meaning these are not ideal planet search targets for precision radial-velocity programs moving into an unexplored parameter space.
Comparing the distributions of both histograms helps to probe the possible changing rotation properties of M stars at the fully convective boundary. We have employed two power law fits to each distribution separately in order to test the changing velocity distribution between these two regimes. The red (dark grey)444The colours in brackets relate to the printed document, whereas the colours in the text are for the online edition of the article. curve is fit to the sample of early M dwarfs between M0-M3.5, whereas the green (light grey) curve is fit to the mid-to-late M dwarf sample. The fits are made to the bins by including Poisson uncertainties which are not shown in the plot for clarity. It can be seen that the fit to the early M stars drops much more rapidly than the fit to the later Ms. The power laws are described by N/ sin -3.13 for the early Ms, whereas for the later Ms it is only found to be -1.12, highlighting the differing steepness of each slope. The early Ms have a much longer tail than the later Ms due to this faster decay of the distribution and this is also probably an underestimate since we included all upper limits in the data to increase the sample size, which included a number of stars from the Stauffer & Hartmann (1986) sample with detection limits of 10 km s-1. We note that the curvature of these slopes are also affected by the activity lifetimes shown in Table 2 since they change with spectral type.
The difference of 2.01 in the exponent between the two spectral samples allows us an insight into the efficiency of the braking mechanism between partially and fully convective stars, assuming the larger measured rotation in the later M star sample is not due to increased line blending from increased molecular bands and instrumental resolution arguments. Delfosse et al. (1998) have shown that the majority of rapidly rotating mid-M stars are members of the young disk population, whereas the older population tend to rotate more slowly. If this is indeed the case, then the braking mechanism is at play in later M stars but the efficiency has dropped across the fully convective boundary. As mentioned earlier, the change in the field topology between the partially and fully convective boundary is probably the driving factor which governs the efficiency of the wind braking mechanism since Reiners & Basri (2007) have shown that fully convective stars produce field strengths as strong as partially convective stars. To better probe the braking mechanism in this fashion, in addition to gaining more data, it is necessary to also fold in an age proxy for the sample, and decouple both the young and old disk populations to compare these objects. Along with this a better understanding of the activity lifetimes and how these change with spectral type should be considered. More magnetic field topology studies are required for later M stars which can help to confirm if the later Ms also have axisymetric poloidal fields and add weight to the topology argument. Finally, more detailed testing of changes around the dusty regime (M6.5) where stars can also be young brown dwarfs might usefully be investigated.
| Star | Spec Type | TEFF (K) | (mas) | M/M⊙ | [Fe/H]phot | sin (km s-1) | FWHMTell (km s-1) | H Emission | ||||
|---|---|---|---|---|---|---|---|---|---|---|---|---|
| G121-028 | 14.57 | 9.94 | 9.31 | 9.02 | M4.5 | 2948 | 54.008.00 | 0.2000.005 | – | 3.80.7 | 7.2 | No* |
| G180-011 | 13.68 | 8.93 | 8.26 | 8.04 | M4.5 | 2913 | 92.0014.00 | 0.1840.003 | – | 21.90.4 | 6.8 | Yes |
| GJ1029 | 14.81 | 9.49 | 8.88 | 8.55 | M5.0 | 2765 | 79.303.00 | 0.1580.016 | – | 4.10.8 | 7.2 | No |
| GJ1034 | 15.05 | 10.70 | 10.17 | 9.91 | M4.0 | 3035 | 48.104.50 | 0.1660.025 | – | 4.5 | 10.9 | No* |
| GJ1055 | 14.86 | 9.93 | 9.33 | 9.07 | M5.0 | 2863 | 83.904.00 | 0.1330.010 | – | 4.70.7 | 7.5 | No |
| GJ1078 | 15.52 | 10.70 | 10.19 | 9.85 | M4.5 | 2893 | 48.004.50 | 0.1580.006 | – | 7.20.9 | 7.6 | Yes |
| GJ1119 | 13.32 | 8.60 | 8.03 | 7.74 | M4.5 | 2922 | 96.902.70 | 0.2000.006 | – | 4.00.7 | 6.8 | Yes |
| GJ1134 | 12.96 | 8.49 | 8.01 | 7.71 | M4.5 | 2996 | 96.702.30 | 0.2120.007 | – | 4.10.7 | 7.1 | No* |
| GJ1182 | 14.30 | 9.43 | 8.94 | 8.62 | M5.0 | 2880 | 71.703.40 | 0.1800.003 | – | 6.80.5 | 6.5 | No |
| GJ1186 | 15.29 | 10.58 | 9.97 | 9.65 | M4.5 | 2924 | 53.504.10 | 0.1570.008 | – | 3.90.6 | 7.8 | No |
| GJ1187 | 15.52 | 10.21 | 9.64 | 9.27 | M5.5 | 2767 | 89.004.60 | 0.1140.006 | – | 13.60.6 | 6.3 | Yes |
| GJ1223 | 14.89 | 9.72 | 9.19 | 8.89 | M5.0 | 2802 | 83.503.90 | 0.1390.002 | – | 4.5 | 10.0 | No* |
| GJ1250 | 14.88 | 9.96 | 9.40 | 9.08 | M4.5 | 2727 | 46.806.20 | 0.2130.023 | 0.03 | 15.70.4 | 8.1 | Yes |
| GJ1253 | 14.04 | 9.03 | 8.48 | 8.10 | M5.0 | 2842 | 107.503.60 | 0.1520.002 | – | 4.5 | 12.1 | No/Yes |
| GJ1268 | 14.94 | 10.16 | 9.60 | 9.30 | M4.5 | 2904 | 62.703.60 | 0.1570.008 | – | 4.5 | 11.5 | No |
| GJ2045 | 15.28 | 10.21 | 9.69 | 9.37 | M5.0 | 2827 | – | – | – | 4.60.3 | 7.0 | No |
| GJ3028 | 16.09 | 10.28 | 9.69 | 9.33 | M5.5 | 2654 | 79.303.70 | 0.1150.005 | – | 4.5 | 12.9 | No |
| GJ3104 | 12.83 | 9.14 | 8.52 | 8.28 | M3.0 | 3289 | 41.003.00 | 0.3860.001 | -0.20 | 4.00.3 | 7.6 | No* |
| GJ3128 | 15.61 | 9.84 | 9.25 | 8.93 | M6.0 | 2662 | 112.003.20 | 0.1050.002 | – | 4.5 | 12.3 | No |
| GJ3147 | – | 9.98 | 9.35 | 9.01 | M5.0 | 2380∗ | – | – | – | 28.20.7 | 11.1 | Yes |
| GJ3153 | 14.78 | 10.06 | 9.56 | 9.20 | M4.5 | 2922 | 41.0017.00 | 0.2340.021 | 0.00 | 23.30.7 | 7.0 | Yes |
| GJ3172 | 15.16 | 10.55 | 9.97 | 9.69 | M4.0 | 2954 | 40.204.30 | 0.2000.001 | – | 4.90.9 | 7.4 | Yes |
| GJ3181 | 16.86 | 10.97 | 10.52 | 10.19 | M6.0 | 2636 | 68.503.50 | 0.1000.006 | – | 6.20.8 | 7.1 | No |
| GJ3225 | 14.96 | 10.12 | 9.52 | 9.25 | M4.5 | 2888 | 60.009.00 | 0.1640.002 | – | 21.90.6 | 8.8 | Yes |
| GJ3234 | 16.67 | 12.05 | 11.54 | 11.26 | M5.0 | 2951 | 34.604.70 | 0.1290.023 | – | 4.5 | 11.9 | No |
| GJ3311 | 16.45 | 11.56 | 11.06 | 10.76 | M6.0 | 2874 | 52.100.90 | 0.1100.019 | – | 4.5 | 11.1 | No |
| GJ3396 | 14.83 | 9.68 | 9.12 | 8.81 | M5.0 | 2807 | 90.0015.00 | 0.1340.003 | – | 39.61.7 | 7.7 | Yes |
| GJ3421 | 13.30 | 8.54 | 8.09 | 7.78 | M5.0 | 2910 | 108.502.10 | 0.1800.004 | – | 4.70.6 | 7.4 | No* |
| GJ3444 | 15.16 | 11.92 | 11.38 | 11.09 | M6.0 | 3519 ? | 55.004.00 | 0.1250.057 | – | 4.5 | 10.3 | No |
| GJ3515 | 15.40 | 10.68 | 10.08 | 9.80 | M4.5 | 2922 | 46.0017.00 | 0.1680.005 | – | 13.10.7 | 7.2 | Yes |
| GJ4030 | 13.54 | 9.32 | 8.63 | 8.45 | M3.5 | 3079 | 44.804.10 | 0.3120.020 | -0.04 | 4.5 | 10.5 | No* |
| GJ4108 | 15.37 | 10.75 | 10.24 | 9.97 | M4.5 | 2951 | 47.304.10 | 0.1590.016 | – | 4.5 | 10.6 | No |
| GJ4345 | 16.10 | 11.09 | 10.48 | 10.17 | M5.0 | 2842 | 41.603.20 | 0.1520.001 | – | 9.81.1 | 6.9 | Yes |
| GJ4385 | 16.10 | 10.87 | 10.26 | 9.93 | M5.0 | 2787 | 51.900.90 | 0.1360.002 | – | 4.5 | 12.0 | No |
| Gl359 | 14.20 | 9.63 | 9.09 | 8.81 | M4.5 | 2966 | 79.003.80 | 0.1620.016 | – | 3.21.1 | 7.0 | No |
| Gl585 | 13.68 | 9.11 | 8.62 | 8.30 | M4.5 | 2966 | 85.102.90 | 0.1840.009 | – | 3.10.5 | 6.4 | No* |
| LHS252 | 15.05 | 9.61 | 9.00 | 8.67 | M5.5 | 2737 | 99.803.40 | 0.1260.003 | – | 4.00.5 | 7.4 | Yes |
| LHS265 | 15.11 | 10.26 | 9.70 | 9.40 | M4.5 | 2885 | 64.404.00 | 0.1470.008 | – | 3.90.8 | 7.4 | No |
| LHS302 | 15.14 | 10.29 | 9.74 | 9.46 | M5.0 | 2885 | 57.203.70 | 0.1580.006 | – | 2.5 | 7.0 | No |
| LHS1785 | 14.54 | 10.04 | 9.51 | 9.18 | M4.5 | 2987 | 58.801.90 | 0.1800.012 | – | 4.50.6 | 6.8 | No |
| LHS1809 | 14.48 | 9.35 | 8.77 | 8.44 | M5.0 | 2812 | 107.702.60 | 0.1330.003 | – | 4.31.2 | 6.4 | No |
| LHS1857 | 14.22 | 9.79 | 9.31 | 8.99 | M4.5 | 3009 | 54.702.40 | 0.2090.009 | – | 4.00.5 | 7.3 | No |
| LHS1950 | 14.75 | 9.97 | 9.40 | 9.09 | M4.5 | 2904 | 62.703.10 | 0.1690.002 | – | 2.5 | 7.3 | No |
| LHS2090 | – | 9.44 | 8.84 | 8.44 | M6.5 | 2753∗∗ | – | – | – | 20.00.6 | 6.7 | Yes |
| LHS2206 | 14.05 | 9.21 | 8.60 | 8.33 | M4.5 | 2888 | 108.392.30 | 0.1430.009 | – | 16.50.4 | 7.1 | Yes |
| LHS2320 | 14.40 | 9.83 | 9.28 | 8.94 | M5.0 | 2966 | 46.008.00 | 0.2390.016 | -0.03 | 19.10.2 | 6.3 | Yes |
| LHS2930 | – | 10.79 | 10.14 | 9.79 | M6.5 | 2906∗∗ ? | – | – | – | 18.71.5 | 8.2 | Yes |
| LHS3075 | 14.17 | 9.59 | 9.02 | 8.72 | M4.5 | 2963 | 51.104.40 | 0.2390.015 | -0.04 | 2.5 | 5.8 | No |
| LP205-49 | 18.71 | 14.70 | 14.19 | 13.90 | M3.5 | 3156 | – | – | – | 45.42.0 | 7.7 | Yes |
The symbol relates to deconvolved profiles that show either weak evidence for a possible binary component, but not significant enough to be included in the binary table, however it may affect the deconvolved profile enough to give rise to a larger rotation velocity than the star has, or stars where the deconvoluted profile has low S/N and the construction is of lower quality, particularly in the wings, which again can give rise to an inaccurate value for the sin . The question marks after the effective temperature are used to flag highly suspect values. The asterisks in the H column represent stars with significant absorption. The uncertainties shown for the sin s represent the formal uncertainties on each parameter fit. However, as explained in the text, the actual uncertainties for high S/N spectra of objects rotating 20 km s-1 is 1 km s-1, increasing to around 10-20% for the fastest rotating objects.
| Star | Spec | TEFF | M/M⊙ | [Fe/H] | sin | Source | |||||
|---|---|---|---|---|---|---|---|---|---|---|---|
| Type | (K) | (mas) | (km s-1) | ||||||||
| 2MASS-J1242081+290027 | – | 16.42 | 16.03 | 15.45 | M8.0 | – | – | – | – | 7.0 | (f) |
| 2MASS-J1254012+250002 | – | 15.29 | 14.80 | 14.81 | M7.5 | – | – | – | – | 13.0 | (f) |
| 2MASS-J1255583+275947 | – | 15.42 | 14.73 | 14.58 | M7.5 | – | – | – | – | 9.0 | (f) |
| AD Leo | 9.43 | 5.45 | 4.84 | 4.59 | M4.5 | 3157 | 213.004.00 | 0.3900.032 | 0.04 | 3.0 | (j) |
| BRI0021-0214 | 19.60 | 11.99 | 11.08 | 10.48 | M9.5 | 2092 | 80.003.40 | 0.1030.031 | – | 34.0 | (f) |
| BRI1222-1222 | – | 12.57 | 11.82 | 11.35 | M9.0 | – | – | – | – | 8.0 | (f) |
| CTI0126+57.5 | – | – | – | – | M9.0 | – | – | – | – | 11.1 | (f) |
| CTI0156+28 | – | 14.47 | 13.84 | 13.54 | M6.5 | – | – | – | – | 9.0 | (f) |
| CTI115638.4+28 | – | 14.32 | 13.72 | 13.34 | M7.0 | – | – | – | – | 10.5 | (f) |
| CTI1539+28 | – | 15.49 | 15.00 | 14.58 | M6.5 | – | – | – | – | 7.0 | (f) |
| CTI1747+28 | – | 15.50 | 15.04 | 14.52 | M6.5 | – | – | – | – | 45.0 | (f) |
| CTI2332+27 | – | 15.71 | 15.34 | 14.86 | M6.0 | – | – | – | – | 25.0 | (f) |
| DENIS-J0021-4243 | – | 15.80 | 15.39 | 15.24 | M9.5 | – | – | – | – | 17.5 | (f) |
| DENIS-1048-3955 | – | 14.60 | 14.23 | 14.19 | M8.0 | – | – | – | – | 25.0 | (h) |
| DENIS-J1207+0059 | – | 10.38 | 10.13 | 10.06 | M9.0 | – | – | – | – | 10.0 | (f) |
| DENIS-J1431596-195321 | – | 15.34 | 14.73 | 14.45 | M9.0 | – | – | – | – | 37.1 | (g) |
| ESO207-61 | 20.99 | 13.23 | 12.54 | 12.06 | M8.0 | – | 70.004.00 | 0.1390.088 | – | 10.0 | (f) |
| G087-09B | – | 10.40 | 9.79 | 9.76 | M4.0 | – | – | – | – | 6.0 | (i) |
| G089-032 | – | 8.18 | 7.61 | 7.28 | M5.0 | – | – | – | – | 7.9 | (f) |
| G099-049 | – | 6.91 | 6.31 | 6.04 | M4.0 | – | – | – | – | 7.4 | (f) |
| G165-08 | 12.19 | 7.56 | 7.00 | 6.72 | M4.0 | 2951 | 126.00 | 0.2420.018 | -0.02 | 55.5 | (f) |
| G188-38 | 11.98 | 7.64 | 7.04 | 6.78 | M4.0 | – | – | – | – | 29.4 | (f) |
| GJ65A | 12.57 | – | – | – | M5.5 | – | – | – | – | 31.5 | (i) |
| GJ65B | 12.52 | – | – | – | M6.0 | – | – | – | – | 29.5 | (i) |
| GJ166C | – | 6.75 | 6.28 | 5.96 | M4.5 | – | – | – | – | 5.0 | (i) |
| GJ630.1A | – | 8.50 | 8.04 | 7.80 | M4.5 | 2887∗ | – | – | – | 27.5 | (i) |
| GJ699 | – | 5.24 | 4.83 | 4.52 | M4.0 | – | – | – | – | 2.8 | (f) |
| GJ725A | 8.91 | 5.19 | 4.74 | 4.41 | M3.0 | 3276 | 286.101.80 | 0.3420.020 | -0.35 | 5.0 | (i) |
| GJ725B | 9.69 | 5.72 | 5.20 | 4.98 | M3.5 | 3172 | 286.101.80 | 0.2660.025 | -0.38 | 7.0 | (i) |
| GJ896A | 10.35 | 6.16 | 5.57 | 5.31 | M3.5 | 3090 | 151.903.70 | 0.3780.042 | 0.11 | 10.0 | (i) |
| GJ896B | – | 7.10 | 6.56 | 6.26 | M4.5 | – | – | – | – | 15.0 | (i) |
| GJ1002 | 13.73 | 8.32 | 7.79 | 7.44 | M5.5 | – | – | – | – | 3.0 | (f) |
| GJ1057 | 13.78 | 8.77 | 8.21 | 7.80 | M5.0 | 2706 | 120.003.50 | 0.1550.005 | – | 2.2 | (f) |
| GJ1093 | 14.83 | 9.16 | 8.55 | 8.23 | M5.0 | – | – | – | – | 2.8 | (f) |
| GJ1105 | 12.04 | 7.73 | 7.13 | 6.88 | M3.5 | – | – | – | – | 2.0 | (c) |
| GJ1111 | 14.81 | 8.24 | 7.62 | 7.26 | M6.5 | – | – | – | – | 11.0 | (f) |
| GJ1111 | 14.81 | 8.24 | 7.62 | 7.26 | M6.5 | – | – | – | – | 8.1 | (c) |
| GJ1151 | 13.26 | 8.49 | 7.95 | 7.61 | M4.5 | 2767 | 120.002.90 | 0.1740.001 | – | 4.1 | (f) |
| GJ1154A | 14.11 | 8.46 | 7.86 | 7.54 | M5.0 | – | – | – | – | 5.2 | (f) |
| GJ1156 | 13.79 | 8.52 | 7.88 | 7.54 | M5.0 | 2632 | 150.003.00 | 0.1390.006 | – | 9.2 | (f) |
| GJ1224 | 13.64 | 8.64 | 8.09 | 7.81 | M4.5 | 2711 | 130.003.70 | 0.1480.004 | – | 5.6 | (f) |
| GJ1227 | 13.40 | 8.64 | 8.05 | 7.71 | M4.5 | 2910 | 120.002.20 | 0.1670.002 | – | 2.3 | (f) |
| GJ1230B | 14.40 | 8.86 | 8.03 | 7.73 | M5.0 | 2714 | 120.007.20 | 0.1470.024 | – | 7.1 | (f) |
| GJ1245A | 13.41 | 7.79 | 7.19 | 6.82 | M5.5 | 2695 | 220.001.00 | 0.1290.010 | – | 22.5 | (f) |
| GJ1245B | 13.99 | 8.27 | 7.73 | 7.36 | M5.5 | 2673 | 220.001.00 | 0.1080.001 | – | 6.8 | (f) |
| GJ1286 | 14.68 | 9.15 | 8.51 | 8.15 | M5.5 | 2716 | 140.003.50 | 0.1160.001 | – | 5.7 | (f) |
| GJ1289 | 12.67 | 8.11 | 7.45 | 7.20 | M4.0 | 2969 | 120.002.90 | 0.2090.004 | – | 2.6 | (f) |
| GJ2005 | – | 9.25 | 8.55 | 8.24 | M6.0 | – | – | – | – | 9.0 | (f) |
| GJ2066 | 10.05 | 6.63 | 6.04 | 5.74 | M2.0 | 3420 | 114.003.90 | 0.4470.005 | -0.22 | 2.7 | (c) |
| GJ2069B | 13.40 | 8.62 | 8.05 | 7.72 | M4.0 | 2904 | – | – | – | 6.5 | (f) |
| GJ2097 | 12.54 | – | – | – | M1.5 | – | – | – | – | 3.7 | (c) |
| GJ3136 | 12.47 | 8.42 | 7.81 | 7.55 | M5.0 | 3141 | 70.004.00 | 0.3120.006 | -0.14 | 30.0 | (e) |
| GJ3304 | 12.51 | 8.17 | 7.62 | 7.30 | M4.0 | 3038 | 100.007.00 | 0.2430.002 | -0.14 | 30.0 | (e) |
| GJ3323 | 12.16 | 7.62 | 7.07 | 6.71 | M4.0 | 2975 | 163.006.00 | 0.1960.002 | – | 3.2 | (f) |
| GJ3378 | 11.71 | 7.47 | 6.95 | 6.62 | M3.5 | 3072 | 132.202.90 | 0.2550.002 | -0.18 | 2.7 | (c) |
| GJ3482B | 11.20 | 7.34 | 6.76 | 6.50 | M2.5 | 3216 | 59.007.00 | 0.5320.066 | – | 35.0 | (e) |
| GJ3622 | 15.60 | 8.86 | 8.26 | 7.90 | M6.0 | – | 220.003.60 | – | – | 3.0 | (f) |
| GJ3828B | – | 13.09 | 12.53 | 12.09 | M6.0 | – | – | – | – | 9.0 | (f) |
| GJ3877 | 17.05 | 9.97 | 9.31 | 8.93 | M7.0 | 2393 | – | – | – | 8.0 | (f) |
| GJ4281 | 17.14 | 10.77 | 10.22 | 9.81 | M6.5 | 2536 | 90.004.90 | 0.0930.005 | – | 7.0 | (f) |
| Gl14 | 8.94 | 6.39 | 5.75 | 5.56 | M0.5 | 4021 | 70.003.90 | 0.7210.029 | -0.30 | 2.6 | (b) |
| Gl15A | 8.07 | 5.25 | 4.48 | 4.02 | M2.0 | – | – | – | – | 2.9 | (c) |
| Gl15B | 11.04 | 6.79 | 6.19 | 5.95 | M6.0 | – | – | – | – | 3.1 | (c) |
| Gl26 | 11.06 | 7.45 | 6.86 | 6.61 | M4.0 | – | – | – | – | 2.9 | (b) |
| Gl48 | 9.96 | 6.30 | 5.70 | 5.42 | M3.0 | 3303 | 115.503.70 | 0.4800.030 | 0.04 | 2.4 | (c) |
| Gl49 | 9.56 | 6.23 | 5.58 | 5.37 | M1.5 | 3468 | – | – | – | 3.4 | (c) |
| Gl70 | 10.96 | 7.37 | 6.81 | 6.49 | M2.0 | 3335 | 90.005.10 | 0.4030.003 | -0.22 | 3.0 | (c) |
| Gl82 | 12.04 | 7.79 | 7.22 | 6.94 | M4.0 | 3069 | 78.504.90 | 0.3490.035 | 0.06 | 15.0 | (a) |
| Gl83.1 | 12.26 | 7.51 | 6.97 | 6.65 | M4.5 | – | – | – | – | 3.8 | (f) |
| Gl87 | 10.03 | 6.83 | 6.32 | 6.06 | M2.5 | 3542 | 86.707.40 | 0.5120.022 | -0.35 | 1.1 | (b) |
| Gl105B | 11.66 | 7.33 | 6.79 | 6.55 | M4.5 | 3042 | 129.404.30 | 0.2660.003 | -0.14 | 2.4 | (f) |
| Gl109 | 10.58 | 6.75 | 6.20 | 5.94 | M3.5 | 3228 | 130.004.20 | 0.3590.002 | -0.21 | 2.8 | (c) |
| Gl157B | 11.48 | 7.77 | 7.16 | 6.90 | M3.0 | 3280 | 70.005.20 | 0.4160.012 | -0.10 | 10.0 | (a) |
| Gl169.1A | 11.08 | 6.62 | 6.01 | 5.69 | M4.0 | 3000 | 180.000.80 | 0.2710.025 | 0.01 | 1.9 | (f) |
| Gl205 | 7.92 | 5.00 | 4.15 | 4.04 | M1.5 | – | – | – | – | 1.0 | (j) |
| Gl206 | 11.48 | 7.42 | 6.88 | 6.53 | M4.0 | 3137 | 70.003.90 | 0.4520.063 | 0.27 | 10.0 | (a) |
| Gl207.1 | 11.52 | 7.76 | 7.15 | 6.83 | M2.5 | 3258 | 60.005.20 | 0.4730.044 | 0.15 | 10.0 | (a) |
| Gl213 | 11.48 | 7.12 | 6.63 | 6.39 | M4.0 | – | – | – | – | 2.9 | (f) |
| Gl229A | 8.14 | 5.10 | 4.39 | 4.17 | M1/M2 | 3571 | 173.191.12 | 0.5830.005 | -0.09 | 1.0 | (j) |
| Gl232 | 13.06 | 8.66 | 8.16 | 7.89 | M4.5 | 3019 | 120.002.30 | 0.1680.023 | – | 3.1 | (f) |
| Gl234A | 11.10 | 6.38 | 5.75 | 5.46 | M4.5 | 2923 | 240.003.70 | 0.2240.020 | 0.00 | 6.0 | (f) |
| Gl251 | 9.89 | 6.10 | 5.53 | 5.26 | M4.0 | 3245 | 170.003.20 | 0.3720.002 | -0.18 | 2.4 | (c) |
| Gl268.3 | 10.83 | 7.01 | 6.44 | 6.17 | M0.0 | 3232 | 126.005.00 | 0.3370.007 | -0.25 | 2.5 | (d) |
| Gl273 | 9.89 | 5.71 | 5.22 | 4.83 | M3.5 | 3093 | 264.402.00 | 0.2860.007 | -0.12 | 0.0 | (j) |
| Gl277A | 11.87 | 6.77 | 6.18 | 5.90 | M3.5 | 2819 | 90.002.50 | 0.4130.142 | – | 10.0 | (a) |
| Gl277B | 11.79 | 7.57 | 6.99 | 6.74 | M4.5 | 3079 | 90.002.50 | 0.3380.026 | 0.00 | 10.0 | (a) |
| Gl285 | 11.12 | 6.58 | 6.01 | 5.67 | M4.5 | 2975 | 170.004.40 | 0.2840.035 | 0.07 | 6.5 | (f) |
| Gl299A | 12.83 | 8.42 | 7.93 | 7.64 | M4.5 | 3036 | 148.002.60 | 0.1550.025 | – | 3.0 | (f) |
| Gl338A | 7.64 | 4.89 | 3.99 | 3.96 | M0.0 | 3851 | 162.502.00 | 0.6600.011 | -0.17 | 2.9 | (c) |
| Gl338B | 7.74 | 4.78 | 4.04 | 4.13 | M0.0 | 3695 | 162.502.00 | 0.6340.028 | -0.35 | 2.8 | (c) |
| Gl362 | 11.36 | 7.33 | 6.73 | 6.44 | M3.0 | 3148 | 80.003.50 | 0.4230.048 | 0.16 | 10.0 | (a) |
| Gl369 | 10.00 | 6.99 | 6.40 | 6.12 | M2.0 | 3661 | 84.807.60 | 0.5170.031 | -0.42 | 5.0 | (b) |
| Gl382 | 9.26 | 5.89 | 5.26 | 4.98 | M2.0 | 3446 | 120.005.90 | 0.5560.027 | 0.07 | 1.3 | (j) |
| Gl393 | 9.63 | 6.18 | 5.61 | 5.28 | M2.5 | 3404 | 130.005.10 | 0.4730.008 | -0.12 | 1.1 | (j) |
| Gl402 | 11.66 | 7.32 | 6.71 | 6.34 | M5.0 | 3038 | 145.104.80 | 0.2550.014 | -0.06 | 2.3 | (f) |
| Gl406 | 13.54 | 7.09 | 6.48 | 6.04 | M6.0 | 2520 | 418.302.50 | 0.1010.005 | – | 3.0 | (f) |
| Gl406 | 13.54 | 7.09 | 6.48 | 6.08 | M6.0 | 2520 | 418.302.50 | 0.1010.005 | – | 2.9 | (c) |
| Gl408 | 10.03 | 6.31 | 5.76 | 5.47 | M3.0 | 3276 | 140.004.30 | 0.4060.007 | -0.14 | 2.3 | (c) |
| Gl411 | 7.49 | 4.20 | 3.64 | 3.22 | M2.0 | 3490 | 397.301.80 | 0.4210.017 | -0.33 | 2.9 | (c) |
| Gl412A | 8.68 | 5.54 | 5.00 | 4.77 | M2.0 | – | – | – | – | 3.0 | (c) |
| Gl412B | 14.45 | 8.74 | 8.18 | 7.84 | M6.0 | – | – | – | – | 7.7 | (f) |
| Gl414B | 9.95 | 6.59 | 5.97 | 5.70 | M2.0 | 3451 | 70.003.60 | 0.6360.050 | – | 3.2 | (b) |
| Gl424 | 9.32 | 6.31 | 5.73 | 5.53 | M1.0 | – | – | – | – | 2.9 | (c) |
| Gl436 | 10.68 | 6.90 | 6.32 | 6.07 | M3.5 | – | – | – | – | 1.0 | (b) |
| Gl445 | 10.78 | 6.72 | 6.22 | 5.93 | M4.0 | 3137 | 190.006.00 | 0.2540.018 | -0.31 | 2.0 | (c) |
| Gl447 | 11.08 | 6.51 | 5.95 | 5.62 | M4.5 | 2966 | 300.001.70 | 0.1790.007 | – | 2.0 | (f) |
| Gl450 | 9.78 | 6.42 | 5.83 | 5.59 | M1.0 | 3451 | 110.005.70 | 0.4910.004 | -0.21 | 3.3 | (c) |
| Gl459.3 | 10.62 | 7.67 | 6.97 | 6.77 | M2.0 | 3702 | 50.001.60 | 0.6040.008 | -0.18 | 2.8 | (b) |
| Gl461AB | 9.19 | 6.86 | 6.22 | 6.01 | M0.0 | – | – | – | – | 2.5 | (b) |
| Gl464 | 10.43 | 7.48 | 6.86 | 6.60 | M2.0 | 3702 | 49.304.10 | 0.6410.001 | -0.08 | 2.4 | (b) |
| Gl480 | 11.52 | 7.58 | 6.94 | 6.66 | M4.0 | 3183 | 80.006.10 | 0.3940.031 | 0.04 | 0.8 | (b) |
| Gl486 | 11.40 | 7.20 | 6.67 | 6.33 | M4.0 | 3086 | 120.004.00 | 0.3110.017 | -0.06 | 2.0 | (c) |
| Gl487 | 10.92 | 6.88 | 6.23 | 6.05 | M3.0 | 3145 | 116.200.50 | 0.3650.021 | -0.04 | 10.0 | (a) |
| Gl490A | 10.50 | 7.40 | 6.73 | 6.52 | M0.0 | 3603 | 50.003.60 | 0.6390.018 | 0.07 | 8.0 | (a) |
| Gl490B | 13.16 | 8.87 | 8.28 | 7.99 | M4.0 | 3055 | 50.003.60 | 0.3360.036 | 0.07 | 10.0 | (a) |
| Gl493.1 | 13.37 | 8.55 | 7.97 | 7.63 | M5.0 | 2893 | 120.003.50 | 0.1700.002 | – | 16.8 | (f) |
| Gl494 | 9.72 | 6.44 | 5.79 | 5.55 | M1.5 | 3496 | 90.005.80 | 0.5720.020 | 0.03 | 10.0 | (a) |
| Gl507.1 | 10.66 | 7.27 | 6.64 | 6.36 | M2.0 | 3435 | 50.007.50 | 0.6450.058 | – | 2.6 | (b) |
| Gl514 | 9.04 | 5.90 | 5.30 | 5.01 | M1.0 | 3578 | 138.702.90 | 0.5140.014 | -0.28 | 1.3 | (j) |
| Gl521 | 10.26 | 7.05 | 6.51 | 6.26 | M2.0 | 3536 | 80.005.30 | 0.5060.021 | -0.34 | 2.0 | (b) |
| Gl526 | 8.46 | 5.18 | 4.78 | 4.42 | M4.0 | – | – | – | – | 1.4 | (j) |
| Gl552 | 10.68 | 7.23 | 6.61 | 6.36 | M2.5 | 3404 | 70.004.40 | 0.5170.019 | -0.01 | 1.2 | (b) |
| Gl555 | 11.35 | 6.84 | 6.26 | 5.91 | M4.0 | 2984 | 160.007.90 | 0.2730.029 | 0.03 | 2.7 | (f) |
| Gl569AB | 10.20 | 6.63 | 5.99 | 5.74 | M2.5 | 3345 | 95.601.40 | 0.4990.028 | 0.05 | 3.8 | (b) |
| Gl570.2 | 11.08 | 8.44 | 7.82 | 7.64 | M2.0 | 3942 | 70.005.00 | 0.3780.108 | -1.21 | 2.5 | (b) |
| Gl570B | 8.10 | 4.55 | 3.91 | 3.80 | M2.0 | – | – | – | – | 2.9 | (b) |
| Gl581 | 10.56 | 6.71 | 6.09 | 5.81 | M5.0 | 3220 | 160.005.60 | 0.3130.007 | -0.24 | 2.1 | (c) |
| Gl623 | 10.27 | 6.64 | 6.14 | 5.92 | M3.0 | – | – | – | – | 2.9 | (c) |
| Gl625 | 10.17 | 6.61 | 6.06 | 5.81 | M2.0 | 3350 | 150.002.50 | 0.3490.030 | -0.44 | 3.4 | (c) |
| Gl628 | 10.12 | 5.95 | 5.37 | 5.04 | M3.5 | 3097 | 240.004.20 | 0.2860.009 | -0.11 | 1.1 | (j) |
| Gl643 | 11.70 | 7.55 | 7.06 | 6.70 | M4.0 | 3104 | 171.907.30 | 0.2010.023 | – | 2.7 | (c) |
| Gl649 | 9.62 | 6.45 | 5.86 | 5.60 | M2.0 | 3560 | 100.004.30 | 0.5340.009 | -0.23 | 1.9 | (b) |
| Gl654 | 10.07 | 6.78 | 6.19 | 5.95 | M3.5 | 3490 | 100.007.80 | 0.4710.018 | -0.33 | 1.1 | (b) |
| Gl669A | 11.42 | 7.27 | 6.71 | 6.39 | M4.0 | 3104 | 93.301.90 | 0.3760.040 | 0.09 | 10.0 | (a) |
| Gl669B | 13.02 | 7.27 | 6.71 | 6.39 | M5.0 | 2667 | 93.301.90 | 0.3110.132 | – | 10.0 | (a) |
| Gl686 | 9.62 | 6.36 | 5.79 | 5.55 | M1.0 | 3507 | 130.003.80 | 0.4470.030 | -0.44 | 5.0 | (c) |
| Gl687 | 9.15 | 5.34 | 4.77 | 4.53 | M3.5 | 3237 | 212.702.00 | 0.4070.013 | -0.09 | 2.8 | (c) |
| Gl694 | 10.50 | 6.81 | 6.22 | 5.93 | M3.5 | 3289 | 100.004.10 | 0.4470.022 | -0.02 | 1.4 | (b) |
| Gl701 | 9.37 | 6.16 | 5.57 | 5.28 | M2.0 | 3536 | 130.004.30 | 0.4890.016 | -0.30 | 3.5 | (c) |
| Gl720A | 9.84 | 6.88 | 6.26 | 6.06 | M2.0 | 3695 | 67.802.10 | 0.6170.012 | -0.21 | 1.5 | (b) |
| Gl735 | 10.20 | 6.31 | 5.68 | 5.40 | M3.0 | 3203 | 90.002.70 | 0.5570.087 | – | 10.0 | (a) |
| Gl745A | 10.84 | 7.30 | 6.73 | 6.50 | M2.0 | 3359 | 110.004.10 | 0.3480.032 | -0.46 | 3.0 | (c) |
| Gl745B | 10.77 | 7.28 | 6.75 | 6.50 | M2.0 | 3384 | 110.004.10 | 0.3520.037 | -0.50 | 2.8 | (c) |
| Gl748 | 11.06 | 7.09 | 6.57 | 6.27 | M4.0 | 3172 | 100.002.40 | 0.3840.021 | -0.04 | 4.6 | (b) |
| Gl752A | 9.13 | 5.58 | 4.93 | 4.64 | M3.5 | 3354 | 176.702.40 | 0.4600.018 | -0.04 | 2.6 | (c) |
| Gl781 | 11.97 | 8.83 | 8.35 | 8.09 | M3.0 | 3578 | 59.902.00 | 0.3380.074 | -0.87 | 15.0 | (a) |
| Gl791.2 | 13.04 | 8.23 | 7.67 | 7.28 | M6.0 | 2896 | 110.001.90 | 0.2100.020 | 0.01 | 32.0 | (f) |
| Gl793 | 10.44 | 6.74 | 6.14 | 5.91 | M3.0 | 3284 | 120.003.10 | 0.3930.001 | -0.20 | 3.2 | (c) |
| Gl806 | 10.84 | 7.33 | 6.77 | 6.51 | M3.0 | 3374 | 80.002.20 | 0.4460.004 | -0.21 | 1.5 | (b) |
| Gl809 | 8.54 | 5.43 | 4.92 | 4.60 | M2.0 | 3597 | 130.003.60 | 0.6140.006 | -0.06 | 2.8 | (c) |
| Gl812A | 11.87 | 7.82 | 7.31 | 7.04 | M3.0 | 3141 | 60.005.10 | 0.4310.042 | 0.12 | 10.0 | (a) |
| Gl815A | 10.10 | 6.67 | 6.09 | 5.86 | M3.0 | 3414 | 70.003.30 | 0.6080.039 | – | 10.0 | (a) |
| Gl829 | 10.35 | 6.25 | 5.74 | 5.43 | M4.0 | 3122 | 150.004.80 | 0.3710.028 | 0.01 | 4.0 | (c) |
| Gl849 | 10.42 | 6.51 | 5.90 | 5.56 | M3.5 | 3195 | 120.003.30 | 0.4260.044 | 0.13 | 2.4 | (c) |
| Gl851 | 10.29 | 6.72 | 6.03 | 5.79 | M2.0 | 3345 | 80.002.60 | 0.5540.053 | – | 2.5 | (b) |
| Gl860A | 9.59 | 5.57 | 5.04 | 4.76 | M2.0 | 3152 | 10.004.50 | – | – | 3.0 | (c) |
| Gl860B | 10.30 | 5.57 | 5.04 | 4.76 | M4.0 | 2919 | 10.004.50 | – | – | 4.7 | (f) |
| Gl863 | 10.36 | 7.21 | 6.60 | 6.33 | M0.0 | 3572 | 70.003.70 | 0.5410.006 | -0.20 | 1.8 | (b) |
| Gl873 | 10.09 | 6.11 | 5.55 | 5.28 | M4.5 | 3168 | 200.002.60 | 0.3150.002 | -0.20 | 6.9 | (c) |
| Gl875.1 | 11.78 | 7.70 | 7.13 | 6.85 | M3.5 | 3130 | 70.003.00 | 0.4050.042 | 0.11 | 11.0 | (a) |
| Gl876 | 10.17 | 5.93 | 5.35 | 4.98 | M5.0 | 3172 | 210.005.40 | 0.3220.032 | 0.04 | 2.0 | (f) |
| Gl880 | 8.66 | 5.36 | 4.80 | 4.52 | M2.0 | – | – | – | – | 2.8 | (c) |
| Gl905 | 12.28 | 6.88 | 6.25 | 5.90 | M6.0 | 2746 | 320.001.10 | 0.1360.008 | – | 1.2 | (c) |
| Gl908 | 8.98 | 5.83 | 5.28 | 5.02 | M2.0 | 3572 | 177.905.60 | 0.4310.046 | -0.58 | 3.0 | (c) |
| LHS1885 | 13.65 | 8.59 | 7.99 | 7.66 | M4.5 | 2733∗ | 90.002.30 | 0.2080.031 | 0.07 | 3.7 | (f) |
| LHS2065 | – | 11.21 | 10.47 | 9.94 | M9.0 | – | – | – | – | 12.0 | (f) |
| LHS2243 | – | 11.99 | 11.33 | 10.95 | M7.5 | 1846∗∗ | – | – | – | 7.0 | (f) |
| LHS2397A | 19.57 | 11.93 | 11.23 | 10.68 | M8.5 | – | 70.002.10 | – | – | 20.0 | (f) |
| LHS2520 | 12.06 | 7.77 | 7.14 | 6.86 | M3.5 | 3033 | – | – | – | 2.0 | (c) |
| LHS2632 | – | 12.23 | 11.58 | 11.21 | M7.0 | 1969∗∗ | – | – | – | 5.0 | (f) |
| LHS2645 | 18.80 | 12.19 | 11.55 | 11.16 | M7.0 | 2487 | – | – | – | 9.0 | (f) |
| LHS2924 | 19.58 | 11.99 | 11.23 | 10.69 | M9.0 | 1665∗∗ | 90.001.30 | 0.1050.043 | – | 11.0 | (f) |
| LHS3376 | 13.46 | 8.74 | 8.26 | 7.93 | M4.5 | 2922 | 140.005.30 | 0.1390.017 | – | 14.6 | (f) |
| LP229-17 | 11.75 | 7.18 | 6.53 | 7.10 | M3.5 | 3265 | 138.0040.00 | 0.2140.046 | -0.54 | 2.0 | (c) |
| LP412-31 | 19.21 | 11.76 | 11.07 | 10.64 | M8.0 | 2191∗ | – | – | – | 12.0 | (f) |
| LP467-16 | 13.59 | 9.08 | 8.51 | 8.21 | M5.0 | 2984 | – | – | – | 15.2 | (f) |
| LP731-47 | – | – | – | – | M6.5 | – | – | – | – | 11.0 | (f) |
| LP759-25 | – | 11.66 | 11.05 | 10.72 | M5.5 | – | – | – | – | 13.0 | (f) |
| LP944-20 | – | 10.73 | 10.02 | 9.55 | M9.0 | 1764∗ | – | – | – | 31.0 | (f) |
| RG0050-2722 | – | 13.61 | 12.98 | 12.54 | M8.0 | – | – | – | – | 4.0 | (f) |
| SDSS011012.22-085627.5 | – | 14.78 | 14.22 | 13.86 | M7.0 | – | – | – | – | 3.5 | (k) |
| SDSS021749.99-084409.4 | 19.04 | 14.20 | 13.63 | 13.30 | M6.0 | – | – | – | – | 4.00.5 | (k) |
| SDSS023908.41-072429.3 | – | 14.81 | 14.21 | 13.76 | M7.0 | – | – | – | – | 3.5 | (k) |
| SDSS072543.94+382511.4 | – | 12.72 | 12.12 | 11.83 | M7.0 | – | – | – | – | 3.5 | (k) |
| SDSS083231.52+474807.7 | 17.56 | 12.41 | 11.79 | 11.45 | M6.0 | – | – | – | – | 4.00.5 | (k) |
| SDSS094720.07-002009.5 | – | 12.26 | 11.63 | 11.35 | M7.0 | – | – | – | – | 6.50.5 | (k) |
| SDSS094738.45+371016.5 | – | 12.19 | 11.67 | 11.34 | M7.0 | – | – | – | – | 6.00.5 | (k) |
| SDSS110153.86+341017.1 | – | 12.78 | 12.20 | 11.99 | M7.0 | – | – | – | – | 3.5 | (k) |
| SDSS112036.08+072012.7 | – | – | – | – | M7.0 | – | – | – | – | 3.5 | (k) |
| SDSS125855.13+052034.7 | – | 12.64 | 12.06 | 11.69 | M7.0 | – | – | – | – | 3.5 | (k) |
| SDSS151727.72+335702.4 | – | 12.76 | 12.13 | 11.77 | M7.0 | – | – | – | – | 4.50.5 | (k) |
| SDSS162718.20+353835.7 | 17.56 | 12.35 | 11.73 | 11.35 | M7.0 | – | – | – | – | 8.00.5 | (k) |
| SDSS220334.10+130839.8 | – | 14.38 | 13.87 | 13.55 | M7.0 | – | – | – | – | 3.5 | (k) |
| SDSS225228.50101910.9 | – | 14.78 | 14.22 | 14.01 | M7.0 | – | – | – | – | 3.5 | (k) |
| TVLM513-46546 | – | 11.87 | 11.18 | 10.71 | M9.0 | – | – | – | – | 60.0 | (f) |
| TVLM868-110639 | – | 12.61 | 11.84 | 11.35 | M9.0 | – | – | – | – | 30.0 | (f) |
| VB8 | 16.70 | 9.78 | 9.20 | 8.82 | M7.0 | 2425 | – | – | – | 9.0 | (f) |
| VB10 | 17.30 | 9.91 | 9.23 | 8.77 | M8.0 | – | – | – | – | 6.5 | (f) |
| YZCMi | – | – | – | – | M5.5 | – | – | – | – | 5.3 | (j) |
Column 12 shows the source of each sin from the literature with references as follows: (a) Stauffer & Hartmann (1986); (b) Marcy & Chen (1992); (c) Delfosse et al. (1998); (d) Glebocki & Stawikowski (2000); (e) Gizis et al. (2002); (f) Mohanty & Basri (2003); (g) Bailer-Jones (2004); (h) Fuhrmeister & Schmitt (2004); (i) Jones et al. (2005); (j) Reiners (2007); (k) West & Basri (2009)
6 Conclusions
We present the initial results from our study of rotation rates for a range of M stars as part of our target selection for a PRVS-like planet search project. We observed over 50 M stars with HRS on the HET with the aim of selecting the slowest rotators in order that a near infrared planet search survey, such as PRVS, shall have a statistically large sample of M stars where highly precise radial-velocity measurements can be accrued. Of our sample of 49 suspected single M stars between M3-M6.5, we find 36 have sin s 10 km s-1 which will represent good radial-velocity targets. When we include all literature M stars in the optically difficult radial-velocity regime (M3-M9.5) we find this value increases to 124.
We also confirm the increase of rotational velocities between early to mid M stars. This change at the fully convective boundary seems to be linked to a change in the topology of the magnetic fields between such stars, indicating axisymetric poloidal fields drive a less efficient wind braking mechanism. Also there is an initial indication that stars with spectral types in the range M6.5-M8.5 have a different rotational velocity distribution compared with those of below M6.5, as the distribution appears to flatten off beyond this regime. Since this is around the temperature where dust opacity becomes important (2800K), there may be another change in the efficiency of the braking mechanism in such stars which could indicate another magnetic field topology change. In addition, we also show how knowledge of the sin can be used to put a lower, or upper, limit on the age of mid-M dwarf stars, since the rotation-activity relation has a temperature dependent saturation level.
We also highlight the rotation-activity relation through emission, or lack thereof, of the H line. There appears a boundary of around 7 km s-1 between stars with and without H emission, with the fast rotators almost always exhibiting such emission, however since the sin degeneracy is present it is difficult to account for any firm empirical boundaries with small numbers. We observed the star GJ1253 over two epochs and found the H emission had switched on over a period of less than one month. This may be due to an active region rotating in and out of our field of view with a period equal to the rotation period of the star, or due to a flaring event.
We have also discovered three spectroscopic binary systems and confirmed another. Both components in the GJ1080 system produce fairly similar profiles, indicating they are of similar spectral type, the secondary likely a little cooler and less luminous. The profiles for GJ3129 and Gl802 are widely separated and both of these exhibit double H emission features. Gl802 is also a known triple system, but we find evidence for another companion in the system, however given the noise due to blended light from at least three separate sources the evidence is weak. In comparison to these fairly strong profiles the secondary profile in the LHS3080 system is significantly weaker, indicating the companion is significantly cooler than its host star. Finally, we have flagged other M dwarfs where there is some evidence for binary companions in these systems.
References
- Bailer-Jones (2004) Bailer-Jones, C. A. L. 2004, A&A, 419, 703
- Baraffe et al. (2002) Baraffe, I., Chabrier, G., Allard, F., & Hauschildt, P. H. 2002, A&A, 382, 563
- Barnes et al. (1998) Barnes, J. R., Collier Cameron, A., Unruh, Y. C., Donati, J. F., & Hussain, G. A. J. 1998, MNRAS, 299, 904
- Berger et al. (2008) Berger, E., Basri, G., Gizis, J. E., et al. 2008, ApJ, 676, 1307
- Bonfils et al. (2005) Bonfils, X., Delfosse, X., Udry, S., et al. 2005, A&A, 442, 635
- Bouchy et al. (2001) Bouchy, F., Pepe, F., & Queloz, D. 2001, A&A, 374, 733
- Bouchy et al. (2005) Bouchy, F., Udry, S., Mayor, M., et al. 2005, A&A, 444, L15
- Butler et al. (2006) Butler, R. P., Wright, J. T., Marcy, G. W., et al. 2006, ApJ, 646, 505
- Byrne et al. (1996) Byrne, P. B., Eibe, M. T., & Rolleston, W. R. J. 1996, A&A, 311, 651
- Carpenter (2001) Carpenter, J. M. 2001, AJ, 121, 2851
- Casagrande et al. (2008) Casagrande, L., Flynn, C., & Bessell, M. 2008, ArXiv e-prints, 806
- Chabrier et al. (2000) Chabrier, G., Baraffe, I., Allard, F., & Hauschildt, P. 2000, ApJ, 542, 464
- Collier Cameron et al. (2002) Collier Cameron, A., Horne, K., Penny, A., & Leigh, C. 2002, MNRAS, 330, 187
- Delfosse et al. (1998) Delfosse, X., Forveille, T., Perrier, C., & Mayor, M. 1998, A&A, 331, 581
- Delfosse et al. (2000) Delfosse, X., Forveille, T., Ségransan, D., et al. 2000, A&A, 364, 217
- Donati & Collier Cameron (1997) Donati, J.-F. & Collier Cameron, A. 1997, MNRAS, 291, 1
- Donati et al. (2008) Donati, J.-F., Morin, J., Petit, P., et al. 2008, MNRAS, 390, 545
- Fleming et al. (2000) Fleming, T. A., Giampapa, M. S., & Schmitt, J. H. M. M. 2000, ApJ, 533, 372
- Fuhrmeister & Schmitt (2004) Fuhrmeister, B. & Schmitt, J. H. M. M. 2004, A&A, 420, 1079
- Gizis et al. (2002) Gizis, J. E., Reid, I. N., & Hawley, S. L. 2002, AJ, 123, 3356
- Glebocki & Stawikowski (2000) Glebocki, R. & Stawikowski, A. 2000, Acta Astonomica, 50, 509
- Gray (1992) Gray, D. F. 1992, The observation and analysis of stellar photospheres., ed. D. F. Gray
- Henry et al. (2002) Henry, G. W., Donahue, R. A., & Baliunas, S. L. 2002, ApJL, 577, L111
- Henry et al. (2006) Henry, T. J., Jao, W.-C., Subasavage, J. P., et al. 2006, AJ, 132, 2360
- Horne (1986) Horne, K. 1986, PASP, 98, 609
- Ireland et al. (2008) Ireland, M. J., Kraus, A., Martinache, F., Lloyd, J. P., & Tuthill, P. G. 2008, ApJ, 678, 463
- Jenkins et al. (2008) Jenkins, J. S., Jones, H. R. A., Pavlenko, Y., et al. 2008, A&A, 485, 571
- Johnson & Apps (2009) Johnson, J. & Apps, K. 2009, arxiv:0904.3092
- Jones et al. (2005) Jones, H. R. A., Pavlenko, Y., Viti, S., et al. 2005, MNRAS, 358, 105
- Jones et al. (2008) Jones, H. R. A., Rayner, J., Ramsey, L., et al. 2008, in Society of Photo-Optical Instrumentation Engineers (SPIE) Conference Series, Vol. 7014, Society of Photo-Optical Instrumentation Engineers (SPIE) Conference Series
- Jones & Tsuji (1997) Jones, H. R. A. & Tsuji, T. 1997, ApJL, 480, L39+
- Kupka & Ryabchikova (1999) Kupka, F. & Ryabchikova, T. A. 1999, Publications de l’Observatoire Astronomique de Beograd, 65, 223
- Lee et al. (2009) Lee, K.-G., Berger, E., & Knapp, G. R. 2009, ArXiv e-prints
- Lloyd et al. (2006) Lloyd, J. P., Martinache, F., Ireland, M. J., et al. 2006, ApJL, 650, L131
- Marcy & Butler (1992) Marcy, G. W. & Butler, R. P. 1992, PASP, 104, 270
- Marcy & Butler (1996) Marcy, G. W. & Butler, R. P. 1996, in Proc. SPIE Vol. 2704, p. 46-49, The Search for Extraterrestrial Intelligence (SETI) in the Optical Spectrum II, Stuart A. Kingsley; Guillermo A. Lemarchand; Eds., 46–49
- Marcy & Chen (1992) Marcy, G. W. & Chen, G. H. 1992, ApJ, 390, 550
- Markwardt (2009) Markwardt, C. B. 2009, ArXiv e-prints
- Martín & Ardila (2001) Martín, E. L. & Ardila, D. R. 2001, AJ, 121, 2758
- Mayor et al. (2009) Mayor, M., Bonfils, X., Forveille, T., et al. 2009, ArXiv e-prints
- McCarthy & Zuckerman (2004) McCarthy, C. & Zuckerman, B. 2004, AJ, 127, 2871
- Mills et al. (1996) Mills, D., Webb, J., & Clayton, M. 1996, Starlink, 152, 1
- Mohanty & Basri (2003) Mohanty, S. & Basri, G. 2003, ApJ, 583, 451
- Mohanty et al. (2002) Mohanty, S., Basri, G., Shu, F., Allard, F., & Chabrier, G. 2002, ApJ, 571, 469
- Morin et al. (2008) Morin, J., Donati, J.-F., Petit, P., et al. 2008, MNRAS, 390, 567
- Noyes et al. (1984) Noyes, R. W., Hartmann, L. W., Baliunas, S. L., Duncan, D. K., & Vaughan, A. H. 1984, ApJ, 279, 763
- Osten et al. (2005) Osten, R. A., Hawley, S. L., Allred, J. C., Johns-Krull, C. M., & Roark, C. 2005, ApJ, 621, 398
- Patten & Simon (1996) Patten, B. M. & Simon, T. 1996, ApJS, 106, 489
- Pepe et al. (2000) Pepe, F., Mayor, M., Delabre, B., et al. 2000, in Presented at the Society of Photo-Optical Instrumentation Engineers (SPIE) Conference, Vol. 4008, Proc. SPIE Vol. 4008, p. 582-592, Optical and IR Telescope Instrumentation and Detectors, Masanori Iye; Alan F. Moorwood; Eds., ed. M. Iye & A. F. Moorwood, 582–592
- Pravdo et al. (2005) Pravdo, S. H., Shaklan, S. B., & Lloyd, J. 2005, ApJ, 630, 528
- Ramsey et al. (1998) Ramsey, L. W., Adams, M. T., Barnes, T. G., et al. 1998, in Presented at the Society of Photo-Optical Instrumentation Engineers (SPIE) Conference, Vol. 3352, Proc. SPIE Vol. 3352, p. 34-42, Advanced Technology Optical/IR Telescopes VI, Larry M. Stepp; Ed., ed. L. M. Stepp, 34–42
- Ramsey et al. (2008) Ramsey, L. W., Barnes, J. R., Redman, S. L., et al. 2008, PASP
- Reid et al. (2002) Reid, I. N., Kirkpatrick, J. D., Liebert, J., et al. 2002, AJ, 124, 519
- Reiners (2007) Reiners, A. 2007, A&A, 467, 259
- Reiners (2009) Reiners, A. 2009, A&A, 498, 853
- Reiners & Basri (2007) Reiners, A. & Basri, G. 2007, ApJ, 656, 1121
- Reiners & Basri (2008) Reiners, A. & Basri, G. 2008, ApJ, 684, 1390
- Rivera et al. (2005) Rivera, E. J., Lissauer, J. J., Butler, R. P., et al. 2005, ApJ, 634, 625
- Rockenfeller et al. (2006) Rockenfeller, B., Bailer-Jones, C. A. L., & Mundt, R. 2006, A&A, 448, 1111
- Skrutskie et al. (2006) Skrutskie, M. F., Cutri, R. M., Stiening, R., et al. 2006, AJ, 131, 1163
- Stauffer & Hartmann (1986) Stauffer, J. R. & Hartmann, L. W. 1986, ApJS, 61, 531
- Tinney et al. (1998) Tinney, C. G., Delfosse, X., Forveille, T., & Allard, F. 1998, A&A, 338, 1066
- Tsuji et al. (1996) Tsuji, T., Ohnaka, K., & Aoki, W. 1996, A&A, 305, L1+
- Tull (1998) Tull, R. G. 1998, in Presented at the Society of Photo-Optical Instrumentation Engineers (SPIE) Conference, Vol. 3355, Proc. SPIE Vol. 3355, p. 387-398, Optical Astronomical Instrumentation, Sandro D’Odorico; Ed., ed. S. D’Odorico, 387–398
- Udry et al. (2007) Udry, S., Bonfils, X., Delfosse, X., et al. 2007, A&A, 469, L43
- van Altena et al. (1995) van Altena, W. F., Lee, J. T., & Hoffleit, D. 1995, VizieR Online Data Catalog, 1174, 0
- West & Basri (2009) West, A. A. & Basri, G. 2009, ApJ, 693, 1283
- West et al. (2009) West, A. A., Hawley, S. L., Bochanski, J. J., Covey, K. R., & Burgasser, A. J. 2009, in IAU Symposium, Vol. 258, IAU Symposium, ed. E. E. Mamajek, D. R. Soderblom, & R. F. G. Wyse, 327–336
- Wright (2005) Wright, J. T. 2005, PASP, 117, 657