Type I X-ray bursts, burst oscillations and kHz quasi-periodic oscillations in the neutron star system IGR J17191–2821
Abstract
We present a detailed study of the X-ray energy and power spectral properties of the neutron star transient IGR J17191-2821. We discovered four instances of pairs of simultaneous kilohertz quasi-periodic oscillations (kHz QPOs). The frequency difference between these kHz QPOs is between 315 Hz and 362 Hz. We also report on the detection of five thermonuclear type-I X-ray bursts and the discovery of burst oscillations at Hz during three of them. Finally, we report on a faint and short outburst precursor, which occurred about two months before the main outburst. Our results on the broadband spectral and variability properties allow us to firmly establish the atoll source nature of IGR J17191–2821.
keywords:
Keywords: accretion, accretion disks — binaries: close — stars: individual (IGR J17191-2821, XTE J1747-274) — stars: neutron — X–rays: stars1 Introduction
Neutron star low–mass X-ray binaries (NS-LMXBs) have been extensively observed with the Rossi X-ray Timing Explorer (RXTE) during the last 13 years. These observations have led to important discoveries, such as persistent and intermittent pulsations in accretion-powered millisecond X-ray pulsars, nearly coherent oscillations during X-ray bursts and strong quasi-periodic variability on millisecond time-scales (the so called kilohertz quasi-periodic oscillations; kHz QPOs).
The kHz QPOs are relatively narrow peaks in the power spectrum. They sometimes occur in pairs and are thought to reflect motion of matter around the neutron star at the inner edge of the accretion disk (see, e.g. Miller et al., 1998). Up to date, kHz QPOs with similar characteristics have been detected in about 30 neutron star sources. While it is often assumed that at least one of the QPOs reflects the Keplerian motion at the inner edge of the accretion disk (see e.g. review by van der Klis, 2006), models have to still satisfactorily explain the presence and characteristics of both QPOs.
Direct detection of coherent or nearly coherent pulsations is the only available method to measure the neutron star spin period in LMXBs. Ten NS-LMXBs out of more than 100 known (Liu et al., 2007) have shown coherent millisecond pulsations in their persistent emission; these systems are known as accretion-powered millisecond X-ray pulsars (AMXPs; see Wijnands, 2005, for a review of the first six AMXPs discovered; for the last four see Kaaret et al. 2006, Krimm et al. 2007, Casella et al. 2008 and Altamirano et al. 2008a). Sixteen sources to date (including the one presented in this paper) have shown nearly coherent millisecond oscillations during thermonuclear Type-I X-ray bursts (Watts et al., 2008, 2009). As the X-ray burst evolves, the oscillation frequency typically increases by a few Hz, approaching an asymptotic value () which is stable for a given source from burst to burst. This asymptotic frequency is thought to trace within a few Hz the spin frequency () of the neutron star (Strohmayer et al., 1996). The AMXPs SAX J1808–3658 (Chakrabarty et al., 2003), XTE J1814–338 (Strohmayer et al., 2003), Aql X-1 (Casella et al., 2008) and most recently HETE J1900.1–2455 (Watts et al., 2009) have all shown that , strongly supporting the idea that is a good tracer of .
Since the discovery of burst oscillations and two simultaneous kHz QPOs in neutron star LMXBs, it was suggested that there was a relation between the neutron star spin frequency, , and the kHz QPO frequency difference . Although the frequency of the QPOs was found to vary ( Hz and Hz), initial measurements revealed that was consistent with being constant111At least in those sources in which was known. For example, in the neutron star LMXB Sco X-1 is known to vary (see, e.g. van der Klis et al., 1997). and equal to the asymptotic burst oscillation (see, e.g., Strohmayer et al., 1996). This was the main motivation for beat-frequency models such as the sonic-point model (Miller et al., 1998), which proposed that reflects the Keplerian frequency at the inner edge of the disk, and that was the beat between and . As new observations revealed more sources showing both and twin kHz QPOs, the relation became more complex (see Méndez & Belloni 2007 and van der Klis 2008 for a detailed historical overview). As a summary, NS-LMXBs are often classified as fast or slow rotators, depending on whether the spin frequency is higher or lower than Hz, respectively (Muno et al., 2001). It was found that generally the fast rotators follow , while slow rotators follow (see Wijnands et al., 2003; Linares et al., 2005, and references therein). This of course implies that there is no one-to-one relation between and . Furthermore, it is now known that is not always consistent with being constant for sources with known (see, e.g., Méndez et al., 1998; Jonker et al., 2002; Barret et al., 2006, and references within).
The question of whether and are physically related is still under debate. While current data might still be compatible with a bimodal relation, recent results suggest that this might not be the case. For example, Méndez & Belloni (2007) suggested that and are unrelated and that the division between fast and slow rotators may be just an effect of the low number of sources showing both phenomena (see also Yin et al., 2007). Recently, Strohmayer et al. (2008) reported the discovery of burst oscillations at 414.7 Hz in the LMXB 4U 0614+091; if confirmed, these results would imply a spin frequency that is inconsistent with either or relations.
1.1 IGR J17191-2821
IGR J17191-2821 was discovered by the IBIS/ISGRI instrument aboard INTEGRAL during observations of the galactic bulge monitoring (Kuulkers et al., 2007b) conducted between March 2 and 4, 2007 (Turler et al., 2007). The source was detected in the 20–40 and the 40-80 keV bands with significances of 10.4 and 4, and fluxes of and mCrab, respectively. The position of the source was first reported as (RA,DEC) = (259∘.77, –28∘.35) (J2000) with an accuracy of 2.5 arcmin.
On March 3, 2007, RXTE Galactic bulge scans (Swank & Markwardt, 2001) detected a source at a position consistent with that reported by Turler et al. (2007) at an intensity of mCrab in the 2-10 keV band (Swank et al., 2007). Follow-up RXTE observations performed three to four days later did not detect the source with a 3 upper limit of 1.2 mCrab. Eight years of Galactic bulge scans were reanalyzed for contributions from a source at the position of IGR J17191-2821, but no flares brighter than 2 mCrab were found. These non-detections showed that this source is active relatively infrequently (Swank et al., 2007).
During further Galactic bulge scan observations on April 29 and May 2, 2007, IGR J17191–2821 was detected again, but at a level of 30 and 70 mCrab (2–10 keV). This suggested that the previous detection was a flare or outburst precursor. Several Astronomical Telegrams at this time communicated on the discovery of Type I X-ray bursts (Klein-Wolt et al., 2007b; Markwardt et al., 2007), burst oscillations (Markwardt et al., 2007) and several episodes of kHz QPOs (Klein-Wolt et al., 2007c).
In this work, we present an intensive study of Type I X-ray burst characteristics, burst oscillations and kHz QPOs of this newly discovered neutron star LMXB IGR J17191-2821.
2 OBSERVATIONS AND DATA ANALYSIS
2.1 Light curves, color diagrams and timing analysis
We use data from the Rossi X-ray Timing Explorer (RXTE) Proportional Counter Array (PCA; for instrument information see Zhang et al., 1993; Jahoda et al., 2006). To study the long-term (days/months) behavior of the source, we used the PCA monitoring observations of the galactic bulge (Swank & Markwardt, 2001). These observations are performed nine months of the year (as parts of the months of November, December, January and June are excluded due to solar constraints). The accuracy in the position of the PCA bulge scans is about 15 arcmin; the light curves are given in the keV energy band.
To study the short-term (minutes or less) variability, we use PCA pointed observations. For IGR J17191–2821 there were 18 observations in one data set (92052-10) containing to ksec of useful data per observation. We use the 16-s time-resolution Standard 2 mode data to calculate X-ray colors. Hard and soft color are defined as the 9.7–16.0 keV / 6.0–9.7 keV and 3.5–6.0 keV / 2.0–3.5 keV count rate ratio, respectively, and intensity as the 2.0–16.0 keV count rate. We removed Type I X-ray bursts from the data as well as corrected by deadtime effects and for the contribution of the background. We normalized colors and intensities by those of the Crab Nebula (see Kuulkers et al., 1994; van Straaten et al., 2003, see table 2 in Altamirano et al. 2008b for average colors of the Crab Nebula per PCU).
For the Fourier timing analysis we used the Event mode E_125us_64M_0_1s. Leahy-normalized power spectra were constructed using data segments of 128 seconds and 1/8192 s time bins such that the lowest available frequency is Hz and the Nyquist frequency 4096 Hz. No background or deadtime corrections were performed prior to the calculation of the power spectra. Unless stated explicitly, in our fits we only include those Lorentzians for which we can measure the integrated power with an accuracy of at least 3, based on the (negative) error in the power integrated from 0 to . For the kHz QPOs, we report the centroid frequency , the full width at half maximum (FWHM) and the rms amplitude. The quoted errors use . The upper limits quoted in this paper correspond to a 95% confidence level ().
2.2 Energy spectra of the persistent emission
For the PCA, we used the Standard 2 data of PCU 2, which was active in all observations. The background was estimated using PCABACKEST version 6.0 (see FTOOLS). We calculated the PCU 2 response matrix for each observation using the FTOOLS routine PCARSP V10.1. For the HEXTE instrument, spectra were accumulated for cluster B (as cluster A stopped rocking in October 2006), excluding the damaged detector and averaging both rocking directions to measure the background spectrum. Dead time corrections of both source and background spectra were performed using HXTDEAD V6.0. The response matrices were created using HXTRSP V3.1. Both for PCA and HEXTE, we filtered out data recorded during, and up to 30 minutes after passage through the South Atlantic Anomaly (SAA). We only used data when the pointing offset from the source was less than 0.02 degrees and the elevation of the source respect to the Earth was greater than 10 degrees. Using XSPEC V11.3.2i (Arnaud, 1996), we fitted simultaneously the PCA and HEXTE energy spectra using the 3.0–25.0 keV and 20.0–200.0 keV energy bands, respectively. We used a model consisting of a disk blackbody and a power law, absorbed with an equivalent Hydrogen column density of 0.31022 cm-2 (Klein-Wolt et al., 2007a), which gave a good fit in all the observations ().
2.3 Type I X-ray bursts
We examined the Standard 1 mode data (2–60 keV, 0.125 seconds time resolution, no energy resolution) of the 18 observations for Type I X-ray bursts; we found 5 episodes (see Table 1). We searched each burst for coherent pulsations using the statistic (Strohmayer & Markwardt, 1999). We computed (i.e. assuming that the signal is sinusoidal) throughout the bursts using a sliding 2 seconds window with a step of 0.125 sec. The statistic has the same statistical properties as a Leahy normalized power spectrum, which means that for a purely random Poisson process, the powers follow a distribution with 2 degrees of freedom (Strohmayer & Markwardt, 1999). We searched the 30–4000 Hz frequency range in the 2–60 keV band and in narrower energy bands (Sec. 3.2).
| Number | ObsID | Start time of the | Num. of | Fluxa | Osc. | Osc. rms amplitudeb |
|---|---|---|---|---|---|---|
| burst (UT, 2007) | PCUs on | ( erg s-1 cm-2) | (yes/no) | (2–17 keV) | ||
| 1 | 92052-10-01-00 | May 4 02:32:06 | 2 | yes | ||
| 2 | 92052-10-05-00 | May 7 02:39:39 | 2 | yes | ||
| 3 | 92052-10-03-01 | May 7 05:51:12 | 2 | no | ||
| 4 | 92052-10-06-00 | May 8 17:08:53 | 3 | yes | ||
| 5 | 92052-10-06-01 | May 8 20:38:44 | 2 | no |
We also created energy spectra every 0.25 sec from the Event mode (E_125us_64M_0_1s) data of all the PCUs that were on during the burst. Given the high count rates during the peak of the bursts, we corrected each energy spectrum for dead-time using the methods suggested by the RXTE team222http://heasarc.gsfc.nasa.gov/docs/xte/recipes/pca_deadtime.html. For each energy spectrum, we created the corresponding response matrix using the latest information available on the response of the instrument at the relevant times. As is common practice, we used as background the energy spectrum of the persistent emission taken seconds before each burst. (We used 100 sec of the persistent emission to calculate the spectrum. However, we found no significant differences in the fits when the persistent-emission before or after the burst was used, or when using data-segments of different lengths -between 100 and 500 seconds-). We used a black-body model to fit the resulting burst spectra333 We assumed that the X-ray spectra after the persistent emission has been subtracted are Planckian and that the observed luminosity of the source is: so the unabsorbed bolometric X-ray flux may be determined using where is the Stefan-Boltzmann constant, T is the black-body temperature, R the neutron star photosphere radius, and D the distance to the source. The ratio is the normalization of the black-body model we used (bbodyrad – see Xspec manual for details). We note that X-ray burst spectra are generally well described by black-body emission, however, the emission from the neutron star and its environment (e.g. accretion disk) is expected to be more complex than simple black-body emission (see, e.g., van Paradijs, 1982; London et al., 1984; Kuulkers et al., 2003, and references therein)..
3 Results
3.1 Position of the source
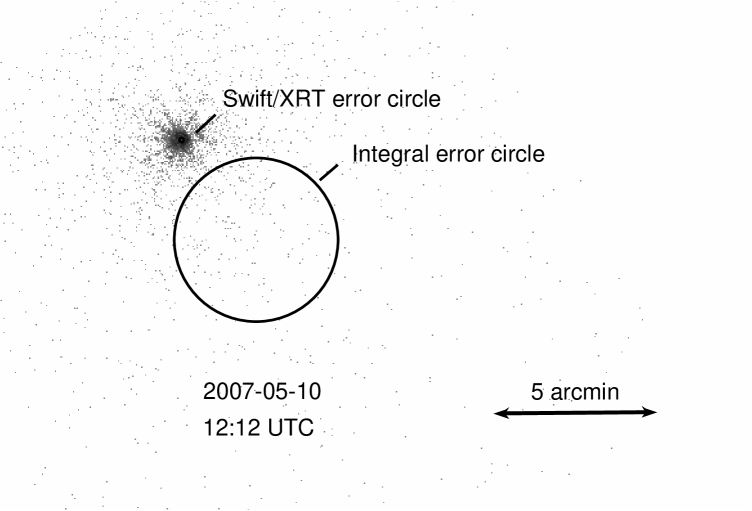
Swift observed the source twice on March 8, 2007 (at 02:37 UT for a total of sec, and at 10:44 UT for a total of sec – both observations where performed in PC mode). These are the only Swift observations performed before the bright outburst (see Section 3.4). The observations were taken in Photon Counting mode and did not show a source within the INTEGRAL error circle with an upper limit of 0.0021 cnts s-1 (at a 95% confidence level). Assuming a galactic absorption Nh of cm-2 and a photon index of 1.8, this countrate translates into an upper limit of erg s-1 cm-2 on the unabsorbed flux (approximately 0.004 mCrab in the 2-10 keV range). We found a source in the first Swift observation (i.e. on March 8 at 2:37 UT) located at (RA, DEC) = (259.8114, -28.3005) (J2000, with an error of arcsec), i.e., at a distance of about 3.5 arcminutes from the position of the source as measured by INTEGRAL. We measured an average count rate of 0.0087 cnts s-1, which corresponds to an unabsorbed flux of erg s-1 cm-2 or 0.02 mCrab (2-10 keV, assuming the same Nh and photon index as above). In the second Swift observation this source is not significantly detected (a total of three photons within a 10 pixel source error circle and zero from a background region 3 times as large). We place a 95% confidence upper limit on the 2-10 keV unabsorbed flux of erg s-1 cm-2 (employing PIMMS444http://heasarc.gsfc.nasa.gov/Tools/w3pimms.html for an absorbed power-law spectrum with cm-2 and a photon index of 1.8, and applying the prescription for low number statistics given by Gehrels 1986). In Figure 1 we show a Swift/XRT image during IGR J17191–2821 outburst (May 10th, 2007).
As noted by Klein-Wolt et al. (2007a), the formal INTEGRAL error circle on the position of IGR J17191–2821 would suggest that the faint source we detected with Swift is unrelated to IGR J17191–2821 (see Figure 1). However, given the systematic uncertainties in the INTEGRAL position, both sources are probably one and the same. We note that this is not the first case in which the true position of a transient laid outside the reported INTEGRAL-IBIS/ISGRI error circle (see e.g. Kuulkers et al., 2007a).

3.2 Thermonuclear X-ray bursts and the distance to the source
We found 5 Type I X-ray bursts (see Table 1). All bursts showed similar temperature, radius and bolometric flux profiles (not shown). The temperature and flux profiles were all single peaked, and reached their maxima within a second. The maximum temperature (kT) was always between 2 and 3 keV and the peak bolometric fluxes were in the erg s-1 cm-2 range (Table 1). In all cases, the black-body radius remained approximately constant after the peak and was usually constrained between 5 and 10 km (assuming a distance of 11 kpc). None of the bursts showed indications of photospheric radius expansion. By using the highest measured bolometric peak flux of erg s-1 cm-2 we can estimate an upper limit on the distance. We find a distance kpc when using the empirically determined Eddington luminosity of erg s-1 (for bursts showing photospheric radius expansion – Kuulkers et al., 2003). Using a more complex approximation555The approximation was recently used by Galloway et al. (2008) to compare a sample of more than a thousand X-ray burst from different sources. The distance is given by: where is the mass of the neutron star in solar masses, is the mass fraction of hydrogen in the neutron star atmosphere and z(R) is the term that takes into account the gravitational redshift at the photosphere (were , is the gravitational constant, the speed of light and the radius measured at the photosphere – see Galloway et al., 2008). and standard values for the mass and the radius of the neutron star (i.e. and km), we found and for hydrogen mass fractions of and , respectively. Larger values of give higher upper limits.
3.3 kHz QPOs
We searched the averaged power spectrum of each observation for the presence of significant kHz QPOs at frequencies Hz. In each case, we fitted the power spectra between 200 and 4000 Hz with a model consisting of one or two Lorentzians and a constant to account for the presence of QPOs and Poisson noise, respectively. We found that 12 out of the 17 observations show significant QPOs in the 605-1185 frequency range. In 4 observations we detected 2 simultaneous kHz QPOs (see Table 2). The lower kHz QPO frequency was between 680 and 870 Hz, with single trial significance between 5.7 and 10. The upper kHz QPO frequency was between 1037 and 1085 Hz, with single trial significances between 3.0 and 3.7. showed no significant changes and was always consistent with Hz (see Table 2).
We tried to better constrain by using the shift–and–add method as described by Méndez et al. (1998). We first tried to trace the detected kilohertz QPO using a dynamical power spectrum (e.g. see figure 2 in Berger et al., 1996) to visualize the time evolution of the QPO frequency, but the signal was too weak to be detected on timescales shorter than the averaged observation. Therefore, for each observation we used the fitted averaged frequency to shift each lower kHz QPO to the arbitrary frequency of 700 Hz. Next, the shifted, aligned, power spectra were averaged. The average power spectrum was finally fitted in the range 300–2048 Hz so as to exclude the edges, which are distorted due to the shifting method. To fit the averaged power spectrum, we used a function consisting of two Lorentzians and a constant to fit the QPO and the Poisson noise, respectively. In this case, the averaged is Hz. In Figure 2 we show the shift–and-added power spectrum and a representative example of the single observation power spectrum with two kHz QPOs (see inset).
| ObsID | MJD | Aver. | PCUs | Lower | Upper | |||||
| (92052-10) | (days) | Cts/sa | onb | kHz QPO | kHz QPO | |||||
| /PCU2 | (Hz) | FWHM (Hz) | rms (%) | (Hz) | FWHM (Hz) | rms (%) | (Hz) | |||
| -01-00 | 54224.09 | 182 | 2 | – | – | – | – | – | – | – |
| -02-00 | 54225.07 | 170 | 3-4 | |||||||
| -02-01 | 54225.14 | 188 | 3 | – | – | – | – | |||
| -03-00 | 54226.21 | 172 | 1-3 | – | – | – | – | |||
| -05-00 | 54227.10 | 142 | 2-3 | |||||||
| -03-01 | 54227.23 | 148 | 2 | |||||||
| -04-00 | 54228.01 | 156 | 3 | – | – | – | – | |||
| -04-01 | 54228.20 | 151 | 2-3 | – | – | – | – | |||
| -06-00 | 54228.70 | 129 | 2-3 | – | – | – | – | |||
| -06-01 | 54228.90 | 130 | 2-3 | |||||||
| -07-00 | 54229.06 | 105 | 1-2 | – | – | – | – | |||
| -07-01 | 54229.98 | 72 | 2 | – | – | – | – | |||
| -05-01 | 54230.04 | 70 | 2 | – | – | – | – | |||
| -08-00 | 54231.09 | 46 | 2 | – | – | – | – | – | – | – |
| -08-01 | 54231.75 | 27 | 2-3 | – | – | – | – | – | – | – |
| -09-00 | 54232.01 | 23 | 3 | – | – | – | – | – | – | – |
| -09-01 | 54232.08 | 21 | 3-4 | – | – | – | – | – | – | – |
3.4 Outburst evolution
Figure 3 shows the PCA light curve of IGR J17191–2821 as seen by the PCA bulge scan monitor program (Swank & Markwardt, 2001). While a precursor of the outburst (see Section 1.1) occurred at MJD 54162.6, the full X-ray outburst did not start until 54 days later (i.e. MJD 54216); it lasted for about 30 days.
On MJD 54247 (May 27th, 2007) the source was not detected anymore with RXTE, and a Chandra/HRC-I observation was performed. As reported by Chakrabarty et al. (2007), the source was not detected in the 1.1 ks observation within the 30 arcsec of the Swift/XRT position (see Section 3.1). These authors estimated an upper limit on the 0.3–10 keV unabsorbed flux of erg s-1 cm-2.

In Figure 4 we show the persistent unabsorbed 2-200 keV flux (panel ), power law index (panel ), strength of the broad band noise (panel ) and kHz QPO frequency (panel ) as a function of time during the 3 weeks of the outburst from which RXTE pointed observations are available. The source reached a maximum flux of 2.5 erg cm2 s-1. Assuming kpc (see Section 3.2), we place an upper limit on the outburst peak luminosity of erg s-1. In panel of Figure 4 we also plot the (Type I) X-ray burst bolometric peak fluxes at the time they occurred (as detected by RXTE).
Due to the relatively low count rates collected by the PCA, the average power spectrum of each observation had low statistical quality. However, in the brightest (and softest) observations we found traces of the so-called very low frequency noise (VLFN). As a steep power law rising towards low frequencies, this VLFN is a typical signature of the so called “banana branch” (soft state) of atoll sources (see, e.g., van der Klis, 2006, for a review). When comparing the results showed in the different panels of Figure 4, we found that the 5-50 Hz averaged fractional rms amplitude is anti-correlated with the source luminosity, whereas the frequencies of both kHz QPOs showed no obvious trend. The spectral index was clearly anti-correlated with the strength of the variability (i.e, correlates with luminosity). This is similar to what has been found in other atoll sources (see, e.g., van der Klis, 2006, for a review), where the strength of the variability and the spectral index trace the changes in the timing and spectral state during the outburst. From Figure 4, we found that the source was initially in the soft (banana) state and showed a failed transition to the hard (extreme island) state around MJD 54226. After this, it re-brightened and returned to the soft state. On MJD 54228 (i.e. two days later) the luminosity reached a secondary peak and started to decline, while the source gradually transitioned from the soft (banana) state to the hard (extreme island) state. Finally IGR J17191–2821 faded below the detection limit of RXTE-PCA. The timing and spectral properties (and evolution) allow us to firmly establish the atoll source nature of IGR J17191–2821.

3.5 Burst oscillations
By applying the method (see Section 2.3) on the 2–60 keV X-ray burst data, we discovered highly significant nearly-coherent oscillations in 2 of the 5 X-ray bursts (Burst 1 and 4 in Table 1). For the remaining 3 bursts, we repeated the analysis using only data in different energy sub-bands. We found that the oscillations were significantly detected also in burst number 2, but only in the 10–25 keV range. The oscillations are not significantly detected in either burst 3 or 5. Fractional rms amplitudes (averaged over the period the signal was significantly detected) and upper limits are given in Table 1. In Figure 5 we show the dynamical power spectra of bursts 1 and 4 (upper and lower panels, respectively) in the 2–60 keV range. As can be seen, the frequency of the oscillations drifts from 291Hz (burst 1) and Hz (burst 2), to a frequency between 294 and 294.5 Hz. Maximum powers of were found in both cases. This type of frequency drifts are typical for burst oscillations during Type I X-ray bursts (see, e.g., Strohmayer, 2001, for a review).


3.6 The energy dependence of the burst oscillations
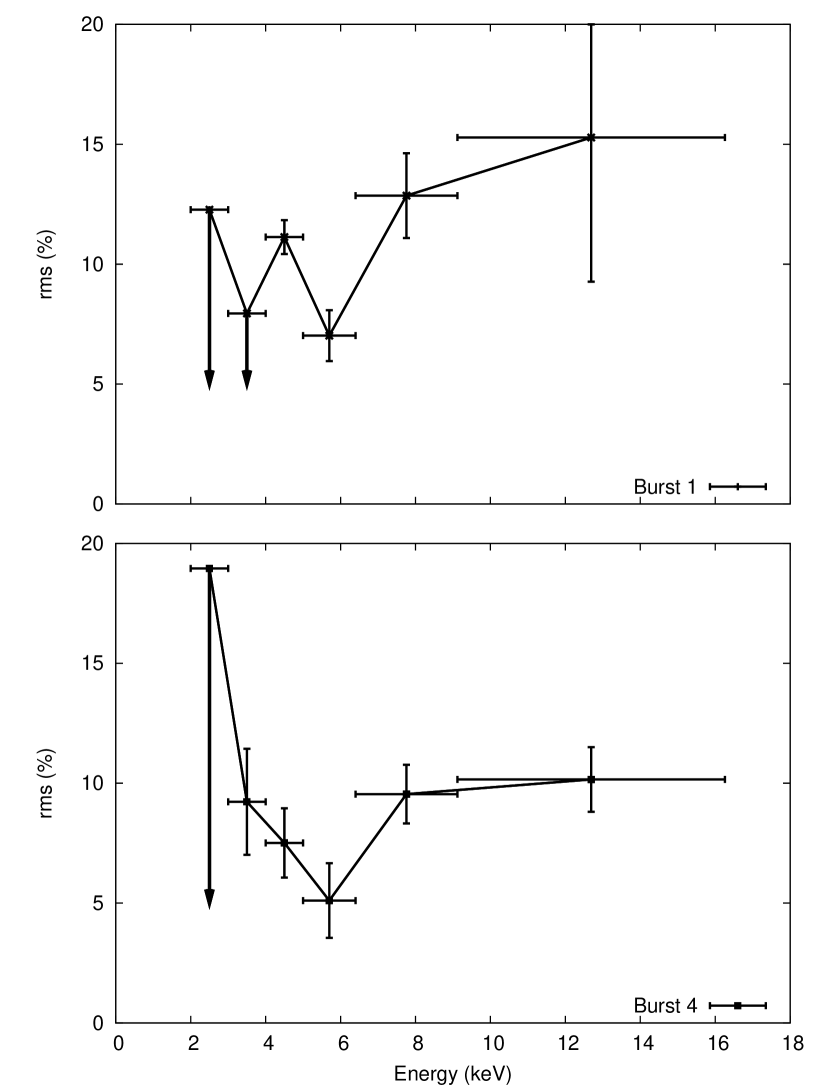
We analyzed the energy dependence of bursts 1 and 4 which showed the strongest oscillations – see Table 1. We split the data in six energy bands (from 2.5 keV to 17 keV), and calculated the amplitude of the pulsations in each band. To create a pulse profile in each energy band, we selected all the data with a significant pulse detection in the corresponding power spectrum, and explored the space around a given initial guess value for the pulse period (obtained from the power spectrum). and were initially set to zero. We note that and do not represent true spin changes of the neutron star, but comprise all the frequency variations due, primarily, to the burst oscillation drift seen in the data. and are therefore useful to align the phases of the pulsations (folded in a profile of 32 bins) for each energy band. We then fitted the pulse profiles with two sinusoids representing the fundamental and the 1st overtone of the burst oscillations. The errors on the fractional amplitudes are calculated using a . Upper limits are at a 95 confidence level (i.e. using ). We found no significant second harmonic in any of the energy bands we chose for either burst, with rms amplitude upper limits in the keV range of 3.7 and , for bursts 1 and 4 respectively. The energy dependence of the burst oscillation rms amplitude is shown in Figure 6. The fractional amplitude of the fundamental is consistent with being constant. No significant phase lags were detected.
4 Discussion
We present an intensive study of the X-ray variability of the newly discovered neutron star LMXB IGR J17191–2821. Our results allow us to firmly establish the atoll source nature of IGR J17191–2821. We detect several episodes of thermonuclear X-ray bursts, some of them showing burst oscillations that imply a neutron star with spin frequency of Hz. We also detect several instances of kHz QPOs; when two were detected simultaneously, the difference in frequency is consistent with being constant (See Table 2). The energy and broadband power spectra of IGR J17191–2821 evolved in a manner consistent with that seen in other neutron star LMXBs: it is soft when the flux is high and hard when the flux is low. Near the end of the outburst, IGR J17191–2821 shows the hardest spectra and strongest variability, with an rms amplitude above 15%.
Two months before the main outburst, the source exhibited a very brief (only days) event which was nearly an order or magnitude less luminous. It is unclear what the relation of this event is with respect to the main outburst. However, we note that similar precursors have been seen before (see, e.g., Degenaar & Wijnands, 2009). To our knowledge, no systematic search has been performed in order to quantify how common these precursors are and how they can be explained in the commonly used disk-instability models proposed for outbursts of X-ray binaries (see Lasota, 2001, for a review).
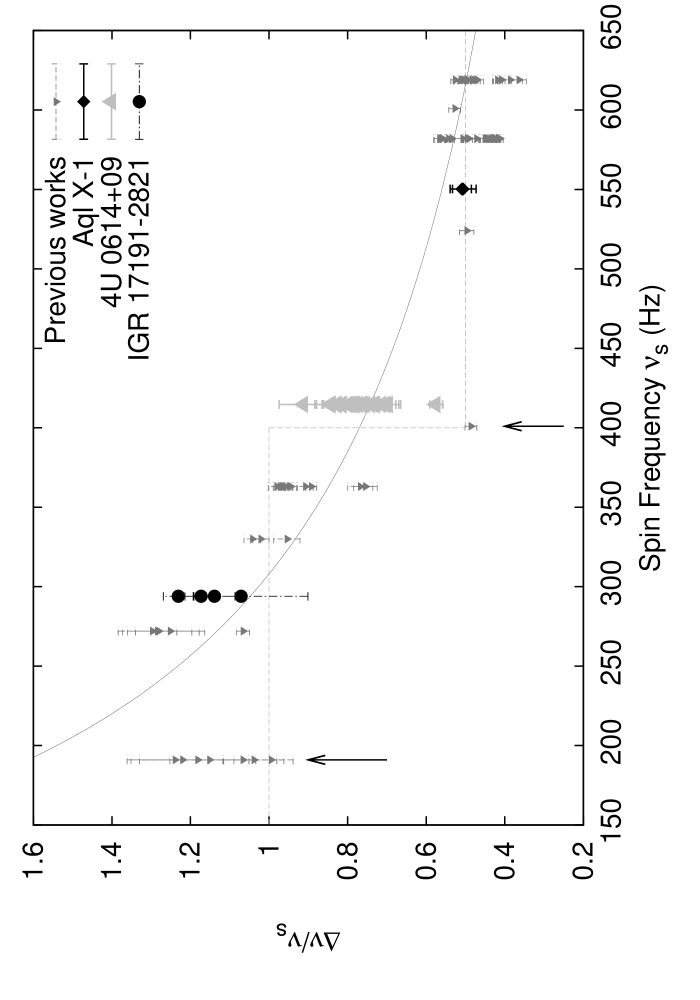
There are currently 12 LMXBs with reported measurements whose spin can be estimated from either pulsations in their persistent X-ray emission or from burst oscillations (van der Klis, 2008, for a recent overview). In Figure 7 (upper panel) we plot vs. for all these sources (cf. van der Klis, 2006; Méndez & Belloni, 2007; van der Klis, 2008). The dashed line represents a step function: for the slow rotators ( Hz) and for the fast rotators ( Hz). Although most of the data seem to be consistent with this scheme (and our data of IGR J17191-2821 are as well), certainly there are points that do not follow this relation. A clear example is given by the neutron star 4U 0614+09. A tentative Hz burst oscillation frequency was recently reported for this source (Strohmayer et al., 2008, note that we quote this value as tentative since it has been detected only once, the signal showed no frequency drift as expected from burst oscillations, and it was the first and only detection to date of burst oscillations with the Burst Alert Telescope on board the Swift telescope). As shown in Figure 7 this burst oscillation frequency is very close to the discontinuity of the step function (although given the present data, the discontinuity of the step function could be anywhere between and 401 Hz; furthermore, to our knowledge none of the models predict the exact value at which should switch from 1 to 0.5). At the same time, seems to cover almost the complete 0.5–1. range (van Straaten et al., 2000), although we note that 93% of the measurements are in the 0.69–0.85 range and the average using all measurements is (see also, Boutelier et al., 2009).
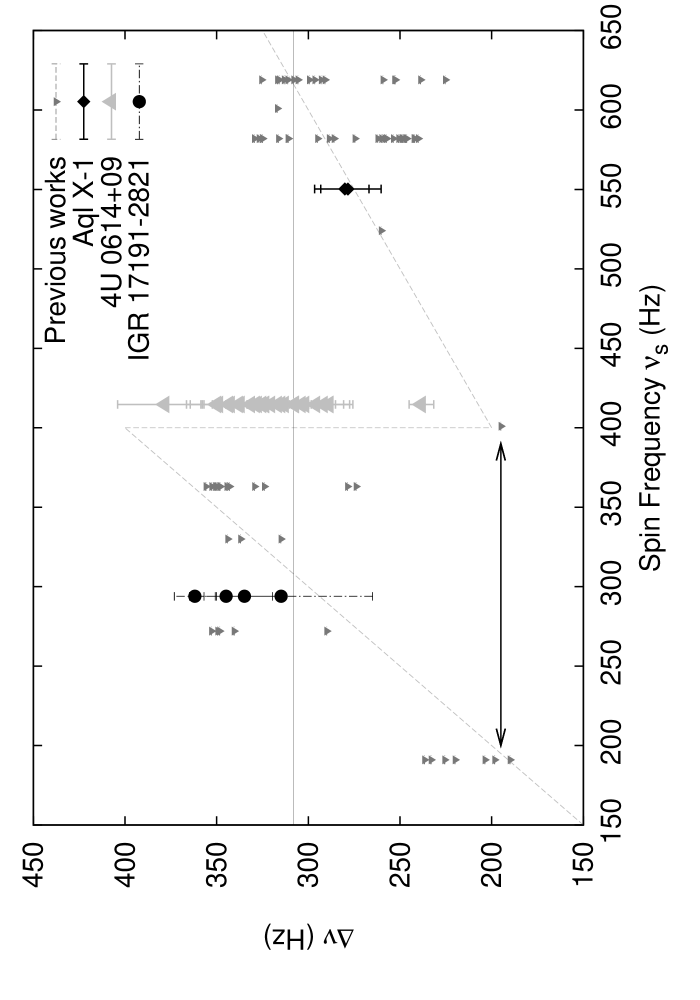
Méndez & Belloni (2007) have recently suggested that and are unrelated and that the division between fast and slow rotators may be just an effect of the low number of sources showing both phenomena (see also Yin et al., 2007). In the lower panel of Figure 7 we show and for the same data plotted in the upper panel. The dashed line in this panel corresponds to the average Hz Méndez & Belloni (2007). As can be seen, the range of most sources overlaps with this constant value, except for the two AMXPs SAX J1808.4–3658 and XTE J1807–294, for which falls clearly below 300 Hz. The discrepancy is solved, if the data for these two sources are multiplied by a factor of 1.5. This was first suggested by Méndez & Belloni (2007) based on the works of van Straaten et al. (2005) and Linares et al. (2005) 666Previous works have shown that the frequencies of the variability components observed in atoll sources follow a universal scheme of correlations when plotted versus (see e.g. van Straaten et al., 2002, 2003; Reig et al., 2004; Altamirano et al., 2008b, and references therein). The two AMXPs SAX J1808.4–3658 and XTE J1807–294 show similar relations. However, the relations for these two sources are shifted with respect to those of the other sources (van Straaten et al., 2005; Linares et al., 2005). This shift is between the frequencies of the low-frequency components and by a factor around 1.5 (1.45 and 1.59 for SAX J1808.4–3658 and XTE J1807–294, respectively) and between and by a similar factor. . We note that not all AMXPs are affected by the same multiplicative factor (van Straaten et al., 2005), and furthermore, that the factor might be independent of whether the neutron star pulsates or not (Altamirano et al., 2005).
Clearly, the present data are not enough to draw any final conclusion on the relation between and ; the detection of both the spin frequency and in other sources is necessary. The new instrument ASTROSAT (an Indian multiwavelength Astronomy Satellite), which is planned to be launched in 2010, will play a major role in solving this issue as it is likely to increase the sample of sources with both spin frequency and kHz QPOs measurements.
Acknowledgments: This research has made use of data obtained from the High Energy Astrophysics Science Archive Research Center (HEASARC), provided by NASA’s Goddard Space Flight Center. We are grateful to the referee for her/his comments that helped to strengthen some of the points presented in this paper.
References
- Altamirano et al. (2005) Altamirano D., van der Klis M., Méndez M., et al., 2005, \apj, 633, 358
- Altamirano et al. (2008a) Altamirano D., Casella P., Patruno A., Wijnands R., van der Klis M., Feb. 2008a, \apjl, 674, L45
- Altamirano et al. (2008b) Altamirano D., van der Klis M., Méndez M., et al., Sep. 2008b, \apj, 685, 436
- Arnaud (1996) Arnaud K.A., 1996, In: Jacoby G.H., Barnes J. (eds.) Astronomical Data Analysis Software and Systems V, vol. 101 of Astronomical Society of the Pacific Conference Series, 17–+
- Barret et al. (2006) Barret D., Olive J.F., Miller M.C., 2006, \mnras, 370, 1140
- Barret et al. (2008) Barret D., Boutelier M., Miller M.C., Mar. 2008, \mnras, 384, 1519
- Berger et al. (1996) Berger M., van der Klis M., van Paradijs J., et al., 1996, \apjl, 469, L13+
- Boutelier et al. (2009) Boutelier M., Barret D., Miller M.C., Jul. 2009, ArXiv e-prints
- Casella et al. (2008) Casella P., Altamirano D., Patruno A., Wijnands R., van der Klis M., Feb. 2008, \apjl, 674, L41
- Chakrabarty et al. (2003) Chakrabarty D., Morgan E.H., Wijnands R., et al., Mar. 2003, In: Bulletin of the American Astronomical Society, vol. 35 of Bulletin of the American Astronomical Society, 657–+
- Chakrabarty et al. (2007) Chakrabarty D., Krauss M.I., Jonker P.G., Juett A.M., Markwardt C.B., Jun. 2007, The Astronomer’s Telegram, 1096, 1
- Degenaar & Wijnands (2009) Degenaar N., Wijnands R., Feb. 2009, \aap, 495, 547
- Galloway et al. (2008) Galloway D.K., Muno M.P., Hartman J.M., Psaltis D., Chakrabarty D., Dec. 2008, \apjs, 179, 360
- Gehrels (1986) Gehrels N., Apr. 1986, \apj, 303, 336
- Jahoda et al. (2006) Jahoda K., Markwardt C.B., Radeva Y., et al., 2006, \apjs, 163, 401
- Jonker et al. (2002) Jonker P.G., Méndez M., van der Klis M., 2002, \mnras, 336, L1
- Kaaret et al. (2006) Kaaret P., Morgan E.H., Vanderspek R., Tomsick J.A., 2006, \apj, 638, 963
- Klein-Wolt et al. (2007a) Klein-Wolt M., Wijnands R., Markwardt C.B., Swank J.H., Mar. 2007a, The Astronomer’s Telegram, 1025, 1
- Klein-Wolt et al. (2007b) Klein-Wolt M., Wijnands R., Swank J.H., Markwardt C.B., May 2007b, The Astronomer’s Telegram, 1065, 1
- Klein-Wolt et al. (2007c) Klein-Wolt M., Wijnands R., Swank J.H., Markwardt C.B., May 2007c, The Astronomer’s Telegram, 1075, 1
- Krimm et al. (2007) Krimm H.A., Markwardt C.B., Deloye C.J., et al., Oct. 2007, \apjl, 668, L147
- Kuulkers et al. (1994) Kuulkers E., van der Klis M., Oosterbroek T., et al., 1994, \aap, 289, 795
- Kuulkers et al. (2003) Kuulkers E., den Hartog P.R., in’t Zand J.J.M., et al., 2003, \aap, 399, 663
- Kuulkers et al. (2007a) Kuulkers E., Shaw S., Chenevez J., et al., Feb. 2007a, The Astronomer’s Telegram, 1008, 1
- Kuulkers et al. (2007b) Kuulkers E., Shaw S.E., Paizis A., et al., May 2007b, \aap, 466, 595
- Lasota (2001) Lasota J.P., Jun. 2001, New Astronomy Review, 45, 449
- Linares et al. (2005) Linares M., van der Klis M., Altamirano D., Markwardt C.B., Dec. 2005, \apj, 634, 1250
- Liu et al. (2007) Liu Q.Z., van Paradijs J., van den Heuvel E.P.J., Jul. 2007, \aap, 469, 807
- London et al. (1984) London R.A., Howard W.M., Taam R.E., Dec. 1984, \apjl, 287, L27
- Markwardt et al. (2007) Markwardt C.B., Klein-Wolt M., Swank J.H., Wijnands R., May 2007, The Astronomer’s Telegram, 1068, 1
- Méndez & Belloni (2007) Méndez M., Belloni T., Oct. 2007, \mnras, 381, 790
- Méndez et al. (1998) Méndez M., van der Klis M., Wijnands R., et al., 1998, \apjl, 505, L23+
- Miller et al. (1998) Miller M.C., Lamb F.K., Psaltis D., 1998, \apj, 508, 791
- Muno et al. (2001) Muno M.P., Chakrabarty D., Galloway D.K., Savov P., Jun. 2001, \apjl, 553, L157
- Reig et al. (2004) Reig P., van Straaten S., van der Klis M., 2004, \apj, 602, 918
- Strohmayer (2001) Strohmayer T.E., 2001, Advances in Space Research, 28, 511
- Strohmayer & Markwardt (1999) Strohmayer T.E., Markwardt C.B., May 1999, \apjl, 516, L81
- Strohmayer et al. (1996) Strohmayer T.E., Zhang W., Swank J.H., et al., 1996, \apjl, 469, L9+
- Strohmayer et al. (2003) Strohmayer T.E., Markwardt C.B., Swank J.H., in’t Zand J., 2003, \apjl, 596, L67
- Strohmayer et al. (2008) Strohmayer T.E., Markwardt C.B., Kuulkers E., Jan. 2008, \apjl, 672, L37
- Swank & Markwardt (2001) Swank J., Markwardt K., 2001, in ASP Conf. Ser. 251, New Century of X-ray Astronomy, eds. H. Inoue & H. Kunieda (San Francisco: ASP), 94
- Swank et al. (2007) Swank J.H., Markwardt C.B., Klein-Wolt M., Wijnands R., Mar. 2007, The Astronomer’s Telegram, 1022, 1
- Turler et al. (2007) Turler M., Balman S., Bazzano A., et al., Mar. 2007, The Astronomer’s Telegram, 1021, 1
- van der Klis (2006) van der Klis M., 2006, in Compact Stellar X-Ray Sources, ed. W. H. G. Lewin & M. van der Klis (Cambridge: Cambridge Univ. Press)
- van der Klis (2008) van der Klis M., Oct. 2008, In: Wijnands R., Altamirano D., Soleri P., et al. (eds.) American Institute of Physics Conference Series, vol. 1068 of American Institute of Physics Conference Series, 163–173
- van der Klis et al. (1997) van der Klis M., Wijnands R.A.D., Horne K., Chen W., 1997, \apjl, L97+
- van Paradijs (1982) van Paradijs J., Mar. 1982, \aap, 107, 51
- van Straaten et al. (2000) van Straaten S., Ford E.C., van der Klis M., Méndez M., Kaaret P., 2000, \apj, 540, 1049
- van Straaten et al. (2002) van Straaten S., van der Klis M., di Salvo T., Belloni T., 2002, \apj, 568, 912
- van Straaten et al. (2003) van Straaten S., van der Klis M., Méndez M., 2003, \apj, 596, 1155
- van Straaten et al. (2005) van Straaten S., van der Klis M., Wijnands R., 2005, \apj, 619, 455
- Watts et al. (2008) Watts A.L., Krishnan B., Bildsten L., Schutz B.F., Sep. 2008, \mnras, 389, 839
- Watts et al. (2009) Watts A.L., Altamirano D., Linares M., et al., Apr. 2009, ArXiv e-prints
- Wijnands (2005) Wijnands R., 2005, ArXiv Astrophysics, astro-ph/0501264
- Wijnands et al. (2003) Wijnands R., van der Klis M., Homan J., et al., 2003, \nat, 424, 44
- Yin et al. (2007) Yin H.X., Zhang C.M., Zhao Y.H., et al., Aug. 2007, \aap, 471, 381
- Zhang et al. (1993) Zhang W., Giles A.B., Jahoda K., et al., 1993, In: Proc. SPIE Vol. 2006, p. 324-333, EUV, X-Ray, and Gamma-Ray Instrumentation for Astronomy IV, Oswald H. Siegmund; Ed., 324–333