Reversal of Nonlocal Vortex Motion in the Regime of Strong Nonequilibrium
Abstract
We investigate nonlocal vortex motion in weakly pinning -NbGe nanostructures, which is driven by a transport current and remotely detected as a nonlocal voltage . At high , the measured exhibits dramatic sign reversals that at low and high temperatures occur for opposite polarities of . The sign of becomes independent of that of the drive current at large . These unusual effects can be nearly quantitatively explained by a novel enhancement of magnetization, arising from a nonequilibrium distribution of quasiparticles at high , and a Nernst-like effect resulting from local electron heating at low .
pacs:
74.25.Qt,74.25.Fy,74.78.Db,74.78.NaMotion of the Abrikosov vortex lattice in type-II superconductors results in strong deviations of the quasi-particle distribution function from that in equilibrium Larkin2 ; Kunchur ; Kunchur2 when the lattice is strongly driven by a transport current. Close to the critical temperature , overheating of quasiparticles within the vortex cores leads to a shrinkage of the cores, accompanied by decreasing the effective viscosity coefficient - the Larkin-Ovchinnikov (LO) instability Larkin2 , while the quasiparticles outside the cores remain in thermal equilibrium. At low , the entire quasiparticle subsystem is heated because of the larger electron-phonon collision time. This results in an expansion of the cores instead of their shrinkage, while again decreases Kunchur ; Kunchur2 . In both cases, the current-voltage [] characteristics are very nonlinear - can become even hysteretic BabicNbGe - and are in fact so similar that the difference can be resolved only via a quantitative analysis BabicNbGe ; Babic . However, vortex shrinkage and vortex expansion are different effects and should lead to qualitative differences in other properties.
In this Letter, we report novel effect in the recently discovered nonlocal vortex flow in the transversal flux transformer geometry (TFTE) Grigorieva ; Helzel , which allow a clear distinction of the above two opposite types of nonequilibrium. We apply a drive current in one part of the sample (local lead) and measure the voltage response () in a remote part of the superconductor connected with first one via a channel of the same material [see the inset to Fig. 1(a)]. In such a geometry, one can probe changes in the vortex lattice which occur in the local lead via changes in the interaction between vortices in the local lead and vortices in the rest of the sample. In this way, we can detect a novel nonequilibrium enhancement of the magnetization of the superconductor in the LO state with respect to the equilibrium magnetization and observe a Nernst-like signal at low .
Previously, was investigated in the linear response regime Grigorieva ; Helzel . The main features of these studies can be accounted for by a simple model of locally driven vortices pressurizing those in the channel by repulsive vortex-vortex interaction Helzel . applied between the contacts 1 and 2 in the inset to Fig. 1(a) decreases exponentially in the perpendicular channel, with a decay length Grigorieva ; OttoDiss . Thus, driven vortices face vortices in the channel, where is the effective length over which the driving force (per unit vortex length ) acts, the vortex density, the magnetic flux quantum, , the external magnetic field, the magnetization, and . The driven vortices push or pull those in the channel by exerting a pressure . The resulting force is balanced by the total frictional force on the vortices in the channel (which move at velocity ). For a superconductor with a large magnetic penetration depth , i.e., , using for the voltage detected at the probes 3 and 4, one obtains
| (1) |
At low , i.e., close to equilibrium, is given by the Lorentz force , where is the transport current density. In Ref. Helzel , led to . This reproduced the observed and even in the presence of pinning 111Pinning affects , but could be accounted for by a modified ..
Our nm thick -Nb0.7Ge0.3 samples are produced by electron-beam lithography and magnetron sputtering. The local current leads (1,2) are connected to the nonlocal voltage probes (3,4) via a perpendicular channel of m and nm. All data for refer to passing between 1 and 3, and measuring between 2 and 4. Since is also the width of all other narrow sample parts, in particular that linking 1 and 2, and can be compared directly. Measurements of provided all relevant parameters of our samples: , the normal-state resistivity , , where is the equilibrium upper critical magnetic field, and the Ginzburg-Landau (GL) parameters , , and . The low pinning in -Nb0.7Ge0.3 allowed for dc measurements of , which was at the level of in the low- linear regime. All measurements were carried out in a 3He cryostat, with perpendicular to the film plane.
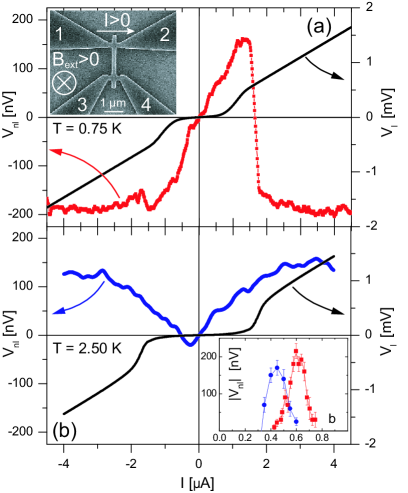
Typical results for the two limiting cases of low () and high () temperatures are shown in Fig. 1(a) and Fig. 1(b), respectively. The curves exhibit a nonlinear shape characteristic of strong-nonequilibrium (SNEQ), originating either in (a) electron heating Kunchur ; Babic ; BabicNbGe or (b) LO vortex-core shrinking Larkin2 ; Babic ; BabicNbGe . On the other hand, displays the previously observed linear, antisymmetric dependence [i.e., ] only at low . Upon increasing , sudden sign reversals of are observed in both regimes: at a certain , the antisymmetric signal converts into a symmetric one. The sign of can be unambiguously attributed to the following directions in the inset to Fig. 1(a): at low positive (negative) , the positive (negative) corresponds to vortex motion upwards (downwards) in the channel. When is high, vortices move either downwards (, ), or upwards ( , ), irrespective of the direction of . The saturation values of at high are plotted vs in the inset to Fig. 1(b). In both cases, nonzero values are observed only at intermediate , with a maximum efficiency around () at low (high) , similarly to the previously observed sweep traces of at low Grigorieva ; Helzel . As argued in Ref. Helzel , the vanishing of at low is presumably related to becoming smaller than the density of pinning sites, whereas because the sample goes to the normal state.
We first discuss the regime . Assigning the corresponding high- SNEQ state to electron heating to above the bath temperature was successful in explaining the measured of Refs. Kunchur ; Babic ; BabicNbGe . An analysis of the present OttoDiss within the same framework permits to extract and, using , also , which is more convenient for a comparison with the data (see below). The hot electrons penetrate into the channel, which remains at , roughly up to . Here, is the diffusion constant, and is the relaxation time of the hot electrons, resulting from the mentioned analysis OttoDiss . Hence, there is a gradient which leads to a thermal driving force and consequently to the Nernst effect. is the vortex transport entropy HuebenerBook . The Nernst effect should lead to vortex motion downwards, which agrees with the observed . Since K typically, the observed temperature gradients K/m are much larger than in usual measurements of the Nernst effect.
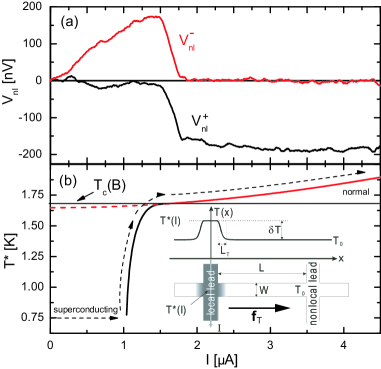
The above is elaborated in Fig. 2, where the result for () is analyzed more closely. The shape of in Fig. 1(a) suggests to consider the symmetric (+) and antisymmetric () parts of separately via , which is shown in Fig. 2(a). at low is fairly linear as expected, since , while is very small. Upon increasing , this is followed by a rapid suppression of and a simultaneous growth of to a constant value comparable to that of the maximum . Returning to Fig. 1(a), one can note that this dramatic change occurs around where , signifying the transition to the normal state in the local region Babic ; BabicNbGe and consequent vanishing of . Furthermore, where the sign of changes steeply on the side ( and act oppositely) coincides with where has a local minimum on the side ( and add); in both cases, this marks that only remains effective at higher .
In the main panel of Fig. 2(b), we plot extracted according to the electron heating model Babic ; BabicNbGe in the superconducting state and from noise measurements in the normal state OttoDiss , whereas in the inset we show a sketch of the profile along the sample. One can see that the electron heating is basically absent at low , then sets in very steeply until it reaches that represents Babic ; BabicNbGe ; OttoDiss , after which it changes with only weakly. The nearly flat at high hence corresponds to , so . Using Eq. (1), we can extract from our data by focusing on the saturating values of . We approximate and to obtain
| (2) |
which does not contain . Since and depend on the properties of the channel (where ), the observed follows straightforwardly. In the range of our data, we find Jm-1K-1 OttoDiss , which is in reasonable agreement with a theoretical estimate Jm-1K-1 obtained by using the Maki formula Maki ; Kopnin , as well as with experimental data on films of Nb ( Jm-1K-1) Huebener and of Pb-In ( Jm-1K-1) Vidal .
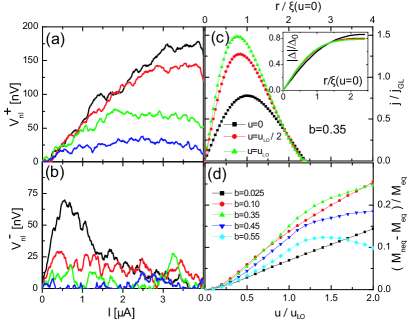
We now turn to the regime . An analysis OttoDiss of the in the spirit of Refs. Babic ; BabicNbGe reveals that this SNEQ state corresponds to the LO vortex-core shrinking Larkin2 , with everywhere because electron heating is strongly suppressed close to Kunchur ; Babic ; BabicNbGe . for and are at first glance rather similar, so the difference becomes obvious only through a numerical analysis Babic ; BabicNbGe . In contrast, the qualitatively different curves in Fig. 1 leave no doubt that we are dealing with two distinct SNEQ phenomena. As before, the shape of [see Fig. 1(b)] suggests to consider and separately, which is shown in Figs. 3(a) and 3(b), respectively. at low is linear for small , which implies the presence of , whereas this is difficult to claim for higher where the signal is small over the entire range. At high , however, is small regardless of . , on the other hand, increases with increasing , and eventually saturates at a value comparable to that of the maximum Nernst signal at low , albeit with the opposite sign. The smallness of at high suggests inefficiency of in this regime. This can be understood by recalling [see Fig. 1(b)] that the for these is close to the normal-state dissipation, which means that most of the current is normal Larkin2 - and normal current does not contribute to .
Since is negligible and , there must be yet another driving force which governs the TFTE at high . Below we show that this force has the same origin as the LO effect on , that is, a deviation of the quasiparticle distribution function from in equilibrium. An additional consequence of is an enhancement of the supercurrent density flowing around the vortex core, which can be calculated following Larkin2 ; Schmid
| (3) |
where is the order parameter and A the vector potential. The term corresponds to the equilibrium contribution to in the GL model, and the term to the SNEQ correction. is positive for energies less than the maximal value of the order parameter in a single-vortex cell Larkin2 , and is enhanced near the vortex core [see the inset to Fig. 3(c)]. Both these factors lead to a growth of near the vortex core [see Eq. (3)]. Therefore, the magnetic moment of each cell in the vortex lattice increases in the LO state.
We base our model on addressing to find along the direction of , which is alternative (but much simpler with regard to the role of ) to using the Gibbs free energy density for the same purpose. Qualitatively, of a given cell creates a dipole magnetic field which in the surrounding cells opposes , hence an increase of results in a stronger diamagnetic response. Note that the same argument can be used to explain increase of the equilibrium diamagnetism of the mixed state as decreases. Quantitatively, we have to determine and . We follow the LO model and solve numerically the modified GL equation for (see Eq. (A49) in Larkin2 ) coupled with the equation for (see Eq. (A45) in Larkin2 ).
In Fig. 3(c), we plot exemplary vs reduced radial coordinate , where is the equilibrium GL depairing current density, , and corresponds to that at zero vortex velocity . Results are shown for three different relative to the LO vortex velocity Larkin2 ; the corresponding is shown in the inset by the same colors. By summing up the resulting of each cell, one can find the difference of the nonequilibrium () and equilibrium () magnetization. This is presented in Fig. 3(d). The maximum of occurs for (at ). At smaller , the enhancement of near the core gives a small contribution to . At larger , the suppression of at the cell boundary [due to for ] becomes important. We show results up to , where the LO approach becomes invalid at .
The spatial variation of across the boundary between the local region and the channel occurs over a length of about the intervortex distance , and induces a current density that flows along that boundary. This current creates a force that is again independent of the direction of , pulls the vortices toward the local lead (which results in ), and dominates the total in the SNEQ regime near . The typical (T at ) is rather small but appears over a very small distance , thus providing which is of the same order as the transport current densities we used - as corresponds to . We again employ Eq. (1) to estimate . Since and , with we obtain
| (4) |
from which has dropped out again. Inserting typical values of and , we find , which is quite close to the measured values.
In view of the simplicity of our model, the agreement between the experiment and theory is rather remarkable. A full quantitative account of the phenomenon would require inclusion of other effects on the interface of the local region and the channel - such as details of entry/exit trajectories for the fast and slow vortices, etc. However, these corrections may depend on the sample geometry, and we believe that the main physics of TFTE close to is captured by our model.
In conclusion, nonlocal measurements allowed us to qualitatively distinguish two different types of vortex motion in strong nonequilibrium. According to our theory, close to a new type of nonequilibrium magnetization is built up in the drive wire, which pulls the vortices towards the drive channel. At low temperatures, electron heating leads to a Nernst effect, which pushes vortices away from the drive channel. Remarkably, this happens irrespectively of the sign of the drive current in both cases. The qualitative features as well as the absolute values of the observed nonlocal voltages agree well with the results of our model calculations. Our results offer a new possibility to probe the presence of vortices or vortex-like excitations as currently discussed in the context of cuprate superconductors kokanovic .
Acknowledgements.
We acknowledge discussions with I. Kokanović, V. Vinokur, Y. Galperin and R. Gross, and financial support by the DFG within GK 638. A.B. acknowledges support from the Croatian Science Foundation (NZZ). D.Y.V. acknowledges support from Dynasty Foundation.References
- (1) A. I. Larkin and Yu. N. Ovchinnikov, in Nonequilibrium Superconductivity, edited by D. N. Langenberg, A. I. Larkin (North Holland, Amsterdam, 1986).
- (2) M. N. Kunchur, Phys. Rev. Lett. 89, 137005 (2002).
- (3) M. N. Kunchur, B. I. Ivlev, and J. M. Knight, Phys. Rev. Lett. 87, 177001 (2001).
- (4) D. Babić, in New Frontiers in Superconductivity Research, edited by B. S. Martins (Nova Science Publishers, New York, 2006).
- (5) D. Babić,et al., Phys. Rev. B 69, 092510 (2004).
- (6) I. V. Grigorieva et al., Phys. Rev. Lett. 92, 237001 (2004).
- (7) A. Helzel et al., Phys. Rev. B 74, 220510(R) (2006).
- (8) F. Otto, Ph.D. thesis, (Universitätsverlag Regensburg, 2008); M. Henny et al., Phys. Rev. B 59, 2871 (1999).
- (9) R. P. Huebener, Magnetic Flux Structures in Superconductors, (Springer, New York, 2001).
- (10) K. Maki, J. Low Temp. Phys. 1, 45 (1969).
- (11) N. B. Kopnin, J. Low Temp. Phys. 1, 45 (1969).
- (12) R. P. Huebener and A. Seher, Phys. Rev. 181, 701 (1969).
- (13) F. Vidal, Phys. Rev. B 8, 1982 (1973).
- (14) A. Schmid, G. Schön, and M. Tinkham, Phys. Rev. B 21, 5076 (1980).
- (15) see, e.g., I. Kokanović, J. R. Cooper, and M. Matusiak, Phys. Rev. Lett. 102, 187002 (2009) and refs. therein.