HI as a Probe of the Large Scale Structure in the Post-Reionization Universe
Abstract
We model the distribution of neutral Hydrogen (HI hereafter) in the post-reionization universe. This model uses gravity only N-Body simulations and an ansatz to assign HI to dark matter haloes that is consistent with observational constraints and theoretical models. We resolve the smallest haloes that are likely to host HI in the simulations, care is also taken to ensure that any errors due to the finite size of the simulation box are small. We then compute the smoothed one point probability distribution function and the power spectrum of fluctuations in HI. This is compared with other predictions that have been made using different techniques. We highlight the significantly high bias for the HI distribution at small scales. This aspect has not been discussed before. We then discuss the prospects for detection with the MWA, GMRT and the hypothetical MWA5000. The MWA5000 can detect visibility correlations at large angular scales at all redshifts in the post-reionization era. The GMRT can detect visibility correlations at lower redshifts, specifically there is a strong case for a survey at . We also discuss prospects for direct detection of rare peaks in the HI distribution using the GMRT. We show that direct detection should be possible with an integration time that is comparable to, or even less than, the time required for a statistical detection. Specifically, it is possible to make a statistical detection of the HI distribution by measuring the visibility correlation, and, direct detection of rare peaks in the HI distribution at with the GMRT in less than hours of observations.
keywords:
methods: N-Body simulations, cosmology: large scale structure of the universe, galaxies: evolution, radio-lines: galaxies1 Introduction
Large scale structures in the universe are believed to have formed by gravitational amplification of small perturbations (Peebles, 1980; Shandarin & Zeldovich, 1989; Peacock, 1999; Padmanabhan, 2002; Bernardeau et al., 2002). Much of the matter in galaxies and clusters of galaxies is the so called dark matter that is believed to be weakly interacting and non-relativistic (Trimble, 1987; Komatsu et al., 2009). Dark matter responds mainly to gravitational forces, and by virtue of larger density than baryonic matter, assembly of matter into haloes and large scale structure is driven by gravitational instability of initial perturbations.
Galaxies are believed to form when gas in highly over-dense haloes cools and collapses to form stars in significant numbers (Hoyle, 1953; Rees & Ostriker, 1977; Silk, 1977; Binney, 1977). The formation of first stars (McKee & Ostriker, 2007; Zinnecker & Yorke, 2007; Bromm & Larson, 2004) in turn leads to emission of UV radiation that starts to ionize the inter-galactic medium (IGM). The period of transition of the IGM from a completely neutral to a completely ionized state is known as the epoch of reionization (EoR), e.g., see Loeb & Barkana (2001). Observations indicate that the process of reionization was completed before (Fan, Carilli, & Keating, 2006; Becker et al., 2001; Fan et al., 2006). Many possible sources of ionizing radiation have been considered, although stellar sources are believed to be the most plausible candidates, see, e.g., Bagla, Kulkarni, & Padmanabhan (2009).
Prior to the EoR, almost all the Hydrogen in the universe is in atomic form. Through the EoR Hydrogen is ionized till we are left with almost no HI in the inter-galactic medium (IGM) and almost all the HI resides in the inter stellar medium (ISM) of galaxies. We focus on the post-reionization era in this work and our aim is to make predictions about the distribution of HI in this regime. It had been proposed by Sunyaev & Zeldovich (1972, 1975) that the hyperfine transition of Hydrogen may be used to probe primordial galaxies. This problem has been approached in past from the perspective of making specific predictions for existing instruments like the Giant Meterwave Radio Telescope (GMRT)111See http://gmrt.ncra.tifr.res.in/ for further details. (Subramanian & Padmanabhan, 1993; Kumar, Padmanabhan, & Subramanian, 1995; Bagla, Nath, & Padmanabhan, 1997; Bagla, 1999; Bharadwaj, Nath, & Sethi, 2001; Bharadwaj & Sethi, 2001; Bagla & White, 2003; Bharadwaj & Srikant, 2004; Bharadwaj & Ali, 2005), or upcoming instruments like the the MWA222The Murchison Widefield Array (MWA). More details are available at http://www.mwatelescope.org/, ASKAP333The Australian Square Kilometer Array Pathfinder. See http://www.atnf.csiro.au/projects/askap/ for details. MeerKAT444The South African Square Kilometer Array Pathfinder. See http://www.ska.ac.za/meerkat/overview.php for details. and SKA555The Square Kilometer Array (SKA). See http://www.skatelescope.org/ for details., e.g., see Wyithe, Loeb, & Geil (2008). Much work in the last decade has focused on making predictions for the power spectrum of fluctuations in HI, with an implicit assumption that it is easier to make a statistical detection than a direct detection. Further, it has been argued that HI can be used as a tracer of the large scale structure and observations can be used to constrain cosmological parameters with a special emphasis on observations of the baryon acoustic oscillations (BAO) in the power spectrum (Visbal, Loeb, & Wyithe, 2008; Chang et al., 2008; Bharadwaj, Sethi, & Saini, 2009). Most of the upcoming instruments are sensitive to the power spectrum of fluctuations at large scales, certainly larger than the scale of non-linearity at the relevant epoch, and hence a significant fraction of the work done in terms of making predictions is based on linear theory or approximations that work well in the linear and quasi-linear regime. The halo model has also been used for predicting the spectrum of fluctuations in the post-reionization universe (Wyithe et al., 2009; Wyithe & Brown, 2009).
In this study we revisit the issue of predicting fluctuations and use high resolution N-Body simulations. This allows us to study fluctuations at scales comparable to, or even smaller than the scale of non-linearity. We use dark matter simulations along with simple ansatz for assigning neutral Hydrogen in order to make predictions of fluctuations in surface brightness temperature. Our model is discussed in detail in §2 where we summarize our knowledge of the HI distribution at high redshifts and motivate the assignment schemes we use in this work . The N-Body simulations used by us are described in §2.1. Results of the HI signal are presented in §3. We then move on to review the relation between the source flux and observables in radio interferometers, i.e. visibilities, in §4 and also discuss the sensitivity of interferometers. Finally we look at the prospects of detection, both statistical and of rare peaks in §5. We conclude with a discussion in §6.
2 Modeling the HI distribution
In this section we describe our model of the HI distribution at high redshifts. Our knowledge of the HI distribution in the universe is derived mainly from QSO absorption spectra, where the gas absorbs in the Lyman- transition of the Hydrogen atom. We know from observations of these absorption spectra that much of the inter-galactic medium (IGM) is highly ionized and does not contain a significant amount of neutral Hydrogen. Most of the neutral Hydrogen resides in relatively rare damped Lyman- systems (DLAS) (Wolfe, Gawiser, & Prochaska, 2005). DLAS and other high column density absorption features are believed to arise due to gas within galaxies (Haehnelt, Steinmetz, & Rauch, 2000; Gardner et al., 2001). It is possible to make a quantitative estimate of the total neutral Hydrogen content in DLAS and study the evolution of the total neutral Hydrogen content of the universe (Storrie-Lombardi, McMahon, & Irwin, 1996; Rao & Turnshek, 2000; Péroux et al., 2005). These observations indicate that at , the neutral Hydrogen content of the universe is almost constant with a density parameter of 666These observational constraints are given as the ratio of the comoving density of neutral Hydrogen to the present day critical density. We adopt the same convention here..
At low redshifts, the HI content can be estimated more directly through emission in the Hyperfine transition. Observations in the local universe indicate a much lower neutral Hydrogen content than seen at (Zwaan et al., 2005). The neutral gas fraction in galaxies at intermediate redshifts appears to be much higher than in galaxies in the local universe (Lah et al., 2007, 2009), i.e., the neutral gas fraction in galaxies appears to increase rapidly with redshift .
The spin temperature couples to the gas temperature through collisions of atoms with other atoms, electrons, ions and also the Wouthuysen-Field effect (Purcell & Field, 1956; Field, 1958, 1959; Wouthuysen, 1952a, b; Zygelman, 2005; Furlanetto, Oh, & Briggs, 2006; Furlanetto & Furlanetto, 2007a, b). Observations of cm absorption by DLAS indicate that the spin temperature is orders of magnitude higher than the temperature of the cosmic microwave background radiation (CMBR) at corresponding redshifts (Chengalur & Kanekar, 2000; Kanekar et al., 2009). This implies that the emission in the cm hyperfine transition can be safely assumed to be proportional to the density of neutral Hydrogen, see, e.g., Furlanetto, Oh, & Briggs (2006).
| (1) | |||||
where is the fraction of Hydrogen in neutral form, is the density contrast of the gas distribution, is the temperature of the CMBR is the spin temperature defined using the relative occupation of the two levels for the hyperfine transition:
| (2) |
where subscripts and correspond to the excited and ground state levels of the hyperfine transition, mK is the temperature corresponding to the transition energy, and is the ratio of the spin degeneracy factors of the levels.
Observations indicate that neutral gas is found only in galaxies in the post reionization universe. We also know that at very low redshifts galaxies in groups and clusters do not contain much neutral gas. As cold gas is associated with galaxies, we may assume that it exists only in haloes that are more massive than the Jeans mass. Further, we may assume that neutral gas is predominantly found in galaxies and not in larger haloes that may contain several large galaxies. Jeans mass for haloes in a photo-ionizing UV background depends on the shape of the spectrum of the ionizing radiation, typically we expect gas in haloes with a circular velocity in excess of km/s to cool, fragment and form stars. The mass within the virial radius is related to the circular velocity and the collapse redshift as:
| (3) |
Simulation studies show that DLAS can reside in haloes with even lower circular velocities (Pontzen et al., 2008), i.e., haloes with mass lower than the expected Jeans mass can contain significant amount of neutral Hydrogen. The gas in these haloes is able to self shield and maintain a significant amount of HI even though the amount of gas is insufficient for sustaining star formation777Haloes that collapse much earlier may have hosted star formation, indeed the ISM of such galaxies may have been blown away due to feedback. However, few haloes with a low circular velocity that collapse very early are likely to survive without merger well into the post-reionization era. Errors arising out of HI assignment to low circular velocity haloes should not lead to significant changes in our calculations. Errors arising from this will generally lead to an under estimate of the signal (see discussion of dependence of bias on the lower mass limit), hence our predictions may be considered to be a lower limit on the signal.. We use this input and impose a lower cutoff in circular velocity of km/s, i.e., haloes with a lower circular velocity are not assigned any HI. This lower limit is appropriate for and it is likely that the limit shifts to higher values at lower redshifts. We keep the value fixed at km/s in order to make a conservative estimate of clustering of such haloes. Pontzen et al. (2008) also found that haloes much more massive than a few times M⊙ do not host significant amount of HI. This is consistent with observations in the local universe where galaxies in groups and clusters of galaxies contain very little HI. Some observations suggest that the neutral fraction in galaxies in outer parts of clusters of galaxies at intermediate redshifts may be high compared to corresponding galaxies in the local universe (Lah et al., 2009). Assignment for HI in more massive haloes is done in such a way as to ensure that very massive haloes have a zero or negligible fraction of the total gas in neutral form. In case larger haloes have more HI than we assume, our results under estimate the true signal and may be considered as a lower bound. The transition scale for the higher masses is chosen to coincide with km/s. Given that it is easier to estimate mass than circular velocity for haloes identified in simulations, in particular for haloes with a small number of particles, we choose to translate the threshold in circular velocity to a threshold in mass assuming the collapse redshift and the redshift at which the system is being observed to be the same, i.e., . While this may lead to inaccuracies regarding inclusion of haloes close to the low mass end, we do not expect it to influence the results in a significant manner. The minimum and the maximum masses for the redshifts considered here are listed in Table 1.
| 5.1 | |||||
|---|---|---|---|---|---|
| 3.4 | |||||
| 1.3 |
Given a halo of mass , all particles in it are assigned an equal HI mass which is a fraction of their total mass. We describe three kinds of mass assignments here.
| (4) | |||||
| (5) | |||||
| (6) |
Here is the mass fraction of HI in a given halo. The fraction of baryons that is in the form of neutral Hydrogen is given by , where is the density parameter of Baryons and is the density parameter for non-relativistic matter. For the best fit model for WMAP-5 (Komatsu et al., 2009) the ratio has the value .
In all three cases the constant is determined by normalizing the HI mass in the simulation volume to , the density parameter of HI indicated by observations at relevant redshifts (Péroux et al., 2005). It is noteworthy that this normalization requires a significant fraction of gas in haloes in the mass range between and be neutral at high redshifts. In the assignment scheme with the sharp cutoff (scheme 1, Eqn. 4), the HI fraction is the same in all haloes with mass between and . In the second assignment scheme the HI fraction in a halo decreases monotonically with increasing halo mass, and for large halo masses the HI mass goes to zero. This scheme applies to the physical situation where very large haloes do not have any neutral Hydrogen. In scheme 3, the HI fraction decreases monotonically with increasing halo mass but the HI mass goes to a constant value. The motivation of this scheme is to allow for some neutral Hydrogen surviving in massive haloes in galaxies. In the following section, we compare the resulting distribution of HI with the three assignment schemes described above. The present work is the first one where mass resolution of simulations is adequate for resolving the smallest haloes that may host HI and the simulation volume is also sufficient to make statements about the large scale distribution. We also ensure that the finite size of the simulation volume does not affect the results presented here.
| 1.35 | 5.0 | 5.04 | |||
| 3.00 | 3.0 | 3.34 | |||
| 4.50 | 1.0 | 1.33 |
2.1 -Body Simulations
We use gravity only simulations run with the TreePM code (Bagla, 2002; Bagla & Ray, 2003; Khandai & Bagla, 2009). The suite of simulations used here is described in the Table LABEL:table_nbody_runs. The cosmological model and the power spectrum of fluctuations corresponds to the best fit model for WMAP-5: , , , , , (Komatsu et al., 2009).
We use the Friends-of-Friends (FOF) (Davis et al., 1985) algorithm with a linking length to identify haloes and construct a halo catalog. The HI assignment schemes are then used to obtain the distribution of neutral Hydrogen.
Several existing and upcoming instruments can probe the post-reionization universe using redshifted HI emission. The GMRT can observe redshifted HI emission from a few selected redshift windows whereas most other instruments have continuous coverage in redshift bounded on two sides. We choose to focus on the GMRT windows, as these are representative of the range of redshifts in the post-reionization universe. In particular we will focus on the following redshift windows of GMRT: , , . Finite box effects can lead to significant errors in the distribution of haloes that host galaxies, apart from errors in the abundance of haloes of different masses (Bagla & Prasad, 2006; Bagla, Prasad, & Khandai, 2009). The choice of simulations used in this work ensures that such effects do not contribute significantly. Previous studies have indicated that at , we need a simulation box with h-1Mpc for the finite size effects to be negligible (Bagla & Ray, 2005; Bagla & Prasad, 2006). On the other hand the mass resolution of particles decreases as the cube of simulation volume. We balance the requirements of high mass resolution and a sufficiently large box size by using different simulations for studying the HI distribution at different redshifts. Details of the simulations are given in the table LABEL:table_nbody_runs.
3 Results
Given an HI mass assigment for particles in a simulation, we can proceed to compute the expected signal from the HI distribution by making mock radio maps and spectra. We also compute the power spectrum in both the real and the redshift space. For redshift space calculations, we use the peculiar velocity information of particles in haloes. Unlike earlier studies, we resolve haloes of individual galaxies and hence the internal velocity dispersion is naturally accounted for and there is no need to add it by hand (Kumar, Padmanabhan, & Subramanian, 1995; Bagla, Nath, & Padmanabhan, 1997; Bagla & White, 2003).
We use the clouds-in-cell (CIC) smoothing to interpolate densities from particle locations to grid points for the purpose of computing densities and the power spectrum. It is convenient to express the HI power spectrum in terms of the brightness temperature, though in comparisons with the dark matter power spectrum we revert to the usual dimensionless form.
We define the real and redshift space scale dependant bias by the ratio of the corresponding dark matter and HI power spectra.
| (7) | |||||
| (8) |
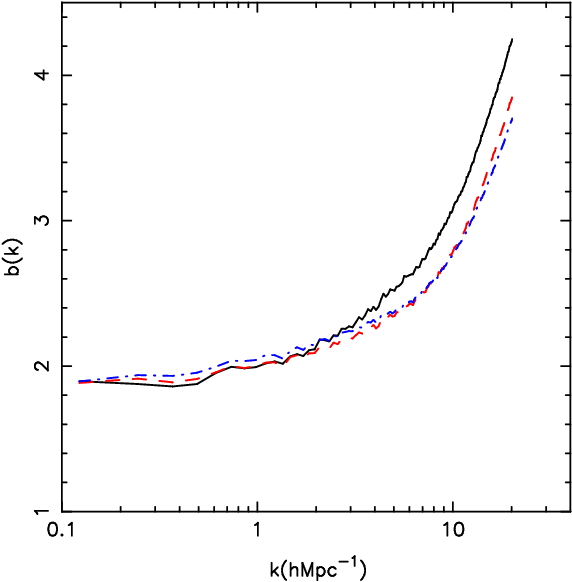
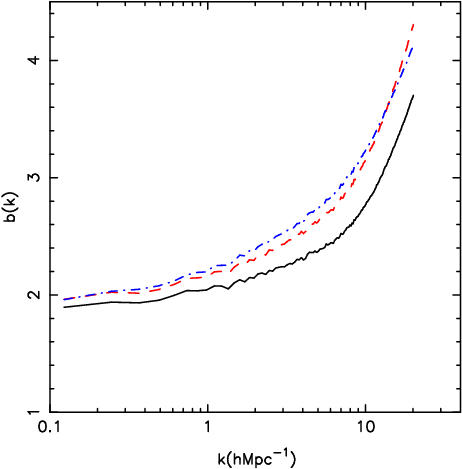
We start by checking the effect of HI assignment scheme on the resulting distribution. We have computed the bias at for the h-1Mpc simulation using the three schemes introduced above. The results are shown in Figure 1 for the three assignment types described in Eqs. (4-6). We see that at large scales the three assignment schemes give very similar results, whereas there is some disagreement between the assigment scheme Eqn.(4) and the other two. The difference can be attributed to the fact that the scheme described in Eqn.(4) puts more HI mass in haloes with masses near . The differences between the HI assignment schemes are relatively minor. We choose to work with the scheme described in Eqn.(6) due to a better physical justification, as discussed in §2. As mentioned before, if large mass haloes happen to have a larger HI fraction than we assume then the signal will be larger than what we predict here.
It is noteworthy that while the bias is strongly scale dependent at large (small scales), it flattens out to a constant value at small (large scales).
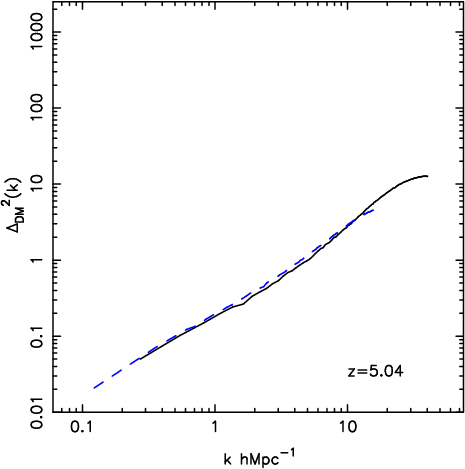
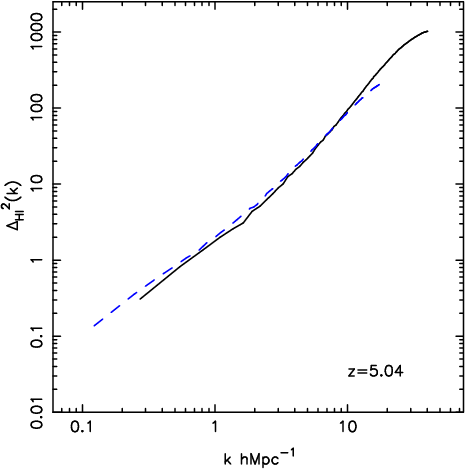
In order to check for the effects of a finite box size, we carried out a test for the h-1Mpc simulation box. Instead of using the range of halo masses for HI assignment that is appropriate for , we work with a slightly smaller range so that haloes of these masses can be found in the h-1Mpc simulation as well. Figure 2 shows the dark matter power spectrum (Top panel) and the HI power spectrum (Lower panel) with the HI assignment restricted to a smaller range of masses, as described above. We see that the dark matter power spectra from the two simulations agree through the range of scales where there is an overlap. The HI power spectra also agree, though not as well as the dark matter power spectra. These differences are so small that we do not expect these to affect the final results in a significant manner. The difference can be attributed to the fact that clustering of haloes is affected more strongly by the box size effects in simulations (Gelb & Bertschinger, 1994; Bagla & Ray, 2005).
These tests validate our approach for assignment of HI to haloes, and also show that the effects of a finite box-size are not significant at the level of the power spectrum or the mass function.
3.1 Bias
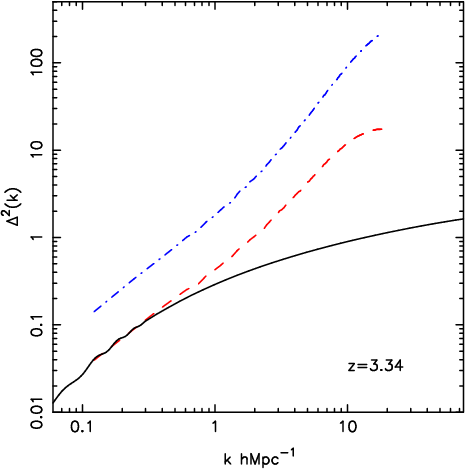
This is amongst the first studies of the HI distribution at high redshifts where we resolve the smallest haloes that can host significant amount of HI while ensuring that the finite box size effects do not lead to an erronous distribution of haloes. One of the points that we can address here is the effect of non-linear clustering on the HI distribution and the scale dependance of bias. Some of these effects are illustrated in Figure 3 where we have plotted the power spectrum of fluctuations: the solid line shows the linearly extrapolated power spectrum, the dashed line shows the non-linear dark matter power spectrum and the dot-dashed line shows the HI power spectrum. All power spectra are for . The dark matter and the HI power spectra have been computed with the simulation with h-1Mpc.
It is apparent that at h Mpc-1 the effects of non-linear clustering significantly enhance the dark matter power spectrum. At h Mpc-1, the enhancement is close to an order of magnitude. This is of utmost interest for upcoming instruments that can resolve small angular scales.
We find that bias for the HI distribution is much greater than unity at high redshifts. This is to be expected of galaxies at high redshifts (Fry, 1996; Mo & White, 1996; Bagla, 1998a, b; Mo, Mao, & White, 1999; Baugh et al., 1999; Magliocchetti et al., 2000; Benson et al., 2000; Roukema & Valls-Gabaud, 2000; Sheth, Mo, & Tormen, 2001; Wyithe & Brown, 2009). We note that the bias is scale dependent, and leads to a larger enhancement in the power spectrum at very small scales.
The value of bias depends strongly on the choice of the characteristic mass of haloes with HI. This is shown in Figure 4. All curves are for and have been computed with the simulation with h-1Mpc. This figure illustrates that the bias at all scales varies monotonically with the charactersitic mass of haloes with HI. Variation is gentle at large scales but fairly strong at small scales. Therefore it is extremely important to have an accurate estimate of the charactersitic masses of such haloes. Indeed, it has been pointed out that observations of the amplitude of clustering in the HI distribution can be used to constrain masses of haloes that host DLAS (Wyithe, 2008).
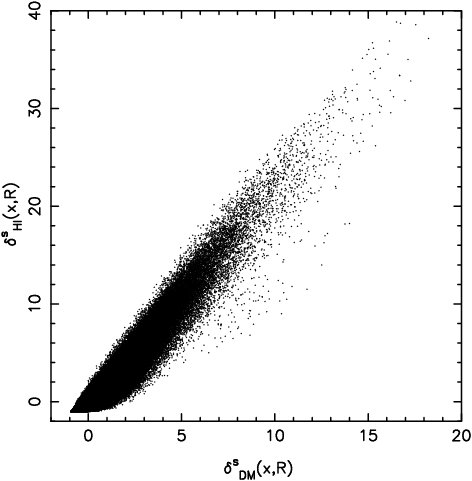
While the preceeding figures describe the statistical bias computed from the ratio of power spectra, Figure 5 shows the stochasticity of bias (Dekel & Lahav, 1999) in the HI distribution. This figure shows a scatter plot of smoothed at a scale of h-1Mpc with a spherical top hat window, plotted as a function of smoothed at the same scale. The figure shows a random subset of points from the simulation with h-1Mpc at . The scatter about the average trend in the is significant, and increases as we go towards large overdensities in dark matter. The scatter becomes small if we smooth the density distribution at much larger scales.
Similar results concerning the effect of non-linear gravitational clustering and bias are obtained for other redshifts. We concentrate on the evolution of bias and the power spectrum rather than go into a very detailed discussion of the HI distribution at each redshift. We discuss simulated maps in the following subsection.
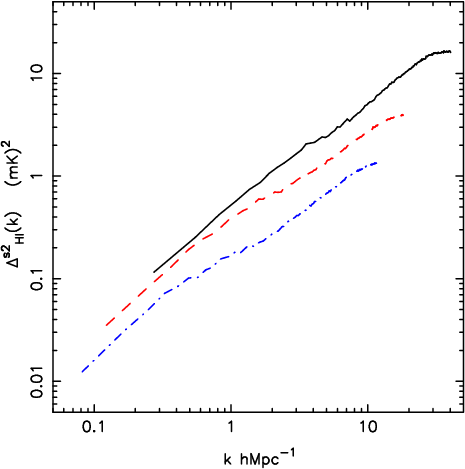
Figure 6 (left panel) shows the evolution of the redshift space power spectrum for the HI distribution. Curves show the as a function of for (solid line), (dashed line) and (dot-dashed line). Unlike the power spectrum in real space, the enhancement at very small scales is less strong and this is due to velocity dispersion within haloes at smaller scales. Power at larger scales is enhanced due to the Kaiser effect (Kaiser, 1987), leading to a relatively stronger enhancement at larger scales, hence the difference in shapes of the HI power spectrum in the real space and the redshift space. Even though the amplitude of density perturbations increases with time, we see that the amplitude of brightness temperature fluctuations decreases instead. This is a manifestation of the decreasing correlation function for galaxies, see, e.g., Bagla (1998b); Roukema & Valls-Gabaud (1998).
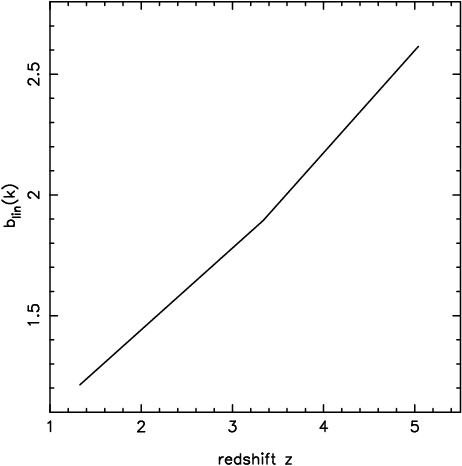
The evolution of bias at large scales, denoted as to emphasise that it refers to scales where clustering is still in the linear regime, is shown in the right panel of Figure 6. We see that this decreases from around at to at , the variation is slightly steeper than and hence the gradual lowering of the amplitude of the brightness temperature power spectrum.
 |
 |
 |
 |
 |
 |
3.2 Radio Maps
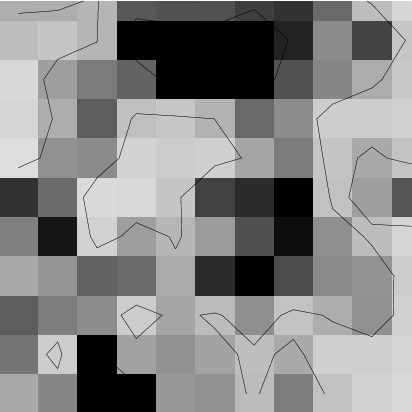
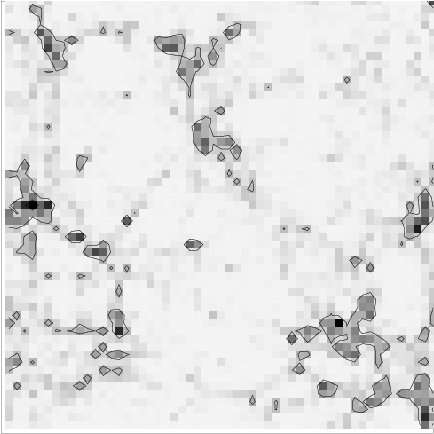
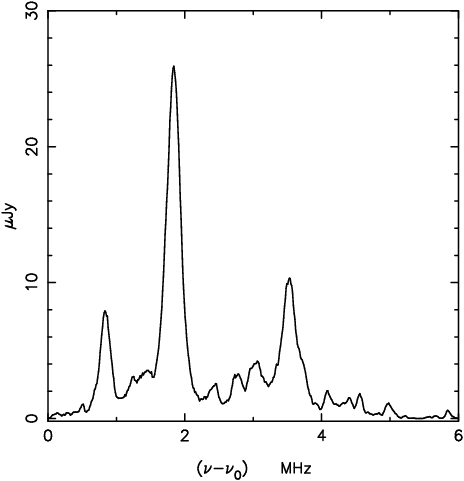
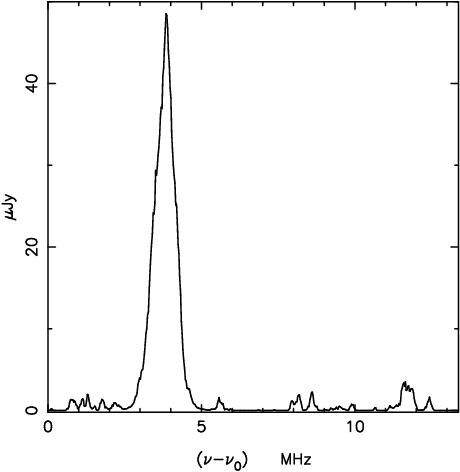
Figure 7 shows the simulated radio maps and spectra. The usual conversion from HI density to signal has been used for this (Furlanetto, Oh, & Briggs, 2006). The top row shows simulated radio maps, the top-left panel is for and the top-right panel is for . The pixel size is chosen to be the same as the resolution of the central square of the GMRT. The bandwidth of the map is MHz and MHz for , respectively. The corresponding contours mark regions with signal (, , ) Jy for and (, , ) Jy for . As we can see in these maps, bright regions have a large angular extent. This fact may be used to enhance prospects of detection §5.
The lower panel shows spectra from the mock radio maps. These spectra have been plotted for regions that are the size of the resolution of the central square of the GMRT. We have chosen to plot the spectrum through the brightest region in the simulation. The lower-left panel corresponds to and the lower right panel shows the spectrum for . The peak flux is around mJy and the FWHM of the line is close to kHz. The strength of the signal for is comparable to what we found in an earlier study, although the line width is much smaller. The reason for a smaller line width is likely to be the supression of the HI fraction in very massive haloes. Considering the peak for which the spectrum has been plotted here, it may be possible to make a detection with about hours of observations with the central square of the GMRT (§5). Given that the GMRT observes a much larger volume at these redshifts that the simulation volume, it is highly likely that even rarer peaks in the HI distribution will be observed in a generic pointing (Subramanian & Padmanabhan, 1993).
The strentgh of the predicted signal at is of the order of mJy, with an FWHM of around MHz.
Detection of rare peaks in the HI distribution is an exciting possibility. The size of the region represented in these rare peaks is fairly large, and it should be possible to establish the total mass contained in these regions using observations in other wavebands. This will allow us to estimate in emission, and hence provide an independent measurement of the cold gas fraction.
The time required for detection of HI at high redshifts with the GMRT increases rapidly as we go to higher redshifts. This trend continues as we move to and therefore we do not discuss those results in detail here.
Instruments like the GMRT, MWA can in principle detect signal from the HI distribution at high redshifts. The angular resolution of the MWA is fairly poor and hence the effects of non-linear clustering and scale dependant bias do not make a significant impact on predictions. We shall discuss the prospects for detection with the GMRT and the MWA in detail in the §5.
| Instrument | Frequency (MHz) | (MHz) | B (MHz) | (degree ) | (K) | ||
|---|---|---|---|---|---|---|---|
| GMRT | 610 | 1 | 16 | 32 | 0.56 | 102 | 1590 |
| 330 | 1 | 16 | 17 | 1.03 | 106 | 1590 | |
| 235 | 1 | 16 | 12 | 1.45 | 237 | 1590 | |
| MWA | 300 | 1 | 32 | 2 | 9 | 68 | 5.6 |
| MWA5000 | 235 | 1 | 32 | 1.6 | 11.49 | 92 | 15 |
4 Signal and Noise in Interferometers
In this section we briefly review the relation between the flux from sources and the observable quantities for radio interferometers. We then proceed to a discussion of the sensitivity of interferometers and the corresponding limitations arising from that.
4.1 Visibility Correlation
The quantity measured in radio-interferometric observations is the visibility which is measured in a number of frequency channels across a frequency bandwidth for every pair of antennas in the array. The visibility is related to the sky specific intensity pattern as
| (9) |
The baseline is where is the antenna separation projected in the plane perpendicular to the line of sight. is a two dimensional vector in the plane of the sky with origin at the center of the field of view, and is the beam pattern of the individual antenna. For the GMRT this can be well approximated by Gaussian , where . We use at MHz for the GMRT, and it scales as the inverse of frequency.
We next consider the visibility-visibility correlation (hereafter only visibility correlation) measured at two different baselines and and at two frequencies and . As argued in Bharadwaj & Ali (2005) the visibilities at baselines and will be correlated only if . Visibilities at different frequencies are expected to be correlated only if the flux from sources is correlated. This is certainly true of continuum radiation. In case of spectral lines, like the redshifted HI cm line being considered here, visibilities are expected to be correlated over a range of frequencies comparable to width of spectral lines. For generic applications, we can take this to be about MHz though we can use the simulated radio maps for a more refined model. As a first approximation, the visibilities at frequencies and can be assumed to be uncorrelated for MHz (Datta, Choudhury, & Bharadwaj, 2007) for range of baselines of our interest. We use the power spectra to compute visibility correlations using the relation enunciated by Bharadwaj & Sethi (2001). To calculate the strength and nature of visibility correlation of the HI fluctuations we consider the visibility correlation at same baselines and frequencies which can be written as (for details see Bharadwaj & Ali (2005))
| (10) |
where is mean HI specific intensity, is comoving distance corresponds to frequency . , where is unit vector along the line of sight. Here the quantity is proportional to , hence the visibility correlation scales as the square of .
We next shift our focus on the redshift space HI power spectrum (Bharadwaj & Ali, 2004). We calculate from N-Body simulations and put this in Eqn. 10 to calculate the visibility correlation. As simulations have a finite box size, we patch it with a linearly extrapolated power spectrum with a constant bias at small . This is especially appropriate for high redshifts where the field of view of the GMRT is larger than the simulation box. MWA, of course, has a much larger field of view and the statement applies to that as well.
At sufficiently large scales one can write as (Kaiser, 1987)
| (11) |
Here is the scale independent bias at large scales and where is the redshift distortion parameter. is matter power spectrum at redshift and is dominated by the spatial distribution of dark matter.

4.2 System Noise in the Visibility Correlation
The noise rms. in real part in each visibility for single polarization is
| (12) |
where is the total system temperature, is the Boltzmann constant, is the effective collecting area of each antenna, is the channel width and is correlator integration time. This can be written in terms of the antenna sensitivity as
| (13) |
The noise variance in the visibility correlation is written as (Ali et al., 2008)
| (14) |
where is the number of visibility pairs in a particular bin and frequency band . The HI signal is correlated but the system noise is taken to be uncorrelated in visibilities.
We next consider how is calculated. We consider an elementary grid with cell of area in the plane where the signal remains correlated. Total observation time we consider is . We further define (circularly symmetric) to be the baseline fraction per unit area per in the baseline range and and is normalised: . Number of visibility pairs in a given , bin in the grid is
| (15) |
Here is the total number of antennae Note that the baseline fraction function is different for different interferometric arrays and plays an important role in determining the sensitivity of an array. This function is also frequency dependent. The signal and the system noise is expected to be isotropic and only depends on the magnitude of . We take average over all cells of area in the circular annulus between and . Number of independent elementary bins in a circular annulus between and is . Moreover there are independent channels for the total bandwidth . Combining all these we have
| (16) |
The noise rms in the visibility correlation can then be written as
| (17) |
The bin size is determined by the field of view of the antenna and for a Gaussian antenna beam pattern , one can show that . The equation 17 gives the system noise in the visibility correlation for any radio experiment. Note that, the system noise rms in the visibility correlation scales as unlike the noise rms in the image which scales as .
There are two effects that we ignore in the analysis here.
-
•
At small , comparable with the inverse of the field of view, cosmic variance also limits our ability to measure the visibility correlations. As the field of view of the GMRT is (much) smaller than the MWA, this concern is more relevant in that case. Cosmic variance is subdominant to the system noise as long as we work with scales that are much smaller than the field of view, or work with that are much larger than the one that corresponds to the field of view.
- •
We consider three instruments: the GMRT, MWA and a hypothetical instrument MWA5000. The GMRT has a hybrid distribution with antennae are distributed randomly in the central core of area km km and antennae are placed along three arms ( shaped). The antennae are parabolic dishes of diameter m. The MWA will have antennae distributed within a circular region of radius m. The antennae are expected to follow distribution with a m flat core. The hypothetical instrument MWA5000 is almost similar to the MWA but with antennae. We assume antennae are distributed as within m radius and with a flat core of radius m (McQuinn et al., 2006). The normalized baseline distribution for frequency MHz is presented in the Figure 8 for the three instruments (see Datta et al. (2007) for details). Table 3 lists the wavebands and other instrument parameters for which analysis is done in this paper. We assume the effective antenna collecting area () to be same as the antenna physical area. We also list parameters used for calculation of noise in visibility correlations.
4.3 Noise in Images
Observed visibilities are used to construct an image of the sky for each frequency channel. The size of the image is of the order of the primary beam and the resolution depends on the largest baselines used. Both the size of the image and resolution, or the pixel size depend on the frequency of observation in the same manner.
Unlike visibilities, that are uncorrelated outside of the small bins, pixels in an image are not completely uncorrelated. The correlation of pixels in a raw image is similar to the dirty beam. Therefore the analysis of noise in images as a function of scale is a fairly complex problem. Scaling of noise with bandwidth is easy as the noise for different frequency channels is uncorrelated. rms noise for a given pixel can be computed using (assuming two polarizations) (Thompson, Moran, & Swenson, 2001)
| (18) |
The symbols in the above equation have the same meaning as described in §4.2.
We find that for the window of the GMRT Jy for an integration time of hours and a bandwidth of MHz. This has been computed for the central square of the GMRT with . The corresponding number of is Jy for an integration time of hours and a bandwidth of MHz.
As a first approximation, we assume that noise in images is uncorrelated and that it scales as the square root of the number of pixels over which signal is smoothed. This allows us to estimate signal to noise ratio for extended structures, but it must be noted that this analysis is approximate.
5 Prospects for Detection: Simulated Maps And Signal
In this section we describe results from simulated HI maps as described in the previous sections.
5.1 Visibility Correlation
We use the power spectrum of the HI distribution derived from our N-Body simulations to compute the visibility correlations. For large scales, larger than the simulation size, we patch this with the linearly extrapolated power spectrum with a constant bias. This is the only input required in Eqn. (10) for calculation of visibility correlation.
Visibility correlation for various redshifts is shown in Figure 9. We have also plotted the expected system noise in each of the panels. We use the the functional form of from Datta et al. (2007) (also see Figure 8). The expected visibility correlation is shown as a function of . The expected signal is shown with a solid curve and the expected noise in the visibility correlation is shows by a dashed curve. This has been shown for three instruments: GMRT, MWA and a hypothetical instrument MWA5000. The noise in each panel has been computed assuming hours of integration time and visibilities correlated over MHz. We find that MWA5000 should detect visibility correlations for baselines at and at at . Higher observation time is needed for the MWA to detect the visibility correlations. The detection at smaller should be possible at high significance level. Whereas the prospects for detection with the GMRT are encouraging for where it should be possible to make a detection for baselines .
It is possible to enhance the signal to noise ratio by combining data from nearby bins in , thus detection may be possible in a shorter time scale as well. The GMRT has been in operation for more than a decade, and its characteristics are well understood. Therefore it is important to make an effort to observe HI fluctuations at with the instrument. The observations need not pertain to the same field as the region observed by the GMRT in a single observation is fairly large and we do not expect significant fluctuations in the HI power spectrum and hence the visibility correlation from one field to another.
 |
 |
 |
 |
 |
 |
 |
Thus good quality archival data for a few fields can be combined, in principle, to detect visibility correlations.
Detection of visibility correlations in turn gives us a measurement of the power spectrum for the HI distribution (Bharadwaj & Sethi, 2001). This can be used to constrain various cosmological parameters (Bharadwaj, Sethi, & Saini, 2009; Visbal, Loeb, & Wyithe, 2008; Loeb & Wyithe, 2008). Recently, it has also been pointed out that the power spectrum can also be used to estimate the characteristic mass of damped lyman alpha systems (DLAS) (Wyithe, 2008).
 |
 |
 |
 |
5.2 Rare Peaks
We now discuss the possibility of directly detecting rare peaks in the HI distribution. This is an interesting possibility for instruments like the GMRT and ASKAP that can resolve small angular scales. At such scales, non-linear gravitational clustering and the large bias for the HI distribution combine to enhance the amplitude of fluctuations significantly (§3). It is also of interest to see whether this enhancement can make detection of rare peaks as easy as statistical detection via visibility correlations.
Figure 10 shows the expected signal to noise ratio (SNR) for the brightest region in the simulated maps if it is observed using the central square of the GMRT. The left column is for and the right column is for . The top row shows variation of the SNR with bandwidth for one pixel, whereas the bottom panel shows the variation of SNR with the square root of the solid angle over which signal has been smoothed for a given bandwidth. In plots of variation of SNR with the bandwidth, the peak is very close to the FWHM of spectral lines for large structures (see spectra of rare peaks in §7). Although SNR falls off towards smaller bandwidths, it does not decline significantly towards larger bandwidths and this can be attributed to the presence of nearby lines and is a reflection of clustering at small scales.
These figures show that a detection of a rare peak is possible in hours for and in hours for . The time for detection here is comparable to, indeed slightly less than the time required for a statistical detection. This is a very exciting possibility as it allows us to measure the HI fraction of a fairly large region, potentially leading to a measurement of . However, unlike statistical detection of the HI distribution, the integration time cannot be divided across different fields for a direct detection.
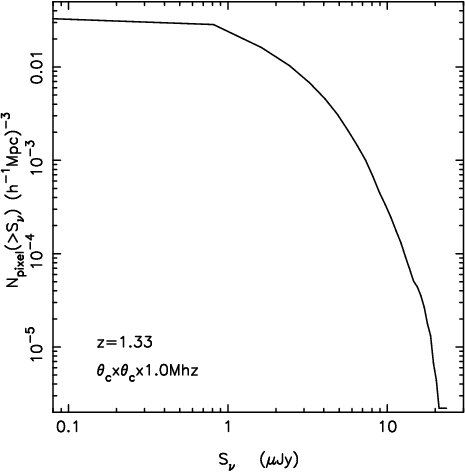
The volume sampled in observation of one field with the GMRT at is much larger than the volume of the simulation used here. Thus there is a strong possibility of finding even brighter region in a random pointing at that redshift. On the other hand, the volume sampled by the GMRT at is smaller by a factor of more than as compared to the volume of the simulation used for making mock maps. We have studied the distribution function for signal in pixels and find that there are a sufficiently large number of bright pixels in the simulated map and a random pointing should have a rare peak comparable to the one discussed here within the field of view. This is shown in Figure 11 where we have shown the number density of pixels in the simulated radio map with signal above a given threshold. Here, each pixel corresponds to the angular resolution of the central square of the GMRT and a bandwidth of MHz. The volume covered by one GMRT field with a bandwidth of MHz should contain more than ten pixels brighter than Jy. For comparison, the brightest pixel in the simulated map gives out twice this flux.
We do not discuss the possibility of detection of rare peaks with the MWA as it has a poorer sensitivity at small scales.
Note that in our results we have ignored the foregrounds. The foregrounds at relevant frequencies will dominate over the cosmological HI 21-cm signal and needs to be subtracted. Line of sight modes can not be measured because of foreground subtraction, is the bandwidth over which foregrounds are subtracted (McQuinn et al., 2006). This would effect the baselines for a subtraction bandwidth. Rare peaks are much smaller objects () than the scales where the foreground subtraction would affect and hence we expect that our results on rare peaks should not be affected by foregrounds.
6 Discussion
Several attempts have been made in recent years to model the HI distribution in the post-reionization universe (Scott & Rees, 1990; Subramanian & Padmanabhan, 1993; Kumar, Padmanabhan, & Subramanian, 1995; Bagla, Nath, & Padmanabhan, 1997; Bharadwaj, Nath, & Sethi, 2001; Bharadwaj & Sethi, 2001; Bagla & White, 2003; Bharadwaj & Srikant, 2004; Bharadwaj & Ali, 2005; Loeb & Wyithe, 2008; Wyithe, Loeb, & Geil, 2008; Pritchard & Loeb, 2008; Wyithe & Brown, 2009), with the recent resurgence in interest being due to upcoming radio telescopes and arrays. In this paper we have revisited the issue using dark matter simulations and an ansatz for assigning HI to dark matter haloes. This is amongst the few attempts made using simulations where the smallest haloes that may contain significant amount of HI are resolved, and, the simulations are large enough to limit errors due to a finite size of the simulation box.
The prospects for detection of the HI distribution at high redshifts are very promising. The GMRT can be used to measure visibility correlations at . We can expect the hypothetical MWA5000 to measure visibility correlations at and provide an estimate of the power spectrum. The integration time required is not very large. This is very encouraging as no other existing or upcoming instrument can probe this redshift, though ASKAP and MeerKAT will be able to probe the HI distribution at . Measurement of visibility correlations, and hence the HI power spectrum can be used to constrain several cosmological parameters. If we are able to make measurements at several redshifts then it becomes possible to constrain models of dark energy. Observations of visibility correlations can also be used to put constraints on the characteristic mass of damped Lyman alpha systems (Wyithe, 2008). The quadratic dependence of the visibility correlations on can be used to determine the density parameter for HI at high redshifts.
An interesting potential application of the method used here is to make predictions for where statistical and individual detection with the GMRT and ASKAP is likely to be much easier. It is obvious that detection of rare peaks of HI with the GMRT may be even easier at lower redshifts (). The main issue to be addressed at these redshifts is that the observed volume becomes small and hence we can expect significant scatter in the observed visibility correlations from one field to another, and across frequency channels. This is true even for rare peaks and one may need to observe several fields before finding a very bright object. Or one may need to observe for longer periods of time in order to observe a not so rare peak. This is particularly relevant for the GMRT where the primary beam covers a solid angle that is nearly times smaller than that covered by ASKAP. We propose to study this issue in a later publication, where we will also discuss prospects of observing HI using ASKAP and MeerKAT. We are also working on using wavelet based methods for detection of rare peaks in the HI distribution.
In this work we have used a fairly simple HI assignment scheme while ignoring the evolution of gas content of haloes. We are working on rectifying this shortcoming and expect to use a semi-analytical model to improve this aspect of modeling.
Key conclusions of this paper may be summarized as follows:
-
•
We find that non-linear gravitational clustering enhances the amplitude of perturbations by a significant amount at small scales.
-
•
HI distribution is strongly biased at high redshifts and this enhances the HI power spectrum significantly as compared to the dark matter power spectrum. Bias is scale independent at large scales , where is the scale of non-linearity.
-
•
Bias decreases sharply from high redshifts towards low redshifts. This leads to a gradual decrease in the brightness temperature power spectrum. The change in the amplitude of the brightness temperature power spectrum is slow, being less than a factor two between and .
-
•
Brightest regions in the simulated radio maps are found to be extended, with an angular extent much larger than the resolution of the GMRT. This can be used to enhance prospects of detection.
-
•
Spectra in the simulated maps appear to have an FWHM of around MHz for and about half of this for . A comparison with earlier work for shows that the FWHM is found to be smaller in the present work. We attribute this to the low HI fraction assigned to the most massive haloes, whereas such haloes were not excluded in earlier work.
-
•
The MWA5000 should detect visibility correlations at at and at at . The detection at smaller should be possible at a high significance level.
-
•
Prospects of detection with the GMRT are encouraging for where it should be possible to make a detection for .
-
•
Signal for the brightest source of redshifted cm radiation from appears to be significant, and within reach of an instrument like the GMRT.
-
•
Detection of rare peaks in the HI distribution offers exciting possibilities since it does not require a much longer integration time as compared to statistical detection. The size of the region represented in these rare peaks is fairly large, and it should possible to establish the mass contained in these regions using observations in other wavebands. The direct detection at requires only a few hundred hours of observing time with an existing instrument. This may allow us to estimate in emission, and hence provide and independent measurement of the amount of cold gas.
Acknowledgments
Computational work for this study was carried out at the cluster computing facility in the Harish-Chandra Research Institute (http://cluster.hri.res.in/). This research has made use of NASA’s Astrophysics Data System. KKD is grateful for financial support from Swedish Research Council (VR) through the Oscar Klein Centre. The authors would like to thank the anonymous referee for suggestions which helped improve the paper. The authors would like to thank Jayaram Chengalur, Somnath Bharadwaj, Tirthankar Roy Choudhury, Abhik Ghosh and Prasun Dutta for useful comments and discussions.
References
- Ali et al. (2008) Ali, S. S., Bharadwaj, S., & Chengalur, J. N. 2008, MNRAS, 385, 2166
- Bagla, Nath, & Padmanabhan (1997) Bagla J. S., Nath B., Padmanabhan T., 1997, MNRAS, 289, 671
- Bagla (1998a) Bagla J. S., 1998a, MNRAS, 297, 251
- Bagla (1998b) Bagla J. S., 1998b, MNRAS, 299, 417
- Bagla (1999) Bagla J. S., 1999, ASPC, 156, 9
- Bagla (2002) Bagla J. S., 2002, JApA, 23, 185
- Bagla & Ray (2003) Bagla J. S., Ray S., 2003, NewA, 8, 665
- Bagla & White (2003) Bagla J. S., White M., 2003, ASPC, 289, 251
- Bagla & Ray (2005) Bagla J. S., Ray S., 2005, MNRAS, 358, 1076
- Bagla & Prasad (2006) Bagla J. S., Prasad J., 2006, MNRAS, 370, 993
- Bagla, Prasad, & Khandai (2009) Bagla J. S., Prasad J., Khandai N., 2009, MNRAS, 395, 918
- Bagla, Kulkarni, & Padmanabhan (2009) Bagla J. S., Kulkarni G., Padmanabhan T., 2009, MNRAS, 397, 971
- Baugh et al. (1999) Baugh C. M., Benson A. J., Cole S., Frenk C. S., Lacey C. G., 1999, MNRAS, 305, L21
- Becker et al. (2001) Becker R. H., et al., 2001, AJ, 122, 2850
- Benson et al. (2000) Benson A. J., Cole S., Frenk C. S., Baugh C. M., Lacey C. G., 2000, MNRAS, 311, 793
- Bernardeau et al. (2002) Bernardeau F., Colombi S., Gaztañaga E., Scoccimarro R., 2002, PhR, 367, 1
- Bharadwaj, Nath, & Sethi (2001) Bharadwaj S., Nath B. B., Sethi S. K., 2001, JApA, 22, 21
- Bharadwaj & Sethi (2001) Bharadwaj S., Sethi S. K., 2001, JApA, 22, 293
- Bharadwaj & Srikant (2004) Bharadwaj S., Srikant P. S., 2004, JApA, 25, 67
- Bharadwaj & Ali (2004) Bharadwaj S., Ali S. S., 2004, MNRAS, 352, 142
- Bharadwaj & Ali (2005) Bharadwaj S., Ali S. S., 2005, MNRAS, 356, 1519
- Bharadwaj, Sethi, & Saini (2009) Bharadwaj S., Sethi S. K., Saini T. D., 2009, PhRvD, 79, 083538
- Binney (1977) Binney J., 1977, ApJ, 215, 483
- Bowman (2007) Bowman J. D., 2007, PhD Thesis, pp. 17
- Bromm & Larson (2004) Bromm V., Larson R. B., 2004, ARA&A, 42, 79
- Chang et al. (2008) Chang T.-C., Pen U.-L., Peterson J. B., McDonald P., 2008, PhRvL, 100, 091303
- Chengalur & Kanekar (2000) Chengalur J. N., Kanekar N., 2000, MNRAS, 318, 303
- Datta, Choudhury, & Bharadwaj (2007) Datta K. K., Choudhury T. R., Bharadwaj S., 2007, MNRAS, 378, 119
- Datta et al. (2007) Datta, K. K., Bharadwaj, S., & Choudhury, T. R. 2007, MNRAS, 382, 809
- Davis et al. (1985) Davis M., Efstathiou G., Frenk C. S., White S. D. M., 1985, ApJ, 292, 371
- Dekel & Lahav (1999) Dekel, A., & Lahav, O. 1999, ApJ, 520, 24
- Fan, Carilli, & Keating (2006) Fan X., Carilli C. L., Keating B., 2006, ARA&A, 44, 415
- Fan et al. (2006) Fan X., et al., 2006, AJ, 132, 117
- Field (1958) Field G. B., 1958, Proc. I.R.E., 46, 240
- Field (1959) Field G. B., 1959, ApJ, 129, 536
- Fry (1996) Fry J. N., 1996, ApJ, 461, L65
- Furlanetto & Furlanetto (2007a) Furlanetto S. R., Furlanetto M. R., 2007a, MNRAS, 379, 130
- Furlanetto & Furlanetto (2007b) Furlanetto S. R., Furlanetto M. R., 2007b, MNRAS, 374, 547
- Furlanetto, Oh, & Briggs (2006) Furlanetto S. R., Oh S. P., Briggs F. H., 2006, PhR, 433, 181
- Gardner et al. (2001) Gardner J. P., Katz N., Hernquist L., Weinberg D. H., 2001, ApJ, 559, 131
- Gelb & Bertschinger (1994) Gelb, J. M., & Bertschinger, E. 1994, ApJ, 436, 491
- Haehnelt, Steinmetz, & Rauch (2000) Haehnelt M. G., Steinmetz M., Rauch M., 2000, ApJ, 534, 594
- Hoyle (1953) Hoyle F., 1953, ApJ, 118, 513
- Kaiser (1987) Kaiser N., 1987, MNRAS, 227, 1
- Kanekar et al. (2009) Kanekar N., Prochaska J. X., Ellison S. L., Chengalur J. N., 2009, MNRAS, 396, 385
- Khandai & Bagla (2009) Khandai N., Bagla J. S., 2009, RAA, 9, 861
- Komatsu et al. (2009) Komatsu E., et al., 2009, ApJS, 180, 330
- Kumar, Padmanabhan, & Subramanian (1995) Kumar A., Padmanabhan T., Subramanian K., 1995, MNRAS, 272, 544
- Lah et al. (2007) Lah P., et al., 2007, MNRAS, 376, 1357
- Lah et al. (2009) Lah P., et al., 2009, MNRAS, 399, 1447
- Loeb & Barkana (2001) Loeb A., Barkana R., 2001, ARA&A, 39, 19
- Loeb & Wyithe (2008) Loeb A., Wyithe J. S. B., 2008, PhRvL, 100, 161301
- Magliocchetti et al. (2000) Magliocchetti M., Bagla J. S., Maddox S. J., Lahav O., 2000, MNRAS, 314, 546
- McEwen & Scaife (2008) McEwen J. D., Scaife A. M. M., 2008, MNRAS, 389, 1163
- McKee & Ostriker (2007) McKee C. F., Ostriker E. C., 2007, ARA&A, 45, 565
- McQuinn et al. (2006) McQuinn, M., Zahn, O., Zaldarriaga, M., Hernquist, L., & Furlanetto, S. R. 2006, ApJ, 653, 815
- Mo & White (1996) Mo H. J., White S. D. M., 1996, MNRAS, 282, 347
- Mo, Mao, & White (1999) Mo H. J., Mao S., White S. D. M., 1999, MNRAS, 304, 175
- Ng (2001) Ng K.-W., 2001, PhRvD, 63, 123001
- Ng (2005) Ng K.-W., 2005, PhRvD, 71, 083009
- Padmanabhan (2002) Padmanabhan T., 2002, Theoretical Astrophysics, Volume III: Galaxies and Cosmology. Cambridge University Press.
- Peacock (1999) Peacock J. A., 1999, Cosmological Physics, Cambridge University Press
- Peebles (1980) Peebles P. J. E., 1980, The Large-Scale Structure of the Universe, Princeton University Press
- Péroux et al. (2005) Péroux C., Dessauges-Zavadsky M., D’Odorico S., Sun Kim T., McMahon R. G., 2005, MNRAS, 363, 479
- Pontzen et al. (2008) Pontzen A., et al., 2008, MNRAS, 390, 1349
- Pritchard & Loeb (2008) Pritchard J. R., Loeb A., 2008, PhRvD, 78, 103511
- Purcell & Field (1956) Purcell E. M., Field G. B., 1956, ApJ, 124, 542
- Rao & Turnshek (2000) Rao S. M., Turnshek D. A., 2000, ApJS, 130, 1
- Rees & Ostriker (1977) Rees M. J., Ostriker J. P., 1977, MNRAS, 179, 541
- Roukema & Valls-Gabaud (1998) Roukema B. F., Valls-Gabaud D., 1998, wfsc.conf, 414
- Roukema & Valls-Gabaud (2000) Roukema B., Valls-Gabaud D., 2000, ASPC, 200, 24
- Silk (1977) Silk J., 1977, ApJ, 211, 638
- Scott & Rees (1990) Scott D., Rees M. J., 1990, MNRAS, 247, 510
- Shandarin & Zeldovich (1989) Shandarin S. F., Zeldovich Y. B., 1989, RvMP, 61, 185
- Sheth, Mo, & Tormen (2001) Sheth R. K., Mo H. J., Tormen G., 2001, MNRAS, 323, 1
- Storrie-Lombardi, McMahon, & Irwin (1996) Storrie-Lombardi L. J., McMahon R. G., Irwin M. J., 1996, MNRAS, 283, L79
- Subramanian & Padmanabhan (1993) Subramanian K., Padmanabhan T., 1993, MNRAS, 265, 101
- Sunyaev & Zeldovich (1972) Sunyaev R. A., Zeldovich Y. B., 1972, A&A, 20, 189
- Sunyaev & Zeldovich (1975) Sunyaev R. A., Zeldovich I. B., 1975, MNRAS, 171, 375
- Thompson, Moran, & Swenson (2001) Thompson A. R., Moran J. M., Swenson G. W., Jr., 2001, Interferometry and Synthesis in Radio Astronomy, 2nd Edition, Wiley-Interscience
- Trimble (1987) Trimble V., 1987, ARA&A, 25, 425
- van de Hulst, Raimond, & van Woerden (1957) van de Hulst H. C., Raimond E., van Woerden H., 1957, BAN, 14, 1
- Visbal, Loeb, & Wyithe (2008) Visbal E., Loeb A., Wyithe S., 2008, arXiv, arXiv:0812.0419
- Wolfe, Gawiser, & Prochaska (2005) Wolfe A. M., Gawiser E., Prochaska J. X., 2005, ARA&A, 43, 861
- Wouthuysen (1952a) Wouthuysen S., 1952a, Phy, 18, 75
- Wouthuysen (1952b) Wouthuysen S. A., 1952b, AJ, 57, 31
- Wyithe & Brown (2009) Wyithe S., Brown M. J. I., 2009, arXiv, arXiv:0912.2130
- Wyithe et al. (2009) Wyithe S., Brown M. J. I., Zwaan M. A., Meyer M. J., 2009, arXiv, arXiv:0908.2854
- Wyithe, Loeb, & Geil (2008) Wyithe J. S. B., Loeb A., Geil P. M., 2008, MNRAS, 383, 1195
- Wyithe (2008) Wyithe S., 2008, arXiv, arXiv:0804.1624
- Zinnecker & Yorke (2007) Zinnecker H., Yorke H. W., 2007, ARA&A, 45, 481
- Zwaan et al. (2005) Zwaan M. A., Meyer M. J., Staveley-Smith L., Webster R. L., 2005, MNRAS, 359, L30
- Zygelman (2005) Zygelman B., 2005, ApJ, 622, 1356