STEREO quadrature observations of the 3D structure and driver of a global coronal wave
Abstract
We present the first observations of a global coronal wave (“EIT wave”) from the two Solar Terrestrial Relations Observatory (STEREO) satellites in quadrature. The wave’s initiation site was at the disk center in STEREO-B and precisely on the limb in STEREO-A. These unprecedented observations from the STEREO Extreme Ultraviolet Imaging (EUVI) instruments enable us to gain insight into the wave’s kinematics, initiation and 3D structure. The wave propagates globally over the whole solar hemisphere visible to STEREO-B with a constant velocity of km s-1. From the two STEREO observations we derive a height of the wave in the range of 80–100 Mm. Comparison of the wave kinematics with the early phase of the erupting CME structure indicates that the wave is initiated by the CME lateral expansion, and then propagates freely with a velocity close to the fast magnetosonic speed in the quiet solar corona.
1 Introduction
Large-scale coronal disturbances propagating over significant fractions of the solar disk were for the first time imaged by the Extreme-ultraviolet Imaging Telescope (EIT) onboard the Solar and Heliospheric Observatory (SOHO; Moses et al., 1997; Thompson et al., 1998). After their discovery, these so-called “EIT waves” were frequently observed at extreme-ultraviolet (EUV) wavelengths in association with flares and coronal mass ejections (CMEs; e.g. Wills-Davey & Thompson, 1999; Klassen et al., 2000; Biesecker et al., 2002). EIT waves were originally assumed to be the coronal counterparts of the chromospheric Moreton waves (Moreton & Ramsey, 1960), predicted in Uchida’s “sweeping-skirt-hypothesis” (Thompson et al., 1999). Moreton waves appear as arc-like disturbances in H filtergrams propagating away from the flare site with velocities of 500 to 1000 km s-1 (e.g. Warmuth et al., 2004). They were interpreted as the ground-track signature of a coronal fast-mode magnetohydrodynamic (MHD) shock wave, which compresses and pushes the chromospheric plasma downward when sweeping over it (Uchida, 1968).
However, soon after the discovery of EIT waves, their interpretation as coronal Moreton waves was questioned, mainly based on statistical studies reporting significant differences between both phenomena: in particular EIT waves occur much more frequently and are on average considerably slower than Moreton waves with velocities in the range 170–350 km s-1 (Klassen et al., 2000; Biesecker et al., 2002). On the other hand, in case studies of strong flare/CME events, where both phenomena could be observed simultaneously, the (single) EIT wave fronts were found to be roughly co-spatial with the Moreton wave fronts (e.g. Thompson et al., 2000; Warmuth et al., 2001). Twelve years after their discovery, EIT waves (or more generally, global EUV waves) are still a very controversial subject in solar physics. Are they really the coronal counterparts of Moreton waves (e.g. Thompson et al., 2000; Warmuth et al., 2001; Vršnak et al., 2006; Veronig et al., 2006). Are they really (MHD shock) waves (e.g. Wang, 2000; Wu et al., 2001; Warmuth et al., 2001; Vršnak et al., 2006; Wills-Davey et al., 2007), or rather propagating disturbances (“pseudo-waves”) related to the successive opening of magnetic field lines during the CME lift-off or forced magnetic reconnection ahead of the CME (e.g. Delannée & Aulanier, 1999; Chen et al., 2002; Attrill et al., 2007)? Are they initiated by the erupting CME, or by the explosive flare energy release? For a recent review the reader is referred to Vršnak & Cliver (2008).
A significant drawback in understanding global coronal waves are the limitations of the EIT observations. Due to the EIT cadence which is at best 12 min, these events are drastically undersampled. The Extreme Ultraviolet Imager (EUVI; Howard et al., 2008) instruments onboard the twin spacecraft of the Solar-Terrestrial Relations Observatory (STEREO; Kaiser et al., 2008), provide fundamentally new potential in studying large-scale disturbances in the solar corona, due to their high observing cadence in different EUV passbands, the large field-of-view (up to 1.7 R⊙) and the two separated vantage points. With such observing capabilities it is for the first time possible to study in detail the structure and kinematics of global EUV waves together with the evolution of the associated CME and flare. So far, a few case studies have been carried out with STEREO/EUVI data. The wave of 19 May 2007 observed at low spacecraft separation was studied in quite some detail by several groups: Long et al. (2008) found that the disturbance was observed in all four EUVI passbands hinting at the multithermal coronal nature of the wave. The wave signature in the 304 Å passband was proposed to be due to a strong contribution from a Si xi line formed at coronal temperatures. Veronig et al. (2008) derived a significant deceleration in the wave kinematics, from about 450 to 200 km s-1, consistent with the decay of a freely propagating large-amplitude MHD fast-mode wave (see also Long et al., 2008). Further evidence for the fast-mode nature of the observed disturbance was provided by Gopalswamy et al. (2009) who studied the wave reflection at the borders of a coronal hole. Refractions and reflections of fast-mode coronal MHD waves at regions of high Alfvén velocity were previously studied in simulations (e.g. Wang, 2000; Wu et al., 2001; Ofman & Thompson, 2002), and provide strong evidence for the wave nature of the phenomenon. Patsourakos et al. (2009) presented the first study of an EUV wave observed at large separation of the two STEREO spacecraft (45). These authors studied the 3D evolution of the associated CME, finding a close association between the expanding CME loops and the wave onset. Combining the observations with simulations, these authors provide strong evidence for the fast-mode MHD wave nature of the observed disturbance.
In this Letter, we present the first observations of a global EUV wave observed with the two STEREO spacecraft in quadrature. The wave of 13 February 2009 was observed simultaneously at disk center by STEREO-B and on the solar limb by STEREO-A. These unprecedented STEREO quadrature observations allow us to study in detail the 3D kinematics and 3D structure of the wave together with the onset and early evolution of the associated CME, and how both phenomena are related.
2 Data
The STEREO mission consists of two spacecraft with identical instrument suites orbiting the Sun near the ecliptic plane. STEREO-A(head) moves on a slightly smaller orbit than the Earth, while the orbit of STEREO-B(ehind) is slightly larger, resulting in an increase of their angular separation by 45 per year. On February 13, 2009 the two STEREO satellites were 91 apart, observing in perfect quadrature a global EUV wave associated with a GOES B2.4 flare/CME event. The evolution of the coronal wave and the onset of the associated CME is studied in high-cadence STEREO EUVI imagery. In the 195 Å filter, the observing cadence was 10 min for both STEREO satellites, in the 171 Å filter it was 2.5 min for STEREO-A and 5 min for STEREO-B [henceforth ST-A and ST-B]. To compare the observations from ST-A (on 13 February 2009, at a distance of 0.964 AU from Sun) and ST-B (1.003 AU), all images were re-scaled to Earth distance (0.987 AU). The EUVI data were fully reduced using the SECCHIPREP routines available within Solarsoft, and differentially rotated to 05:30 UT. To enhance the contrast of the transient wave signatures, we constructed from the EUVI 171 and 195 Å frames running difference and running ratio images, where we subtracted (divided) from each image a frame that was taken 10 min before.
3 Results
3.1 Wave kinematics
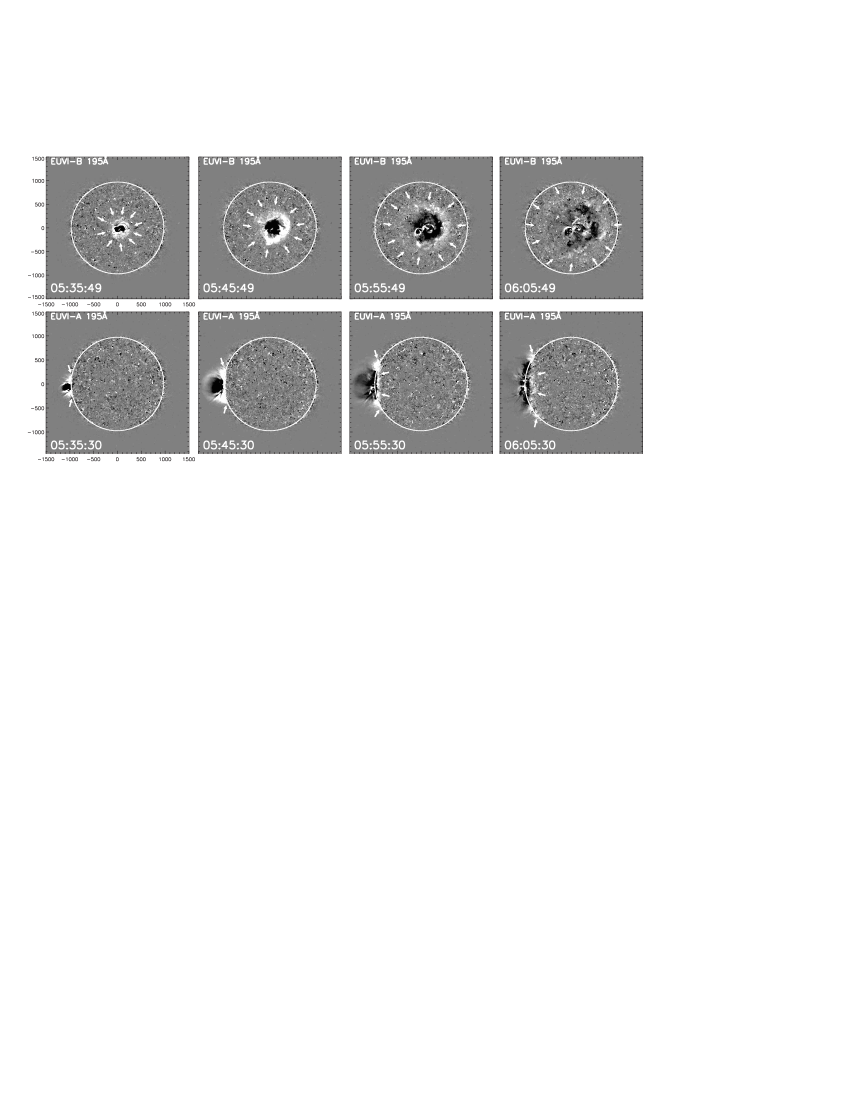
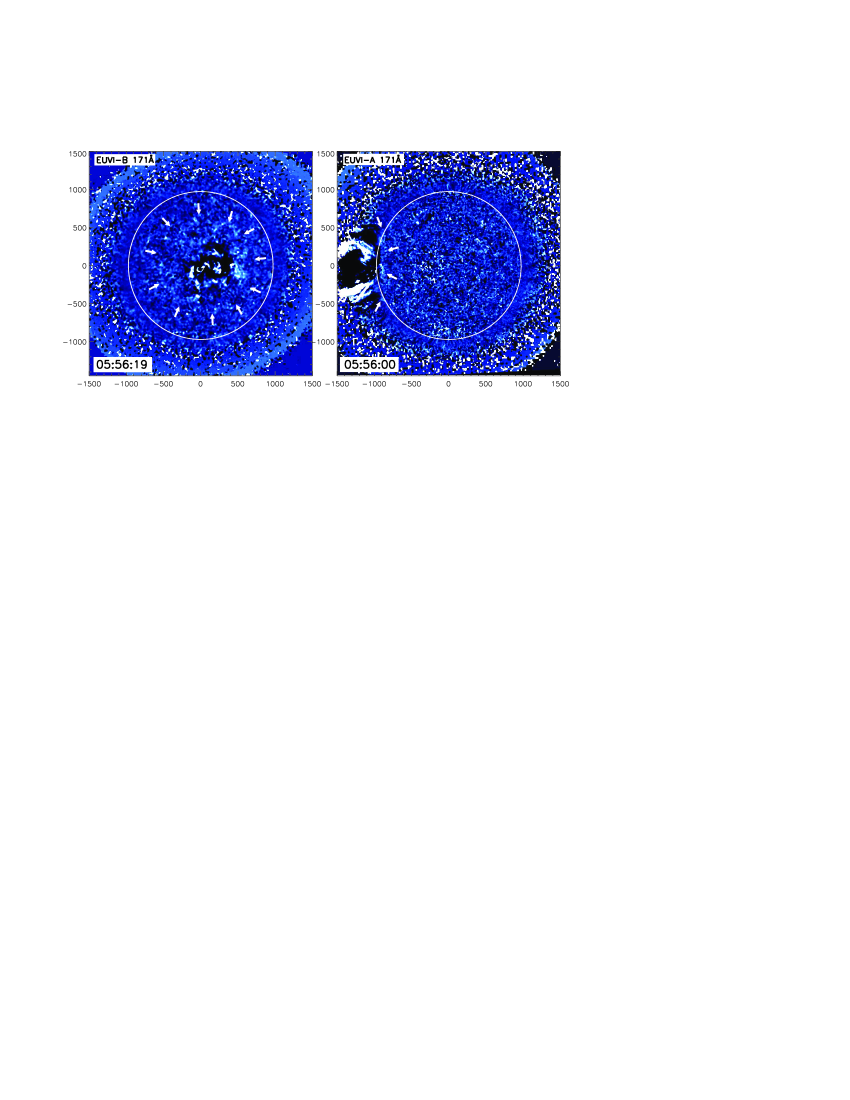
ST-B observed the coronal wave on the solar disk, with the wave center and the associated weak B2.4 flare being located precisely at Sun center. Due to the satellite’s quadrature configuration, this results in a perfect limb event for ST-A. Figure 1 shows the wave evolution in simultaneous EUVI 195 Å running difference images from ST-A and ST-B (see also the accompanying movie). Figure 2 shows one snapshot of the wave observed in the EUVI 171 Å filter. A movie of 171 Å running ratio images (with 5 min cadence) is available in the online material. The coronal wave was first observed at 05:35 UT, and could be followed up to at least 06:20 UT. ST-B observations reveal that the coronal wave is globally propagating into all directions, but with much larger brightness toward the western hemisphere. ST-A shows the wave propagation at the solar limb as well as the erupting CME structure. In the last two panels in Fig. 1, ST-A observes the coronal wave simultaneously above the limb as well as on the disk.
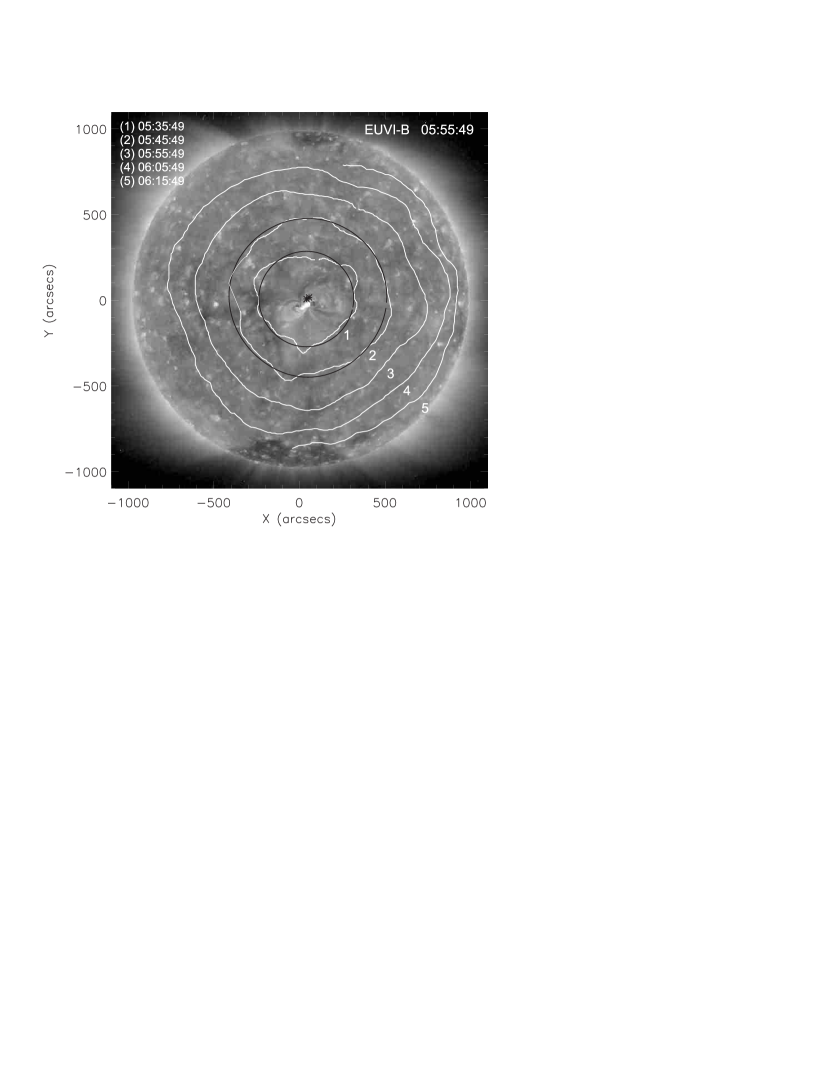
In Fig. 3, we plot a ST-B 195 Å direct image together with all wavefronts determined from ST-B 195 Å running difference images. The source center required to derive the kinematics of the wave was obtained from circular fits to the earliest wavefronts in the 3D spherical plane (for details we refer to Veronig et al., 2006). The resulting fits and derived wave centers are also plotted in Fig. 3, showing the wave initiation center slightly north of the flaring active region. For each wavefront identified in the ST-B 195 Å and 171 Å running difference images, we determined the mean distance from the derived center along the spherical solar surface.
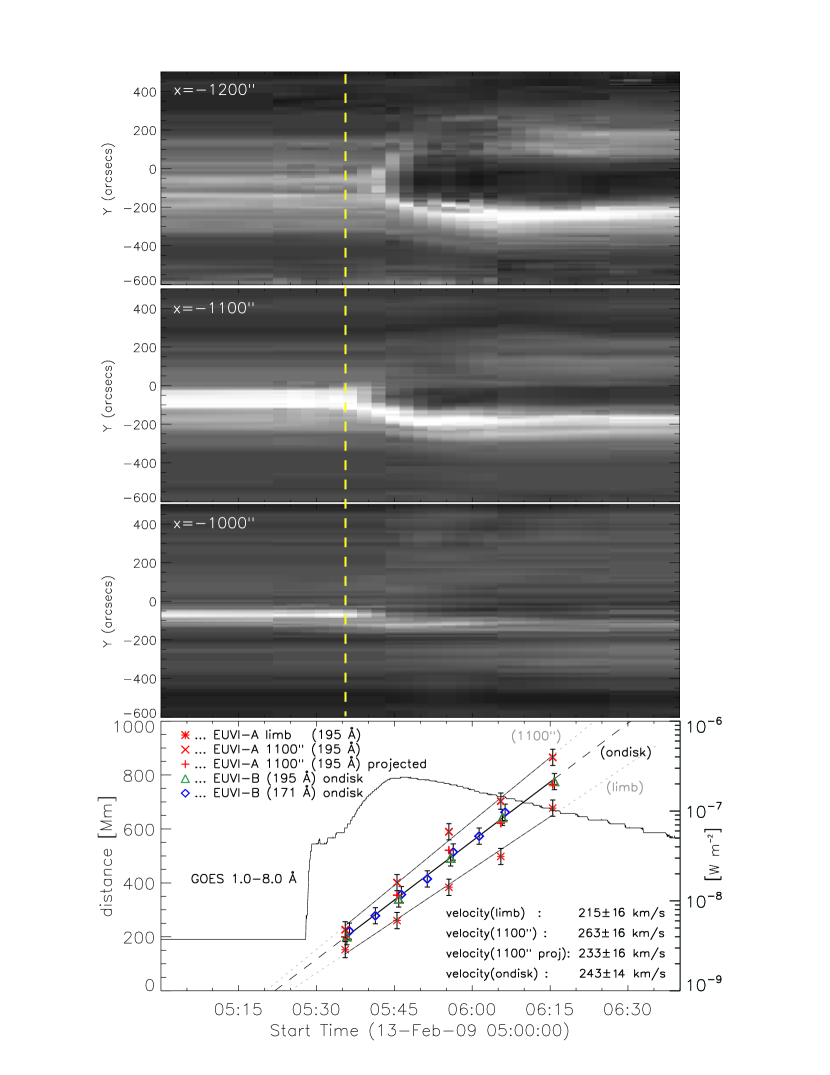
The bottom panel in Fig. 4 shows the resulting wave kinematics together with the GOES soft X-ray flux of the associated B2.4 flare. Green triangles and blue diamonds mark the mean distances of the wavefronts observed on-disk in EUVI-B 195 Å and in 171 Å, respectively. The velocity of the wave, km s-1, is constant over the full propagation range from 200 to 750 Mm. We also studied the wave kinematics separately for different propagation sectors (not shown in Fig. 4). The velocity derived for different directions is the same within the error bars but the brightness is quite different for the propagation into the western and eastern direction (see Figs. 1 and the online movies). These findings imply that the propagation speed does not vary with the amplitude of the perturbation.
3.2 3D structure of the wave
The lateral observations of the wave from ST-A clearly reveal its 3D nature, with the wave front visible to a considerable height above the solar surface (last panel in Fig. 5). In the following, we compare the wave kinematics as observed on-disk from ST-B with those derived from the limb-observations in ST-A. Since ST-A has an edge-on view of the wave, the distance measurements are basically free from projection effects. We also show how the data from two observing platforms separated by 90 can be used to estimate the typical heights of the wave observations in on-disk measurements.
The red asterisks in the bottom panel in Fig. 4 show the wave kinematics as obtained from ST-A by measuring the wave evolution along the solar limb, i.e. at a height of 0′′. The resulting data points lie 50–100 Mm behind the kinematical curve derived from the on-disk ST-B observations, indicating that the wave propagates significantly above the solar surface. However, if we just increase the spherical surface on which the wavefront observed by ST-A is measured, we are not able to obtain a reasonable agreement with the wave kinematics derived from ST-B on-disk observations. This is demonstrated by the red x symbols in Fig. 4, showing the wave kinematics derived along a spherical surface at a height of above the solar limb. Considering the 3D nature of the wave, projection effects have to be taken into account in the ST-B on-disk observations. The ST-B on-disk observations are then a result of integrating the emission from the wave front high above the solar surface along the line-of-sight (illustrated by the long arrow in Fig. 5). Assuming a height of 130′′ (90 Mm) for the wave observations projected onto the solar surface, the wavefront distances and velocities derived from ST-A and ST-B are in agreement (see Fig. 4).
What do we learn from this? First, the emission of EUV waves observed on-disk originates from high above the solar surface (80–100 Mm). This is similar to the height of Mm derived for a global EUV wave observed with STEREO at a spacecraft separation of 45 using triangulation techniques (Patsourakos et al., 2009). Such heights are comparable to the coronal scale-height of 50–100 Mm for quiet Sun temperatures of 1–2 MK, and consistent with the propagation of a MHD fast-mode wave over quiet Sun regions, since the wave perturbs and compresses the ambient coronal plasma with its bulk confined within a coronal scale-height (Patsourakos et al., 2009). Second, the derived wave height of about 80–100 Mm is not the upper edge (see also the right panel in Fig. 5) but reflects the maximum of the line-of-sight integration of the increased intensity due to the plasma compression at the wave front. Third, there may be an underestimation of about 10% of the coronal wave speed derived from the disk-observations ( km s-1) with regard to the “real” propagation velocity at heights of 80–100 Mm, where we find km s-1.
3.3 Associated coronal mass ejection
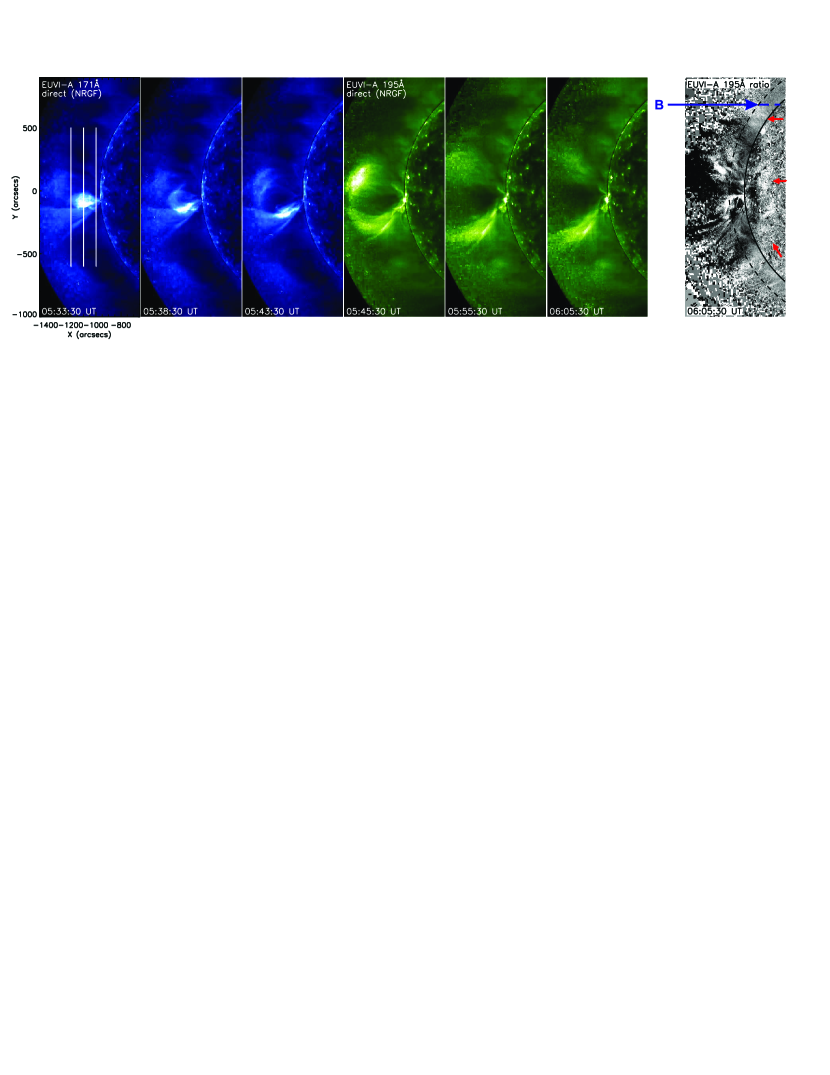
The early evolution of the erupting CME associated with the coronal wave is observed with high-cadence by ST-A, basically free from projection effects. This enables us to study the expansion of the erupting CME with relation to the wave propagation. In order to enhance the coronal structures above the limb, we removed the steep radial intensity gradient by a normalizing-radial-graded filter (NRGF; Morgan et al., 2006). A bulb-like pre-CME structure is observed hours before the event, and starts to erupt around 05:30–05:35 UT (Fig. 5).
In order to follow in detail the CME take-off and lateral expansion in the low corona, we selected various vertical slices in the plane of sky from the NRGF-filtered EUVI-A 171 Å images (available at a cadence of 2.5 min) at different coronal heights. In Fig. 4, we show three stack plots extracted from -slices centered at , , and (indicated in the first panel in Fig. 5) covering the length . These plots reveal the pre-existing CME structure as well as the expansion of the CME flanks. (Though we note that the stack plots include also some contribution of the CME upward movement in addition to the expansion.) The bifurcation of the bright horizontal feature indicates the onset of the lateral expansion of the CME. In the ( Mm) stack plot, the bifurcation starts at 05:32 UT with the fastest growth around 05:35 UT. For ( Mm), the fast onset occurs later by about 2–3 min. The expansion stops at 05:50 UT for and at 06:00 UT for . In the slice, which is low in the corona ( Mm), only a marginal CME expansion is observed, revealing the anchored ends of the CME flanks.
Studying stack plots at various heights (-positions), we find that the coronal wave onset (05:35 UT) is consistent with the CME lateral expansion at coronal heights in the range 70–120 Mm. At the slice ( Mm), shown in Fig. 4, the expansion starts around 05:32 reaching the fastest growth at 05:35 UT. This suggests that the wave is initiated between 05:32–05:35 UT by the CME expanding flanks, and thereafter propagates freely. In the last panel in Fig. 5, we show a EUVI-A 195 Å high-contrast ratio image at 06:05 UT, which clearly reveals the coronal wave (above the limb as well as on the disk) far away from the erupting structure.
4 Discussion and Conclusions
From the STEREO quadrature observations of a coronal wave observed simultaneously in frontal and lateral view, we find that the EUV emission of the coronal wave originates at a height of about 80–100 Mm. The wave propagation speed (corrected for projection effects) is 260 km s-1. The wave speed is constant over the full range of quiet-Sun region it traversed and homogeneous in all directions though the perturbation amplitudes are quite different for different propagation directions (in particular toward the western and eastern direction as observed from ST-B). This is a different behavior compared to the wave observed by STEREO on 19 May 2009, which revealed a distinct deceleration from 450 to 200 km s-1 (Veronig et al., 2008). The associated flare X-ray flux is very weak (GOES B2.3), which suggests that the flare pressure pulse is unlikely to be causing the wave.
The first observations of the wave coincides with the onset of fast expansion of the CME expanding flanks at a height of – Mm (see Fig. 4) suggesting that this expansion initiates the wave. Afterwards, the wave propagates freely and is far ahead of the observed CME flanks (see right panel of Fig. 5). Such a behavior was also observed in the EUVI event studied in Patsourakos et al. (2009). This offset of the wave front with respect to the projected CME flank is not in line with the behavior expected from the “pseudo-wave” models (e.g. Delannée & Aulanier, 1999; Chen et al., 2002; Attrill et al., 2007), where the wave front should be basically co-spatial with the CME front. From the stack plots in Fig. 4 and from direct measurements of the CME expanding flanks, we find that the peak velocity of the lateral CME expansion at a fixed height of 90 Mm is 150 km s-1. This provides us with an estimate of the driver speed.
These findings (driver speed smaller than wave speed; constant wave velocity over the full observation range, i.e. not varying with amplitude) indicate that we are dealing with a fast-mode MHD wave not too far from the linear regime. In this case, we would expect the wave to propagate at the characteristic speed of the medium (i.e. the fast magnetosonic speed), independent of the amplitude of the perturbation. A fast magnetosonic speed in the range of 260 km s-1 is not unreasonable for quiet Sun coronal conditions in the deep solar minimum. Recently, direct magnetic field measurements of the corona were deduced by Lin et al. (2004) who obtained a field strength of 4 Gauss above an active region at a height of 1.1 R⊙. Assuming for quiet Sun conditions a magnetic field strength in the range of 1 to 3 Gauss and a coronal density of cm-3, the fast magnetosonic speed lies in the range 210 to 350 km s-1 which is consistent with the observed wave velocity. Thus, we conclude that the observed EUV transient is a real wave, and that its observational characteristics is consistent with a low-amplitude MHD fast-mode wave (i.e. not a shock wave). Finally, we note that there is a recent paper on the same event (Patsourakos & Vourlidas, 2009). These authors basically arrive at the same conclusions of a fast-mode MHD wave but use a different approach, modeling the CME and wave structures based on EUVI and COR observations.
References
- Attrill et al. (2007) Attrill, G. D. R., Harra, L. K., van Driel-Gesztelyi, L., & Démoulin, P. 2007, ApJ, 656, L101
- Biesecker et al. (2002) Biesecker, D. A., Myers, D. C., Thompson, B. J., Hammer, D. M., & Vourlidas, A. 2002, ApJ, 569, 1009
- Chen et al. (2002) Chen, P. F., Wu, S. T., Shibata, K., & Fang, C. 2002, ApJ, 572, L99
- Delannée & Aulanier (1999) Delannée, C., & Aulanier, G. 1999, Sol. Phys., 190, 107
- Gopalswamy et al. (2009) Gopalswamy, N., et al. 2009, ApJ, 691, L123
- Howard et al. (2008) Howard, R. A., et al. 2008, Space Science Reviews, 136, 67
- Kaiser et al. (2008) Kaiser, M. L., Kucera, T. A., Davila, J. M., St. Cyr, O. C., Guhathakurta, M., & Christian, E. 2008, Space Science Reviews, 136, 5
- Klassen et al. (2000) Klassen, A., Aurass, H., Mann, G., & Thompson, B. J. 2000, A&AS, 141, 357
- Lin et al. (2004) Lin, H., Kuhn, J. R., & Coulter, R. 2004, ApJ, 613, L177
- Long et al. (2008) Long, D. M., Gallagher, P. T., McAteer, R. T. J., & Bloomfield, D. S. 2008, ApJ, 680, L81
- Moreton & Ramsey (1960) Moreton, G. E., & Ramsey, H. E. 1960, PASP, 72, 357
- Morgan et al. (2006) Morgan, H., Habbal, S. R., & Woo, R. 2006, Sol. Phys., 236, 263
- Moses et al. (1997) Moses, D., et al. 1997, Sol. Phys., 175, 571
- Ofman & Thompson (2002) Ofman, L., & Thompson, B. J. 2002, ApJ, 574, 440
- Patsourakos & Vourlidas (2009) Patsourakos, S., & Vourlidas, A. 2009, ApJ, 700, L182
- Patsourakos et al. (2009) Patsourakos, S., Vourlidas, A., Wang, Y. M., Stenborg, G., & Thernisien, A. 2009, Sol. Phys., 90
- Thompson et al. (2000) Thompson, B. J., Cliver, E. W., Nitta, N., Delannée, C., & Delaboudinière, J.-P. 2000, Geophys. Res. Lett., 27, 1431
- Thompson et al. (1999) Thompson, B. J., et al. 1999, ApJ, 517, L151
- Thompson et al. (1998) Thompson, B. J., Plunkett, S. P., Gurman, J. B., Newmark, J. S., St. Cyr, O. C., & Michels, D. J. 1998, Geophys. Res. Lett., 25, 2465
- Uchida (1968) Uchida, Y. 1968, Sol. Phys., 4, 30
- Veronig et al. (2008) Veronig, A. M., Temmer, M., & Vršnak, B. 2008, ApJ, 681, L113
- Veronig et al. (2006) Veronig, A. M., Temmer, M., Vršnak, B., & Thalmann, J. K. 2006, ApJ, 647, 1466
- Vršnak & Cliver (2008) Vršnak, B., & Cliver, E. W. 2008, Sol. Phys., 253, 215
- Vršnak et al. (2006) Vršnak, B., Warmuth, A., Temmer, M., Veronig, A., Magdalenić, J., Hillaris, A., & Karlický, M. 2006, A&A, 448, 739
- Wang (2000) Wang, Y.-M. 2000, ApJ, 543, L89
- Warmuth et al. (2001) Warmuth, A., Vršnak, B., Aurass, H., & Hanslmeier, A. 2001, ApJ, 560, L105
- Warmuth et al. (2004) Warmuth, A., Vršnak, B., Magdalenić, J., Hanslmeier, A., & Otruba, W. 2004, A&A, 418, 1101
- Wills-Davey et al. (2007) Wills-Davey, M. J., DeForest, C. E., & Stenflo, J. O. 2007, ApJ, 664, 556
- Wills-Davey & Thompson (1999) Wills-Davey, M. J., & Thompson, B. J. 1999, Sol. Phys., 190, 467
- Wu et al. (2001) Wu, S. T., Zheng, H., Wang, S., Thompson, B. J., Plunkett, S. P., Zhao, X. P., & Dryer, M. 2001, J. Geophys. Res., 106, 25089