Near-IR imaging and spectroscopy of the nuclear region of the disturbed Virgo cluster spiral NGC 4438 ††thanks: Based on VLT service mode observations (Programme 69.B-0411) and TIMMI2 (run 68.D-0432) gathered at the European Southern Observatory, Chile.
Abstract
We present near-infrared VLT ISAAC imaging and spectroscopy of the peculiar Virgo galaxy NGC 4438, whose nucleus has been classified as a LINER. The data are supplemented by mid-infrared imaging, and compared to previous WFPC2 HST broadband images. Images and position-velocity maps of the [Fe ii] and H2 line emissions are presented and compared with the distribution of the optical narrow-line region and radio features. Our results show that shocks (possibly driven by a radio jet) contribute to an important fraction of the excitation of [Fe ii], while X-ray heating from a central AGN may be responsible for the H2 excitation. We address the question whether the outflow has an AGN or a starburst origin by providing new estimates of the central star formation rate and the kinetic energy associated with the gas. By fitting a Sérsic bulge, an exponential disc and a compact nuclear source to the light distribution, we decomposed NGC 4438’s light distribution and found an unresolved nuclear source at 0.8 resolution with and . Our measured bulge velocity dispersion, 142 , together with the standard relation, suggests a central black hole mass of . The stellar kinematics measured from the near-infrared CO lines shows a strong peak in the velocity dispersion of 178 in the central 0.5″, which is possible kinematic evidence of a central black hole. We calculated a general expression for the integrated Sérsic profile flux density in elliptical geometry, including the case of ‘disky’ isophotes.
keywords:
galaxies: individual: NGC 4438 – galaxies: active – galaxies: starburst1 Introduction
NGC 4438 is a large peculiar spiral galaxy, with a disturbed stellar disc and an even more heavily disturbed interstellar medium (ISM). Located near the centre of the Virgo cluster, NGC 4438 has undergone a violent collision with the nearby giant elliptical M86 (Kenney et al., 2008), and may also be experiencing ongoing ram pressure stripping due to an interaction with the Virgo intracluster medium (Vollmer et al., 2009). NGC 4438’s nucleus has been classified as a particularly interesting LINER (low-ionisation nuclear emission-line region, Heckman, 1980). The spectra of LINERs are characterized by the presence of emission lines from atomic species of low ionisation state. By definition, LINERs are galaxies which host nuclei with emission-line ratios that satisfy the following criteria: [O iii], [O i], and [N ii] (Osterbrock & Ferland, 2005). Their emission line spectra are similar to those observed in narrow-line regions (NLRs) of gas in Seyfert 2 galaxies. However, some LINERs have relatively powerful central black holes, and tend to have broader emission lines (e.g., NGC 1052, Ho et al., 1997).
The most likely mechanism to explain the excitation in these objects is photoionization either from an active galactic nucleus (AGN) or from a strong stellar continuum (Ho et al., 2003). AGN photoionisation models fit both the low-ionisation spectra of LINERs and the high-ionisation spectra of the Seyfert NLRs with similar nuclear emission, but different nebular conditions (such as the electron density and the incident ionising luminosity; see discussion by Ho et al., 2003; Osterbrock & Ferland, 2005).
The nucleus of NGC 4438 lies at the root of a nuclear bubble, expanding to the north-west (NW), which has been imaged in H+[N ii] emission by Kenney & Yale (2002). In contrast with other similar systems, it is not clear what is powering this bubble, since there is neither a strong starburst nor a strong AGN in NGC 4438. For example, the galaxy NGC 2782 posseses a central starburst (extending over a radius 200 pc) which provides the mechanical luminosity that drives its central winds (Jogee et al., 1999). The Seyfert galaxy NGC 3079 harbours both a powerful AGN and a circumnuclear starburst (Veilleux et al., 1994), while M82’s outflows are driven only by a nuclear starburst (Lehner et al., 1999). Moreover, there are many other objects powered by composite systems where a circumnuclear starburst coexists with a central low-luminosity AGN (Rodríguez-Ardila et al., 2005). Levenson et al. (2003) observed the Seyfert 2 starburst galaxy NGC 5135, distinguishing both the AGN (unresolved) and the starburst (spatially extended over 200 pc).
Broad H emission in NGC 4438 has been tentatively inferred by Ho et al. (1997) from the fitting of optical spectra. We have repeated the fitting of the H emission line profile on their data but with a smaller number of Gaussian components than Ho et al. (1997), obtaining similar results. Fig. 1 shows that a broad, FWHM2050 , Gaussian component is clearly present in the emission-line complex. This spectral feature is thought to be indicative of the presence of active nuclei harboring a broad emission-line region (Ho et al., 1997).
Near-IR (near-infrared) light can escape high opacity and dusty environments more easily than H photons can, making it possible to detect heavily obscured line-emitting regions. Near-IR emission-lines; such as [Fe ii] 1.257 m and H2 2.122 m, are less sensitive to extinction than optical lines such as H. Near-IR observations can provide better extinction estimates, and can yield new information on the intensity of a potentially obscured central AGN or starburst.
Results of a near-IR spectroscopic survey of LINER galaxies carried out by Larkin et al. (1998), showed that the [Fe ii] line ( at 1.257 m) is the most commonly detected emission-line in LINERs (see also, Rodríguez-Ardila et al., 2005). The H2 line ( at 2.122 m) is also a common feature. On the other hand, the Pa emission-line (or H i 3–5 at 1.282 m), which is the strongest near-IR recombination line available at low redshift in AGN and starburst galaxies, is only found in emission in 20% of the LINER galaxies in Larkin et al. (1998) sample. Br (or H i 4–7 at 2.166 m) is undetected in all the galaxies of the survey.

NGC 4438’s combination of peculiar spectral features, complex morphology and the possibility of studying the nuclear bubble at different wavelengths led us to obtain new near-IR imaging and spectroscopic data. In this work, we present the results of ISAAC imaging and spectroscopy of NGC 4438, focusing on analysis of line emission maps and on two-dimensional modelling of the galaxy surface brightness. We want to study the morphology of NGC 4438 and whether there is a nuclear point source embedded in the bulge. In Section 2, we begin by giving a brief description of the observations. In Section 3 we discuss the nuclear line emission based on both imaging and spectroscopy, together with extinction estimates. In Section 3.3 we derived the line-of-sight stellar velocity dispersion from CO bands absorption features. In Section 4 we present the 2D decomposition of the surface brightness of NGC 4438. In Section 5 we discuss and compare our findings with previous studies in the X-ray, optical and radio wavelengths, focusing on the energetics of the nuclear source and the surface brightness modelling results. Appendix A gives a detailed description of the data reduction of the imaging data. In Appendix B we describe the surface brightness model used to fit the light distribution and how we measure structural parameters.
Throughout this paper we use a distance to NGC 4438, near the centre of the Virgo cluster, of 16 Mpc (at which corresponds to a distance scale of 77.6 pc). All the data reduction and analysis were carried out using the Perl Data Language (http://pdl.perl.org, Glazebrook et al., 1997). The stellar kinematics was derived using IDL (http://www.ittvis.com/idl/).
2 Observations
2.1 Imaging
| Date | Filter | Integration | Zero point | 111Foreground extinction (see Section 3.1). | Seeing222Effective seeing at the observed wavelength, given by the FWHM of the best-fitted Gaussian profile. |
|---|---|---|---|---|---|
| (sec) | (mag) | (mag) | (arcsec) | ||
| broad-band data | |||||
| Apr 14 2003 | 400 | 24.85 | 0.025 | 0.86 | |
| Apr 14 2003 | 400 | 24.31 | 0.016 | 0.62 | |
| Jan 13 2003 | 284 | 24.12 | 0.010 | 0.58 | |
| narrow-band data | |||||
| Apr 14 2003 | 600 | 21.88 | – | 0.69 | |
| Apr 14 2003 | 600 | 21.69 | – | 0.56 | |
| Jan 13 2003 | 800 | 21.62 | – | 0.55 | |
| Jan 14 2003 | 800 | 21.80 | – | 0.57 | |
| Jan 13 2003 | 800 | 21.76 | – | 0.51 | |
| Date | Filter | Spectral domain | Slit width | 333Spectral resolution from ISAAC manual. | Integration | PA444Position angle on the sky, convention is positive from North to East. | Notes on quality and spectral features |
|---|---|---|---|---|---|---|---|
| () | (arcsec) | (sec) | (degrees) | ||||
| Apr 04 2002 | 2.80 – 4.00 | 0.6 | 600 | 240.94 | -57.10 | Good. No PAHs. | |
| Apr 04 2002 | 2.25 – 2.37 | 0.3 | 8900 | 2300 | +107.25 | Good. CO band-heads | |
| Feb 09 2003 | 2.11 – 2.23 | 0.3 | 8900 | 2300 | +107.25 | Good. CO band-heads | |
| Feb 09 2003 | 2.11 – 2.23 | 0.6 | 4400 | 2300 | -57.65 | Bad, fringing | |
| Apr 14 2003 | 1.25 – 1.30 | 0.6 | 5200 | 2600 | -57.65 | Regular. Resolved [Fe ii] emission | |
| May 23 2003 | 1.25 – 1.30 | 0.3 | 10500 | 2300 | -37.55, +17.25, +76.65 | Good. Resolved [Fe ii] emission for PA-37.55 | |
| May 23 2003 | 2.11 – 2.23 | 0.3 | 8900 | 2500 | -37.55, +17.25, +76.65 | Regular. Resolved H2 emission for PA-37.55 |
We observed NGC 4438 with the VLT ISAAC imager and spectrograph (Moorwood et al., 1998), which has a field of view of and a pixel scale . Our data consist of the following broad and narrow band (NB) filters: , , , NBm, NBm, NBm and NBm filters. Our observing strategy involved acquiring 3 to 10 s exposures in a dithered pattern consisting of four frames with vertical and horizontal offsets of and , respectively.
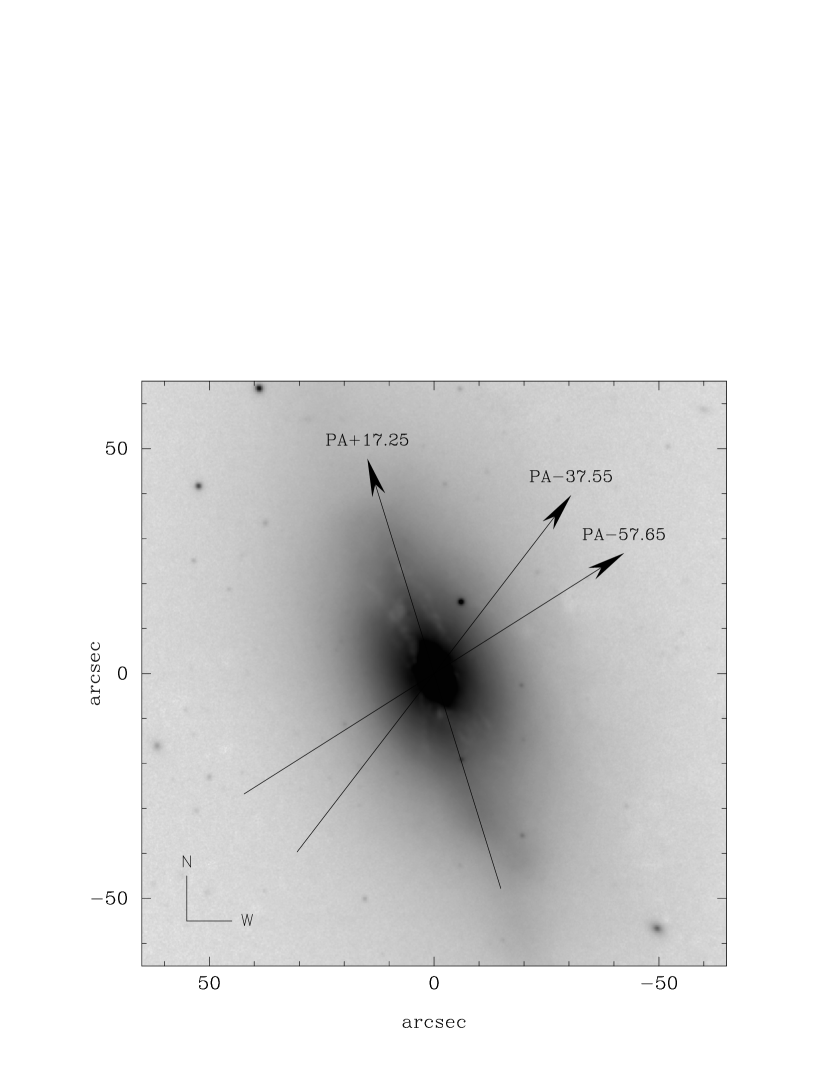
Data reduction and calibration procedures are summarized in Appendix A. Table 1 gives the dates, integration times and calibration parameters for each observation. Fig. 2 shows the ISAAC -band image of NGC 4438 after flat-fielding, bad-pixel correction, and sky and bias subtraction.
Only the central region of the field (inner 40 arcseconds) has a symmetric point-spread function (PSF). The outskirts of the array show extended tails due to optical aberrations. In this central region we report a seeing of for the NB filters, while for the broadband filters we report a seeing of (see Table 1).
2.1.1 Complementary imaging data
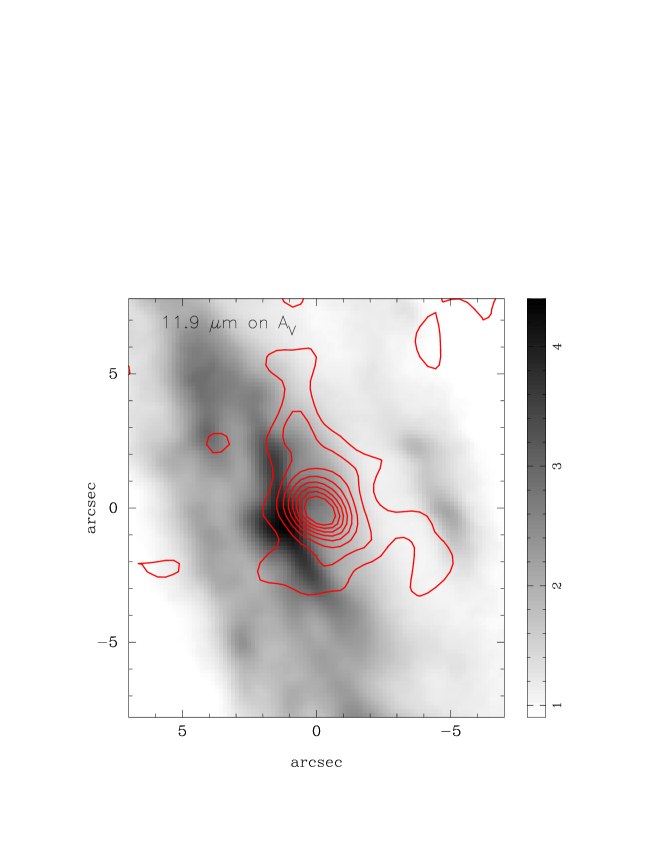
We also observed NGC 4438 with the TIMMI2 camera on the ESO 3.6m telescope on UTC 2002-01-01T08:50, with a lens scale of 0.3 arcsec per pixel. The target was acquired in the NB 11.9 m filter by blind pointing on the HST coordinates of the nucleus, with a rms positional uncertainty in a field of view of . The object is detected in NB 11.9 m, which is free of emission lines. Yet our aligned chopping and nodding strategy, with a throw of 30′′ North-South, fits one of the negative images on the array. The presence of the chopped image confirms our detection. We enhanced the signal-to-noise ratio of our image by smoothing with a Gaussian kernel, with a dispersion of 2 pixels, or . Flux calibration was obtained by comparison with HD81797, with a 11.9 m flux density of 100.57 Jy. By fitting an elliptical Gaussian to the standard star we infer an angular resolution of FHWM. After smoothing, the resolution of the image in Fig. 10 is about . We set the astrometry by tying the centroid of the 11.9 m emission to the HST coordinates for the nucleus.
We complemented the infrared data with recalibrated WFPC2 HST images, broadbands F450W (), F675 () and F814W (). We retrieved these data from the HST archive located at the Canadian Astrophysics Data Centre (CADC). The CADC pipeline recalibrates the images with up-to-date calibration files. The details of these observations are described by Kenney & Yale (2002). Since the pixels covering the nuclear emission were saturated in and images, we used only the -band image to carry out the photometry of the nucleus.
2.2 Medium-resolution near-IR spectroscopy
Near-IR spectra of NGC 4438 were obtained with ISAAC at VLT on 2003 March-April. We acquired medium resolution spectra at central wavelengths of 1.274 , 2.170 , and 2.310 , and slit widths of 0.3 and 0.6 arcsec. The list of observations, filters, position angles, spectral domains, resolutions and slit widths can be found in Table 2. Fig. 2 shows some of the slit positions overlaid on the -band ISAAC image.
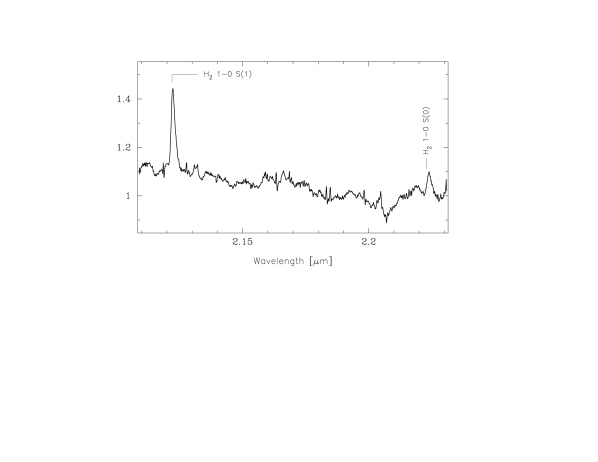
The sky background (including OH skylines) was removed by differencing along the slit, with nod throws of 50 arcsec (or 30 arcsec in the case of standard stars, STDs hereafter). Wavelength calibration was obtained by comparison with arc lamps. The spectra were extracted in 0.74 arcsec centred on the peak of emission. Telluric absorption spectra and flux density calibration were obtained by observing the early-type star HD115709 (spectral type A1IV) and comparing with a black-body spectrum. Stellar absorption features at Pa and Br were accounted for by fitting Voigt profiles in a total wavelength range of 0.015 in the vicinity of the stellar absorption lines. Samples of the reduced spectra, centred at 1.274 and 2.170 , are shown in Fig. 3.
Flat-fielding was hampered by short-term variations in the CCD pixel gains. The observatory pipeline flat fields could not suppress the low-level features on scales of 0.005 seen in the spectra of Fig. 3. The features under W m-2 m-1 were not reproduced in different exposures, which suggests flat-fielding artifacts. Try as we might we could not improve on the pipeline flats. We treat the low-level artifacts as noise, so that the depth of the spectroscopy did not meet our expectations. The ISAAC near-IR spectroscopy is nonetheless informative on the kinematics of the CO band-heads, [Fe ii] 1.26 and H2 2.12 .

2.3 Low-resolution spectroscopy
We acquired a low-resoution L-band (3.8 ) spectrum at PA +56.94, in 7 ABBA cycles, for a total integration time of 1 h (with individual DITs of 0.935 s and 4 NDITs, a chopthrow of 20 arcsec, and a chopping frequency of 0.11 Hz). The spectrum shows a continuum rising towards longer wavelengths. This L-band spectrum does not show any spatially resolved features. The flux density in the collapsed 0.6 arcsec slit is W m at 2.8 , and W m at 4.0 . The noise varies as a function of wavelength, between to W m. This spectrum shows no evidence of the presence of polycyclic aromatic hydrocarbons (PAHs) emission in NGC 4438.
3 Results
3.1 Extinction estimates
A consequence of the dependence of interstellar extinction on wavelength is that the near-IR imaging often reveals surprising morphological differences when compared to optical observations (see Cardelli et al., 1989, for a description of the Galactic extinction law). Nuclear extinction estimates are very uncertain in NGC 4438. The Balmer decrement gives (using the extinction law from Cardelli et al., 1989), but this represents a luminosity-weighted average over the central extraction aperture of the low-resolution ground-based spectroscopy reported by Ho et al. (1997), and also a lower limit to the true extinction.
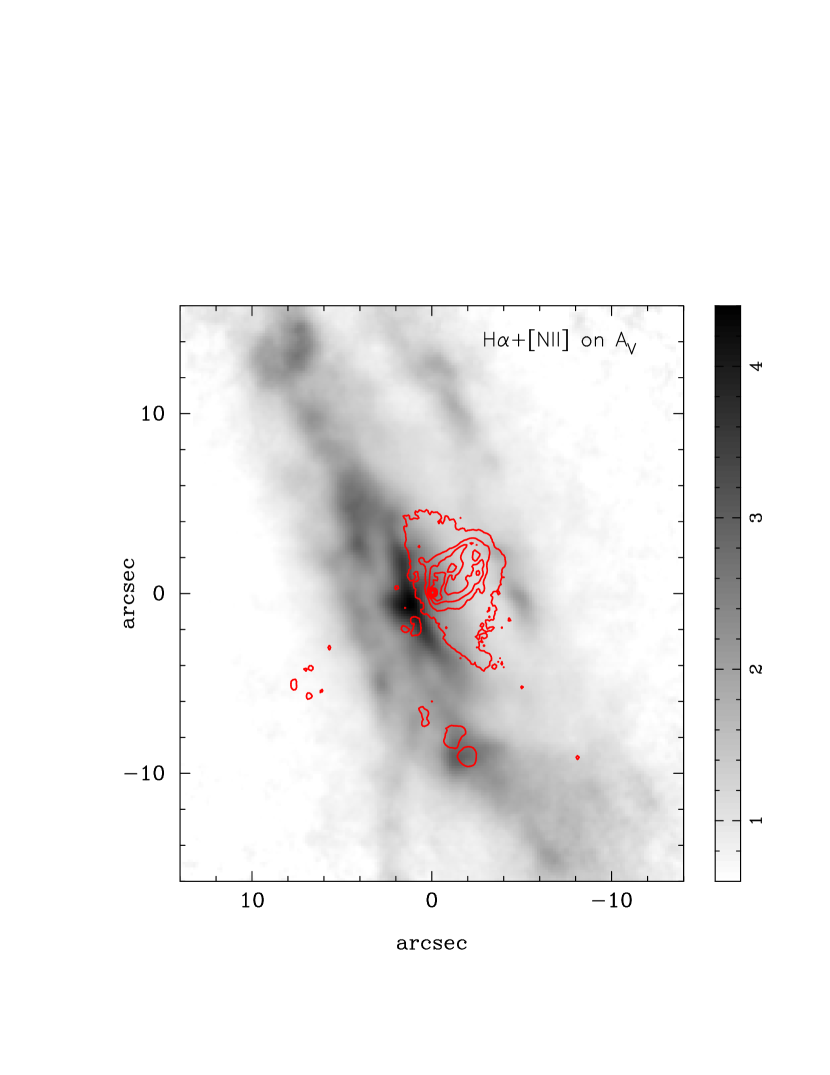
In order to further investigate the spatial distribution of the dust in the system we generated an extinction map (see Fig. 4). This was done by transforming the colour image into a colour excess map, . We assumed a flat and constant stellar population, as expected for bulges of spirals, with (calculated over an aperture in a region devoid of structure). The colour excess map and the column of hydrogen nuclei are related by , assuming a Galactic gas-to-dust ratio and (Tokunaga, 2000). We inferred a mean colour excess for an aperture matched with the used by Ho et al. (1997). Using the standard IR interstellar reddening law (Cardelli et al., 1989), it implies a visible colour excess of , which is fully consistent with the colour excess reported by Ho et al. (1997), of . As revealed by the presence of strong dust lanes, the nuclear extinction is highly variable toward the central hundred parsecs (Kenney & Yale, 2002).
The spatial distribution of extinction and dust is shown in Fig. 4. The lower edge of the H bubble emission is coincident with bands of strong extinction. These region of high extinction seem to be surrounding the nucleus (given by the peak of H emission), with a peak of mag at around 1″east of the nucleus.
The measured colour excess implies an average hydrogen column density at the base of the NW bubble (shown in Fig. 4), and a mean column for the rest of the NW bubble (using the total to selective absorption from Tokunaga, 2000). This column density is in reasonable concordance with the values reported by Machacek et al. (2004). Machacek et al. (2004) obtained a best-fitted column density of from modelling of the X-ray spectra of the NW bubble. The uncertainties in our extinction estimates are mainly due to variations in the stellar population near the nucleus.

3.2 Maps of extended emission
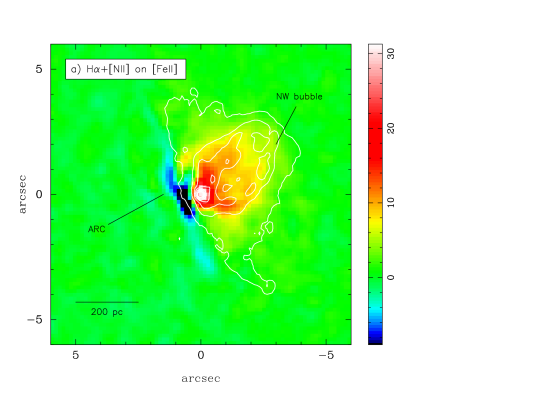
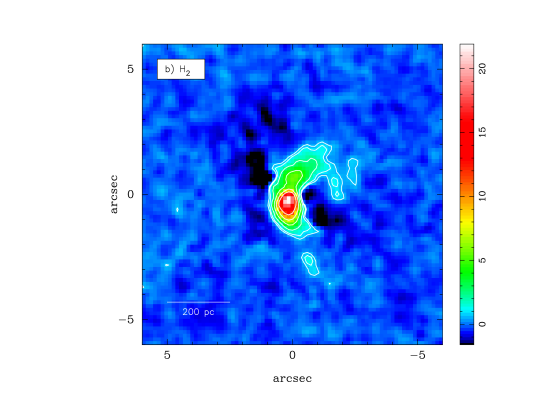
Fig. 5 shows the [Fe ii] m and H2 2.122 m maps of line emission, after subtracting the continuum emission. The fact that there is some negative emission at the base of the NW bubble implies that there is some Pa emission contaminating the continuum image. We are certain that this contamination does not affect the NW extended emission since the spectrum shows no trace of Pa emission at a noise level of 1 W m-2 m-1, when the slit is aligned with the NW bubble (PA -37.55 and PA -57.65, see Fig. 3). In the case of H2 emission we used a scaled version of the broadband image to subtract the continuum. The presence of this strong [Fe ii] emission is consistent with LINER spectroscopic surveys (Larkin et al., 1998), confirming the LINER classification of the NGC 4438’s nuclear region.
The outflow shells are very asymmetric in the optical lines and the radio and X-ray continuum. This provides further evidence that the outflow shells are intrinsically different, and that the observed dissimilarities are not due principally to extinction. In the near-IR we have detected only the NW outflow, with no trace of the south-eastern outflow neither in [Fe ii] nor H2 emission.
3.2.1 [Fe ii] extended emission
The emission-line map shown in Fig. 5a indicates that [Fe ii] emission is coincident with HST H+[N ii] emission-line detected by Kenney & Yale (2002), Chandra X-ray emission reported by Machacek et al. (2004), and the complex radio continuum blob A described by Hummel & Saikia (1991). Emission from a counter-shell in the southeastern (SE) region is clearly detected in H+[N ii] and radio (see Kenney & Yale, 2002), but is much fainter, and is located much further from the nucleus (9″vs 4″) than the much-brighter NW shell. Fig. 5 also reveals a lack of this SE emission. This is because the SE emission is 15 times fainter than the NW component in H+[N ii] (Kenney & Yale, 2002), and even weaker in the X-ray (a factor of 32 lower counts than the NW shell, Machacek et al., 2004). Also, most of the bubble-like emission seen in H+[N ii] corresponds to [N ii] emission since H is about two times weaker than ionized nitrogen emission according to Fig. 1. The bright H ii regions, detected in H+[N ii] emission 8″ toward the south of the nucleus by Kenney & Yale (2002), do not appear neither in Pa or [Fe ii] emission nor in X-ray emission (Machacek et al., 2004).
In AGN galaxies, the [Fe ii] emission is thought to arise from the region radiating narrow line emission (Mouri et al., 2000; Riffel et al., 2006). Such regions in AGN can be produced either as a result of photoionization by a nuclear source, including X-ray heating from the central AGN, or via shock excitation by radio jets (Rodríguez-Ardila et al., 2005; Riffel et al., 2006). The dominant excitation mechanism of the [Fe ii] emission is still under debate. Simpson et al. (1996) have argued that photoionization is the dominant excitation mechanism of [Fe ii] and that shocks by radio jets account for only about 20 per cent of the emission in Seyfert galaxies. Rodríguez-Ardila et al. (2005) have shown that the [Fe ii]/Pa ratio is a good indicator of the relative contribution of photoionization and shocks, since [Fe ii] seems to be more tightly correlated with the radio emission than hydrogen recombination lines in AGN (Simpson et al., 1996).
Radio maps of NGC 4438 presented by Hummel & Saikia (1991) show extended emission, with a shell-like morphology, that is well aligned with H and [N ii] (see figures 3 and 4 in Kenney & Yale, 2002), and therefore also spatially coincident with [Fe ii]. This morphological correlation, along with the non detection of extended Pa emission in our spectra of the NW bubble, may imply that shock excitation by radio jets contributes to an important fraction of the [Fe ii] emission in NGC 4438.
3.2.2 H2 extended emission
Molecular hydrogen emission is present in many host galaxies of AGNs (Rodríguez-Ardila et al., 2005; Riffel et al., 2008, 2009). In the traditional AGN picture, a dusty torus shields the H2 gas from the dissociating AGN radiation field. The H2 emission in NGC 4438 seen in Fig. 5b could also be associated with the central AGN engine but it does not seem to trace the NLR gas (Rodríguez-Ardila et al., 2005). As it can be seen in Fig. 5 the molecular hydrogen is distributed only in the inner few hundred parsecs. The H2 emission is much stronger on the north side of the bubble than on the south side. Fig. 5b shows that most of the molecular hydrogen gas is concentrated toward the circumnuclear region tracing the presence of a possible dusty torus, as in the case of NGC 3727 (Rodríguez-Ardila et al., 2005) or NGC 4051 (Riffel et al., 2008). Also, some H2 emission extending towards the NW bubble can be seen in our observations.
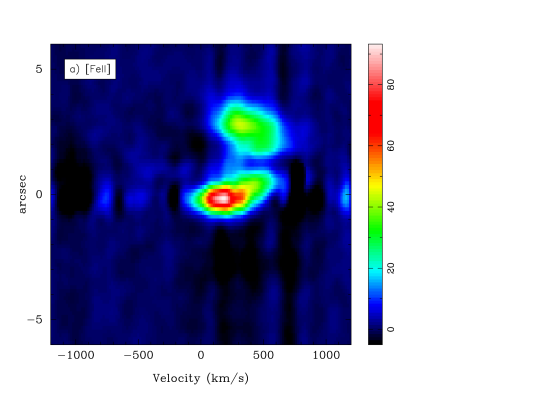
The position-velocity maps depicted in Fig. 6 show that the kinematics of the [Fe ii] and the H2 emitting gas are distinct. Furthermore, the nuclear [Fe ii] line is broader than the H2 emission. As measured from the nuclear spectra shown in Fig. 3, the full-width at half-maximum (FWHM) of the [Fe ii] and H2 2.12 lines are 415 and 270 , respectively. This implies that the [Fe ii] is originating from a kinematically more disturbed gas than the H2 emitting gas, which is in agreement with previous observations of other active galaxies, such as NGC 2110 (Storchi-Bergmann et al., 1999) and NGC 4051 (Riffel et al., 2008). A possible interpretation for this is that the H2 emitting gas is more restricted to the galactic plane, perpendicular to the radio jets, while the [Fe ii] emitting gas extends to higher latitudes from the galactic plane (Riffel et al., 2008; Storchi-Bergmann et al., 1999). These results suggest that the H2 excitation is likely to be dominated by X-ray heating from the central AGN.
3.2.3 Pa extended emission
Fig. 5a also shows a negative arc to the east of the nucleus, perpendicular to the NW shell. In this arc Pa is stronger than the [Fe ii] emission. The distance between the nucleus and the arc is about 0.5″ (35 pc), which is much larger than the values pointed out for the radius of the putative torus. These values are typically smaller than 5 pc (see, for example, Jaffe et al., 2004; Minezaki et al., 2004; Riffel et al., 2009). A possible interpretation for this emission is that it might be associated with circumnuclear star formation in the outer parts of the torus.
The circumnuclear region seen in negative in Fig. 5a has a Pa flux density of 0.5 mJy (integrated over the arc-shaped feature), which corresponds to a Pa luminosity of . If this emission has a starburst origin and we assume solar abundances, and a Salpeter initial mass function with an upper mass cutoff of 100 M⊙, we can estimate the star formation rate (SFR) in the arc feature. Kennicutt (1998) find by extrapolation: , computed for Case B recombination at K. Under these conditions the SFR as a function of Pa luminosity is,
| (1) |
for , where is the emissivity of the line (Storey & Hummer, 1995). The extinction-corrected nuclear star formation rate, using a central extinction of 4 mag, is 1 M⊙ yr-1. It represents an overestimated SFR in the circumnuclear region because this emission could include a contribution from the AGN, due to gas that has been ionised by an accreting black hole. For a global description of the star formation history of NGC 4438 as a whole see Boselli et al. (2005).
3.3 CO-band stellar kinematics

.
NGC 4438 is an inclined large spiral galaxy and its kinematics are undoubtedly difficult to study mainly due to the multiplicity of components that build up spiral galaxies. Moreover, NGC 4438’s highly disturbed morphology and the presence of dust make the inference of kinematic measurements a difficult task. On the positive side, its inclined disc permits a relatively simple identification of the direction which might be expected to define one of the principal axes of the bulge.
CO-band stellar line-of-sight kinematics along the minor axis (PA =
+107.5∘) were derived by fitting the galaxy spectra (see
Fig. 7) with a linear combination of template spectra
chosen from the Gemini Near-IR spectral templates library555see
near-IR resources at:
http://www.gemini.edu/sciops/instruments/. Stellar
templates were rebinned to the spectral resolution of the galaxy
spectra (15.47 pixel-1). The best-fitting parameters were
determined by minimisation in the pixel space using the
penalized pixel fitting method (pPXF) developed by Cappellari & Emsellem (2004),
which required a signal-to-noise ratio of at least 30 in order to get
reliable stellar kinematics. Errors were estimated by using a
Monte-Carlo scheme. They were obtained as the standard deviation of
the kinematical parameters ( and ) for
many realisations ( 300) of the input spectra by adding Gaussian
noise to the best model of the galaxy spectrum. The kinematical study
of the nature of this putative central mass object requires detailed
kinematical model (e.g., Cretton & van den Bosch, 1999; Cappellari et al., 2009). Unfortunately, the
scarcity of our data does not allow us to perform this kind of
analysis.
The results shown in Fig. 8 that NGC 4438 exhibits a strong peak of the line-of-sight velocity dispersion along the minor axis on the centre of the galaxy. The velocity dispersion varies from 100 to 180 in a region of about 3″( 230 pc) in size, which could suggest the presence of a massive central object.
The radius of the sphere of influence of this possible central massive object is just 0.1″, which is considerably smaller than our 0.74″ spatial resolution. Therefore, the enhancement observed in the stellar velocity dispersion curve in the inner 230 pc, where sigma rises from about 100 up to 177 , might be only due to the galaxy bulge potential. However, the sphere of influence is not a hard limit to the influence of a black hole on its host bulge. The influence of the compact object will still be felt at a larger radii but to a lesser extent. Comparing Fig. 8 with the dispersion profiles of other AGNs such as NGC 2549, whose sphere of influence is also 0.1″ (see fig. 4 in Krajnovic et al., 2009), NGC 4438’s velocity dispersion seems to be even steeper in the central couple of arcsec. Therefore, we cannot rule out the presence of a supermassive black hole as responsible for the central enhancement in the velocity dispersion profile of NGC 4438.
4 Surface brightness modelling of NGC 4438
4.1 Model description: general considerations
Does the nucleus seen in our broadband images correspond to a cuspy surface-brightness profile, or is it a point source? Our approach to addressing this question consists in modelling the stellar component by fitting the bulge with a Sérsic law, and the outer region (disc) with an exponential profile. The nuclear component will be a priori represented by a point source at the centre of the galaxy. The main advantage of this approach is that it lets us identify a nucleus over the stellar contribution, whereas a non-decomposition approach would try to reproduce all the profile without giving back information about separate components. The universality of the Sérsic plus exponential disc decomposition allows us to compare with other objects. A detailed description of the surface brightness model, as well as the optimisation algorithm can be found in Appendix B.
| Filter | |||||||||||||||
|---|---|---|---|---|---|---|---|---|---|---|---|---|---|---|---|
| (1) | (2) | (3) | (4) | (5) | (6) | (7) | (8) | (9) | (10) | (11) | (12) | (13) | (14) | (15) | (16) |
| bulge + disc + Sérsic nucleus | |||||||||||||||
| 30 | 0.57 | 1.10 | 68.3 | 1.65 | 3.88 | 71.76 | 13.46 | 42.65 | 1.75 | 572.63 | 27.7 | 7.19 | 6.90 | ||
| 30 | 0.57 | 1.14 | 68.4 | 1.47 | 3.53 | 94.76 | 12.77 | 57.08 | 1.93 | 502.12 | 21.8 | 6.97 | 6.68 | ||
| 30 | 0.57 | 1.13 | 68.7 | 1.52 | 3.49 | 73.39 | 12.86 | 41.34 | 1.71 | 570.92 | 13.0 | 6.66 | 6.75 | ||
| 30 | 0.50 | 1.20 | 68.9 | 0.80 | 2.50 | 23.00 | 8.70 | 30.00 | 1.70 | 0.20 | 154.00 | 7.56 | – | – | |
Notes.– (1) Filter name. (2) Angular size of the fitted region. (3) & (4) generalised ellipticity parameters. (5) Inclination angle in degrees. (6), (7), (8), (9) and (10) are the Sérsic structural parameters for the bulge, and are in units of arcseconds. (11), (12) and (13) are the Sérsic structural parameters for the nuclear source. (14) Total bulge luminosity in units of 1042 erg s -1, calculated from Equation 4. (15) Black hole masses obtained from the -luminosity density relation (Marconi et al., 2003). (16) Black hole masses obtained from the - relation (Graham & Driver, 2007), the errors are estimated using the intrinsic uncertainties in the Graham & Driver (2007) relation. All radii are given in arcsecs, the intensity units are MJy sr-1 and the black hole masses are expressed in M⊙.

4.2 Application to the near-IR ISAAC data
We fitted the nuclear region () of NGC 4438 with parametric functions, as described in Appendix B. The model is the sum of three components: a bulge, a disc and a compact source. The dust features present near the central region have been taken into account by correcting the images using the extinction map (see Fig. 4).
The best-fitting structural parameters for each filter are summarised in Table 3. The best fit is always obtained with close to 1.7 and ″ for the bulge component present at near-IR wavelengths (see nomenclature in Appendix B). The ellipticity and shape of the isophotes are quite constant with increasing radius, with an ellipticity and slightly disky isophotes (, see Appendix B).
Since the integrated flux density presented in Peng et al. (2002) is undefined in the case of ‘disky’ isophotes, we calculated a general expression for the integrated Sérsic profile flux density, in generalised elliptical geometry, including the case of ‘disky’ isophotes (Equation 4). The integrated luminosities of the bulge were computed from the flux densities integrated over all radii.
The result of the two-dimensional fit for the filter is presented in Fig. 9. The left panel shows a cut along the major axis of the galaxy (dashed curve), the model (solid curve) and its components: bulge (dotted curve), disc (dash-dot-dot curve) and the nuclear component (dash-dot curve). That figure shows an excellent agreement between the model and the galaxy’s light distribution. In this central region we can see a conspicuous point-source standing out of the bulge. However, galaxies with power-law profiles may show substantial differences along the major and minor axis, due to isophote twists or ellipticity. For this reason, the right panel shows the surface brightness azimuthally-averaged along a radial elliptical annulus666With the same nomenclature of the left panel, in logarithmic scale; this panel also shows an excellent match between model and data at large radii.
We find evidence for a nuclear point-source unresolved at 0.8″ resolution (see Fig. 9) with and . Its extinction-corrected near-IR integrated fluxes in a 3″ aperture for each band are listed in Table 4. The computed bulge luminosity in each broadband are listed in Table 3. A very similar system was studied by Peng et al. (2002), who found a nuclear point source embedded in NGC 4278, which is an elliptical Seyfert galaxy, also with a LINER nucleus.
4.3 Application to the HST-WFPC2 data
Since the HST band image shows much more structure than the near-IR data (due to extinction being more severe at shorter wavelengths), we followed two different approaches in order to perform the photometry of the nucleus.777We did not model the and band images because the few pixels covering the nucleus were severely saturated. The first approach was similar to the one used for the near-IR data, i.e., fitting a Sérsic bulge plus an exponential disc and a nuclear source. The nuclear source was represented by an extra Sérsic profile, since the central source in the -band image is clearly resolved. The result was a less prominent bulge in the optical than in the near-IR. In the optical case the surface brightness is well represented by a bulge with and a compact source well-fitted by a steeper Sérsic component with and ″, i.e,. a resolved nuclear source of approximately pc in size. An value of 0.8 seems very low for a bulge of a spiral and it may not represent the real bulge surface distribution, this is probably because of the severe obscuring effect of dust at those wavelengths.
The second approach consisted of modelling the structure of the central in the -band image with a base of legendre polynomials and , both at order , in order to get accurate photometry of the nucleus. We added a resolved compact-source, represented by convolved with a gaussian of . The free parameters were the legendre coefficients, the centroid of the compact-source , the FWHM of the nuclear source, and the central intensity . The result was similar to the near-IR case: a resolved compact source with ″, equivalent to , appears to stand out of the nuclear region (see Table 4). This approach is fully consistent with the first approach explained above, which also yields a compact source with ″ since .
The difference between the near-IR and optical parameter values can be explained mainly by the fact that the extinction is more severe in the optical than in the near-IR. Also, in spiral galaxies the bulge is mainly composed of late-type stars, hence yielding a more prominent bulge in the near-IR than in the optical. Photometry of the extracted nuclear source yields mag.
| Filter name | Central | |||
|---|---|---|---|---|
| (m) | (mJy) | (mag) | ( erg s-1) | |
| 1.25 | ||||
| 1.65 | ||||
| 2.16 |
aThe specific luminosity was computed as , at a distance Mpc.
5 Discussion
5.1 Spectral energy distribution
NGC 4438 is classified as a LINER 1.9 or a “dwarf” Seyfert 2 galaxy on the basis of broad H emission (Ho et al., 1997; Kenney & Yale, 2002). We constructed the NGC 4438 SED of the non-stellar component using data from radio ( Hz) to hard X-rays ( Hz).
The near-IR data () were obtained from the surface brightness decomposition presented in Section 4. The AGN component photometry is given in Table 4, and it was computed integrating the residual image over a circular aperture of radius 4.5″ centred on the nucleus.
The thermal infrared () photometry of the nuclear source was extracted over a 4.5″ circular aperture in the TIMMI2 NB 11.9 m image (see Fig. 10). The result was a mid-IR flux density of Jy. Instead of a compact nuclear source, Fig. 10 shows that the thermal emission is spatially extended over 3.5″, which at the Virgo distance corresponds to 270 pc. Thus, the nucleus and a circumnuclear dusty arc dominate the mid-IR continuum emission.
The soft () and hard () X-ray counterparts were obtained from Chandra data reported in Table 4 of Machacek et al. (2004), without any absorption correction. The radio continumm () data were obtained from Hummel & Saikia (1991). This measurement was computed by integrating the extended emission over a rectangle of sides . It gives mJy. This value corresponds to an upper limit since the nucleus was not clearly detected, and it may contain emission from the NW and SE outflows.
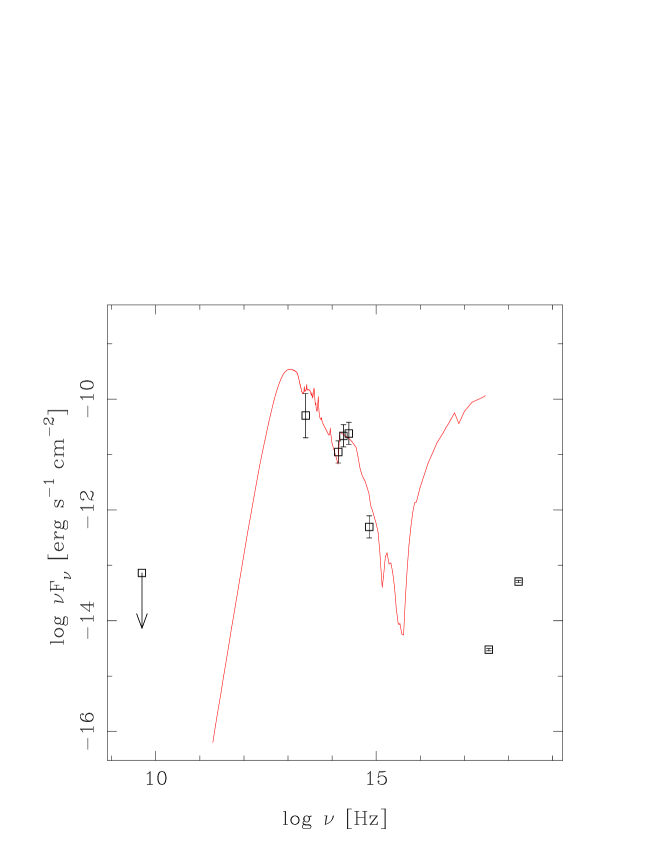
Fig. 11 shows the SED of NGC 4438. The solid line is a simple theoretical SED taken from Siebenmorgen et al. (2004), which is based on three parameters: a dusty torus with radius 125 pc, an average visual extinction of 4 magnitudes and a compact source with bolometric luminosity , which does not represent NGC 4438’s bolometric luminosity because of discrepancy between with the model in the X-ray region of the spectrum. The AGN is modelled as a power law with monochromatic luminosity in the wavelength range from 10 Å to 2 m. The dust is composed of carbon and silicate grains with radii between 300 and 2400 Å, graphites of radius 10 Å and small and large PAH components. Fig. 11 also shows a good match between both near-IR and visible data with the theoretical SED. However, this model is unable to fit the X-ray data. The sub-Eddington X-ray emission (where is the Eddington luminosity for a black hole with mass 107 M⊙) in both, the soft and hard bands, suggests that the accretion flows are advection-dominated (Narayan et al., 1996; Kenney & Yale, 2002; Machacek et al., 2004).
5.2 Outflows and energetics
From UV observations, Boselli et al. (2005) found that the star formation in the main body of NGC 4438 is very weak, and is mainly composed of old stars, without signs of recent starbursts. Our estimation of the visual extinction toward the nucleus of corresponds to an extinction of 3.3 mag at H (Cardelli et al., 1989), implying an extinction-corrected SFR of 0.08 M⊙ yr-1 for the nucleus. On the other hand, the SFRs inferred from the extinction-corrected Pa emission is 1 M⊙ yr-1 and corresponds to the circumnuclear region seen as an arc in Fig. 5a. These two estimates correspond to upper limits since we do not know how much of the line emission arises from H ii regions near the nucleus.
The velocity of the northwestern outflow can be estimated from the spectrum shown in Fig. 6a. The width of the line contains contributions from both random motions and bulk velocity. The FWHM of the [Fe ii] line at 3″– 4″ from the nucleus, extracted from a 2″ aperture is measured to be 350 while the mean [Fe ii] velocity 2″ from the nucleus (at the bottom of distinc blob) is closer to 500 (see Fig. 6). In fact, the mean velocity as a function of distance from the nucleus decreases from 500 at 2″ to 350 at 2.5″. This seems consistent with an expanding bubble model since if the observed expansion velocity at the outer edge of the bubble corresponds to a lower line-of-sight velocity than at the middle of the bubble, due to projection effects. Hence we adopt a speed of 500 as a reasonable value for the expansion velocity, which is a faster outflow than the one assumed by Kenney & Yale (2002) of 300 . Kenney & Yale (2002) calculated the mass of ionised gas from the H luminosity, which corresponds to 3.5 M⊙ for an electron density of 420 cm-3 (measured from the [S ii] 6716/6731 doublet ratio). This new estimate of the outflow velocity increments the kinetic energy by a factor of 3, yielding an injected kinetic energy into the halo of the galaxy of erg. This is a lower limit since only ionised gas is included in the calculation and we know that there is molecular gas also present in the NW bubble (see Fig. 5b). The large amount of kinetic energy carried by the northwestern outflow along with the weak nuclear star formation, suggests that an AGN central engine is responsible for much of the optical and near-IR line and continuum emission, and not a compact starburst (Kenney & Yale, 2002).
5.3 NGC 4438 colours
The near-infrared colours of the nucleus of NGC 4438 mainly have contributions from: a bulge of late-type stars, a non-stellar nuclear source, re-radiation from hot dust, and reddening (Kotilainen et al., 1992). We measured the colours of each surface brightness component in an aperture of 3″, in order to compare with other works (there was no substantial variation using an aperture of ). Normal (inactive) spiral galaxies have colours of and (Kotilainen et al., 1992; Fischer et al., 2006). The stellar colours of NGC 4438, and , are clearly in the region occupied by normal spiral nuclei. As expected for LINERs and Seyfert 1 galaxies (see two-colour diagrams in Kotilainen, 1993; Forbes et al., 1992) the non-stellar colour of NGC 4438 is located in between the regions of AGN and inactive galaxies, shifting the colours according to a reddened vector of . Therefore, the near-IR stellar colours do not show evidence for starburst, in agreement with the UV observation of Boselli et al. (2005). This seems to be inconsistent with the relatively high SFR estimated from Pa emission for the circumnuclear region (see Section 3.2.3), which would imply that this emission is not due to star formation but to the densest gas near the nucleus being photoionised by the central AGN.
5.4 Black hole mass
Ferrarese et al. (2006) pointed out that a more or less a constant fraction of a galaxy bulge mass ends up as a central massive object, either a stellar nucleus or a supermassive black hole. The evidence discussed in Section 3.3 could suggest the presence of a black hole, although the radius of its sphere of influence 0.1″ is considerably smaller than our 0.74″ resolution. Ferrarese & Merritt (2000) found that there is a tight correlation between one of the fundamental properties of a galactic bulge, its velocity dispersion , with the mass of its supermassive black holes. Independently, the same correlation was found by Gebhardt et al. (2000), in the same year. For NGC 4438 we have calculated the luminosity weighted velocity dispersion to be in the central 3 arcsec over the minor-axis, by using the kinematical data (see Fig. 8) and by assuming an axial ratio (see Table 3). The - relation using this value yields a mass for the central black hole of .
Recently, Graham & Driver (2007) suggested that there is a fundamental correlation between the Sérsic index , which is a measure of the concentration within the bulge, and the black hole mass. The physical interpretation is that steeper and more concentrated bulges (larger ) host more massive black holes. They found a - log-quadratic relation using updated black hole masses and power-law indexes. This relation was computed from a sample of 27 galaxies with black hole mass determination from the correlation between stellar velocity dispersion and virial bulge mass. The Sérsic indexes in Graham & Driver (2007) were determined by performing a surface brightness decomposition similar to the one used in this work. The - relation is as tight as the well known correlation between the stellar velocity dispersion and the black hole mass (Graham & Driver, 2007).
We found a bulge well-represented by a Sérsic index . This index implies a black hole with mass for NGC 4438 (for the estimation in each broadband see column (16) of Table 3). The errors in the black hole mass were estimated using the intrinsic uncertainties in the Graham & Driver (2007) relation. We did not estimate a black hole mass from the bulge parameters inferred from the -band image, because the bulge is highly obscured by dust. Another estimator of is the near-IR luminosity (Marconi et al., 2003), which provides a - relation tighter and less sensitive to extinction than those in the optical. Column (15) of Table 3 lists the computed black hole masses using the near-IR luminosity. It can be seen that these methods yield results in reasonable good agreement.
6 Conclusions
In this paper we have presented a study of the nuclear source and central environment of the galaxy NGC 4438, based on the results of near-infrared ISAAC VLT/ANTU imaging and spectroscopy. The main results of this work are listed below.
-
1.
We have found extended [Fe ii] emission coincident with the NW bubble seen in radio continuum, X-rays and optical emission. The morphological correlation between [Fe ii] and previous radio observations, along with the absence of Pa in our spectra of the NW bubble, suggest that shocks (perhaps driven by a radio jet) may be an important source of excitation of [Fe ii] emission.
-
2.
Based on our newly (upwardly) revised estimated of the expansion velocity of the bubble, 500 , and the nuclear star formation rate estimated from its emission in H, which could be up to 0.08 M⊙ yr-1, corrected by the nuclear extinction, we have addressed the question whether the outflow has an AGN or a starburst origin. The large kinetic energy associated with the outflowing gas, 1054 erg, along with the weak star formation suggest that an AGN is more likely to power the outflow.
-
3.
The H2 emission map shows strong molecular hydrogen emission around the nucleus which might indicate the presence of a molecular torus.
-
4.
Our position-velocity maps showed that the gas emitting H2 is kinematically distinct from the gas radiating [Fe ii] emission. Moreover, the nuclear [Fe ii] line (FWHM 415 ) is broader than the nuclear H2 emission (FWHM 270 ), implying that the [Fe ii] gas is kinematically more disturbed than the H2 gas. Furthermore, the molecular gas seems to be more restricted to the galactic plane, while [Fe ii] extends to higher latitudes from the plane of the galaxy. These results suggest that X-ray heating from a central AGN may be responsible for the excitation of H2.
-
5.
We have applied a two-dimensional surface brightness decomposition to the central 30 arcsec of NGC 4438. The best-fitted model consists of three components: a Sérsic bulge with power-law index and ″, an exponential disc with ″, and a compact nuclear source, resolved in HST with ″. The model was evaluated in a generalised elliptical surface with discy isophotes and an inclination angle of .
-
6.
We have constructed the spectral energy distribution of the nucleus of NGC 4438. It is in agreement with a theoretical SED of an AGN obscured by 4 magnitudes, although the X-rays are underluminous by 6 orders of magnitude (compared to the Eddington luminosity for a 107 M⊙ black hole), which can be explained on the basis of advection-dominated accretion flows.
-
7.
We have derived CO-band stellar line-of-sight kinematics along the minor axis of the galaxy. The line-of-sight velocity dispersion showed a strong peak on the centre of the galaxy of .
-
8.
A black hole mass of for the nuclear point source could be inferred from the bulge luminosity, the central velocity dispersion and the Sérsic index .
-
9.
We have carried out near-IR photometry of the nucleus, finding a point source unresolved by ISAAC at 0.8″ resolution with and . This detection is further evidence that the central source is associated with an AGN rather than a starburst engine.
-
10.
We report the brightnesses and colours of the various components in the central region. The dereddened stellar colors (bulge and disk) in the nuclear region are typical of an inactive spiral galaxy, and show no evidence for a recent starburst. This is further evidence that significant star formation was not triggered in the recent collision with M86.
Acknowledgements
We thank the referee for valuable comments which helped to improve this paper. We are very grateful to Lowell Tacconi-Garman for providing calibration data and useful comments on the reduction of the ISAAC data. We thank Andrew Baker and Eduardo Hardy for valuable input to the proposal. We would like to thank Katherine Blundell for helpful comments on the manuscript. S.P. acknowledge generous support from STFC and CONICYT. S.C. acknowledges support from FONDECYT grant 1060827, and from the Chilean Center for Astrophysics FONDAP 15010003. Thanks also to Andrés Jordan for the PDL::Minuit package. This research also used data products from the Canadian Astronomy Data Centre operated by the National Research Council of Canada with the support of the Canadian Space Agency.
References
- Amico et al. (2001) Amico, P., et al., eds., 2001, ISAAC–SW Data Reduction Guide, Version 1.5 (Garching: ESO)
- Athanassoula et al. (1990) Athanassoula, E., Morin, S., Wozniak, H., Puy, D., Pierce, M. J., Lombard, J., & Bosma, A. 1990, MNRAS, 245, 130–139
- Boselli et al. (2005) Boselli, A., et al. 2005, ApJL, 623, L13
- Cappellari & Emsellem (2004) Cappellari, M., & Emsellem, E. 2004, PASP, 116, 138
- Cappellari et al. (2009) Cappellari, M., Neumayer, N., Reunanen, J., van der Werf, P. P., de Zeeuw, P. T., & Rix, H.-W. 2009, MNRAS, 394, 660
- Cardelli et al. (1989) Cardelli, J. A., Clayton, G. C., & Mathis, J. S. 1989, ApJ, 345, 245
- Cretton & van den Bosch (1999) Cretton, N., & van den Bosch, F. C. 1999, ApJ, 514, 704
- Ferrarese & Merritt (2000) Ferrarese, L., & Merritt, D. 2000, ApJL, 539, L9
- Ferrarese et al. (2006) Ferrarese, L., et al. 2006, ApJL, 644, L21
- Fischer et al. (2006) Fischer, S., Iserlohe, C., Zuther, J., Bertram, T., Straubmeier, C., Schodel, R., Eckart, A., 2006, A&A, 452, 827
- Forbes et al. (1992) Forbes, D. A., Ward, M, J., DePoy, D. L., Boisson, C., & M. S., 1992, MNRAS, 254, 509–524
- Gebhardt et al. (2000) Gebhardt, K., et al. 2000, ApJL, 539, L13
- Glazebrook et al. (1997) The Perl Data Language, Glazebrook K., Economou F., The Perl Journal, 1997, Issue 5, 5 - also reprinted in Dr Dobbs Journal, Fall 1997 issue
- Graham & Driver (2007) Graham, A. W., & Driver, S. P. 2007, ApJ, 655, 77
- Hawarden et al. (2000) Hawarden, T. G., Leggett, S. K., Letawsky, M. B., Ballantyne, D. R. & Casali, M. 2000, MNRAS
- Heckman (1980) Heckman, T. M., 1980, A&A, 87, 152–164
- Ho et al. (1997) Ho, L. C., Filippenko, A. V., & Sargent, W. L. W., 1997, ApJS, 112, 315
- Ho et al. (2003) Ho, L. C., Filippenko, A. V., & Sargent, W. L. W., 2003, ApJ, 583:159–177
- Hummel & Saikia (1991) Hummel, E., & Saikia, D. J. 1991, A&A, 249, 43
- Jaffe et al. (2004) Jaffe, W., et al. 2004, Nature, 429, 47
- Jogee et al. (1999) Jogee, S., Kenney, J. D. P., & Smith, B. J. 1999, ApJ, 526, 665
- Kenney & Yale (2002) Kenney, J. D. & Yale, E. E., 2002, ApJ, 567:865–874
- Kenney et al. (2008) Kenney, J. D. P., Tal, T., Crowl, H. H., Feldmeier, J., & Jacoby, G. H. 2008, ApJL, 687, L69
- Kennicutt (1998) Kennicutt, R. C., 1998, ARA&A, 36:189–231
- Kotilainen et al. (1992) Kotilainen, J. K., Ward, M. J., Boisson, C., DePoy, D. L., & smith, M. G., 1992, MNRAS, 256,149–165
- Kotilainen (1993) Kotilainen, J. K., 1992, Astrophysics and Space Science, 205:107–112
- Krajnovic et al. (2009) Krajnovic, D., McDermid, R. M., Cappellari, M., & Davies, R. L. 2009, arXiv:0907.3748
- Larkin et al. (1998) Larkin, J. E., Armus, L., Knop, R. A., Soifer, B. T., & Matthews, K. 1998, ApJ, 114:59–72
- Lehner et al. (1999) Lehner et al. 1999, ApJ, 523, 575
- Levenson et al. (2003) Levenson, N. A., Weaver, K. A., Heckman, T. M., Awaki, H., & Terashima, Y. ApJ, 602:135–147
- Machacek et al. (2004) Machacek, M. E., Jones, C., & Forman, W. R., 2004, ApJ, 600:183–200
- Marconi et al. (2003) Marconi, A., & Hunt, L. K., 2003, ApJ, 589:L21–L24
- Minezaki et al. (2004) Minezaki, T., Yoshii, Y., Kobayashi, Y., Enya, K., Suganuma, M., Tomita, H., Aoki, T., & Peterson, B. A. 2004, ApJL, 600, L35
- Moorwood et al. (1998) Moorwood, A. et al. 1998, The Messenger 94, 7.
- Mouri et al. (2000) Mouri, H., Kawara, K., & Taniguchi, Y., 2000 ApJ, 528:186–200
- Narayan et al. (1996) Narayan, R., McClintock, J., and Yi, I., 1996, ApJ, 457:821–833
- Osterbrock & Ferland (2005) Osterbrock, D. E., & Ferland, G. J., 2005, Astrophysics of Gaseous Nebulae and Active Galactic Nuclei 2nd ed. (California: University Science Books)
- Peng et al. (2002) Peng, C. Y., Ho, L. C., Impey, C. D. & Rix, H. 2002, AJ, 124:266–293
- Riffel et al. (2006) Riffel, R. A., Storchi-Bergmann, T., Winge, C., & Barbosa, F. K. B. 2006, MNRAS, 373, 2
- Riffel et al. (2008) Riffel, R. A., Storchi-Bergmann, T., Winge, C., McGregor, P. J., Beck, T., & Schmitt, H. 2008, MNRAS, 385, 1129
- Riffel et al. (2009) Riffel, R. A., Storchi-Bergmann, T., & McGregor, P. J. 2009, ApJ, 698, 1767
- Rodríguez-Ardila et al. (2005) Rodríguez-Ardila, A., Riffel, R., & Pastoriza, M. G. 2005, MNRAS, 364, 1041
- Schlegel et al. (1998) Schlegel, D. J., Finkbeiner, D, P., & Davis, M. 1998, ApJ, 500:525–523
- Sérsic (1968) Sérsic, J. L., 1968, Atlas de Galaxias Australes. Observatorio Astronómico de Córdoba.
- Siebenmorgen et al. (2004) Siebenmorgen, R., Freudling, W., Krügel, E., and Hass, M., 2004, A&A 421: 129–145
- Simpson et al. (1996) Simpson, C., Forbes, D. A., Baker, A. C., & Ward, M. J. 1996, MNRAS, 283, 777
- Skrutskie et al. (2006) Skrutskie M. F., et al. 2006, AJ, 131, 1163
- Storchi-Bergmann et al. (1999) Storchi-Bergmann, T., Winge, C., Ward, M. J., & Wilson, A. S. 1999, MNRAS, 304, 35
- Storey & Hummer (1995) Storey, P. J., & Hummer, D. G., 1995, MNRAS, 272, 41
- Tokunaga (2000) Allen’s astrophysical quantities: Infrared Astronomy, 2000, Springer/Verlag
- Veilleux et al. (1994) Veilleux et al. 1994, ApJ, 433, 48
- Vollmer et al. (2009) Vollmer, B., Soida, M., Chung, A., Chemin, L., Braine, J., Boselli, A., & Beck, R. 2009, A&A, 496, 669
Appendix A Data Reduction
In this Appendix we outline the procedures used in the data reduction process, which included bias subtraction, flat fielding, correction of detector defects, cosmic rays removal, and overlapping of the dithered frames. The detector has a jump between the two halves of the array, caused by imperfect removing of the zero level offset due to variations in the bias level (Amico et al., 2001, see below).
Flat fielding and bad pixels correction.– The twilight flat field images provided by the observatory were sometimes affected by spurious large scale gradients (specially in the -band). This could be caused by bad ambient conditions, making non-linear effects important (L. Tacconi, private communication). We thus divided the flat field by a smooth approximation of the large scale variations. The smooth flat field was generated by taking the median of the detector image along the -axis, excluding the outer columns, which generated a vector column representative of the large scale variation.
Sky and bias residual subtraction.– This is the most important step in the reduction. The sky was obtained immediately after the last object image, pointing the telescope towards a blank region of the sky. The subtraction of the dark current was one of the most important problems to solve, because the dark current is known to be unstable in ISAAC (Amico et al., 2001). The bias level of the detector is a function of the detector integration time and its illumination. The bias level also varies in time, and is more pronounced where the readouts start (i.e., rows 1, 2, and rows 513, 514). Due to this variation we did not apply the dark subtraction, which yielded images containing noticeable bias residuals. We removed these bias artifacts by performing a linear extrapolation along the array. The procedure was:
-
1.
to isolate regions devoid of extended emission,
-
2.
then, to smooth the regions with a median filter and collapse them along the -axis to obtain single bias residual columns,
-
3.
finally, perform a linear interpolation between the collapsed columns to the entire detector array, generating a smooth bias image.
Dithering.– The shifts in the dithered frames were
obtained by maximizing the covariance between the images as a function
of astrometric offset (at a sub pixel level).
Photometric calibration
We acquired a dedicated set of relatively faint standards from the UKIRT telescope system (Hawarden et al., 2000), specifically the stars FS6, FS20 (, filters) and FS132 ( filter). The three standard star observations share a similar dithering pattern as the object observations, and they were reduced following the procedure explained above. The calibration was based on aperture photometry (aperture radius 4.4″). Table 1 summarises the computed zero points. We calibrated the narrowband filters using the corresponding broadband calibration (as recommended in the ISAAC manual, Amico et al., 2001). No corrections for atmospheric extinction were required because the data were obtained at similar airmass ().
Foreground Galactic extinction obtained from the Schlegel et al. (1998) maps of dust emission, amounts to . Table 1 summarises the magnitudes of extinction for each bandpass, computed using and the extinction laws of Cardelli et al. (1989).
Photometric uncertainties were estimated as . The first terms is the rms noise and the second term takes into account the calibration accuracy (10 per cent).
We verified the measured fluxes in our calibrated images using 2MASS. The result was a per cent difference between 2MASS photometry and our photometry of the standard stars named above, and differences of 12, 14 and 10 per cent for , respectively for NGC 4438. This could be caused by an overestimation of the sky level in our reduction procedure.
Appendix B Surface brightness profile model
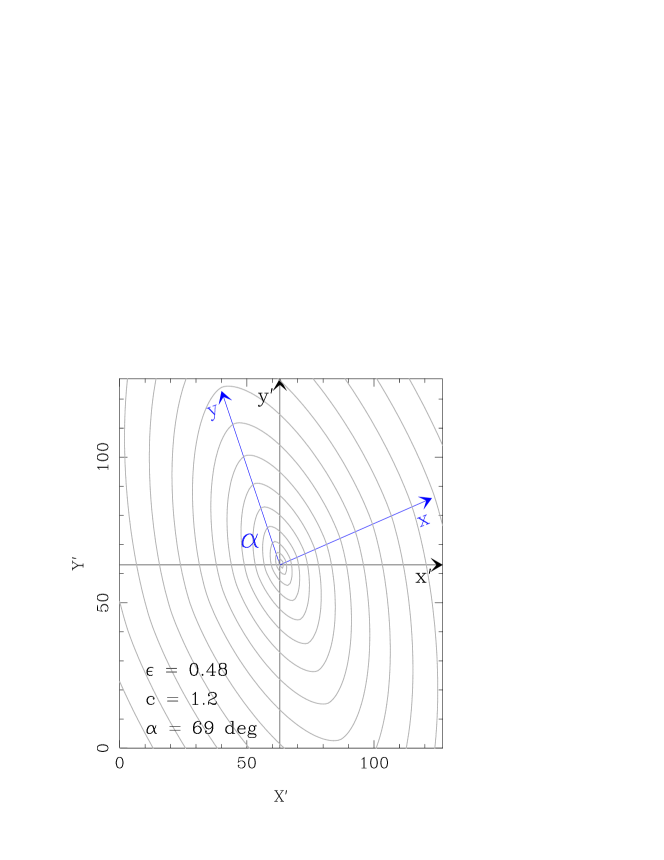
This Appendix gives a detailed description of the surface brightness model used to fit the NGC 4438 light describution. Our conventions and coordinate systems are shown in Fig. 12. In order to obtain an accurate fit we constructed an elliptical polar-grid, with the coordinate axis defined by Athanassoula et al. (1990), as follows.
| (2) |
where is related to the ellipticity by . is the parameter which allows us to model the generalised elliptical shape: gives box-like ellipses (boxiness), while for we obtain shapes approaching to diamonds (diskiness). In general, galaxies are inclined at an angle , so we need to rotate our - and -axis using a simple transform; , where is the rotation matrix (see Fig. 12). The angle is defined with respect to the image pixel coordinate system, increasing counterclockwise.
The Sérsic (1968) light profile is very useful for modelling elliptical galaxies and steep spiral bulges. It has the form:
| (3) |
where is the generalised elliptical radius (defined in Equation 2), is the intensity at the effective radius and is defined such that where and are the complete and incomplete gamma functions, respectively. Analytical expressions which approximate the value of give , for . Half of the total luminosity predicted by the profile comes from . The power-law index describes the shape of the light-profile. To calculate the total flux of the Sérsic profile, we integrated over a generalised elliptical radius . It gives:
| (4) |
where . The function is given by
| (5) |
This expression accounts for the generalised-elliptical shape. When is greater than 2 (‘disky’ isophotes) the integral can be written as a beta function of the parameter (see Equation 8 in Peng et al., 2002).
Since NGC 4438 is a spiral galaxy, an exponential law is needed to fit the galactic disc. It has the form , where the parameter is called the disc scale-length, is the peak of luminosity, and is the elliptical radius (Equation 2).
A nuclear source can be added at the centre of the galaxy, representing the AGN component, and it may be either a delta function (for a point source) or a Sérsic component (for resolved sources). Finally, the model takes the form:
| (6) |
where is the surface brightness at a radius (defined in Equation 2), represents the nuclear source, and represent the bulge and disc components, respectively. The symbol is the convolution operator.
The set of free parameters are: the nuclear source centroid (), those related to the elliptical geometry: , , and ; the Sérsic profile power-law index , the effective radius , the effective intensity ; the exponential disc scale-length and central luminosity ; the nuclear source parameters: , and (Sérsic case) or the central flux density (delta function case).
We found the best fitting solution by performing a minimisation. The main steps of the two-dimensional fitting are roughly summarised as follows:
-
1.
Select a sub-image, centred on the nucleus. Correct by extinction.
-
2.
Generate a model image based on the initial (or new) conditions.
-
3.
Account for the telescope and atmospheric seeing by convolving the model with the characteristic PSF.
-
4.
Evaluate .
-
5.
Iterate from step 2 until convergence is reached.
-
6.
Generate output images: residual image, original galaxy image and model.