Coulomb Dissociation of 15C and Radiative Neutron Capture on 14C
Abstract
The semiclassical, dynamical description of diffraction dissociation of weakly bound nuclei is applied to analyze the decay-energy spectra of 15C that have been measured at 68 MeV/nucleon on a Pb target. The optical potentials that are used to describe the nuclear interaction of 15C with the target nucleus are realistic because the fits to the two measured spectra, one with a small and one with a very large acceptance angle, are consistent and of similar quality. The cross section for the radiative neutron capture on 14C to the 1/2+ ground state of 15C is deduced from the analysis. When combined with an estimated contribution from the capture to the 5/2+ excited state of 15C, an excellent agreement with a recent direct capture measurement is achieved.
pacs:
PACS number(s): 25.40.Lw, 25.60.Gc, 25.70.De, 27.20.+nI Introduction
The decay-energy spectrum for the breakup of 15C on a Pb target was first reported in Ref. nakac15a . The data were recently analyzed by CDCC (continuum discretized coupled-channels) calculations nunes08 , and it was demonstrated that the measured spectrum is consistent with measurements of the radiative neutron capture rate on 14C reifarth . The final results of the Coulomb dissociation experiment have now been published nakac15b . They include the decay-energy spectrum for all events and a spectrum for events at forward angles.
It is of interest to investigate whether the two spectra obtained in Ref. nakac15b can be reproduced by a single, consistent theoretical description, because the forward angle measurement is primarily due to Coulomb dissociation, whereas events at large scattering angles are influenced by nuclear processes. A more general issue is whether the cross section for the radiative neutron capture on 14C that can be deduced from the Coulomb dissociation experiment is consistent with the direct capture measurement of Ref. reifarth .
The method that will be used to analyze the decay-energy spectra of 15C is the semiclassical, dynamical description, where the relative motion of the projectile and target follows a classical Coulomb trajectory. The breakup reaction, 15CC+n, is calculated quantum mechanically by solving the time-dependent Schrödinger equation for the relative motion of the valence nucleon and the core fragment, in the time-dependent Coulomb and nuclear fields of the target nucleus.
The semiclassical model used here was first introduced in Ref. ebb95 as a three-dimensional generalization of a previous two-dimensional model bb94 . It has been applied in studies of the Coulomb dissociation of 8B b8a ; b8c and 17Ff17 nuclei, and it has provided a qualitative understanding of some of the phenomena that can occur. For example, intermediate energy Coulomb dissociation experiments are commonly analyzed in first-order perturbation theory in terms of E1 transitions using the so-called far-field approximation and straight line trajectories WA-NPA . These approximations are rather poor for the Coulomb disassociation of weakly bound proton+core systems, partly because the far-field approximation breaks down and partly because E2 transitions and higher-order processes cannot be ignored b8c ; f17 . As a consequence, a discrepancy of 15% was observed between the measured radiative capture rate of protons on 7Be and the rate inferred from Coulomb dissociation experiments jung . The discrepancy was later resolved by CDCC calculations Ogata06 that included the effects discussed above, in addition to the nuclear induced breakup of 8B.
It is surprising that the discrepancy between the direct measurement of the cross section for the radiative neutron capture on 14C reifarth and the first-order analysis of the 15C Coulomb dissociation experiment nakac15b is also of the order of 15%. Naively, one would expect that the analysis of the measured decay-energy spectra in terms of first-order perturbation theory nakac15b would result in a much better agreement with the direct capture measurement because the far-field approximation for Coulomb excitation is well justified and the E2 strength is very weak for a neutron halo nucleus. Consequently, the dynamic polarization effect, which is caused by an interplay of E1 and E2 transitions volya , is much weaker for a neutron than for a proton halo nucleus. It is therefore of interest to analyze the measured decay-energy within the semiclassical, dynamical description, in order to see whether the discrepancy with the radiative capture measurement can be reduced.
Part of the explanation for the 15% discrepancy is that the measured neutron capture rate, in addition to the direct capture to the ground state of 15C, also includes a small branch to the excited state, whereas the Coulomb dissociation experiment can only provide information about the capture to the ground state. Unfortunately, the cross sections for the capture to the ground state and the excited state have not been measured separately. In this work the contribution from the branch is estimated to be of the order of 4%, so the issue is what causes the remaining 11% discrepancy.
Details of the structure input and some results of first-order perturbation theory are presented in the next section. The basic ingredients of the semiclassical method are summarized in Sect. III. The convergence of the calculations and the analysis of the new decay-energy spectra is presented in Sect. IV. The results are used in Sect. V to infer the cross section for the radiative neutron capture on 14C. The conclusions are presented in Sect. VI.
II Structure models of 15C
The single-particle structure associated with the valence neutron in 15C is simulated by a Woods-Saxon (WS) potential. The depth is adjusted for each partial wave so that certain properties of 15C are reproduced. The parameters of the model are shown in Table I. The radius and diffuseness, =2.946 fm and =0.5 fm, were actually determined in a previous work terry by simulating the mean-field potential of a realistic Hartree-Fock calculation. The depth of the s-wave potential, , was adjusted to reproduce the 1.218 MeV neutron separation energy of the ground state.
| (fm) | (fm) | (MeV) | (MeV) | (MeV) | (MeV) |
|---|---|---|---|---|---|
| 2.946 | 0.5 | 55.36 | 55.36 | 52.03 | 4.86 |
The depth of the p-wave potential, , is assumed to be the same as the depth of the s-wave potential. This choice was made deliberately in Ref. nakac15b , in order not to violate Siegert’s theorem which allows one to use charge densities instead of current densities when calculating electromagnetic matrix elements (see, e. g., Ref. greiner ). The depth of the WS potential for higher, odd-parity partial waves is chosen in the following to be the same as for the p-wave potential.
No choice was made in Ref. nakac15b for the d-wave potential because it was not needed in the first-order calculations of dipole excitations performed there. The depth shown in Table I has been determined in this work so that the 0.478 MeV binding energy of the 5/2+ excited state of 15C is reproduced. Combined with the spin-orbit interaction, this implies that the resonance is located in close vicinity of the known resonance at 3.56 MeV.
II.1 First-order Coulomb excitation
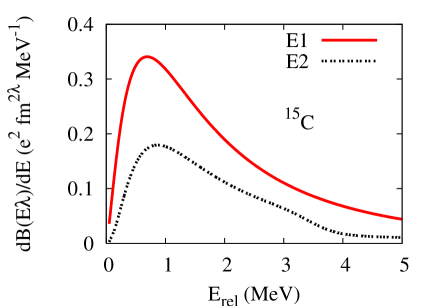
The E1 and E2 strength distributions for 15C that one obtains are illustrated in Fig. 1 as functions of the final state relative energy of the neutron and the 14C fragment. The E2 response has a shoulder between 3 and 4 MeV which is a consequence of the 3/2+ resonance. The E2 response does not play any practical role in the Coulomb dissociation of 15C because the E2 excitation probability is more than three orders of magnitude smaller than the E1 excitation probability. However, the resonance does play a role in the nuclear induced breakup.
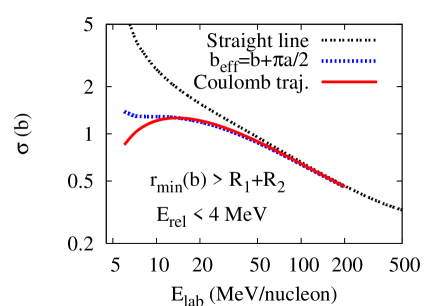
Coulomb dissociation experiments at intermediate and high energies are usually analyzed using the first-order perturbation theory that is based on straight-line trajectories WA-NPA . A simple correction for Coulomb trajectories is often made in this description. It consists of replacing the minimum impact parameter for a given measurement by the effective minimum impact parameter , where is half the collision diameter. This is actually a very good approximation for first-order dipole excitations. This can be seen in Fig. 2 by comparing the middle dashed curve (labeled ) to the solid curve, which is the first-order Coulomb dissociation cross section obtained using exact Coulomb trajectories as described in Ref. coul .
The calculations shown in Fig. 2 were based on the dipole response shown in Fig. 1 and included relative energies up to 4 MeV and all impact parameters for which the distance of closest approach is larger than the sum of the radii, = 1.2. The top dashed curve is the cross section for straight-line trajectories. This is a poor approximation for energies below 60 MeV/nucleon. The corrected straight-line trajectory approximation (middle curve) is in much better agreement with the calculation that is based on exact Coulomb trajectories (the solid curve). At 68 MeV/nucleon, the two calculations agree within 1%, whereas the pure straight-line trajectory calculation (the upper dashed curve) is about 5% higher. These results show that the corrected straight-line trajectory approximation, which was used in the experimental analysis nakac15b , is well-justified, provided higher-order and nuclear processes can be ignored.
III The semiclassical method
The relative motion of projectile and target is assumed to follow a classical Coulomb trajectory in the semiclassical description of breakup reactions. The trajectory includes relativistic effects, the most important being the kinematics and the determination of the velocity from the beam energy. These aspects are discussed in detail in Ref. coul .
The relative motion of the valence neutron and the 14C core is calculated by solving the time-dependent Schrödinger equation ebb95 . The two-body wave function , which has the ground state as initial condition, is expanded on the angular momentum eigen states ,
| (1) |
The upper limit Lmax is the maximum orbital angular momentum of the expansion. The radial wave functions are calculated on a radial grid out to 100 fm, with a grid size of 0.1 fm. The total wave function is evolved in time by the propagator
| (2) |
where is the two-body Hamiltonian for 15C, and is the time-dependent interaction of 15C with the target nucleus. The form of Eq. (2) was originally used in Ref. kido . The propagator that was used in the earlier work ebb95 was a simplified version of Eq. (2).
Inserting the expansion (1) into Eq. (2) one obtains the following expression for the propagation of the radial wave functions,
| (3) |
where is the radial single-particle Hamiltonian which depends on through the spin-orbit interaction. The coupling between the radial wave functions occurs only through the interaction with the target, whereas the unitary, intrinsic propagation is diagonal in . The inverse operator, , is calculated using the technique described in Appendix B of Ref. BKN .
The spin-orbit interaction is included explicitly in the following. That makes it possible to treat certain aspects of 15C in a realistic way, such as the 5/2+ bound excited state and the 3/2+ resonance. The interaction between the projectile and target consists of the core-target Coulomb interaction, the core-target nuclear interaction, which is based on the 17O+Pb optical potential of Ref. o17pb , and the Perey-Perey neutron-target interaction perey . These interactions were chosen here because they were applied in the CDCC calculations of Ref. nunes08 . They were expanded on Legendre polynomials,
| (4) |
where is the angle between the position of the neutron with respect to the 14C core and the trajectory of the target with respect to the 15C projectile. The maximum value of in the expansion (4), , was set equal to 2Lmax so that all of the necessary multipole components were included in the calculation of the matrix elements of that appear in Eq. (3).
The semiclassical method is applied to the breakup of 15C on a Pb target at a beam energy of 68 MeV/nucleon. The time-evolution of the wave function for a given impact parameter starts when the distance between projectile and target is 300 fm with the ground state wave function as the initial condition. The propagation is terminated for practical reasons when the projectile and target have re-separated by 100 fm. One could follow the evolution further but the result would be useless because the wave function would start to be reflected from the outer boundary of the radial box and that produces oscillations in the calculated decay-energy spectrum.
One way to avoid the problems caused by the reflection of the wave function from the outer boundary is to use a larger radial box. This method was used to test the convergence of the calculated decay-energy spectrum, and it appears to have converged already at a separation of 100 fm. Another way of avoiding the reflection from the outer boundary (which will not be used here) is to apply an imaginary potential of a special form that acts near the outer boundary; see Ueda et al. ueda for details.
IV Applications to 15C breakup
In this section the semiclassical method is applied to analyze the decay-energy spectra of 15C that were measured at 68 MeV/nucleon on a Pb target nakac15b . The parameters of the structure model are shown in Table I; they are essentially the same as those that were used in the previous first-order analysis of the measurement nakac15b . Before presenting the results of the new analysis of the data, it is useful first to show the dissociation probabilities one obtains, and also to study the convergence of the calculations with respect to the maximum angular momentum Lmax that is used in the expansion (1) of the 15C two-body wave function.
IV.1 Disassociation probabilities
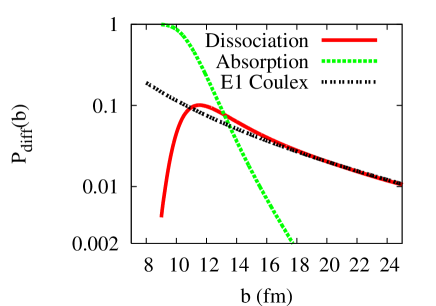
The calculated dissociation probabilities are shown in Fig. 3 as functions of the impact parameter. The solid curve is the dynamic calculation with Lmax=4. The dashed curve (labeled E1 Coulex) is the result of the first-order E1 Coulomb excitation, which is here based on Coulomb trajectories coul . The dynamic calculation is slightly suppressed at large impact parameters compared to the first-order calculation. In the 11-16 fm impact parameter range, the nuclear induced breakup takes over and gives an enhancement compared to the first-order calculation. Finally, at impact parameters smaller than 10 fm, the imaginary core-target interaction becomes strong and absorbs most of the wave function. The steeply falling dashed curve is the total absorption probability, which is due to the combined effect of the imaginary part of the neutron-target and core-target interactions.
IV.2 Convergence of the dynamic calculations
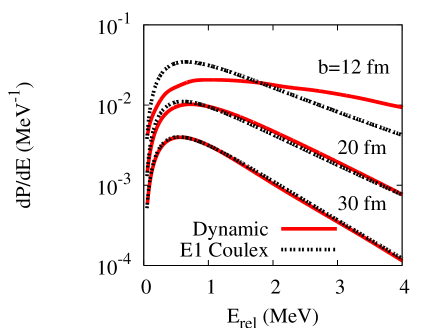
The decay-energy spectra obtained at three impact parameters are compared in Fig. 4 to those obtained from first-order E1 transitions. The spectra obtained in the dynamic calculations are very broad at small impact parameters but they approach the first-order calculation at the large impact parameters. The decay-energy spectrum, , will therefore in the following be calculated numerically by integrating the dynamic spectra over impact parameters less than 30 fm, whereas the contribution from impact parameters larger than 30 fm will be estimated by the first-order Coulomb excitation spectrum.
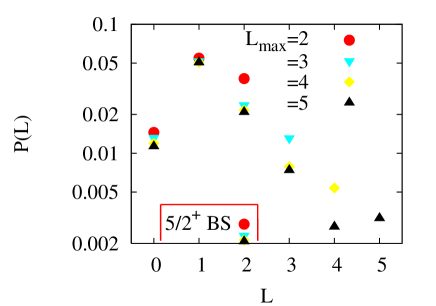
The dependence of the dissociation probability on the maximum angular momentum Lmax is illustrated in Fig. 5 in terms the continuum occupation probabilities P(L) (summed over ) for a fixed impact parameter of 12 fm. It is seen that the occupation probability for a fixed value of L is largest when Lmax=L, but the value drops and converges rather quickly with increasing values of Lmax. The total dissociation probability is 0.107, 0.102, 0.097 and 0.096 for Lmax = 2, 3, 4, 5, i. e., the total probability is reduced by about 10% by increasing Lmax from 2 to 4. The occupation probability of the 5/2+ bound state is also shown in Fig. 5 at L=2; it is relatively small and converges to a value of about 0.002.
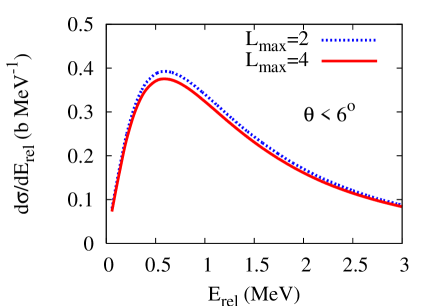
The decay-energy spectra one obtains in the dynamic calculations are illustrated in Fig. 6 for two values of the maximum angular momentum, Lmax = 2 and 4, respectively. The peak height decreases from 393 to 375 mb/MeV as Lmax increases from 2 to 4; that is a reduction of 5%. The peak height is not expected to change much by increasing the value of Lmax further because the reduction is only 1% when Lmax is increased from 3 to 4.
The nominal maximum center-of-mass acceptance angle in Fig. 6 was set to 6∘ because that is the largest acceptance angle that was used in the experiment nakac15b . The dynamic calculations have actually already converged at a smaller scattering angle because of the strong absorption at small impact parameters. For example, at the impact parameter = 9 fm, where the dynamic dissociation probability is already quite small, the Coulomb scattering angle is = 4.9 ∘.
IV.3 Analysis of the measured spectra
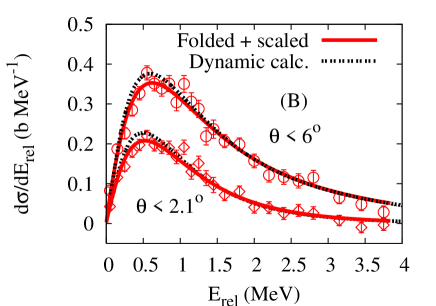
The decay-energy spectrum of 15C at 68 MeV/nucleon on a Pb target was measured for two center-of-mass acceptance angles, namely, at 2.1∘ and 6∘ nakac15b . The data are compared to the first-order and the dynamic calculations in Fig. 7A and 7B, respectively. The actual calculations are shown by dashed curves. The solid curves were obtained by a folding and scaling procedure: the calculated spectra were first folded with the experimental energy resolution, which is a Gaussian with a (1) width of = 0.23 nakac15b . The folded spectra were next scaled by the factor which optimizes the fit to the data. The values of the scaling factors and the associated best values of the per point are listed in Table II for different values of Lmax.
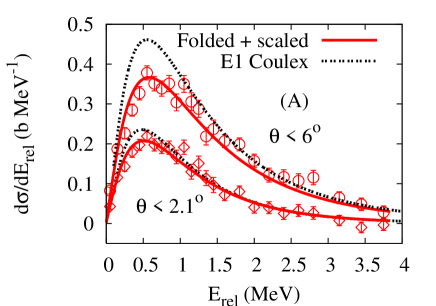
The decay-energy spectra for were calculated with a sharp cutoff at the impact parameter where the Coulomb scattering angle is = 2.1∘. An acceptance angle of 6∘ does not impose any strict cutoff on the dynamic calculation because it converges already at a smaller angle. The first-order Coulomb excitation calculation, on the other hand, does not have such a natural cutoff, except from Coulomb scattering but that leads to a very large cross section. The first-order decay-energy spectrum (E1 Coulex) shown in Fig. 7A for was therefore determined by integrating over all impact parameters for which the minimum distance of closest approach is larger than 1.2. The associated minimum impact parameter for a Coulomb trajectory is 9.7 fm, which is a fairly reasonable choice because it falls in the region where the absorption in the dynamic calculation sets in (see Fig. 3.)
| Lmax | (mb) | - | (mb) | - |
|---|---|---|---|---|
| E1 Coulex | 326 [303] | 0.941 - 0.87 | 767 [638] | 0.841 - 2.24 |
| 2 | 316 [303] | 0.972 - 0.76 | 750 [696] | 0.939 - 1.15 |
| 3 | 316 [303] | 0.972 - 0.77 | 732 [699] | 0.969 - 1.20 |
| 4 | 316 [304] | 0.973 - 0.77 | 716 [696] | 0.984 - 1.19 |
The dynamic calculations converge quickly for the smaller acceptance angle. This can be seen in Table II where the scaling factor that gives the best fit to the data is independent of Lmax. At the 6∘ acceptance angle, the scaling factor increases by almost 5% to the value 0.98 for Lmax=4; it is not expected to increase much further for larger values of Lmax. The scaling factors obtained in the two analyses are therefore approximately identical and the is also very reasonable for both acceptance angles. This implies that the adopted nuclear interactions with the target must be realistic because the calculations at large scattering angles are strongly influenced by the nuclear interactions, whereas the dissociation at the smaller acceptance angle is dominated by Coulomb dissociation.
The results of the first-order analysis are shown in the first line of Table II. The analysis of the large acceptance angle measurement is not so interesting because the fit is poor and the necessary scaling factor is small and uncertain. The uncertainty stems from the crude estimate of the minimum impact parameter. Although one could possibly choose a better value for the minimum impact parameter, the fit to the data would still be poor because the first-order decay-energy spectra are narrow compared to the results of the dynamic calculations at small impact parameters. This can be seen in Fig. 4.
The result of first-order perturbation theory at the smaller acceptance angle is much more interesting. Here the is good and the necessary scaling factor does not differ dramatically from the dynamic calculations. However, we shall see in the next section that the 4% larger scaling factor of the dynamic calculation, combined with other corrections, is essential for reaching a good agreement with the neutron capture data.
It should be emphasized that the scaling factors listed in Table II should not be confused with spectroscopic factors. The scaling factors were used here as a convenient way to analyze the data and show how the calculations converge with increasing values of Lmax.
V Comparison to radiative capture
As mentioned in the introduction, the discrepancy between the direct and indirect measurements of the radiative neutron capture rate on 14C is about 15%. This statement is based on the values of the Maxwellian Average Capture (MAC) cross sections, , that were obtained at the temperature = 23.3 keV. The definition of the MAC cross section is quoted in Eq. (A1) of the appendix. The direct measurement reifarth gave the value = 7.1 0.5 b, whereas the indirect, first-order Coulomb dissociation method gave the cross section 6.1 0.5 b nakac15b . One reason for the discrepancy is that the direct measurement includes a small contribution from the capture to the excited of 15C, whereas the indirect measurement can only provide information about the capture to the ground state of 15C.
| Method | (5/2+) | (total) | ||
|---|---|---|---|---|
| (b) | (b) | (b) | ||
| Model | 1 | 6.85 | 0.26 | 7.11 |
| E1 Coulex | 0.941 | 6.45(50) | 0.24 | 6.69(50) |
| Dynamic | 0.973 | 6.67(50) | 0.25 | 6.92(50) |
| Exp. reifarth | - | - | - | 7.1(5) |
In order to investigate in more detail what causes the discrepancy between the Coulomb dissociation and radiative capture measurements, it is useful to have an estimate of the cross section for the radiative capture to the 5/2+ excited state of 15C. The prediction of the structure model that was used in the previous sections is shown in the first line of Table III. The total MAC cross section predicted by the model is (accidentally) in perfect agreement with the measured 7.1(5) b cross section reifarth . The contribution from the capture to the 5/2+ excited state is almost 4%, so the discrepancy between the first-order Coulomb dissociation analysis of Ref. nakac15b and the radiative capture measurement is reduced to 11%.
The second and third lines of Table III show the cross sections extracted from the analysis of the decay-energy spectrum that was measured with the 2.1∘ acceptance angle (see Table II.) The cross sections were obtained by multiplying the predictions of the structure model (the first line of Table III) with the scaling factors that gave the best fit to the measured spectrum. The cross sections have been assigned an uncertainty of 0.5 b, which roughly reflects the 7% uncertainty of the Coulomb dissociation experiment nakac15b . The total cross section obtained from the first-order analysis (second line) is smaller than but not inconsistent with the capture measurement. The cross section extracted from the dynamic calculation (third line) is in excellent agreement with the measurement. Thus it is the combined effect of dynamic processes and the estimated contribution from the capture to the 5/2+ state that makes it possible to achieve consistency between the Coulomb dissociation and the direct capture measurements.
The MAC cross section for the radiative capture to the 1/2+ ground state of 15C that was obtained in Ref. nakac15b is 6.1(5) b. That is about 5% smaller than the 6.45(50) b cross section shown in the second line of Table III. The two results should in principle be identical because they are based on the same data set (the decay-energy spectrum at 2.1∘) and they were both obtained using first-order perturbation theory. In this connection, it is very interesting that the two analyses appear to give the same dipole strength distribution. For example, the peak height of the extracted distribution shown by the dashed curve in Fig. 2 of Ref. nakac15b is 0.32 e2fm2/MeV. The same peak height is obtained from the dipole response shown Fig. 1 when multiplied with the (E1 Coulex) scaling factor of Table II: 0.34 0.941 = 0.32 e2fm2/MeV. The 5% discrepancy mentioned above must therefore have developed in the calculation of the MAC cross section from the extracted dipole strength distribution (see appendix.)
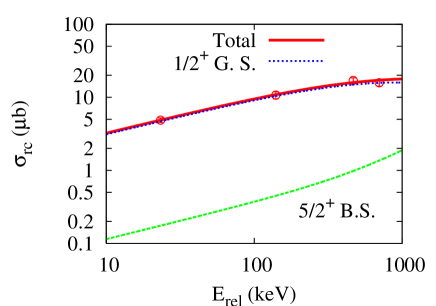
The radiative capture cross sections predicted by the structure model defined by Table I are shown in Fig. 8 as functions of the neutron center-of-mass energy. The figure shows the contributions from the capture to the 1/2+ ground state and to the 5/2+ excited state of 15C. The solid curve is the sum (total) which can be compared to the cross sections that were measured in Ref. reifarth . The model is in very good agreement with the data. The best prediction obtained from the analysis of the Coulomb dissociation experiment is a factor of 0.973 times the model prediction which is also in good agreement with the data.
The experimental cross section shown at the lowest energy (23.3 keV) in Fig. 8 is 4.86(34) b. This value was determined from the published 7.1(5) b MAC cross and the simple relation, Eq. (A3), derived in the appendix. A different value, namely 5.2(3) b, was quoted in Ref. reifarth but that value has been discarded here because it does not agree with the prediction of Eq. (A3), which was derived from the structure model used here and eighth other structure models that were considered in Ref. timo .
VI Conclusions
The semiclassical, dynamical description of the dissociation of weakly bound nuclei was applied to analyze the decay-energy spectra of 15C that have been measured in reactions with a Pb target. The two-body structure model of 15C, which was partly developed previously, was supplemented with a model for d-waves, so that the energies of the bound state and the resonance could be simulated. Standard neutron-target and core-target optical potentials were employed to describe the nuclear interaction of 15C with the target nucleus.
The two spectra that were measured were obtained with a small and a large acceptance angle, respectively. The calculated spectrum for the small acceptance angle is dominated by Coulomb dissociation, whereas the spectrum calculated with the large acceptance angle is strongly influenced by the nuclear interaction. The effect of the nuclear interaction is to produce broad decay-energy spectra at large scattering angles, and it also determines the magnitude of the spectrum for the large acceptance angle because of a strong absorption it produces at small impact parameters.
The analysis of the measured decay-energy spectra shows that the optical potentials that were used must be fairly realistic because the scaling factors that give the best fit to the spectra at the small and large acceptance angles are essentially the same. The analysis also shows that the adopted structure model must be fairly realistic because the best fit to the data is achieved with a scaling factor that is very close to one.
Having achieved a comprehensive description of the measured decay-energy spectra, the structure model was applied to calculate the cross sections for the radiative neutron capture on 14C, not only to the ground state but also to an excited state of 15C. The total capture cross section predicted by the model is (accidentally) in perfect agreement with the recently measured, low-energy capture cross section, and it also accounts for the neutron capture data at higher energies. That implies that the measured decay-energy spectra and the measured neutron capture cross sections are consistent within a few percent, when the decay-energy spectra are analyzed in semiclassical, dynamical description.
Good agreement between the dissociation and neutron capture measurements was also recently achieved within the CDCC description nunes08 . The analysis of the dissociation data was based on structure models that are slightly different from the model used here, in particular with respect to d-waves. A comparison of the semiclassical and CDCC calculations will be made in the near future capel .
Acknowledgments The author is grateful to F. Nunes for discussions and to T. Nakamura for providing the data and information about the experiment. This work was supported by the U.S. Department of Energy, Office of Nuclear Physics, under Contract No. DE-AC02-06CH11357.
VII Appendix: MAC cross section
The Maxwellian Averaged Capture (MAC) cross section at the temperature is defined by (see Eq. (5) of Ref. beer )
in terms of the radiative capture cross section , which can be derived from the dipole strength distribution. For example, the cross section for the E1 radioactive neutron capture to the 1/2+ ground state of 15C is
where is the dipole excitation strength, is the neutron separation energy, the neutron-14C reduced mass, and is the relative energy of the neutron and the 14C fragment. A more general expression can be found, for example, in section 3.2 of Ref. b8a .
Inserting into Eq. (A1) the cross section for the capture to the 1/2+ ground state of 15C calculated in the model defined by the parameters in Table I, one obtains the following relation between the MAC cross section at the temperature = 23.3 keV and the capture cross section at the energy = 23.3 keV,
(If the small capture cross section to the 5/2+ bound state is also included, one obtain essentially the same relation, namely, with the factor 1.460 replaced by 1.462.)
Daniel Baye derived the following expression timo
which gives a very good parametrization of the low-energy cross section for the radiative neutron capture from a p-wave to an s-wave bound state. Inserting this expression into Eq. (A1) one obtains the expression
Eight different structure models of 15C were considered in Ref. timo and they all give the same relation, Eq. (A3), between the capture cross section at 23.3 keV and the MAC cross section at the temperature = 23.3 keV, when the parameters and of the models are inserted into Eq. (A5).
The cross section for the radiative capture to the 1/2+ ground state of 15C predicted by structure model defined in Table I can be accurately parametrized by Eq. (A4) (at least up to 1 MeV) with = 4.77 b, = –0.783 MeV-1 and = 0.298 MeV-2.
References
- (1) T. Nakamura et al., Nucl. Phys. A 722, 301c (2003).
- (2) N. C. Summers and F. M. Nunes Phys. Rev. C 78, 011601(R) (2008); ibid. 78 069908(E) (2008).
- (3) R. Reifarth et al., Phys. Rev. C 77, 015804 (2008).
- (4) T. Nakamura et al., Phys. Rev. C 79, 035805 (2009).
- (5) H. Esbensen, G. F. Bertsch, and C. A. Bertulani, Nucl. Phys. A581, 107 (1995).
- (6) C. A. Bertulani and G. F. Bertsch, Phys. Rev. C 49, 2839 (1994).
- (7) H. Esbensen and G. F. Bertsch, Nucl. Phys. A 600, 37 (1996); Phys. Rev. C 66, 044609 (2002).
- (8) H. Esbensen, G. F. Bertsch, and K. A. Snover, Phys. Rev. Lett. 94, 042502 (2005).
- (9) H. Esbensen and G. F. Bertsch, Nucl. Phys. A 706, 383 (2002).
- (10) A. Winther and K. Alder, Nucl. Phys. A319, 518 (1979).
- (11) A. R. Junghans et al., Phys. Rev. C 68, 065803 (2003).
- (12) K. Ogata, S. Hashimoto, Y. Iseri, M. Kamimura, and M. Yahiro, Phys. Rev. C 73, 024605 (2006).
- (13) Alexander Volya and Henning Esbensen, Phys. Rev. C 66, 044604 (2002).
- (14) J. R. Terry, D. Bazin, B. A. Brown, J. Enders, T. Glasmacher, P. G. Hansen, B. M. Sherrill, and J. A. Tostevin, Phys. Rev. C 69, 054306 (2004).
- (15) J. M. Eisenberg and W. Greiner, Excitation Mechanisms of the Nucleus, Nuclear Theory 2 (3rd revised edition, North Holland, Amsterdam (1988)).
- (16) H. Esbensen, Phys. Rev. C 78, 024608 (2008).
- (17) T. Kido, K. Yabana, Y. Suzuki, Phys. Rev. C 50, R1276 (1994); Phys. Rev. C 53, 2296 (1996).
- (18) P. Bonche, S. Koonin, J. W. Negele, Phys. Rev. C 13, 1226 (1976).
- (19) N. Fukuda et al., Phys. Rev. C 70, 054606 (2004).
- (20) C. M. Perey and F. G. Perey. At. Nucl. Data Tables, 17, 1 (1976).
- (21) M. Ueda, K. Yabana and T. Nakatsukasa, Phys. Rev. C 67, 014606 (2003).
- (22) N.K.Timofeyuk, D.Baye, P.Descouvemont, R.Kamouni, and I.J.Thompson, Phys. Rev. Lett. 96, 162501 (2006).
- (23) P. Capel and F. Nunes (private communications).
- (24) H. Beer, F. Voss, and R. R. Winters, Astrophys. Jour. Suppl. 80, 403 (1992).