Hipparcos calibration of the tip of the Red Giant Branch
Abstract
We have detected the tip of the Red Giant Branch (TRGB) in the solar neighborhood using near infrared photometry from the 2MASS and DIRBE catalogs, and revised Hipparcos parallaxes. We confirm that the revised Hipparcos parallaxes are superior to the original ones, and that this improvement is necessary to detect the TRGB. We find a tip absolute magnitude of , in agreement with that expected from previous tip measurements of the Large Magellanic Cloud, Small Magellanic Cloud, and Bulge. This represents the first geometric calibration of the TRGB and extends previous calibrations, based on metal-poor globular clusters, to solar metallicities. We attempted to use the TRGB to confirm the presence of the Lutz-Kelker bias, with inconclusive results. Attempts to detect the tip in the -band also produced inconsistent results, due to a lack of precise, homogeneous photometry for these bright stars.
Subject headings:
stars: AGB and post-AGB – stars: late-type – stars: variables: other – solar neighborhood – distance scale1. Introduction
The tip of the Red Giant Branch represents the maximum absolute luminosity achieved by first-ascent red giants, and marks the onset of helium fusion in the degenerate cores of these low-mass stars. Theoretical predictions, confirmed by observational evidence, indicate that the TRGB is an excellent distance indicator, since the absolute bolometric magnitude of the tip varies by only mag for a wide range of metallicities and ages (Iben & Renzini, 1983; Da Costa & Armandroff, 1990; Salaris & Cassisi, 1997). The -band magnitude of the TRGB has become well-established as a distance indicator for nearby galaxies with well-resolved Population II stars in their halos (for example, see Lee et al., 1993; Sakai et al., 1996; Mould & Sakai, 2008).
The TRGB complements other distance indicators, such as Cepheids and RR Lyrae stars, being comparable in precision (Lee et al., 1993). Indeed, empirical evidence and computer simulations show that space-based observations provide distances out to 12 Mpc with a precision of 10%, limited primarily by integration time (Madore & Freedman, 1995). However, the TRGB is a tertiary distance indicator, calibrated using RR Lyrae variables in Galactic globular clusters, which are themselves secondary distance indicators. Moreover, there is a discrepancy of 0.1mag between the TRGB and Cepheid distance scales (Tammann et al., 2008), and the metallicity dependence of Cepheid P-L relation has itself been calibrated using the TRGB method, leading to a circular dependency (Rizzi et al., 2007). Thus, it would be of considerable importance to have a direct calibration of the tip magnitude.
Although the TRGB is more easily observed in near infrared (NIR) passbands, where interstellar reddening is reduced, both the color and luminosity of the NIR TRGB are more sensitive to metallicity than in the -band (Rizzi et al., 2007). Nevertheless, recent studies of the Magellanic Clouds and Galactic Bulge have successfully identified the TRGB discontinuity in the -band, using 2MASS photometry (Cioni et al., 2000; Kiss & Bedding, 2004; Schultheis et al., 2004). Moreover, the discontinuity is clearly visible in the -band P-L plot of M giants in the local solar neighborhood (Tabur et al., 2009), which prompted us to investigate further. In this Letter we present our findings, including the first geometric calibration of the TRGB absolute magnitude.
2. Data
We selected all stars with relative parallax uncertainties less than 25% in the revised Hipparcos catalog (van Leeuwen, 2007)111We used the version published on VizieR on 2008 September 15, which corrected an error that affected earlier versions of the revised catalog. Stars with negative parallaxes were ignored. . We obtained magnitudes and uncertainties from the 2MASS catalog (Cutri et al., 2003), using a search radius of 5 arcsec. Being luminous and nearby, some of the stars were saturated despite being observed with the shortest integration time (51 ms), and were measured using the wings of their radial profiles, resulting in large photometric uncertainties (0.2–0.4 mag). Additional scatter was contributed by the use of single-epoch measurements, since all M giants are intrinsically variable (Eyer & Mowlavi, 2008), with typical -band peak-to-peak amplitudes between 0.1 and 0.25 mag (Smith et al., 2004).
Seeking a higher-precision source of NIR photometry, we extracted flux measurements from the DIRBE catalog, which contains photometry for nearly 12000 objects sampled over 10 months (Smith et al., 2004). Following Whitelock et al. (2008), we adopted a value of 630 Jy for , and used 1570 Jy for , both of which are consistent with Bessell & Brett (1988). Although DIRBE was less prone to saturation than 2MASS, its large beam-width led to confusion between nearby sources. Using the same methodology as described by Tabur et al. (2009), we only selected unconfused sources (confusion flags 1 and 2 not set). This permitted an accurate determination of mean magnitudes that are demonstrably superior to 2MASS for about half the red giants.
Interstellar extinction is expected to be relatively small for all stars in the sample, particularly in the -band. We calculated the visual extinctions using the interstellar extinction model of Drimmel et al. (2003). Extinctions for other bands were scaled using the factors from Rieke & Lebofsky (1985). The greatest extinction was mag, with mag for 98% of the sample.
We calculated absolute magnitudes using the relation , where is the extinction-corrected apparent magnitude, and is the geometric parallax in arcseconds. Photometric uncertainties were obtained directly from the 2MASS catalog, or derived from flux densities from DIRBE. Parallax uncertainties were estimated with a first-order approximation of , with the total uncertainty in calculated as the quadrature sum of photometric and parallax uncertainties222The data used in this analysis are available electronically from CDS, Strasbourg..
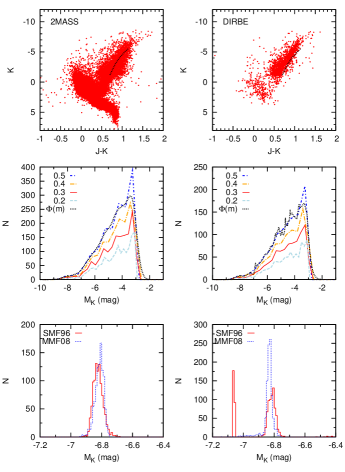
The color-magnitude diagrams (CMDs) are shown in the top row of Figure 1, and the RGB is clearly visible. We indicate its expected position with a thin black line, by assuming and adopting the calibration of Valenti et al. (2004), which is based on Galactic globular clusters within the metallicity range . The position agrees well for our 2MASS sample, and less so for DIRBE, although the difference is irrelevant for measuring the TRGB. A few stars around and are probably reddened by dust. The DIRBE photometry is sparser, particularly at the faint end, although the evolved stars near the tip appear well represented.
To be sure of identifying all stars near the tip, which contains relatively few stars because it is a short-lived late evolutionary stage, we ignored cataloged spectral types. Instead, we used the color-magnitude diagram to select all stars in the range and , in order to include early M giants, and to exclude very red, dust-enshrouded stars.
3. Edge detection
We have used two model-independent methods for edge detection (ED) to locate the TRGB discontinuity. Firstly, we followed Mager et al. (2008, hereafter MMF08) by using an ED filter that uses a combination of small bins for resolution and larger bins for smoothing, with a logarithmic edge detector to account for the expected power-law distribution at the bright end of the RGB (Méndez et al., 2002). Additionally, we iteratively calculated the peak filter-response 85 times, using a range of starting offsets and bin sizes to smooth-out sensitivity to these parameters, and subsequently used the mean (after 3-sigma rejection) as the TRGB location. This method proved fairly robust in the presence of noise. We limited the search for the discontinuity to the range , to eliminate false positives.
Our second method accounts for photometric and parallax uncertainties by using a sum of Gaussians to create continuous probability function to model the LF:
| (1) |
where and are the magnitudes and their uncertainties, respectively, and is the total number of stars in the sample (Sakai et al., 1996, hereafter SMF96). We found that a logarithmic ED filter produced poor results and, following SMF96, adopted a filter of the form , where is the filter response at magnitude , and is the bin size. Previous studies have defined the bin size as a function of photometric uncertainty. However, unlike the RGBs in nearby galaxies, our sample is drawn from the local solar neighborhood and is less affected by completeness errors or increased photometric errors toward fainter magnitudes. Indeed, the distribution of mean errors over the range is nearly constant, leaving us free to choose a bin size on the basis of its smoothing performance alone. We adopted a value of 0.2 mag.
We estimated uncertainties using the bootstrapping method described by Babu & Feigelson (1996), which is widely used (see, for example, Méndez et al., 2002). We selected 1000 random samples, each consisting of 80% of the stars from the original sample, and determined the location of the TRGB for each, adopting the rms scatter as our uncertainty.
4. Results and Discussion
4.1. The K-band TRGB
Since samples containing stars with relatively large tended to blur the RGB/AGB boundary, we calculated the TRGB location for several samples selected with upper bounds in the range . Luminosity functions (LFs) and bootstrapping distributions for the stars with are shown in Figure 1. LFs are shown for bin sizes of 0.2–0.5 mag, together with the weighted continuous function (Eq. 1). The two LFs exhibit similar morphologies and, despite the DIRBE LF containing half as many stars as 2MASS, both show the AGB stars above the tip, at .
The bottom panels show the TRGB position determined from 1000 bootstrap operations for each ED filter, binned in 0.01 mag increments. The 2MASS photometry yields an unambiguous detection, with nearly identical results for the two filters. The sparser DIRBE photometry produced very similar results, although the SMF96 filter detected another peak at which was not real. Its significance reduced as more stars were added (with looser parallax restrictions), simultaneously increasing the size of the peak at , implying that the SMF96 filter is more sensitive to noise. We ignored the second peak in our calculations.
Table 1 gives the full results, listing the maximum used for each sample, the number of stars in the 1-mag bin below the tip (2MASS), the tip locations for both the 2MASS and DIRBE samples using the SMF96 and MMF08 filters. The results for all four combinations agree within the uncertainties.
| Max | |||||
|---|---|---|---|---|---|
| (mag) | (mag) | (mag) | (mag) | ||
| 0.100 | 123 | 6.79 0.02 | 6.82 0.03 | 6.84 0.04 | |
| 0.125 | 166 | 6.82 0.03 | 6.82 0.03 | 6.84 0.04 | |
| 0.150 | 212 | 6.87 0.03 | 6.82 0.03 | 6.90 0.09 | |
| 0.175 | 253 | 6.85 0.03 | 6.82 0.03 | 6.85 0.06 | |
| 0.200 | 295 | 6.83 0.03 | 6.82 0.03 | 6.85 0.06 | |
| 0.225 | 318 | 6.82 0.03 | 6.82 0.03 | 6.86 0.06 | |
| 0.250 | 353 | 6.85 0.05 | 6.82 0.02 | 6.94 0.10 |
Early studies of the statistical robustness of the TRGB method concluded that 50–100 stars are required in the 1-mag bin below the TRGB, although more recent work suggests that 400–500 stars are required for an accurate determination (Madore et al., 2009). Although our smallest 2MASS sample includes only 123 stars in the 1-mag bin below the tip, the largest sample (with 353 stars) yields very similar results. There is no indication of the 0.6 mag systematic shift toward fainter tip magnitudes for samples with less than 300 stars, that was found by Madore et al. (2009). Moreover, rerunning the ED calculations by bootstrapping with 66% and 33% of the original sample size showed little variation in the TRGB location (but with larger uncertainties).
Cioni et al. (2000) measured the TRGB in the LMC and SMC, finding dereddened values of and 6.41, respectively. The difference of 0.2 mag is caused by the different metal abundances, which we adopt as , , and (Vassiliadis & Wood, 1994). In order to quantify the TRGB’s metallicity dependence, Ferraro et al. (2000) measured the location of the TRGB in 10 galactic globular clusters, fitting the relation , which predicts mag for an increase in metallicity by a factor of 2. Using the global metallicity scale, which incorporates -element abundances, Ferraro et al. (2006) found [M/H] for metallicities to dex. This leads to a tip magnitude in the range to for solar-like metallicity, in excellent agreement with our result.
Schultheis et al. (2004) examined the -band luminosity function of MACHO semiregular variables in the Galactic bulge, finding a steep drop-off in number near , which they interpreted as the location of the TRGB.
| Max | ||||
|---|---|---|---|---|
| (mag) | (mag) | (mag) | (mag) | |
| 0.100 | 6.86 0.03 | 6.81 0.02 | 6.84 0.03 | 6.86 0.02 |
| 0.125 | 6.86 0.03 | 6.83 0.03 | 6.84 0.03 | 6.86 0.03 |
| 0.150 | 6.87 0.03 | 6.93 0.05 | 6.83 0.04 | 6.86 0.05 |
| 0.175 | 6.86 0.03 | 6.84 0.04 | 6.83 0.03 | 6.82 0.03 |
| 0.200 | 6.87 0.03 | 6.85 0.04 | 6.83 0.03 | 6.83 0.02 |
| 0.225 | 6.87 0.02 | 6.84 0.03 | 6.83 0.03 | 6.83 0.02 |
| 0.250 | 6.89 0.02 | 6.83 0.03 | 6.83 0.03 | 6.81 0.02 |
4.2. Lutz-Kelker bias
We expect a sample limited by relative parallax uncertainties to be affected by a systematic bias (Lutz & Kelker, 1973), resulting in an underestimate of stellar luminosity. Using the TRGB as a marker, we searched for evidence of a systematic shift in its position in samples selected with progressively larger relative parallax uncertainties.
First, we selected non-overlapping samples in blocks of 10% relative parallax uncertainty, but this yielded too few stars for reliable TRGB detection. Increasing to 15% increments did not help, so finally we simply examined our previous samples for a systematic shift, and compared them to a reprocessed set, where individual bias corrections had been applied to each star using the relation (Whitelock et al., 2008). Table 2 lists the results using the same nomenclature as Table 1, and shows that the mean corrected tip positions are indistinguishable from the uncorrected values, to within the errors. We note that the corrected tip magnitudes for 2MASS are 0.02 mag brighter on average, but the DIRBE MMF08 result is slightly fainter.
The median for each sample is about half the maximum value, implying an expected bias-induced shift of 0.1 mag between the first and last samples (10% and 25%). However, the uncorrected results (Table 1) show far smaller differences, and in the wrong sense (brighter tip magnitudes when an under-estimate is expected). Thus, we see no evidence of a systematic shift toward fainter tip magnitudes as samples include stars with progressively larger relative parallax uncertainties, and conclude that there are too few stars with sufficiently precise parallaxes and/or apparent magnitudes for a convincing detection of the Lutz-Kelker bias.
4.3. Comparison of original and revised parallaxes
To test whether the revised Hipparcos parallaxes are superior to the original values, we use the ability to resolve the TRGB, with consistent results, as an indicator of precision. We reprocessed the same sample used for Figure 1, but using the original parallaxes (Perryman et al., 1997). Figure 2 shows the resulting bootstrap distributions for 2MASS and DIRBE photometry.
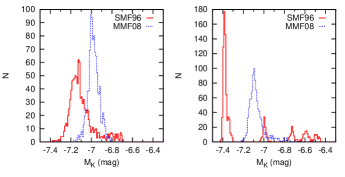
We note several features. Firstly, the peaks are no longer coincident, with the filters converging to different values. Some peaks are asymmetrical, with long tails, and in the case of SMF96 with DIRBE data, multiple solutions are found. None of the tip locations match the value consistently returned using revised parallaxes. Moreover, the peaks have significantly larger widths (0.05–0.12 mag, excluding the worst case with multiple solutions). Comparing with Figure 1 (bottom row), and noting the change in scale, we see that only the revised parallaxes produce a consistent result with small uncertainties. Tests using larger samples with greater relative parallax limits produced similar results. We conclude that the revised Hipparcos parallaxes are superior to the originally published values, and that this improvement is necessary for a clear detection of the TRGB.
4.4. The I-band TRGB
An -band calibration of the tip is particularly important because of its relative insensitivity to metallicity and age. Unfortunately, we are not aware of a homogeneous source of all-sky -band photometry for these very bright stars. For example, DENIS photometry is saturated at (Epchtein et al., 1994). Instead, we transformed 2MASS NIR magnitudes to the -band using the relation (G. Bakos, pers. comm.), with uncertainties of 0.1–0.2 mag. This required a tighter constraint on to compensate for the larger photometric uncertainties introduced by the transformation, which reduced the number of stars near the tip.
Subsequent edge searches yielded inconsistent results. Samples having produced very broad bootstrap distributions around with vague, ill-defined peaks. Samples with greater relative parallax uncertainties produced slightly more consistent results, with generally centered at mag, although inspection of the corresponding LFs showed no obvious discontinuity. Clearly an improved source of precise, all-sky -band photometry is required before at accurate calibration can be made.
5. Conclusion
The TRGB is an important, widely-used tertiary distance indicator, but lacks a direct calibration. Using revised Hipparcos parallaxes and NIR photometry from the 2MASS and DIRBE catalogs, we have unambiguously detected the TRGB in the local solar neighborhood. Two different ED methods have been used to quantitatively measure its location as , which is the first geometric calibration of the TRGB, and the first for stars with solar metallicity. We demonstrate that the revised Hipparcos parallaxes yield consistent results with far smaller uncertainty than the original Hipparcos parallaxes, and conclude that the revised values are indeed superior, at least for our sample of nearby, M giants. We were unable to detect the effect of the Lutz-Kelker bias using the TRGB location as an indicator. Calibration of the -band TRGB is not possible due to a lack of sufficiently precise photometry.
This research has made use of the data products from the Two Micron All Sky Survey, which is a joint project of the University of Massachusetts and the Infrared Processing and Analysis Center/California Institute of Technology, funded by the National Aeronautics and Space Administration and the National Science Foundation. This project has been supported by the Australian Research Council.
References
- Babu & Feigelson (1996) Babu, G.J., Feigelson, E.D., 1996, Astrostatistics (London: Chapman and Hall)
- Bessell & Brett (1988) Bessell, M.S., Brett, J.M., 1988, PASP, 100, 1131
- Cioni et al. (2000) Cioni, M.-R.L. et al., 2000, A&A, 359, 601
- Cutri et al. (2003) Cutri, R.M. et al., 2003, Explanatory Supplement to the 2MASS All Sky Data Release, Caltech, Pasadena
- Da Costa & Armandroff (1990) Da Costa, G.S., Armandroff, T.E., 1990, AJ, 100, 162
- Drimmel et al. (2003) Drimmel, R., Cabrera-Lavers, A., López-Corredoira, M., 2003, A&A, 409, 205
- Epchtein et al. (1994) Epchtein, N. et al., 1994, Ap&SS, 217, 3
- Eyer & Mowlavi (2008) Eyer, L., Mowlavi, N., 2008, JPhCS, 118, 1201
- Ferraro et al. (2006) Ferraro, F.R., Valenti, E., Origlia, L., 2006, Apj, 649, 243
- Ferraro et al. (2000) Ferraro, F.R. et al., 2000, AJ, 119, 1282
- Iben & Renzini (1983) Iben, I., Renzini, A., 1983, ARA&A, 21, 271
- Kiss & Bedding (2004) Kiss, L.L., Bedding, T.R., 2004, MNRAS, 347, L83
- Lee et al. (1993) Lee, M.G., Freedman, W.L., Madore, B.F., 1993, ApJ, 417, 553
- Lutz & Kelker (1973) Lutz, T.E., Kelker, D.H., 1973, PASP, 85, 573
- Madore & Freedman (1995) Madore, B.F., Freedman, W.L., 1995, AJ, 109, 1645
- Madore et al. (2009) Madore, B.F., Mager, V.A., Freedman, W.L., 2009, ApJ, 690, 389
- Mager et al. (2008) Mager, V.A., Madore, B.F., Freedman, W.L., 2008, ApJ, 689, 721
- Méndez et al. (2002) Méndez, B. et al., 2002, AJ, 124, 213
- Mould & Sakai (2008) Mould, J., Salai, S., 2008, ApJ, 686, L75
- Perryman et al. (1997) Perryman, M.A.C. et al., 1997, A&A, 323, L49
- Rieke & Lebofsky (1985) Rieke, G.H., Lebofsky, M.J., 1985, ApJ, 288, 618
- Rizzi et al. (2007) Rizzi, L. et al., 2007, ApJ, 661, 815
- Sakai et al. (1996) Sakai, S., Madore, B.F., Freedman, W.L., 1996, ApJ, 461, 713
- Salaris & Cassisi (1997) Salaris, M., Cassisi, S., 1997, MNRAS, 289, 406
- Schultheis et al. (2004) Schultheis, M., Glass, I.S., Cioni, M.-R., 2004, A&A, 427, 945
- Smith et al. (2004) Smith, B.J., Price, S. D., Baker, R.I., 2004, ApJS, 154, 673
- Tabur et al. (2009) Tabur, V. et al., 2009, MNRAS, submitted
- Tammann et al. (2008) Tammann, G.A., Sandage, A., Reindl, B., 2008, ApJ, 679, 52
- Valenti et al. (2004) Valenti, E., Ferraro, F.R., Origlia, L., 2004, MNRAS, 351, 1204
- van Leeuwen (2007) van Leeuwen, F., 2007, Ap&SS Library, Vol. 350, Hipparcos, the New Reduction of the Raw Data, Springer, Berlin
- Vassiliadis & Wood (1994) Vassiliadis, E., Wood, P.R., 1994, ApJS, 92, 125
- Whitelock et al. (2008) Whitelock, P.A. et al., 2008, MNRAS, 386, 313