Bright Ultraviolet Regions and Star Formation Characteristics in Nearby Dwarf Galaxies111Based on observations made with the NASA Galaxy Evolution Explorer (GALEX). GALEX is operated for NASA by the California Institute of Technology under NASA contract NAS5-98034.
Abstract
We compare star formation in the inner and outer disks of 11 dwarf Irregular galaxies (dIm) within 3.6 Mpc. The regions are identified on GALEX near-UV images, and modeled with UV, optical, and near-IR colors to determine masses and ages. A few galaxies have made complexes in a starburst phase, while others have not formed clusters in the last 50 Myrs. The maximum region mass correlates with the number of regions as expected from the size-of-sample effect. We find no radial gradients in region masses and ages, even beyond the realm of H emission, although there is an exponential decrease in the luminosity density and number density of the regions with radius. H is apparently lacking in the outer parts only because nebular emission around massive stars is too faint to see. The outermost regions for the 5 galaxies with HI data formed at average gas surface densities of 1.9-5.9 pc-2. These densities are at the low end of commonly-considered thresholds for star formation and imply either that local gas densities are higher before star formation begins or sub-threshold star formation is possible. The first case could be explained by supernovae triggering and other local processes, while the second case could be explained by gravitational instabilities with angular momentum loss in growing condensations. The distribution of regions on a plot is examined. The distribution is usually uniform along for equal intervals of and this implies a region count that varies as . This variation results from either an individual region mass that varies as or a region disruption probability that varies as . A correlation between fading-corrected surface brightness and age suggests the former. The implied loss of mass is from fading of region envelopes below the surface brightness limit.
1 Introduction
Dwarf irregular galaxies are among the most numerous galaxies known and as such are a fundamental component of the universe. They are the most common type of galaxy within the Local Group, and are thought to be the building blocks of larger galaxies. Despite their numbers and proximity they are still among the least understood of objects. We don’t know how these galaxies form stars or how they have evolved to become the galaxies we see today. As such, it is essential that we work towards understanding the forces at work within them, and the processes which have shaped them.
Understanding the large and small-scale star formation processes in dwarf galaxies has long posed a problem to the current models. In the classic Toomre instability (Toomre 1964) there is a specific column density () needed for a ring-like perturbation to grow exponentially. This model seems to work well in the inner regions of most spirals (Kennicutt 1989; Martin & Kennicutt 2001). Dwarf galaxies are so bereft of gas, however, that in many cases is never reached, even in the centers where the gas column density is highest (unless the velocity dispersion is very low – de Blok & Walter 2006). Still, we see star formation not only in these centers, but even in the outer reaches of the disk where the gas density to critical density ratio (/ 1/Q) is considerably lower than unity. Similarly, the outer disks of spirals and some entire spiral disks are subcritical (Martin & Kennicutt 2001). One possibility is that localized processes dominate in the absence of large-scale instabilities (e.g., Elmegreen & Hunter 2006). Another possibility is that stars and gas together promote the gravitational instabilities that lead to star formation (e.g., Yang et al. 2007). A third possibility is that the gas is unstable even in subthreshold environments, but the instability growth time is long – comparable to the time for angular momentum to leave a growing perturbation through viscous and magnetic forces (Elmegreen 1987). In all three cases, dwarf galaxies offer insight into star formation without the influence of spiral density waves.
In this paper we compare the properties of individual star-forming regions in outer and inner disks of a sample of dwarf galaxies. The young regions are identified on GALEX (GALaxy Evolutionary eXplorer; Martin et al. 2005) near-UV () images. We use far-UV () and , , and some colors to model the masses and ages of the regions. Our investigation includes approximately 2000 separate star-forming regions. With these data we compare mass, age, and several other key properties of star-forming regions in inner and outer disks.
Star forming regions in galaxies are also useful for studies of cluster evolution, particularly regarding fading from stellar evolution and mass loss, and cluster disruption through cloud collisions and other processes. An important diagram for these studies is a plot of versus for cluster mass and age . Such a plot shows a uniform distribution of points over a range of for each interval of above the magnitude detection threshold for the survey (Hunter et al. 2003; Rafelski & Zaritsky 2005; Fall, Chandar & Whitmore 2005; Bastian et al. 2005a; Whitmore, Chandar, & Fall 2007). The plot also shows a cluster count decreasing as over a range of for each interval of . The implication of the former trend is that cluster count decreases in equal intervals of age as for all observable masses (Fall et al. 2005). The implication of the latter is that decreases in equal intervals of mass as for all observable ages (Elmegreen & Efremov 1997; Zhang & Fall 1999; Hunter et al. 2003; de Grijs & Anders 2006). Here we study these diagrams for our sample of galaxies, finding the same trends, and also study in more detail the distribution of region surface brightness and radius with age.
In §2 we discuss the images used in our survey. §3 describes the means by which we calculated the photometry for our star-forming regions, as well as a discussion of our age and mass modeling process. One of the principle goals of this survey was to examine radial trends within the dwarf galaxies, and §4 discusses these radial trends. In §5 we present a discussion of some of the major results of our survey: §5.1 considers the surface brightness evolution of regions in four best-case galaxies, showing a trend with age that is steeper than from stellar evolution fading alone. This suggests a specific pattern of mass loss in each region that results from surface brightness limitations. It is a mass loss that is independent of stellar evolution, evaporation, and region disruption. Size-of-sample effects regarding surface brightness are also discussed. §5.2 reviews the plots with a comment about the implied time dependence of region mass, §5.3 suggests that outer disk H is missing because of faintness, not variations in the initial mass function (see also Hunter, Elmegreen & Ludka 2009), §5.4 comments on variations in the star formation rate, §5.5 examines outer disk HI column densities and suggests mechanisms for sub-threshold star formation, and §5.6 notes the size-of-sample effects in our observations. Lastly, §6 provides a general overview and summary of what we have learned about the star formation processes in dwarf galaxies. Also included is an appendix in which the properties of the individual galaxies within our survey are discussed.
2 The Images
The galaxies in this investigation are a sub-sample of a large multi-wavelength survey of 136 relatively normal nearby galaxies without spiral arms (94 dIm, 24 Blue Compact Dwarfs, and 18 Sm galaxies; Hunter & Elmegreen 2004, 2006). That survey is representative of the range in galactic parameters exhibited by dwarfs, and is aimed at understanding star formation processes in dwarf galaxies. The and H data obtained as part of that survey are described by Hunter and Elmegreen.
To extend this survey into the UV, we obtained images from the GALEX archives for 44 of our 136 dwarf galaxies. These data are part of a study of azimuthally-averaged UV properties in Hunter et al. (2009). For the present study, we selected 11 dIm galaxies from this GALEX sample, all within 3.6 Mpc of the Sun, to measure the properties of individual star-forming regions. These data are combined with comparable measurements on our and H images and on images of one of the galaxies. The galaxies that are part of the present study are listed in Table 1 along with several basic properties. GALEX exposure times and tile names are given in Table 2.
GALEX images were taken simultaneously in two channels: , with a bandpass of 1350–1750 Å, an effective wavelength of 1516 Å, and a resolution of 4.0″ and with a bandpass of 1750–2800 Å, an effective wavelength of 2267 Å, and a resolution of 5.6″. The images were processed through the GALEX pipeline, and we retrieved final intensity maps with a 1.5″ pixel scale from the archives. The GALEX field of view is a circle with 1.2° diameter; we extracted a portion around our target galaxies.
We edited foreground stars and background galaxies, and removed sky from the GALEX and images. In some cases the sky was a constant determined from regions around the galaxy, but in other cases the sky was determined from a low-order, two-dimensional fit to the surroundings. We geometrically transformed the UV images to match the orientation and scale of our images. In that way we could identify regions on the images and then easily measure fluxes on all of the , , and images using the same extraction apertures.
3 Photometry and Modeling
We identified individual star-forming regions on the images, measured their fluxes on all of our broad-band images, and subtracted the background galaxy light. We corrected these fluxes to the standard photometric systems. We then applied Bruzual & Charlot (2003) stellar population models to our colors and luminosities to determine the ages and masses of the star-forming regions. These ages and masses were studied with respect to galactocentric radius and other variables.
3.1 Region Selection
We marked with polygons all of the individual knots of star formation seen in the images. These regions are defined as spots or clumps that stand out against the diffuse background disk emission. The polygons were then applied to all the other image passbands that we have for each galaxy.
The regions were identified by eye. One source of uncertainty comes from the occasional difficulty of distinguishing foreground stars from star-forming regions in the galaxies at the resolution of the images, especially for the more distant galaxies. Although foreground stars are preferentially red, we did not wish to bias the regions to only the youngest by selecting only blue objects. Instead, we limited the sample to galaxies within 3.6 Mpc where the resolution of the image is about 100 pc. Thus, most young regions are resolved.
3.2 Background Subtraction
The star-forming regions sit on a diffuse disk of galactic UV emission. We needed to determine the underlying emission for each region in order to measure the photometric properties of the star-forming sites themselves. Where we could, we subtracted the mode of an annulus starting 5 pixels out from the longest radius of the defining polygon and extending another 5 pixels in radius.
However, because of the clustered nature of these sources, this was out of the question for the majority of them. There were often one or several other regions within bounds of a reasonable annulus centered on the target region. We specifically wanted to avoid subtracting one region from another, so in these cases we found several background spots close to, but separated from, the star-forming region and used the median in these regions to characterize the underlying disk. The separated background apertures identified on images were also used as background regions for the other passbands. The background emission was defined to be the median pixel value within the background region closest to the star-forming region. This median pixel value was subtracted from each pixel in the target star-forming region to get the flux from the star-forming region alone.
To check our determination of the background in the case of the separate background regions, we determined the sky using an alternate algorithm (the mode) in one galaxy, DDO 50, using the same background regions we had used with the original (median) photometry. The purpose was to ensure that the background value was not biased by the occasional star that would appear in a background region in the optical that was not there in the UV. The lack of disagreement or the presence of an offset between background values determined using the two methods suggest that our background values in separate regions are robust against this particular problem.
3.3 Photometry
After the underlying galactic disk was subtracted, we transformed the fluxes to the standard GALEX, , and 111 data were only available for one galaxy in our data set, NGC 2366. systems. The UV data are in AB magnitudes. The photometry is on the Landolt (1992) system, and the fluxes were calibrated with UKIRT standard stars (see Hawarden et al. [2001] for a discussion of near-IR photometric systems). We calculated MNUV, MV, and MJ11footnotemark: 1, as well as the colors , , , , and . The uncertainties in the magnitudes and colors reflect Poisson statistics in both the signal and in the sky.
We corrected the photometry for extinction using the same total reddening E()t as was used in our earlier study of the images (Hunter & Elmegreen 2006). The total reddening E()t is foreground E()f from Burstein & Heiles (1984) given in Table 1 plus a constant 0.05 mag for reddening internal to the dwarf galaxy. A constant internal reddening of this order for the stars is consistent with measurements of the Balmer decrement in HII regions in a sample of 39 dIm galaxies (Hunter & Hoffman 1999). There the average reddening in HII regions is 0.1, and we have taken half this to represent the stars outside of HII regions. We combined the E()t with the reddening law of Cardelli et al. (1989) to produce the extinction in each filter. For the GALEX filters, and . The photometry for all of the regions are given in Table 3, which is available in its entirety on-line, and the photometry for the regions in NGC 2366 are given in Table 4.
There are, in total, 1920 regions for all 11 galaxies. There are colors for 1913 of them; 1792 of the 1920 have colors and 43 have . We removed regions from our sample with various problems with the photometry, including photometric errors greater than 1 magnitude, contamination by foreground stars, unphysical colors, and incomplete photometry. We were left with 1623 star-forming regions with good photometry.
One reason for the incompleteness of optical and near-IR colors is that star-forming regions bright in the are not necessarily bright in the other bands, and can be lost in the galaxy background. Regions with a few thousand counts in the UV might only have a few hundred counts in . In addition, the lower the flux that a region has, the more susceptible it is to uncertainties in sky subtraction. For any of our regions with highly uncertain colors, there was a good probability that our models would be unable to find a realistic fit. That is why we removed all of the star-forming regions with any photometric errors greater than 1 magnitude.
Another factor working against the smaller regions is that they are often too faint to be seen at greater distances. While our survey is complete at a level of or mag in MV, below an MV of mag it is incomplete. For the closer galaxies, those less than 1 Mpc away, such as NGC 6822 and IC 1613, this was not a problem, but at the longer distances of Mpc this effect became more apparent. This problem is illustrated in Figure 1, where the distributions of for all of the star forming regions in NGC 6822 and DDO 50 are shown. DDO 50 at 3.4 Mpc has a higher proportion of brighter regions, probably from blending effects, and NGC 6822 at 0.5 Mpc peaks at much fainter levels.
To explore the consequences of distance on our results, we have taken WLM, which is nominally at a distance of 1 Mpc, and smoothed the images with a Gaussian kernel to the resolution we would expect at a distance of 3.4 Mpc, the distance of DDO 50. We then analyzed the smoothed images, including identifying UV-bright regions and background regions, performing the photometry, and running models. The results are shown in Figure 2 where we compare the region ages and masses as a function of radius from the original 1 Mpc images and from the pseudo-3.4 Mpc images. At 3.4 Mpc, we see fewer regions with more mass and shallower radial gradients, as expected, but general trends remain. Age-mass ratios, for example, are roughly the same. From a similar comparison of the other figures that we use in our discussion, we believe that the results for the more distant galaxies included here, particularly DDO 50 at 3.4 Mpc, are as valid as those for the closer systems, especially since our emphasis in this study is on radial trends within galaxies, rather than differences between galaxies.
3.4 Mass and Age Modeling
In order to compare star forming regions, we determine the ages and masses by finding the best model fit to the colors for each region. The model colors are from the Bruzual & Charlot (2003) model stellar populations with the “Padova 1994” stellar evolutionary tracks (Alongi et al. 1993, Bressan et al. 1993, Fagotto et al. 1994a,b). We use a Chabrier (2003) stellar initial mass function (IMF). This IMF adopts the Salpeter (1955) IMF for stellar masses above 1 M. Below 1 Mthe IMF is shallower than Salpeter’s and below 0.3 M, it flattens out. Mass-to-light ratios are of order 1.4-1.8 times smaller with a Chabrier IMF compared to a Salpeter IMF. We used the or metallicity models, whichever was closer to the metallicity expected from nebular oxygen abundances (Hunter & Hoffman 1999) or, for DDO 210 and LGS3, estimated from the mass-metallicity relationship. Thus, we used models for all galaxies except NGC 2366 and NGC 6822. We also use an exponentially decaying star formation history with a decay time of 1 Gyr for all regions. For the short ages we obtain here, this means nearly continuous star formation over the age of the region.
Our modeling program loops over age and finds model colors. For each model color we subtract the observed color and divide the difference by the uncertainty in the measured color. We then sum the square of this difference over the colors. This is a . Among all possible solutions, we then average with an exp() weighting factor to obtain a final age and mass. The uncertainties in many of our colors are sufficiently small compared to the model spectral energy distribution (SED) fits that the values were unreasonably large (often greater than 40). So, we multiplied all of the color uncertainties by a constant factor of 5 for all regions in order to get non-zero Gaussian weights. This is effectively the same as considering greater than statistical uncertainties, or systematic uncertainties, in the observations and models. In a small number of cases the method does not find a good solution at all. We considered this to be the case when 5 or fewer of the age models out of the 164 trial ages in the Bruzual & Charlot tables with ages larger than 2.3 Myr gave . We then modified our method to obtain the best possible SED fit by averaging together the trial ages and masses from only those age trials that had the lowest rms deviation between the observed and modeled colors (i.e., not dividing by the measurement errors as in the method). The weights for this average were taken to be Gaussian functions of this rms deviation, rather than . The uncertainties in the results for these cases were taken from the rms values in the averages. The final model age, mass, and rms of the fit are given for each region in Table 3.
As a test of the modeling, we tried our model on some well known clusters: NGC 104 (47 Tuc), a Galactic globular cluster, and NGC 604, a large young OB association in M33. We obtained colors for NGC 104 from Harris (1996) and measured them for NGC 604 from the Local Group Survey Data (Massey et al. 2006). We measured for both clusters from GALEX archive images. Both sources had their background light subtracted. We adopt an E() of 0.04 for NGC 104 from Salaris et al. (2007) and Harris (1996), and use models, the closest model to the metallicity of the cluster ([Fe/H], Harris 1996). We find an age of Gyrs, and a mass of for NGC 104. Our age agrees very well with recent estimates: 10–13 Gyrs (Salaris et al. 2007), 12.50.5 Gyr (Liu & Chaboyer 2000), 10.91.4 Gyr (Salaris et al. 2004), and 11.50.8 Gyr (VandenBerg 2000). Similarly, our mass agrees well with the mass of determined by Meylan (1988) from dynamics, surface photometry, and a two power-law IMF of NGC 104.
For NGC 604, based on the number of observed O stars and a Salpeter stellar IMF, the mass was previously determined to be , with an age of 3-5 Myrs (Hunter et al. 1996). For the models, we use an E() of 0.05, as adopted by Hunter et al., and a Salpeter stellar IMF. The oxygen abundance of NGC 604 is about half solar (Diaz et al. 1987, Caffau et al. 2008), so we use the Bruzual & Charlot (2003) tables with 0.4 times solar metallicity. Then, including the GALEX colors, the models give a mass of and an age of 5 Myrs. These agree with measured values to within a factor of 2. The model age and mass increase by factors of 2 and 1.3 if and colors are increased and decreased, respectively, by 0.1 mag to account for bright emission lines in the and bands.
Because our survey was based on images, it was not sensitive to red, and therefore old, things. It is doubtful that we would see modest star-forming regions much older than 500 Myrs because of this. There is also some uncertainty in the models due to the rapidly changing AGB phases for the age range of 0.3-2 Gyrs (Maraston 2005). While this problem is more pronounced in the IR than it is in the optical, between these two problems we feel that our models are reasonably accurate up to 500 Myr of age, and this is the age range we emphasize here.
Similarly, we have a lower age limit of 2.3 Myr. This is the point where the colors begin to change with population age. To start earlier than this is to say that we can actually see a cluster that is yr old, for example, and in fact, such clusters are probably obscured in the UV. There is no color and stellar evolution before this time in the models.
One additional issue merits discussion. In modeling star clusters in the Antennae galaxies, Fall et al. (2005) found a sharp-edged gap at ages of 10 Myrs. This is due to the integrated light of massive clusters at high metallicity being dominated by red supergiant stars. The cluster colors change so abruptly during this phase (8 - 16 Myrs) that the model ages become degenerate and avoid ages of 10 Myrs. This is easily understood in the “Conti scenario” of massive star evolution in which massive stars spend proportionately less of their He-burning lifetimes as RSGs rather than WRs at higher metallicities (Massey & Johnson 1998). On the other hand, we benefit from the dependence of massive star evolution on metallicity as this effect will be less pronounced in low metallicity systems (compare, for example, with in Figures 57 and 59 of Leitherer et al. 1999). Furthermore, for Fall et al. this issue introduced errors of less than 0.4 in . Thus, any gaps we see in the age distributions here are interpreted as lulls in the cluster formation rate.
4 Observed Radial Trends
With this survey we now have masses and ages for 1623 star-forming regions in 11 local group dIms. We also have a rough measure of sizes from the polygon fits. Over the range of our survey we see ages from our lower limit of several million years to our completeness limit of 500 Myrs, and masses from millions of solar masses down to just dozens of solar masses. The individual galaxies are discussed in Appendix A.
We are particularly interested in how different properties of the star-forming regions vary with radius within each galaxy, specifically mass, age, size, and number of regions per unit area. To show a few of these basic properties, for each galaxy we plot mass against age, mass against galactocentric radius, and age against radius in Figure 3. The figure shows several things: the relative abundances of star-forming regions at various masses and ages, the lower mass sensitivity limit for each galaxy as a function of age, the upper age limit for consistent detections, and the lower age limit of the models. In the plots of mass or age against radius, it is possible to see radial trends that may be present. We also show the history of star formation in equal intervals of log-age in Figure 4. This plots the total number of regions, and the number of regions more massive than the observational limit at an age of 500 Myr, and the maximum mass of the regions, all as functions of age.
We are interested in comparing the properties of star-forming regions in the inner and outer disks. We have made this division in three ways. First, we cut at the radius beyond which H emission is no longer detected. In some of our galaxies we find a significant number of star-forming regions past , and we compare the regions inside with those outside . These are shown as different colors in Figures 3 and 4. Generally there is little difference in the masses and ages for the regions inside and outside .
Second, we cut by the number of regions we identified, comparing the inner 50% of star forming regions to the outer 50%. Galaxies with few UV-selected regions beyond are displayed this way in Figure 3 as indicated by the panel labels. We show this also for NGC 6822, DDO 50, and NGC 2366 in Figure 5, where it is clear for NGC 6822 that there is little difference in the masses and ages for these two sectors. This is typically the case. DDO 50 and NGC 2366 differ, however, in that the masses are systematically lower in the outer regions, as shown in Figure 3 also.
Finally, we cut at the radius where there is a break in the broad-band surface brightness profile . Three galaxies (DDO 75, DDO 216, and M81dwA) show double exponential radial profiles: sharp changes in the rate of decline of the exponential disk seen in broad-band stellar surface brightness profiles. These breaks are seen in optical and mid-IR (3.6 and 4.5 m) passbands that emphasize all but the youngest stars and do not represent the “edge” of the disk, but rather a change in the stellar profile. The breaks do not correspond to a particular surface brightness limit, and their relationship to identified star-forming regions is inconsistent. The break in DDO 216 occurs well past where we see star-forming regions; in M81dwA there were only two identified young regions anyway; and in DDO 75 there are a substantial number of regions past the break. For DDO 75, we compare the ensemble of regions on either side of the broad-band profile break in Figure 6, showing little difference.
The last two galaxies in Figure 3 are plotted without distinction between inner and outer regions: LGS3 and M81dwA have a few UV regions but no H regions.
For galaxies with enough star-forming regions, we look at the luminosity and number of regions per unit area as functions of radius. These are shown in Figure 7. The distributions are similar to each other because the region masses, luminosities, and sizes do not vary much with radius. Figure 8 shows the summed angular filling factors of the UV star-forming regions versus radius and Figure 9 shows the region sizes (the radius of a circle that has the same area as the polygon that defines the region) measured on the images. Recall that the sizes are only estimates from the subjective polygonal outlines of the regions; the filling factors use these sizes, and are therefore only approximate as well but for looking for general trends they are adequate. The figure indicates that filling factors approach % in the inner regions. The filling factor profiles are similar to the luminosity and count density profiles because the sizes are about constant with radius. Exceptions occur for the few cases where region size or mass suddenly change at large radii, as for DDO 50, where the mass decreases and the size increases beyond 4 kpc, as compared to the rest of the galaxy. In this case the filling factor, which follows the size and the count density, drops more slowly in the outer part than the luminosity density, which follows the mass and the count density. This trend seems to be an exception, however.
The five types of radial profiles—region mass, luminosity density, count density, filling factor, and size—consistently indicate that the exponential profile of star formation, and presumably the exponential disk itself, is the result of an exponentially decreasing count of star-forming regions, each with about the same mass, luminosity, and size. The filling factor of star formation decreases too. The interpretation is that the basic star-forming unit has constant mass and luminosity throughout a galaxy disk, even beyond the edge of visible HII regions, while the star formation rate is proportional to the number density of these regions, which happens to be proportional to the local stellar surface density. The reason for the latter proportionality is unknown, but has the effect of reinforcing the existing underlying exponential profile with each addition of new stars.
There is generally a smooth continuation of radial trends beyond , which means that the loss of H does not correspond to a change in any physical process related to star formation. It is more likely an observational artifact, resulting perhaps from an HII region surface brightness that is below the detection limit in the outer galaxy. This is to be expected in a low pressure environment (Elmegreen & Hunter 2006), because of both the diffuse nature of ionization bounded HII regions at very low pressure, and the likely escape of Lyman continuum photons from the star-forming regions when the surrounding density is low.
5 Discussion
5.1 Surface Brightness Evolution
Surveys of star-forming regions are limited by surface brightness for the detection of faint extended objects, rather than by magnitude for point sources. To understand our detection limits better and to investigate the evolution of surface brightness, we determined the average surface brightness of each region, , from the magnitude on the AB scale interpolated to an arcsec angular size. For resolved regions, this surface brightness is independent of galactic distance. It has a lower limit that depends on the exposure time of the image and perhaps the de-projected galactocentric radius (because of the bias that a selected region must stand out above the surrounding disk). The lower limit should not depend on age.
Figure 10 shows the surface brightness versus galactocentric distance for four of our galaxies that have a large sample of regions. The lower limit to surface brightness depends on exposure time (Table 2): NGC 6822 has over 3.4 times the exposure time in the than the other galaxies, and a limit that is mag arcsec-2 fainter. There is no evident dependence on distance from the galaxy center in for NGC 6822, but there is a small dependence for the other galaxies in the figure. This reflects a limited bias in the selection of regions for measurement, but should not be important in studies involving age or mass correlations.
Figure 11 shows versus age for the same four galaxies. Dashed lines indicate the fading trend from the evolution of a single stellar population model, for which luminosity decreases with time approximately as (§5.2). Star-forming regions approximately follow the fading trend down to the surface brightness limit, although the distribution of points is actually steeper than this for some galaxies. This steepness suggests either a physical expansion over time for each region or a loss of mass over time, beyond the loss from stellar evolution (which is included in the fading trend). The oldest regions are all above the fading trend because of surface brightness limitations. That is, many old regions are missing from our survey, i.e., those below the surface brightness limit on the extrapolated downward trend in the figure. We have not lost proportionally as many younger regions by surface brightness fading. The dividing age is around yrs for this sample. In general, the dividing age between detection and loss from surface brightness limits depends on the exposure time and the background noise in the image (in addition to the local galactic surface brightness, as in Fig. 10).
There is an interesting size-of-sample effect in Figure 11. The upper limit to the surface brightness decreases with age much more slowly than the lower limit, indicating that most of the older regions still observed today were intrinsically brighter than the younger regions when they formed. Only the faintest observed old regions, i.e., those at the surface brightness limit, are an extrapolation of young regions along the fading trend, and then it is only the brightest young regions that can be extrapolated to fit in this way. This increase of initial surface brightness with age is a size-of-sample effect, considering that the sample size of regions in logarithmic intervals of increasing age is also increasing in proportion to the age. The older logarithmic bins include more total regions and therefore a few rare regions of intrinsically large initial surface brightness. Extrapolated back to their youth, the brightest old regions today would have had mag arcsec-2 at an age of yrs. There are no regions in our galaxies as bright as this today, although the embedded bright source in NGC 2366 would be of comparable brightness in the absence of extinction.
Figure 12 shows the region radius versus age for the same four galaxies as in Figure 11. The radius is about constant with age, suggesting very little expansion. Considering that surface brightness is from a combination of mass, luminosity-to-mass ratio, and radius, this constant radius implies that the steep decrease in surface brightness with age seen in Figure 11 is from a combination of stellar evolution fading and a loss of stellar mass. This mass loss must be in addition to supernovae and stellar winds, i.e., to normal evolutionary effects. The implication is that detected clusters have lost mass since they formed.
Figure 13 shows the fading-corrected absolute magnitude of each region in these four galaxies, versus the log of the age, . Fading correction is done by subtracting from each absolute magnitude. Recall that the luminosity of a region is proportional to the region mass, , multiplied by the light-to-mass ratio, and this latter quantity varies with age approximately as (§5.2). The luminosity is also proportional to , so it follows that , or
| (1) |
The quantity on the right is shown in Figure 13 versus . The dense clusters of points that were sloping downward steeper than the fading line in Figure 11 are now sloping upward in Figure 13, which is the direction of fainter fading-corrected magnitudes over time. A dashed line with a slope of guides the eye. A general slope on this diagram corresponds to a correlation from equation 1. As fits the distribution of points in the dense portions of Figure 13 for WLM, DDO 50, and perhaps IC 1613, the region masses there seem to be decreasing as over and above stellar evolution effects. We do not see this trend in NGC 6822. This type of mass-age relationship will also appear in §5.2 in reference to the distribution of points on the plots in Figure 3, and to the near constant counts of above-threshold regions in the age histograms of Figure 4.
Also in Figure 13 there is a long tail of points at large age with a slight downward slope. These are the overly bright old regions also discussed for Figure 11. Their distribution was flat on that diagram because they paralleled the constant surface brightness limit, and so here they decrease as by construction. We are not interested in them for this diagram, but only in the increasing trend among the denser distribution of points, which had the puzzling result in Figure 11 that it was declining faster than possible with pure evolutionary fading.
5.2 Time Dependence of Cluster Mass
Figures 3 and 4 showed the number of massive star-forming regions formed as a function of time over the past 500 Myrs. At the upper end of the range of ages in our survey, even the most massive clusters begin to drop out because of fading. The shift in minimum detectable mass goes approximately as , so this minimum mass at 500 Myrs is 5 times larger than at 50 Myrs (Hunter et al. 2003). Figure 3 shows this limit by plotting the minimum mass at 500 Myrs as a horizontal dashed line, and the slope of the mass-age relationship as a solid green line. The observed minimum mass for each age is comparable to the detection limit. The upper end of the green line in Fig. 3 is positioned at the intersection of the horizontal dashed line and the age of 500 Myrs.
Clusters are increasingly lost from our survey over time because of fading effects as the main sequence turn-off climbs down the mass function, and because of cluster disruption, stellar evaporation from the cluster, and surface brightness limits. Piskunov et al. (2006) find the average open cluster lifetime in the Milky Way to be Myrs. Boutloukos & Lamers (2003) and Gieles et al. (2006) suggest that the disruption time for a Mcluster depends on the galactic environment, including the tidal field, molecular cloud collisions, and shear rate. Boutloukos and Lamers find that the disruption time in the SMC is very long—8 Gyr, much longer than the time scale they derive for spiral galaxies, and longer than the time derived by Piskunov et al. for the Milky Way. Hunter et al. (2003) also suggest that clusters in the LMC and SMC have long disruption times.
The number of clusters per unit age in each mass interval decreases like , which in a mass-age diagram like Figure 3, means that the density of points is approximately constant along horizontal strips (Fall, Chandar, & Whitmore 2005). This constancy is also evident in Figure 4 as a nearly flat histogram of cluster counts above the threshold mass limit. Such a time depletion implies that clusters are losing mass or getting disrupted constantly. In addition, the mass function of clusters in the LMC remains a power law for all observed times (Elmegreen & Efremov 1997; Hunter et al. 2003), with no preferred loss of low mass clusters in older age groups. In the case where each cluster loses mass like , which is one way to give the observed distribution on the mass-age plane, the lack of a low mass turnover in the cluster mass function implies that the lowest mass clusters are lost from the survey because of fading limitations, and not disruption. Because the galaxies in the present survey are dwarf irregulars with internal tidal forces like those in the SMC and LMC, and because brightness limits are higher for the present survey than for the LMC and SMC, we expect that fading is the dominant cause for the loss of low mass clusters in the present survey too. If physical disruption were the cause instead, then there would be a gap between the lowest mass cluster for each age on the mass-age plane, and the fading limit. There is no such gap in Figure 3.
In another interpretation of cluster evolution, clusters keep their mass for a time and then get disrupted suddenly, perhaps in a GMC collision. In this case, the disruption probability per unit time should decrease with time as to get a constant number per unit in fixed intervals of mass, as suggested by the distribution of points on the massage plane.
Our observations cannot distinguish between these two mechanisms of physical cluster loss, i.e., between mass loss from each cluster with cluster mass , or sudden cluster loss with a disruption rate . In both cases, the loss mechanisms have to be independent of cluster mass if the mass function has the same power law slope for all ages. The first mechanism cannot be simple evaporation because evaporation gives a constant cluster loss rate, constant for a constant cluster density (as determined by tidal effects, for example; Baumgardt & Makino 2003). To have for each cluster, we need an evaporation rate or , which is not the way evaporation works. The second mechanism cannot be simply cloud-cluster collisions in the usual model because the survival probability in a random ISM scales with time as , from Poisson statistics.
The discussion in §5.1 suggests that some individual region masses decrease with time as . There may be some sudden disruption of regions too, with probability , but we cannot see that in our data (we know nothing about when the regions that have been disrupted were disrupted).
A schematic model for mass loss by fading below the surface brightness limit of a survey is shown in Figure 14. The two Gaussian curves represent projected profiles through two clusters having the same total mass. One cluster is bright and the other is dim and slightly larger in radius. The horizontal red line is the surface brightness limit, which is above the outer envelopes of the clusters. The green curves are the running masses measured only above the surface brightness limit. They increase from left to right as the cumulative cluster masses increase from left to right in the projected images. These running masses are given by for position and starting position on the left in the diagram. The intensity in the integral, is taken to be zero for the parts of the cluster below the surface brightness limit, and the actual cluster intensity for parts of the cluster above the surface brightness limit. The dispersion of the bright cluster is 1 on this scale, and the dispersion of the dim cluster is , designed to make the two clusters have the same size out to the surface brightness limit. This satisfies the constraint suggested by Figure 12 that clusters do not appear to expand much with age. In fact, if we identify the faint cluster in Figure 14 as an old cluster, then it has expanded with age, but at the same time as it has faded, leaving the apparent size at the surface brightness limit about constant. The point of Figure 14 is that two clusters with the same total mass can have two different measured masses if only those parts of the cluster that are above the surface brightness limit are measured. Cluster fading then automatically causes a measured mass loss over and above stellar evolution effects. This mass loss is not the same as stellar evaporation because the missing stars are still near the cluster and maybe even bound to the cluster. They are just in the faint, unobserved, envelope.
Several of our galaxies have peaks in the number of star-forming regions as a function of time, as well as peaks in the number of massive regions and in the maximum mass of clusters. From a study of integrated H equivalent widths of a large sample of dwarfs, Lee et al. (2007) conclude that dwarf galaxies should experience 1-3 starbursts per Gyr. These bursts should have a duration of 50-100 Myrs and an amplitude of 6-10 times the star formation rate of the quiescent period. McQuinn et al. (2009) have found large-scale bursts of duration 200–400 Myrs in several nearby dwarfs, with smaller scale “flickering” on timescales of 3–10 Myrs. In our sample we see two gaps of duration 60 Myrs and 1300 Myrs over the past 1 Gyr in NGC 6822. The enhanced cluster formation episode centered on an age of 1 Gyr, for example, lasted about 470 Myrs. Thus, the history of cluster formation in NGC 6822 has been roughly consistent with the findings of these studies. However, in 6 other systems in our sample, cluster formation appears to have been roughly constant until 9–50 Myrs ago, with few or none formed since then. Three galaxies show no obvious gaps in cluster formation over the past 500 Myr.
5.3 Comparing Inner and Outer Galactic Disks: The Lack of H
We see no consistent change with radius in the average mass or size of star-forming regions for each galaxy. Regions beyond have masses as high as (1.8 for the globular cluster in WLM, and (3 beyond in NGC 6822. This lack of a mass gradient is consistent with the lack of any changes in the UV radial surface brightness profiles at the point where H ends (Boissier et al. 2007). Exceptions are DDO 50 and NGC 2366, which show the clearest gradients in region mass. DDO 50 and NGC 2366 are compared to a more standard case, NGC 6822, in Figure 5. Mass and age histograms are plotted for each galaxy, with the inner and outer half of the regions separated for comparison. The median log (mass) for NGC 6822 is only 0.12 larger in the inner half than the outer half, while the median log mass is 0.25 larger in the inner parts of DDO 50 and NGC 2366 than the outer parts. The median ages are slightly younger in NGC 6822 and NGC 2366 and slightly older in DDO 50 in the outer halves.
H becomes invisible in the outer parts of galaxy disks even though we find normal star formation there. For DDO 210, there is no H emission even though there is one region younger than 10 Myr. There are many reasons why H should disappear when star formation continues, including a lack of massive stars due to old cluster age or a steep IMF (see, for example, Pflamm-Altenburg & Kroupa 2009), an escape of Lyman continuum photons from the vicinities of the O-type stars, and a undetectable surface brightness for the ionization-bounded HII region. The age gradient explanation is difficult to reconcile with our observation of a nearly constant age with radius, and that, along with possible IMF variations, are also in conflict with the observation of a normal exponential UV profile. The UV exponential implies that the onset of star formation in the outer disk is in the same proportion to the surrounding stars as in the inner disk, and in a steady state, this implies that the evolution of O-stars off the main sequence is in the same proportion too. Thus the fraction of star-forming regions in each stage of evolution should be independent of radius, as should the IMF, and this means that the fraction that produce H is constant too. An exception might occur if the outer regions had a burst of star formation at just the right time in the past to have all of the associated O-type stars now evolved off the main sequence. This is unlikely for all of the galaxies here.
Escape of Lyman continuum radiation from the vicinity of the O-star can explain the lack of H whether or not those photons escape the galaxy. H emission disappears when the ionizing radiation from a massive star spreads out over a large volume and the emission measure becomes undetectable. Considering that the quantity cm-2 pc for an O-type star (Vacca et al. 1996) with HII region electron density and radius , and that the density in the ambient interstellar medium should be cm-3 or lower in the outer regions of most galaxies, a typical HII region radius would be pc and the corresponding emission measure would be cm-6 pc, which is undetectable in our survey by a factor of 3–40. The limit of our detection for emission measure is 5.3–74 pc cm-6 (Youngblood & Hunter 1999), which corresponds to a minimum density of 0.4–1.4 cm-3 at this ionization rate. Lower densities, particularly off the midplane, would make even larger than several hundred pc, and then the Lyman continuum photons could escape the galaxy completely.
5.4 Trends in Recent Cluster Formation Histories
Our dIm galaxies fall into one of three categories describing the overall recent star formation histories of the past 500 Myrs:
Star formation with gaps. These galaxies take two forms. First, NGC 6822 is an example of periodic spikes in star formation over a finite duration, and it has made regions as massive as . The most recent gap in cluster formation occurred around 100 Myrs ago and lasted about 60 Myrs. The second form are those galaxies with an apparent cessation in cluster formation in recent times. These galaxies include DDO 50, DDO 70, DDO 216, and WLM. The recent gap began 9 (DDO 60 and DDO 75) to 25 (WLM) Myrs ago. DDO 70 and DDO 75 sit in between these two types: They appear to have had a fairly constant level of star formation for the last several hundred million years until about 10 Myrs ago. In the past 10 Myrs only a few clusters have formed. In addition, clusters older than about 200 Myrs are missing except for a few especially massive ones: clusters up to M in mass.
Constant star formation. These galaxies appear to have had a reasonably steady, nonzero rate of star formation over the last 500 Myrs. They make a region on the order of once every 10 Myrs. They make a mass cluster about once every 100 Myrs, and some have managed a region at some time in their recent past. Galaxies in this category include IC 1613 and NGC 2366.
Nearly no star formation. These galaxies show up as little smudges barely above the background sky on our GALEX images. LGS3 is our archetype for this category, with only 6 useable regions in the last Gyr, all only a few 100 M. We also include DDO 210, as we found only 9 useable regions, none of which were more massive than ; none of the 5 from the last 500 Myrs was more massive than . We also include M81dwA in this category; this galaxy has only two measured regions. These three galaxies are also the only galaxies in our survey that show no measurable HII regions.
5.5 Gas Densities in the Outer Disks: Sub-threshold Star Formation
We examined the HI gas density at the star forming region that is furthest from the center for each of the five galaxies with HI maps. Using gas surface density radial profiles, we calculated the azimuthally-averaged HI density in . These values are presented in Table 5. There is a range in gas surface density at the radius of the farthest star-forming region, , from 1.4–4.4 (1.9–5.9, corrected for He) . Schaye (2004) suggests that the threshold for star formation is a surface density of 3–10 HI atoms cm-2, or roughly 2.4–8 . Hunter et al. (2001) find that 2–8 is required for star formation as defined by HII regions in NGC 2366. The values of found here are at best at the low end of these previous limits in three of the galaxies. The furthest star-forming regions are not incredibly massive, but high masses are not expected for single-member populations (i.e., furthest regions), according to the size of sample effect (§5.6). Still, there is star formation at low average gas column densities. One possibility is that there is a large amount of cold molecular material in outer dwarf disks. Galliano et al.(2003) find that in NGC 1569 there is a significant millimeter excess, perhaps indicating extensive cold (5-7 K) dust that may make up 40-70% of the total dust mass of the galaxy. If this dust is real, then this is perhaps evidence of pervasive cold molecular material. Alternatively and more likely, the star-forming regions may be at places where the local gas density is significantly higher than the average surroundings (Schaye 2004; Elmegreen & Hunter 2006). The problem then is to determine the mechanism of cloud formation in sub-threshold gas.
Most of the far outer star-forming regions in spiral galaxies shown by Thilker et al. (2007) are in spiral arms. Gaseous spirals can propagate much further out in a disk than stellar spirals because the gas spirals do not get absorbed at the outer Lindblad resonance like the stellar spirals do. Thus there is a natural explanation for cloud formation in outer spiral disks that is connected with compression from gaseous density waves. The far-outer regions in dwarf Irregular galaxies are not aligned in spiral arms, however, so this explanation does not apply here. There has to be another source of compression for Irregulars that is consistent with the continuation of the exponential disk. This exponential constraint would seem to rule out random extragalactic cloud impacts or minor mergers, which would trigger star formation in a more irregular way. There is also little evidence for supersonic turbulence in far-outer disks, so the compression from that would seem to be small. For example, the HI line widths in outer disks could be largely thermal at several thousand degrees Kelvin, i.e., from a nearly pure warm phase (Young & Lo 1996, Young et al. 2003, de Blok & Walter 2006).
An interesting possibility is that star formation is triggered by gravitational instabilities in the outer disk, just like it is thought to be triggered in the inner disk. This can occur in subthreshold gas if the angular momentum from a growing perturbation is removed. The Toomre Q threshold applies only when perturbations conserve angular momentum (Elmegreen 1987). With magnetic tension or viscosity that can remove angular momentum from a growing perturbation as it tries to spin up, the disk is always unstable even at large . What changes is the growth time, which becomes long at large , in rough proportion to the viscous time or magnetic damping time (Elmegreen 1991; Gammie 1996). If the viscous and damping times are approximately equal to the crossing time through the thickness of the disk, which is true for equipartition magnetic fields and turbulent damping, then there should be no sharp transition at the radius. The instability growth time would increase steadily with radius in proportion to the disk thickness crossing time, and this would always give some level of instability for cloud formation. Previous observations of a threshold, based on a drop in H emission, would then be an artifact of low emission measure and Lyman continuum photon escape, as discussed above.
5.6 Size-of-Sample effect: Region Masses
Large samples of star-forming regions are more likely to contain rare massive members than are small samples. This should be true for any subsample of a collection too. If the mass distribution function of star-forming regions is , which is usually the case, then the mass of the most-massive region should increase linearly with the number of regions. Previous discussions in this paper illustrated numerous examples of this size-of-sample effect. Figures 15 and 16 show two results related to the size of sample effect: a trend in the maximum mass of a star-forming region in a radial interval versus the surface density of regions (Fig. 15) and a trend versus the total number of regions (Fig. 16) in that interval. In both cases, there is a positive correlation such that the most massive regions are also where the surface density and total count are highest, which tends to be the inner part of a galaxy. The clearest correlations have a slope of about unity. This figure illustrates an effect where the star-forming regions in the outer part of a galaxy tend to be lower mass than those in the inner part, not because of a physical change with radius, but because the total count of regions in the outer part is smaller.
We are also interested in whether the size-of-sample effect applies when comparing one galaxy to another. Figure 17 shows the maximum region mass plotted as a function of the total number of regions extrapolated down to a mass of , which is the lowest observable minimum mass for all of our galaxies. If the observable minimum for a particular galaxy is higher than this, then the extrapolated count is taken to equal the count higher than multiplied by the ratio . This would be the extrapolated count in the case when the mass function is . The figure shows a nice correlation with a slope of unity, as expected for the size-of-sample effect. Thus galaxies with more massive star-forming regions are the ones with more total regions (e.g. Billett, Hunter, & Elmegreen, 2002; Whitmore 2003). The galaxies have these massive regions only because the star-formation process is able to sample further into the tail of the region mass distribution function. This result implies that star formation operates with universal physical processes that are stochastic in nature. Of course, the specific region masses are determined by these processes, but the mixture of possibilities is so large that the mass distribution function is essentially random when it is observed as an ensemble.
The one exception in our study seems to be the super star cluster in NGC 2366, which is relatively unaccompanied by lower mass clusters (§A.6). This giant cluster could either have been formed by a completely different process, one that does not give the same mass distribution function as the main process, or it could have grown to its current mass by coagulation of lower-mass clusters. Models of cluster coalescence are in Elmegreen et al. (2000) and Fellhauer & Kroupa (2002).
6 Summary
With the small size of dwarf galaxies comes low surface brightnesses and low densities. Yet despite these apparent impediments to star formation, we see dwarf galaxies actively forming stars, sometimes in dramatic starbursts. We also see star formation in the far outer parts of dwarf galaxies, where the conditions are even more extreme. Here we identified star-forming regions in nearby dwarf galaxies on UV images in order to study their properties as a function of galactocentric radius and from galaxy to galaxy.
We measured the ages and masses of the more prominent star-forming regions in 11 nearby dIm galaxies. We were able to define 1623 useable regions on GALEX images. We see star forming regions that run the gambit from tens to millions of solar masses, and we were able to find regions as young as our lower limit of several million years to our completeness limit of 500 Myrs. Within our sample of galaxies we see stark differences from one to the next. For example, our closest galaxy has at least 713 star-forming regions, while our next closest galaxy has only 5. Still, for all of our galaxies, the maximum region mass scales linearly with the total number of regions, and within each galaxy, the maximum mass in a radial annulus scales linearly with the local number in that annulus. Both trends indicate that star formation mass is independent of local environment and even the surrounding galaxy mass, but is given by random sampling from a universal mass function that is of the usual form .
We find that our galaxies fall into three categories describing cluster formation activity over the past 500 Myrs: star formation with gaps, nearly constant star formation, and little-to-no star formation. The cases with gaps include some with occasional spikes in the star formation rate, and others with a cessation of star formation in the last 10 to 25 Myr.
There is no consistent, measurable radial dependence for ages and masses of star-forming regions. The exceptions, DDO 50 and NGC 2366, show a trend towards lower masses at greater radii, but even there we see massive regions on the edges of the optical galaxies. Generally there is no indication that dwarf Irregular galaxies are less capable of producing massive star-forming regions in their outer disks than in their inner disks. Still, the regions in the outer disk often have no discernable H emission. This is presumably the result of the low density there, which makes H in the vicinity of massive stars very difficult to observe.
These little galaxies have in the past presented many quandaries as to how something so small and sparse can form stars, and now it looks like they are forming stars in areas even more extreme than was previously believed possible from other surveys. This is consistent with a picture in which localized processes form stars in most regions of dwarf galaxies. At locations where the average gas surface density is much smaller () than the fiducial critical value, we still see star formation. The detailed reasons for this are unknown. There are no spiral distributions for this star formation as there are in the outer parts of large spiral galaxies, so we cannot identify spiral wave compression as a primary cloud formation mechanism. It could be that all of the outer galaxy star formation and much of what happens in the inner region too, is triggered locally, by stray supernova, for example, or by the turbulence that supernovae and other energy sources drive. It could also be that large-scale gravitational instabilities operate everywhere, even in sub-threshold gas, because of an easy transfer of angular momentum away from growing density perturbations. In that case, the collapse rate could be smaller than the local dynamical rate, more like the angular momentum loss rate, but the final result for the scale and properties of star formation could be the same. High resolution observations of the gas in these regions should clarify this picture.
The star forming regions in our survey also offer some insight into the evolution of measureable mass with age. The distribution of regions on a versus diagram is somewhat uniform over age for equal intervals of mass . This uniformity suggests that the regions are being removed from our view systematically with age. This loss is consistent with a model in which each individual region mass is decreasing as . It is also consistent with another model in which each region mass is constant until that region is suddenly disrupted, and the disruption probability is proportional to . Both possibilities could happen simultaneously too. We cannot say anything about the regions that have been disrupted, but we note from a trend in the age dependence of surface brightness that measured masses may in fact be decreasing as . This result is illustrated most clearly in a diagram of fading-corrected absolute magnitude versus the log of the age. A correlation in this diagram has a slope consistent with . The implication is that the outer parts of star-forming regions are getting lost from our view as they slip below the surface brightness limit of the survey. This is a loss of mass over and above stellar evolutionary effects (supernovae and winds) and in addition to evaporation. We are investigating all of these mass loss processes in more detail in a second paper.
Appendix A Individual galaxies
The UV-bright knots identified in each galaxy are outlined in Figure 18. Here we discuss the properties of the ensemble of regions in each galaxy.
A.1 NGC 6822
NGC 6822 is the closest galaxy in our survey (0.5 Mpc). Because of this, we were able to identify 800 individual star-forming regions, 713 of which made it into our final data set. With this galaxy we were able to trace the star forming regions to much lower luminosity levels than in any other galaxy. A problem arises because of the galaxy’s large angular size (about 15′15′), which led to field star contamination at this low galactic latitude.
NGC 6822 has star-forming regions ranging in mass from 15 to , and ranging in age from several Myrs to well beyond the 500 Myrs that is emphasized in the UV. The lower mass limit of a star-forming region that should still be visible after 500 Myrs is in this galaxy. Figure 4 suggests that star formation has occurred in two or three major episodes. These episodes appear as peaks in the number of all clusters detected and in the number of clusters detected with masses larger than our adopted lower mass limit. They also appear as peaks in the mass of the most massive cluster as a function of age. The episodes occur for logarithmic ages between the present and 7.5, between 8.12 and 8.78, and after 9.28. We refer to these as the 7 Myr, 100 Myr, and 1 Gyr bursts.
In the most recent star formation event at 7 Myr, there are 3 clusters more massive than . The most massive cluster in this event is . In the event at 100 Myr, there are 7 regions of mass , with the most massive of these having a mass of . In the older burst at 1Gyr, which may not be complete in time and is certainly not complete to our adopted lower mass limit, we see 54 regions of mass , with the most massive having a mass of . The oldest age burst is old enough that all of the clusters below have faded, and we see this in the lower mass limit of the regions we identified.
We can estimate the apparent relative formation rates of star-forming regions from the counts of regions on the time axis. For the 7 and 100 Myr bursts, the apparent region formation rates with , obtained from the counts per unit time interval, are 0.1 and 0.01 massive regions per Myr, respectively. These are the apparent and not the real formation rates because many clusters have been lost from their original mass intervals through disruption and evaporation.
For a mass function of the form , the total number of initial regions should be equal to the ratio of the maximum region mass to the minimum region mass. This is one aspect of the size-of-sample effect. If we consider a minimum detectable mass to be , then the number of regions above this mass should be proportional to the maximum region mass if the disruption probability is independent of mass (e.g., as observed by Chandar et al. 2009). From the pure counts of clusters above , the proportion in the two most recent bursts is 1:2.3, and from the maximum masses, the proportion is 1:3.5. These proportions are close enough to each other to agree with the predictions of the size of sample effect, considering the small numbers of massive clusters. (fractional errors in the counts are 60% and 38%, respectively, from the inverse square roots of the number of massive regions).
Fall et al. (2005) consider the mass-age diagram for the Antenna galaxy and note that generally the number of clusters above a certain mass in equal log intervals of time is about constant with time, which means that the number of clusters remaining per unit age interval decreases as . In our sequence of ages, the counts per unit time, 0.1 and 0.01 regions Myr-1 are indeed roughly proportional to the inverse of their ages (7 and 100 Myr). This implies that clusters of all masses are becoming increasing lost over time. Such loss could be from a combination of the two processes as discussed in §5.2, and from the surface brightness effects discussed in §5.1.
From to and from to , periods of 46 Myr and 1300 Myr, there are lulls in the star formation rate. In the first interval, no regions of form and the maximum mass drops down to . In the second interval, no regions were formed as massive as the periods on either side, but the maximum mass is . In the bursts before and after these lulls, the maximum cluster masses were higher by factors of and the total numbers of clusters remaining were higher by factors of . Thus we are seeing oscillations in the cluster formation rate by a factor of order in both the cluster counts and the maximum cluster mass. This type of variation is consistent with Lee et al.’s (2007) prediction.
The time intervals of the peaks and lulls decrease toward the present time. This appears to be the result of star formation with a clustered or hierarchical structure in time (for models of such star formation, see Elmegreen & Scalo 2006). Cluster bursts of short duration that occurred long ago would appear blended in time because our time resolution cannot resolve the small subbursts, while cluster bursts of the same intrinsic width that occurred recently can still be resolved. The time resolution increases in proportion to a power of the cluster age because the cluster colors evolve with a power law time dependence.
Figures 3 and 4 suggest that the recent formation of massive regions in NGC 6822 is more prominent in the outer part of the disk, beyond . The left-hand part of Figure 4 also suggests that most of the young regions, regardless of mass, are outside . In fact 468 of this galaxy’s 713 star-forming regions fall outside of , which is far more than we see in any other galaxy in our survey. This is consistent with the distribution of blue stars (Komiyama et al. 2003).
A.2 IC 1613
IC 1613 is our third nearest galaxy at 0.7 Mpc, and second most populous galaxy with 342 useable star-forming regions. Because it is nearby, we were able to trace the star-forming regions to masses as low as . The minimum mass for which we should see all currently definable star-forming regions from the last 500 Myrs is approximately , as indicated by the dashed horizontal line in Figure 3. The maximum mass formed is of order . In IC 1613 there has been more-or-less continuous star formation over the last 1 Gyr. The apparent formation rates of massive star-forming regions ( for IC 1613) from log age of 7.0 to 8.5 is 0.03 regions Myr-1.
IC 1613 has an H profile that ends before the UV star-forming regions end. The H only extends to a radius of 7.5′ from the center of the galaxy, and we see star-forming regions in the UV out to a radius of 9.3′. There are far more massive regions inside than outside. The clusters beyond tend to be lower mass with a few notable exceptions among the oldest identified clusters.
A.3 WLM
Wolf-Lundmark-Melotte (WLM) was the third most populous galaxy in our survey with 191 regions marked, 165 of which made it into our final data set. Its distance was typical at 1.0 Mpc. This galaxy is distinct in having the oldest average star-forming regions in all our sample. The cluster formation rate appears to have been relatively constant until it stopped about 22 Myrs ago. The minimum detectable mass at 500 Myrs is about .
This galaxy has a large fraction of star-forming regions beyond : 31 out of the total 165. UV regions are seen to a radius of 7.4′, while H drops out beyond 4.2′. In Figure 3, there appears to be a slight drop in the mass beyond , amounting to a factor of .
A.4 DDO 50
DDO 50 was the second most distant galaxy in our survey at 3.4 Mpc, but we were still able to define 169 regions, 139 of which made it into the final data set. Had this galaxy been located as close as WLM, from the number of massive regions we see now and our experiments with WLM images, we might expect to have identified 520 regions instead of only 169. Cluster formation in this galaxy appears to have been relatively constant until about 9 Myrs ago. However, there is a small enhancement in the numbers of massive clusters 23-30 Myrs compared to the period of time before that. The most massive cluster we identified is M.
Because H extends nearly as far as star formation seen in the UV (4.1′ for H and 5.1′ for the UV), we found only 10 regions beyond . The outer regions sample the full distribution of masses despite the small sample size, but they tend to be a little lower in mass on average compared to those in the rest of the galaxy.
A.5 DDO 75
DDO 75, also known as Sextans A, is another populous galaxy (119 useable regions) at a moderate distance (1.3 Mpc). One of the unusual characteristics of this galaxy is that its azimuthally-averaged -band and 4.5-micron surface brightness profiles do not fall off at a constant exponential rate. Instead, we see a flat profile in the inner 1.8′ radius (0.7 kpc), followed by a normal exponential decay curve beyond that (Hunter & Elmegreen 2006). To investigate whether the break in the profile represents a change in star formation characteristics, we compare the regions interior and exterior to the break in Figure 6. We plot mass versus age for the inner and outer disks in the top part of the figure, the number of regions in radial intervals of 0.25 arcmin versus radius in the bottom left, and the average versus radius in the bottom right. In none of these plots do we see a significant change in the star-formation characteristics at the surface brightness break. There is a peak in the surface density of star-forming regions at the break, but no obvious change in region properties. This result implies that the processes creating the break in the exponential -band surface brightness profile do not affect the masses or the ages of the star-forming regions. Most of the regions, and all of the massive regions, formed inside , so in Figure 3 we present a comparison of the inner half of the star-forming regions to the outer half.
DDO 75 appears to have had a fairly constant level of star formation for the last several hundred million years until about 9 Myrs ago. In the past 9 Myrs only one cluster has been formed. Furthermore, clusters older than about 200 Myrs are missing except for a few especially massive ones: clusters up to M in mass.
The apparent formation rate above the detectable mass limit of for ages between 9 Myr and 200 Myr was Myr-1. The maximum cluster mass is . This steady low rate is consistent with the global view of the galaxy from HST images and color-magnitude diagram fitting (Dolphin et al. 2003).
A.6 NGC 2366
NGC 2366 is among the more distant galaxies in our survey, at 3.2 Mpc, but despite this we were able to define 66 regions, 58 of which were useable. This galaxy also has data. NGC 2366 contains the most massive star cluster in our combined sample, one with . A second cluster has a mass of . These two regions are I and II, respectively, in Drissen et al. (2000). Drissen et al. split cluster I into two subclusters, A and B, but this divide was not discernible in our GALEX images, most likely because IA is still completely enveloped in dust and gas. Drissen et al. find ages of 10 Myrs for cluster II, 2.5-5 Myr for cluster IB and an age less than 1 Myr for cluster IA. Our ages are significantly older for both regions, 40 Myrs for cluster II and 700 Myr for cluster I. Our older ages may be due in part to our underestimating the reddening, which leads to intrinsic colors that are too red. Another factor is the relative sizes of the apertures we used. Our larger apertures encompassed the entire complexes, including outlying cluster members. Billett et al. (2002) also looked at cluster I, or at least two smaller chunks of it. They re-examined IB from Drissen et al. and what they called cluster 1, both of which were given radii of 4.6 pc – much smaller than the 200 pc radius used for the whole complex here. They also find for cluster IB and for cluster 1, as compared to for the whole complex here.
The minimum mass for which we expect completeness up to 500 Myrs of age is , about the same as for DDO 50. The number of clusters more massive than this is also about the same in these galaxies (21 for NGC 2366 and 31 for DDO 50), and the most massive cluster is extremely massive in both: in NGC 2366 and in DDO 50. A surprising difference is that NGC 2366 has far fewer low mass clusters in the 10 Myr to 100 Myr age interval, 19 smaller than in NGC 2366 compared to 93 of this mass in DDO 50. The cluster mass function is apparently flatter in NGC 2366, or more concentrated in its most massive two clusters. This difference could be the result of cluster coalescence in NGC 2366, which would explain both the lack of low mass clusters and the excessive mass of the largest cluster in that galaxy. Cluster coalescence was shown to be reasonable for another cluster in NGC 6946 (Elmegreen, Efremov & Larsen 2000).
This galaxy has only one region beyond . We present instead a comparison of the inner half of the star-forming regions to the outer half in Figure 3. We see several low mass, young star-forming regions in the outer half that are absent in the inner galaxy, and in the very outer galaxy (past 4 kpc radius) we see no massive regions. NGC 2366 is a good example of a galaxy with a gradient in the star formation region mass. Inside 4 kpc, the regions are uniformly distributed.
A.7 DDO 70
DDO 70 is a small galaxy (47 useable regions) at a moderate distance (1.3 Mpc). It has had steady, slow star formation over the last 200 Myrs, with peak masses of only . Like DDO 75, DDO 70 has formed only a few clusters over the past 10 Myrs and only a few clusters before 200 Myrs ago. There are no star-forming regions found beyond , and so no comparison can be made between the galaxy interior and exterior to . A plot of age versus mass is presented in Figure 3 with regions color-coded according to the inner 50% and the outer 50% of regions.
A.8 DDO 216
DDO 216 is a very faint little galaxy. Despite its relatively low distance (0.9 Mpc), we were able to identify only 34 regions, 25 of which have made it into the final data set. This galaxy has a double exponential -band surface brightness profile: The profile interior to a radius of 5.4′ drops at one rate, and the profile exterior to that radius falls off at a faster rate. However, there are no UV-identified star-forming regions beyond a radius of 5.4′; our furthest region was only 3.0′ radius from the center of the galaxy (deprojected distance).
DDO 216 has had very little star formation over the last 20 Myrs, but before that there was a steady stream of modest star formation back to at least 500 Myr. The lack of young star clusters accounts for the small cutoff radius, (which is 1.3′), and consequently most of the UV-detected star-forming regions are exterior to : 14 of 25 are beyond . The only difference in the regions inside and outside is that those outside extend to older ages. We see no difference in the minimum age or maximum mass of clusters inside and outside of , as shown in Figure 3.
A.9 DDO 210
DDO 210 is a tiny little wisp of a galaxy. It is the second faintest galaxy in our sample at an of , significantly fainter than some of our super massive star clusters. Furthermore, this galaxy has no HII regions. Because of its extreme faintness, and despite its relative proximity (0.9 Mpc), we were able to find only 24 regions in the image, and only 9 of those made it into the final data set. Of these nine regions, one is less than 10 Myrs old, and 6 are 100 Myrs old or older. The lack of H for the youngest regions reinforces our suggestion elsewhere in this paper that H is too faint to see despite the likely presence of ionized gas. Figure 3 separates the regions into the inner 50% and outer 50%.
A.10 LGS3
LGS 3 has only 7 definable regions, 5 of which were useable. This was the second closest galaxy in our survey at a distance of 0.6 Mpc, so we should be able to see any star formation that might have been there. Despite these favorable conditions we still see nearly no star formation over the last billion years. This galaxy has no measurable HII regions.
A.11 M81dwA
For this tiny little galaxy we were able to find only three star-forming regions, two of which were useable. M81dwA is the most distant galaxy in our survey at 3.6 Mpc. The two regions we do see are reasonably large, but between the two of them, they compose almost the entire galaxy in the . This is another galaxy without any measurable HII regions. As we have only two data points, statistical comparisons are not possible.
References
- Alongi et al. (1993) Alongi, M., Bertelli, G., Bressan, A., Chiosi, C., Fagotto, F., Greggio, L., & Nasi, E. 1993, A&AS, 97, 851
- Bastian et al. (2005) Bastian, N., Gieles, M., Lamers, H. J. G. L. M., Scheepmaker, R. A., & de Grijs, R. 2005, A&A, 431, 905
- Baumgardt & Makino (2003) Baumgardt, H., & Makino, J. 2003, MNRAS, 340, 227
- Billett et al. (2002) Billett O., Hunter D., & Elmegreen B. 2002, AJ, 123, 1454
- Boissier et al. (2007) Boissier, S., et al. 2007, ApJS, 173, 524
- Boutloukos & Lamers (2003) Boutloukos, S. G., & Lamers, H. J. G. L. M. 2003, MNRAS, 338, 717
- Bressan et al. (1993) Bressan, A., Fagotto, F., Bertelli, G., & Chiosi, C. 1993, A&AS, 100, 647
- Burstein & Heiles (1984) Burstein, D., & Heiles, C. 1984, ApJS, 54, 33
- Bruzual & Charlot (2003) Bruzual, G., Charlot, S. 2003, MNRAS, 344,1000
- Caffau et al. (2008) Caffau, E., Ludwig, H.-G., Steffen, M., Ayres, T. R., Bonifacio, P., Cayrel, R., Freytag, B., & Plez, B. 2008, A&A, 488, 1031
- Cardelli et al. (1989) Cardelli, J. A., Clayton, G. C., & Mathis, J. S. 1989, ApJ, 345, 245
- Chabrier (2003) Chabrier, G. 2003, PASP, 115, 763
- Chandar et al. (2009) Chandar, R., Fall, S.M., & Whitmore, B.C. 2009, submitted to ApJ
- deBlok & Walter (2006) de Blok, W. J. G., & Walter, F. 2006, AJ, 131, 363
- de Grijs & Anders (2006) de Grijs, R., & Anders, P. 2006, MNRAS, 366, 295
- Diaz et al. (1987) Diaz, A. I., Terlevich, E., Pagel, B. E. J., Vilchez, J. M., & Edmunds, M. G. 1987, MNRAS, 226, 19
- Dolphin et al. (2003) Dolphin, A. E., Saha, A., Skillman, E. D., Dohm-Palmer, R. C., Tolstoy, E., Cole, A. A., Gallagher, J. S., Hoessel, J. G., & Mateo, M. 2003, AJ, 126, 187
- Drissen et al. (2000) Drissen, L., Roy, J.-R., Robert, C., Devost, D., & Doyon, R. 2000, AJ, 119, 688
- Elmegreen (1987) Elmegreen, B.G. 1987, ApJ, 312, 626
- Elmegreen (1991) Elmegreen, B.G. 1991, ApJ, 378, 139
- Elmegreen et al. (1997) Elmegreen, B.G. & Efremov, Y.N. 1997, ApJ, 480, 235
- Elmegreen et al. (2000) Elmegreen, B.G., Efremov, Yu.N., & Larsen, S., 2000, ApJ, 535, 748
- Elmegreen & Scalo (2006) Elmegreen, B.G., & Scalo, J.S. 2006, ApJ, 636, 149
- Elmegreen & Hunter (2006) Elmegreen, B.G., & Hunter, D.A. 2006, ApJ, 636, 712
- Fagotto et al. (1994a) Fagotto, F., Bressan, A., Bertelli, G., & Chiosi, C. 1994a, A&AS, 104, 365
- Fagotto et al. (1994b) Fagotto, F., Bressan, A., Bertelli, G., & Chiosi, C. 1994b, A&AS, 105, 29
- Fall et al.. (2005) Fall, S. M., Chandar, R., Whitmore, B.C. 2005, ApJ, 631, L133
- Fellhauer & Kroupa (2002) Fellhauer & Kroupa 2002, MNRAS, 359, 223
- Gammie (1996) Gammie, C.F. 1996, ApJ, 462, 725
- Galliano et al. (2003) Galliano, F., Madden, S. C., Jones, A. P., et al. 2003, A&A, 407, 159
- Gieles et al. (2006) Gieles, M., Portegies Zwart, S. F., Baumgardt, H., Athanassoula, E., Lamers, H. J. G. L. M., Sipior, M., & Leenaarts, J. 2006, MNRAS, 371, 793
- Harris (1996) Harris, W. 1996, AJ, 112, 1487
- Hawarden et al. (2001) Hawarden, T. G., Leggett, S. K., Letawsky, M. B., Ballantyne, D. R., & Casali, M. M. 2001, MNRAS, 325, 563
- Hunter et al. (1996) Hunter, D. A., Baum, W. A., O’Neil, E. J., Jr., & Lynds, R. 1996, ApJ, 456, 174
- Hunter & Elmegreen (2004) Hunter, D. A., & Elmegreen, B. G. 2004, AJ, 128, 2170
- Hunter & Elmegreen (2006) Hunter, D. A., & Elmegreen, B. G. 2006, ApJS, 162, 49
- Hunter et al. (2003) Hunter, D. A., Elmegreen, B. G., Dupuy, T. J., & Mortonson, M. 2003, AJ, 126, 1836
- Hunter et al. (2009) Hunter, D. A., Elmegreen, B. G., & Ludka, B. C. 2009, AJ, submitted
- Hunter et al. (2001) Hunter D. A., Elmegreen B. G., van Woerden H., 2001, ApJ, 556, 773
- Hunter & Hoffman (1999) Hunter, D. A., & Hoffman, L. 1999, AJ, 117, 2789
- Kennicutt (1989) Kennicutt, R. C., Jr. 1989, ApJ, 344, 685
- Landolt (1992) Landolt, A. U. 1992, AJ, 104, 340
- Leitherer et al. (1999) Leitherer, C., Schaerer, D., Goldader, J. D., González Delgado, R. M., Robert, C., Kune, D. F., de Mello, D. F., Devost, D., & Heckman, T. M. 1999, ApJS, 123, 3
- Lee et al. (2007) Lee, J. C., Kennicutt, R. C., Funes, S. J., José G., Sakai, S., & Akiyama, S. 2007, ApJ, 671, L113
- Liu & Chaboyer (2000) Liu, W. M., & Chaboyer, B. 2000, ApJ, 544, 818
- Komiyama et al. (2003) Komiyama, Y., et al. 2003, ApJ, 590, L17
- Maraston (2005) Maraston, C. 2005, MNRAS, 362, 799
- Martin & Kennicutt (2001) Martin, C. L. & Kennicutt, R.C., Jr. 2001, ApJ, 555, 301
- Martin et al. (2005) Martin, D. C., et al. 2005, ApJ, 619, L1
- (50) Massey, P., & Johnson, O. 1998, ApJ, 505, 793
- Massey et al. (2006) Massey, P., Olsen, K. A. G., Hodge, P. W., Strong, S. B., Jacoby, G. H., Schlingman, W., & Smith, R. C. 2006, AJ, 131, 2478
- McQuinn et al. (2009) McQuinn, K. B., Skillman, E. D., Cannon, J., Dalcanton, J. J., Dolphin, A., Stark, D., & Weisz, D. 2009, AAS, 21344508
- Meylan (1988) Meylan, G. 1988, A&A, 191, 215
- Pflamm-Altenburg & Kroupa (2009) Pflamm-Altenburg, J., & Kroupa, P. 2009, Nature, in press
- Piskunov et al. (2006) Piskunov, A. E., Kharchenko, N. V., Röser, S., Schilbach, E., & Scholz, R.-D. 2006, A&A, 445, 545
- Rafelski & Zaritsky (2005) Rafelski, M., & Zaritsky, D. 2005, AJ, 129, 2701
- Salaris et al. (2007) Salaris, M., Held, E. V., Ortolani, S., Gullieuszik, M., & Momany, Y. 2007, A&A, 476, 243
- Salaris et al. (2004) Salaris, M., Weiss, A., & Percival, S. M. 2004, A&A, 414, 163
- Salpeter (1955) Salpeter, E. E. 1955, ApJ, 121, 161
- Schaye et al. (2004) Schaye, J. 2004, ApJ, 609, 667
- Thilker et al. (2007) Thilker, D. A., et al. 2007, ApJS, 173, 538
- Toomre (1964) Toomre, A. 1964, ApJ, 139, 1217
- Vacca et al. (1996) Vacca, W.D., Garmany, C.D., & Shull, J.M. 1996, ApJ, 460, 914
- VandenBerg (2000) VandenBerg, D. A. 2000, ApJS, 129, 315
- (65) Whitmore, B. 2003, Extragalactic Globular Cluster Systems, ed. M. Kissler-Patig. Springer-Verlag, p. 336
- Whitmore et al. (2007) Whitmore, B. C., Chandar, R., & Fall, S. M. 2007, AJ, 133, 1067
- Yang et al. (2007) Yang, C-C., Gruendl, R.A., Chu, Y.-H., Mac Low, M.-M., & Fukui, Y. 2007, ApJ, 671, 374
- Young & Lo (1996) Young, L. M., & Lo, K. Y. 1996, ApJ, 462, 203
- Young et al. (2003) Young, L., van Zee, L., Lo, K. Y., Dohm-Palmer, R., Beierle, M. 2003, ApJ, 592, 111
- Youngblood & Hunter (1999) Youngblood, A. J., & Hunter, D. A. 1999, ApJ, 519, 55
- Zhang & Fall (1999) Zhang, Q., & Fall, S. M. 1999, ApJ, 527, L81
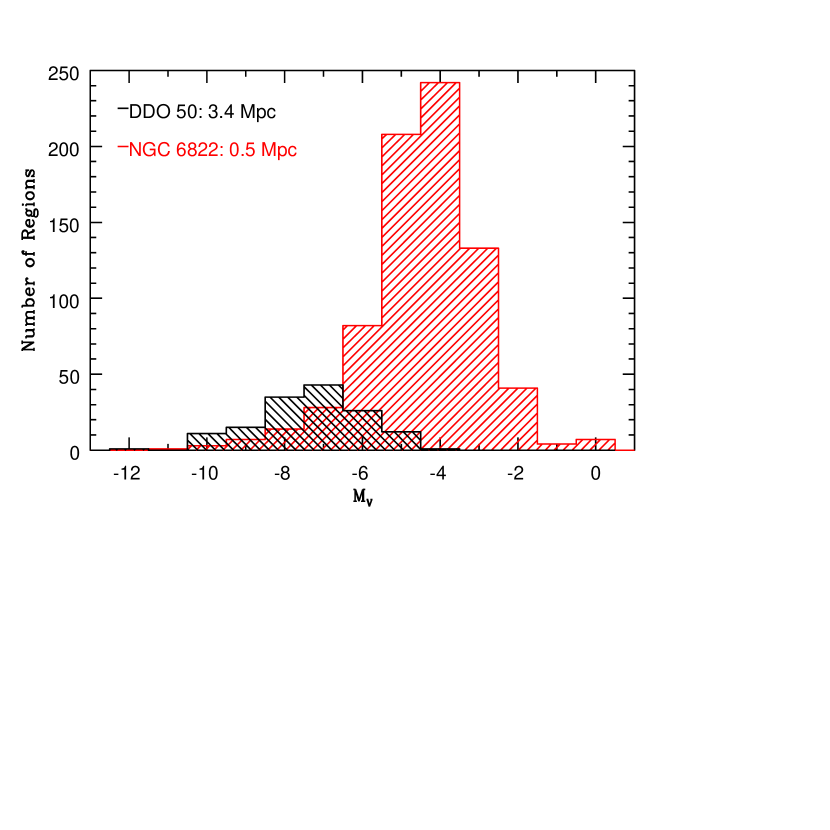
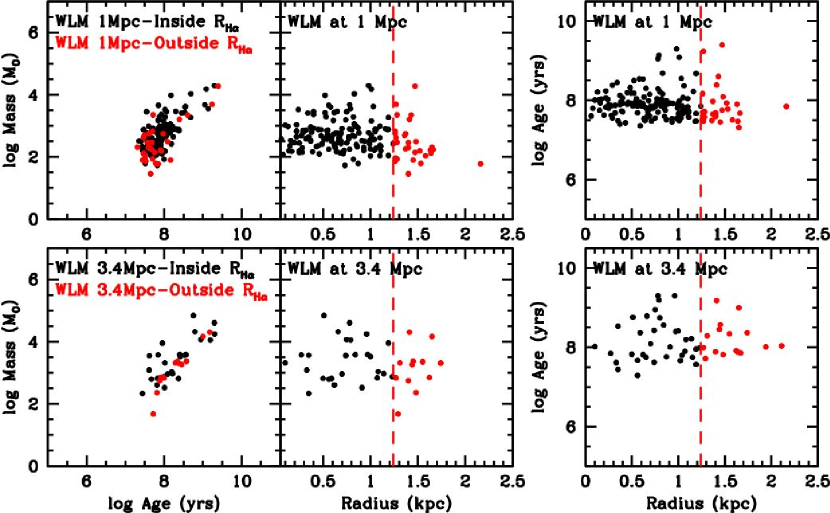
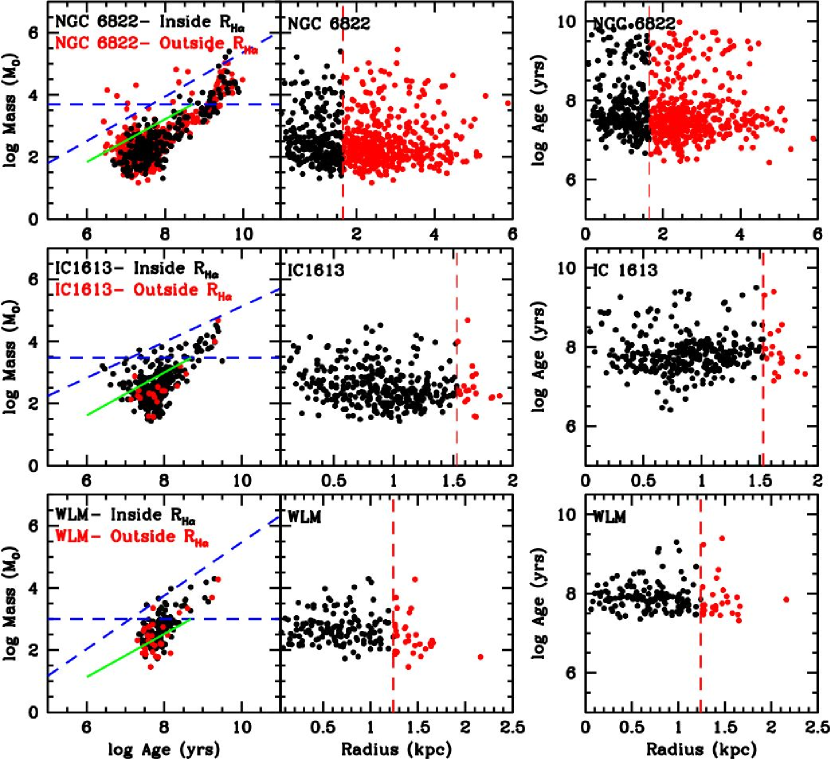
![[Uncaptioned image]](/html/0908.2837/assets/x4.png)
Figure 3 (continued)
![[Uncaptioned image]](/html/0908.2837/assets/x5.png)
Figure 3 (continued)
![[Uncaptioned image]](/html/0908.2837/assets/x6.png)
Figure 3 (continued)
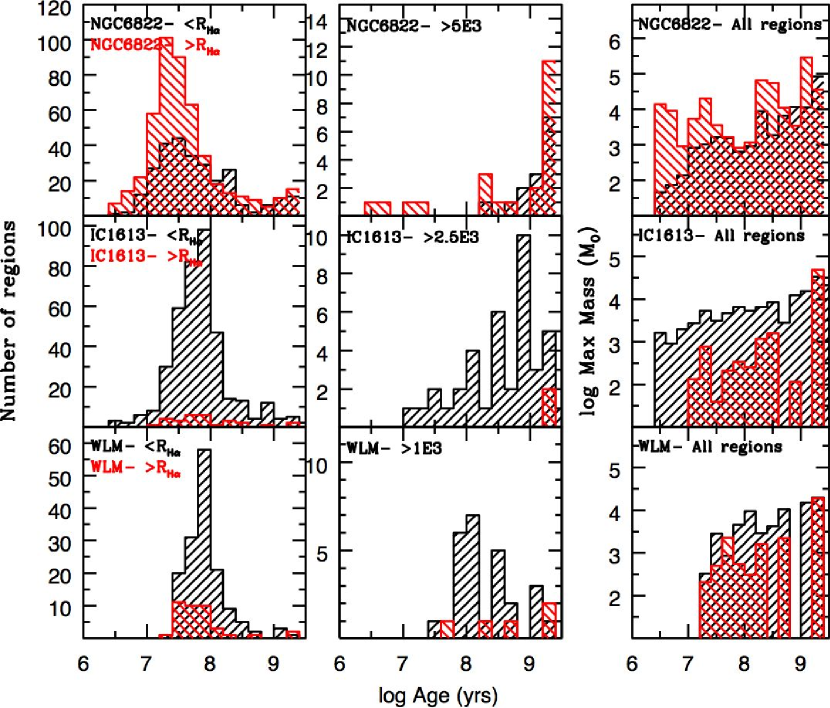
![[Uncaptioned image]](/html/0908.2837/assets/x8.png)
Figure 4 (continued)
![[Uncaptioned image]](/html/0908.2837/assets/x9.png)
Figure 4 (continued)

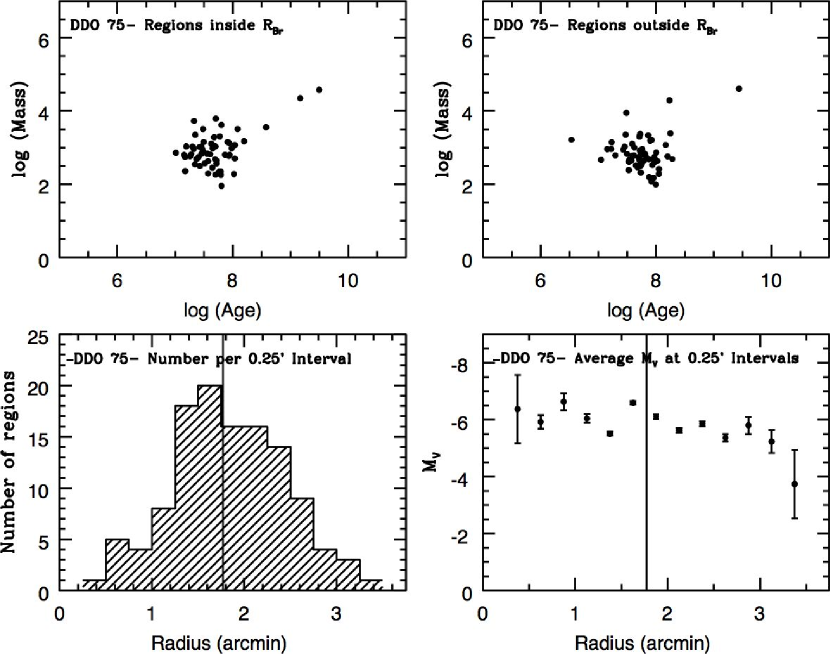

![[Uncaptioned image]](/html/0908.2837/assets/x13.png)
Figure 7 (continued)
![[Uncaptioned image]](/html/0908.2837/assets/x14.png)
Figure 7 (continued)


![[Uncaptioned image]](/html/0908.2837/assets/x17.png)
Figure 9 (continued)

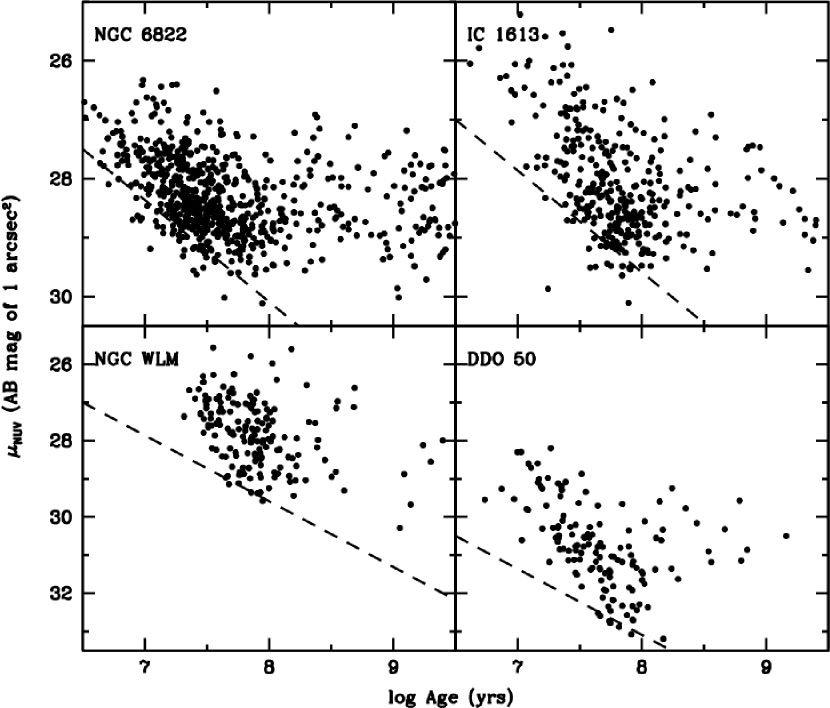


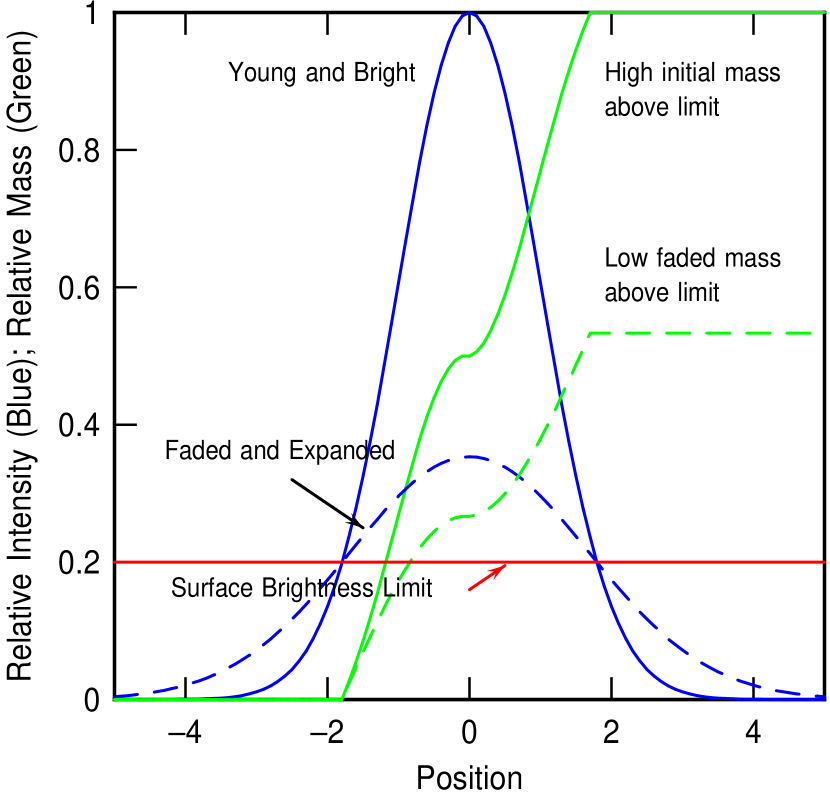


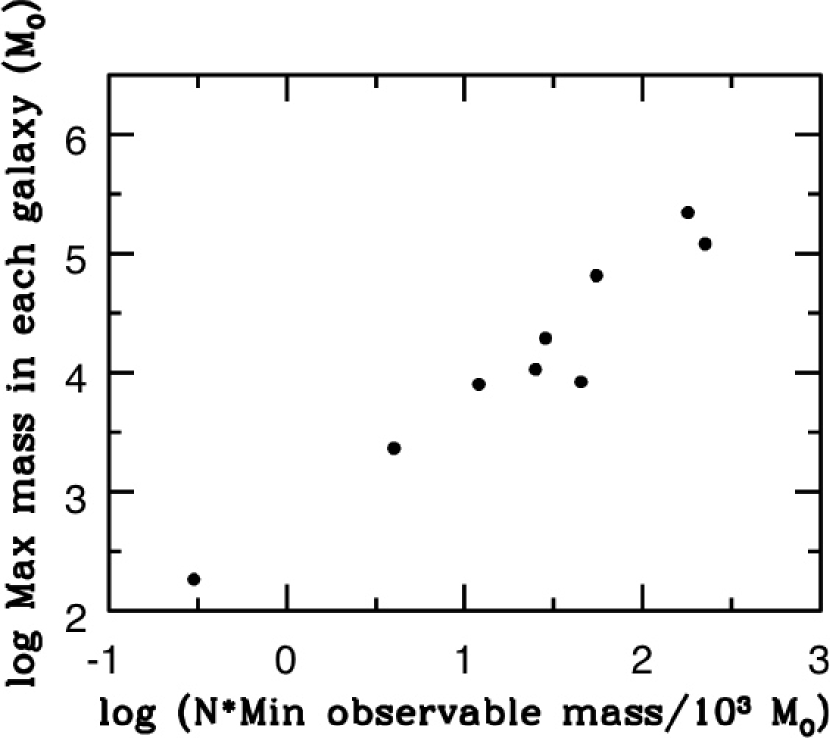
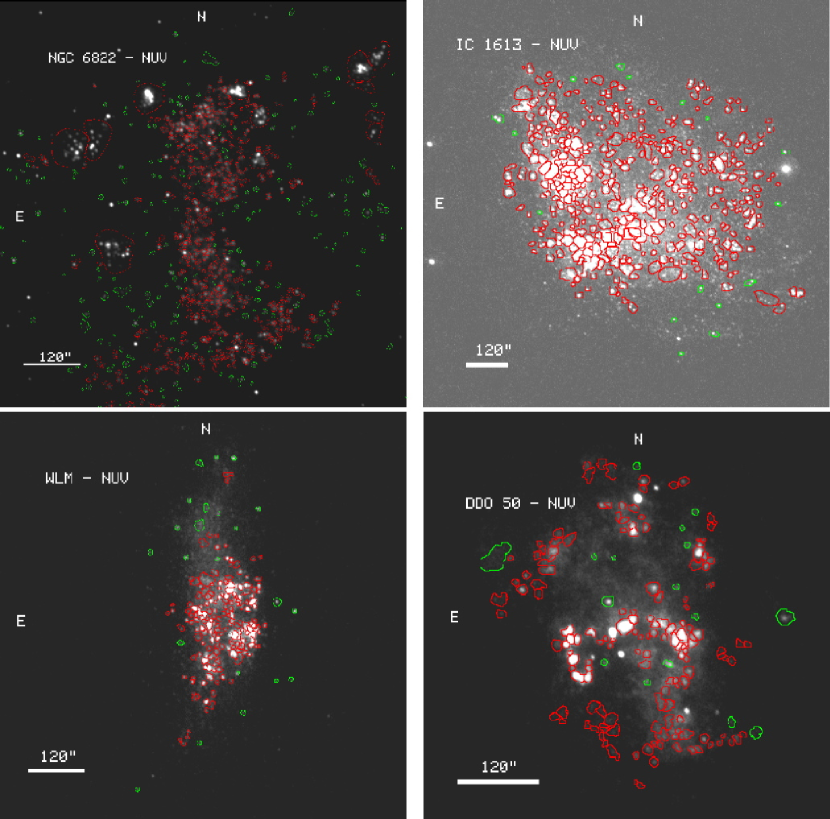
![[Uncaptioned image]](/html/0908.2837/assets/x27.png)
Figure 18 (continued)
![[Uncaptioned image]](/html/0908.2837/assets/x28.png)
Figure 18 (continued)
| D | ccDisk scale length determined from -band images. | P.A.ddGalactic position angle of the major axis determined from -band images. | Incl.eeInclination of galactic disk. | ||||
|---|---|---|---|---|---|---|---|
| Galaxy | Other Names | (Mpc) | E()fbbForeground reddening from Burstein & Heiles (1984). | MV | (arcmin) | (deg) | (deg) |
| DDO 50 | PGC 23324,UGC 4305,Holmberg II,VIIZw223 | 3.4 | 0.02 | 16.6 | 1.11 | 18 | 46 |
| DDO 70 | PGC 28913,UGC 5373,Sextans B | 1.3 | 0.01 | 14.1 | 1.26 | 88 | 57 |
| DDO 75 | PGC 29653,UGCA 205,Sextans A | 1.3 | 0.02 | 13.9 | 41 | 33 | |
| DDO 210 | PGC 065367,Aquarius dwarf | 0.9 | 0.04 | 10.9 | 0.63 | 85 | 66 |
| DDO 216 | PGC 71538,UGC 12613,Peg DIG | 0.9 | 0.02 | 13.3 | 1.68 | 58 | 69 |
| IC 1613 | PGC 3844,UGC 668,DDO 8 | 0.7 | 0.00 | 14.6 | 2.87 | 71 | 37 |
| LGS3 | PGC 3792,Pisces dwarf | 0.6 | 0.04 | 9.4 | 1.13 | 3 | 64 |
| M81dwA | PGC 23521 | 3.6 | 0.02 | 11.7 | 86 | 45 | |
| NGC 2366 | PGC 21102,UGC 3851,DDO 42 | 3.2 | 0.04 | 16.7 | 1.37 | 32 | 72 |
| NGC 6822 | PGC 63616,IC 4895,DDO 209,Barnard’s Galaxy | 0.5 | 0.21 | 15.2 | 3.92 | 24 | 40 |
| WLM | PGC 143,UGCA 444,DDO 221 | 1.0 | 0.02 | 14.4 | 1.97 | 2 | 70 |
| FUV Exp (s) | NUV Exp (s) | Tile Name | |
|---|---|---|---|
| DDO 50 | 1674 | 1521 | NGA_HolmbergII |
| DDO 70 | 1076 | 966 | NGA_SextansB |
| DDO 75 | 1663 | 1512 | NGA_SextansA |
| DDO 210 | 1669 | 1472 | GI1_047107_DDO210 |
| DDO 216 | 1557 | 2665 | MISDR2_28664_0746 |
| IC 1613 | 1676 | 1494 | NGA_IC16134 |
| LGS3 | 1673 | 1487 | NGA_LGS3 |
| M81dwA | 1674 | 1521 | NGA_HolmbergII |
| NGC 2366 | 2889 | 2617 | NGA_NGC2366 |
| NGC 6822 | 4483 | 5132 | NGA_NGC6822 |
| WLM | 1423 | 1294 | NGA_WLM |
| R.A. | Decl. | aaDistance of the star-forming region from the center of the galaxy in the plane of the galaxy, using the galactic parameters given in Table 1. is the disk scale length from Hunter & Elmegreen (2006). | bbRadius of the star-forming region. The identifying regions are polygons, and the radius is the square-root of the area of the region divided by . | ddRegion stellar mass and age from the best fit model to the colors and luminosity, and RMS. Here RMS is the rms deviation between observed and modeled colors. | AgeddRegion stellar mass and age from the best fit model to the colors and luminosity, and RMS. Here RMS is the rms deviation between observed and modeled colors. | |||||||||||||
|---|---|---|---|---|---|---|---|---|---|---|---|---|---|---|---|---|---|---|
| Region | (J2000) | (J2000) | (kpc) | aaDistance of the star-forming region from the center of the galaxy in the plane of the galaxy, using the galactic parameters given in Table 1. is the disk scale length from Hunter & Elmegreen (2006). | (pc) | ccAbsolute AB magnitude in the NUV filter. | (M) | (yrs) | RMSddRegion stellar mass and age from the best fit model to the colors and luminosity, and RMS. Here RMS is the rms deviation between observed and modeled colors. | |||||||||
| DDO 50 | ||||||||||||||||||
| 1 | 8 19 09.6 | 70 45 19 | 1.96 | 1.78 | 108.1 | -9.9 | 0.01 | -0.08 | 0.03 | -9.5 | 0.0 | -0.01 | 0.02 | -0.94 | 0.03 | 4.03 | 7.35 | 0.38 |
| 2 | 8 18 49.7 | 70 44 60 | 2.99 | 2.72 | 81.4 | -8.6 | 0.02 | -0.44 | 0.04 | -8.5 | 0.0 | -0.02 | 0.04 | -1.00 | 0.05 | 3.55 | 7.08 | 0.38 |
| 3 | 8 19 12.1 | 70 43 07 | 0.55 | 0.50 | 191.6 | -12.1 | 0.00 | -0.17 | 0.01 | -12.2 | 0.0 | 0.21 | 0.00 | -1.14 | 0.00 | 5.08 | 7.27 | 0.55 |
| 4 | 8 19 27.8 | 70 42 21 | 2.65 | 2.41 | 139.4 | -11.3 | 0.01 | -0.22 | 0.01 | -11.0 | 0.0 | 0.05 | 0.01 | -1.20 | 0.01 | 4.53 | 7.03 | 0.55 |
| 5 | 8 19 28.6 | 70 42 30 | 2.65 | 2.40 | 64.4 | -8.7 | 0.02 | -0.15 | 0.04 | -8.0 | 0.0 | -0.05 | 0.04 | -1.09 | 0.05 | 3.41 | 7.20 | 0.49 |
Note. — Table 3 is published in its entirety in the electronic edition of the Astronomical Journal. A portion is shown here for guidance regarding its form and content.
| Region | ||||||
|---|---|---|---|---|---|---|
| 1 | ||||||
| 2 | ||||||
| 3 | -9.597 | 1.187 | 1.159 | 2.222 | 0.156 | 4.851 |
| 4 | ||||||
| 5 | -8.920 | 1.690 | 0.750 | 4.076 | ||
| 6 | -8.980 | 1.558 | 0.548 | 4.309 | -0.382 | 18.097 |
| 7 | -10.637 | 0.465 | 0.906 | 1.014 | 0.217 | 2.236 |
| 8 | -9.613 | 1.093 | 0.803 | 2.546 | 0.028 | 6.839 |
| 9 | -8.834 | 13.849 | -3.127 | 2.620 | 97.900 | |
| 10 | -10.708 | 0.580 | 0.617 | 1.531 | 0.523 | 2.727 |
| 11 | ||||||
| 12 | -9.597 | 1.467 | 1.361 | 2.466 | -0.575 | 10.260 |
| 13 | -8.616 | 1.648 | 0.526 | 4.627 | 0.740 | 7.051 |
| 14 | -9.944 | 0.607 | 0.615 | 1.605 | 0.441 | 3.066 |
| 15 | -9.273 | 6.401 | -2.648 | 69.743 | ||
| 16 | ||||||
| 17 | ||||||
| 18 | ||||||
| 19 | ||||||
| 20 | -13.411 | 0.056 | 0.628 | 0.146 | 0.173 | 0.354 |
| 21 | -11.129 | 0.258 | 0.443 | 0.768 | 0.287 | 1.723 |
| 22 | -10.448 | 0.416 | 0.491 | 1.199 | 0.289 | 2.672 |
| 23 | -8.590 | 2.470 | 0.561 | 6.761 | ||
| 24 | -11.071 | 0.365 | 0.253 | 1.246 | 0.398 | 2.593 |
| 25 | -9.930 | 0.693 | 0.580 | 1.879 | 0.409 | 3.713 |
| 26 | -9.426 | 1.176 | -0.460 | 6.776 | ||
| 27 | -10.207 | 0.457 | 0.563 | 1.250 | 0.287 | 2.760 |
| 28 | -7.039 | 9.942 | 1.465 | 15.872 | ||
| 29 | -6.648 | 10.252 | 0.668 | 26.066 | ||
| 30 | -7.238 | 7.278 | 1.626 | 10.833 | -0.140 | 26.445 |
| 31 | ||||||
| 32 | -9.510 | 1.560 | -0.031 | 6.561 | ||
| 33 | -10.935 | 0.407 | 0.534 | 1.137 | 0.151 | 2.854 |
| 34 | -9.537 | 0.989 | 0.485 | 2.862 | 0.077 | 7.761 |
| 35 | -9.494 | 1.458 | -0.258 | 7.256 | ||
| 36 | -9.962 | 0.887 | -0.364 | 4.760 | -0.062 | 15.992 |
| 37 | -11.469 | 0.300 | 0.298 | 0.992 | 0.119 | 2.648 |
| 38 | -10.357 | 0.438 | 0.651 | 1.129 | 0.146 | 2.794 |
| 39 | -8.240 | 2.872 | 1.397 | 4.743 | -0.634 | 20.645 |
| 40 | ||||||
| 41 | -11.936 | 0.180 | 0.617 | 0.476 | 0.155 | 1.175 |
| 42 | ||||||
| 43 | -8.874 | 2.827 | -1.226 | 28.369 | ||
| 44 | -8.561 | 3.035 | -0.636 | 1 | 1.616 | 20.540 |
| 45 | -7.926 | 4.552 | -1.098 | 41.742 | 2.620 | 36.823 |
| 46 | ||||||
| 47 | ||||||
| 48 | -7.859 | 3.774 | 0.508 | 10.698 | 0.058 | 29.730 |
| 49 | -9.369 | 1.381 | 1.259 | 2.449 | 0.571 | 3.609 |
| 50 | -7.974 | 4.131 | 0.808 | 9.603 | ||
| 51 | -8.102 | 2.600 | 0.512 | 7.373 | 0.815 | 10.638 |
| 52 | ||||||
| 53 | -9.785 | 1.041 | 0.100 | 3.976 | ||
| 54 | -11.279 | 0.329 | 0.652 | 0.847 | 0.185 | 2.020 |
| 55 | -13.037 | 0.089 | 0.638 | 0.230 | 0.185 | 0.550 |
| 56 | -13.763 | 0.046 | 0.282 | 0.156 | 0.446 | 0.312 |
| 57 | -10.459 | 0.419 | 0.614 | 1.106 | 0.172 | 2.690 |
| 58 |
| aaRadius beyond which H emission is no longer detected (Hunter & Elmegreen 2004). Galaxies with of zero have no detected H emission. | bbRadius where the -band surface photometry changes slope (Hunter & Elmegreen 2006). | ddRadius where last star-forming region is detected in the image. | eeRadius interior to which is found half of the star-forming regions identified on the image. | ggHI surface density at . | ||||
|---|---|---|---|---|---|---|---|---|
| Galaxy | (kpc) | (kpc) | NUVccNumber of retained regions identified on the image. | (kpc) | (kpc) | % past ffPercentage of identified UV regions found beyond the radius where H emission is no longer detected and beyond the break radius for those galaxies with breaks in their broad-band surface brightness profiles. | % past ffPercentage of identified UV regions found beyond the radius where H emission is no longer detected and beyond the break radius for those galaxies with breaks in their broad-band surface brightness profiles. | (M pc-2) |
| DDO 50 | 4.02 | 139 | 5.07 | 2.70 | 7 | 3.6 | ||
| DDO 70 | 1.23 | 46 | 1.35 | 0.60 | 2 | |||
| DDO 75 | 1.17 | 0.67 | 119 | 1.30 | 0.69 | 2 | 52 | 3.4 |
| DDO 210 | 0.00 | 9 | 0.20 | 0.13 | 4.4 | |||
| DDO 216 | 0.34 | 1.42 | 25 | 0.79 | 0.36 | 56 | 0 | |
| IC 1613 | 1.53 | 342 | 1.89 | 0.91 | 5 | 1.5 | ||
| LGS3 | 0.00 | 5 | 0.25 | 0.16 | ||||
| M81dwA | 0.00 | 0.42 | 2 | 0.47 | 0.37 | 50 | ||
| NGC 2366 | 5.25 | 58 | 5.47 | 2.79 | 2 | 2.2 | ||
| NGC 6822 | 1.65 | 713 | 5.88 | 2.16 | 66 | |||
| WLM | 1.24 | 165 | 2.16 | 0.78 | 19 | 1.4 |