Long term variability of the Broad Emission Line profiles in AGN
Abstract
Results of a long-term monitoring ( years) of the broad line and continuum fluxes of three Active Galactic Nuclei (AGN), 3C 390.3, NGC 4151, and NGC 5548, are presented. We analyze the H and H profile variations during the monitoring period and study different details (as bumps, absorption bands) which can indicate structural changes in the Broad Line Region (BLR). The BLR dimensions are estimated using the time lags between the continuum and the broad lines flux variations. We find that in the case of 3C 390.3 and NGC 5548 a disk geometry can explain both the broad line profiles and their flux variations, while the BLR of NGC 4151 seems more complex and is probably composed of two or three kinematically different regions.
keywords:
1 INTRODUCTION
An important question in the study of Active Galactic Nuclei (AGN) is the nature of the ”central engine”. Nowadays, it is widely accepted that the nuclear activity is caused by accretion of gas onto a supermassive black hole (SMBH). More than 40 years ago, Weedman & Khachikyan (1968) classified AGN into two types: AGN1 whose spectra show broad (FWHM) and narrow (FWHM) emission lines; and AGN2 with only narrow emission lines. Later, the classification was improved by including intermediate types from AGN 1.2 to AGN 1.9 (see Osterbrock, 1989). It was first believed that AGN1 and AGN2 have different physical natures. However, more than 20 years ago a unified scheme of the AGN structure was proposed, where an accretion disk (AD) around a SMBH are assumed to be in the center of all AGN. Around the very central part, two emitting regions, the ”Broad Line Region (BLR)” and the ”Narrow Line Region (NLR)”, are surrounded by a torus of dust (Antonucci & Miller, 1985; Antonucci, 1993). Then the difference in spectra between AGN1 and AGN2 is related to the viewing angle of an observer with respect to the torus orientation.
The BLR, i.e. the Broad Emission Lines (BELs) forming region, consists of gas obviously linked with the accretion process onto a SMBH. It is important to investigate its structure in order to use the BELs for the estimation of mass and the accretion rate of the SMBH. The typical angular size of the BLR is , consequently even for nearby AGN1 this region is presently not resolved with the most sensitive optical interferometers. The only ways to study the BLR are indirect methods, as e.g. “reverberation mapping” (Peterson et al. 1993).
It is well known that AGN vary in luminosity on time scales from years to hours, over the whole wavelength range from the radio to X-rays or -rays. In particular, the flux in BELs varies with respect to the ionizing continuum flux with short time delays (days to weeks for Seyfert galaxies), due to light-travel time effects. If the BLR presents systematic motions such as infalling, outflowing, circular motions, the profiles of the broad emission lines should vary in a way related with its geometry and kinematics. The motions also depend on the processes of gas relaxation that follows changes in the ionizing flux.
An important progress in understanding the BLR structure was achieved as a result of multiwavelength monitoring campaigns performed within the framework of the International AGN Watch, a consortium organized to study several Seyfert galaxies (Peterson et al., 1999).
Its main results (see Peterson, 2008, and references therein), and references therein) can be summarized as follows (i) The response time of the H line to continuum variations varies from year to year and is correlated with the average continuum flux; (ii) the BLR sizes range from light-days to several light-weeks; (iii) the high ionization lines have a shorter response time than the low ionization lines, indicating the presence of an ionization stratification along the BLR; (iv) rotation or chaotic motions dominate onto radial motions in the BLR; (v) the optical and ultraviolet continua vary almost simultaneously (i.e. without showing a significant delay).
All these conclusions improved our knowledge of the BLR, but many questions remain still open, as e.g. the existence of a small fraction of double peaked profiles which could indicate the presence an accretion disk, or that of an inflow or an outflow. To answer these questions, a long term monitoring of AGN with a detailed study of the different broad line profiles was required.
In this paper we give an overview of our recent investigation based on the long-time monitoring of three AGNs with different BEL profiles: 3C 390.3 with double peaked profiles, NGC 4151 with strongly variable BEL profiles, and NGC 5548 with shoulders in the profiles.
2 OBSERVATIONS
High quality spectra () in the continuum around H and H were obtained in the spectral range 4000 to 7500 Å, using a long–slit spectrograph equipped with CCDs, with a resolution between 5 and 15 Å, using the 6-m and 1-m SAO’s telescopes (Russia) and the GHAO’s 2.1-m telescope (Cananea, Mexico). Spectrophotometric standard stars were observed every nights. The image reduction process included bias subtraction, flat-field corrections, cosmic ray removal, 2D wavelength linearization, sky spectrum subtraction, addition of the spectra for each night, and relative flux calibration based on standard star observations.
For the absolute calibration, the fluxes of the narrow emission lines are adopted for scaling the AGN spectra, because they are known to remain constant on time scales of tens of years (Peterson 1993). We thus assume that the flux of the [OIII] line or [OI] was constant during the monitoring period. The scaling of spectra was performed by using the method of Van Groningen & Wanders (1992) modified by Shapovalova et al. (2004)222see Appendix A in Shapovalova et al. (2004). This method allowed us to obtain a homogeneous set of spectra with the same wavelength calibration and the same [OIII]5007 flux.
In order to investigate the long term spectral variability of AGN it is necessary to have a consistent set of spectra. Since Seyfert galaxies were observed with different telescopes, in different position angles, and with different apertures, first we had to perform corrections for the position angle (PA), seeing and aperture effects. A detailed discussion on the necessity for these corrections is given in Peterson et al. (1993), and will not be repeated here.
Fluxes of 3C390.3 and NGC 5548 were corrected only for aperture effects (Shapovalova et al., 2001, 2004), because the host galaxy is weak and the nucleus have its angle size and spectra were taken with apertures , , and fluxes were practically independent from seeing and position angle. The fluxes NGC 4151 were corrected for the position angle (PA), seeing and aperture effects, because the host galaxy is very bright and brightness of nucleus is very big and its angle size (see Shapovalova et al., 2008, for details).
The mean error (uncertainty) for H and the continuum around this line is , while it is for H. In order to study the broad components showing the main BLR characteristics, the narrow components of these lines and the forbidden lines were removed from the spectra. In this aim, we constructed spectral templates using the blue and red spectra in the minimum activity state. The broad and narrow components of H, He II 4686, H and H, were fitted with Gaussians. Then, we scaled the blue and red spectra according to our scaling scheme (see the Appendix in Shapovalova et al., 2001), using the template spectrum as a reference. The template spectrum and any observed spectrum were thus matched in wavelength, reduced to the same resolution, and the template spectrum was subtracted from the observed one. More details about data reduction can be found in Shapovalova et al. (2001, 2008).
| object | Sp | structure | Excitation | BLR | ||
|---|---|---|---|---|---|---|
| (monitor. period) | light | type | profiles | model | model | |
| days | (variability) | |||||
| NGC 5548 | 6-26 | 5 | 1-1.8 | strong shoulders | photoion. | turbulent |
| (1996-2002) | Peterson et al. (2002) | disk | ||||
| NGC 4151 | 1-50 | 6 | 1.5-1.8 | absorption,bumps | shock | outflow |
| (1996-2006) | photoion. | possible small disk | ||||
| 3C390.3 | 35,100 | 3 | 1-1.8 | double peaked | photoion. | disk |
| (1995-2007) |
3 RESULTS
3.1 BEL profile variations in NGC 5548
This nucleus was observed from 1996 to 2002. A detailed description of the observations and results can be found in Shapovalova et al. (2004). The results can be outlined as follows:
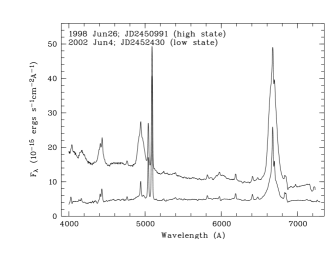
- The flux in the broad lines and in the continuum gradually decreased, reaching minimum values during May-June 2002. In the minimum state, the wings of H and H became extremely weak, corresponding to a Sy1.8 type and not to a Sy1, as observed previously when the nucleus was brighter (see Fig.1).
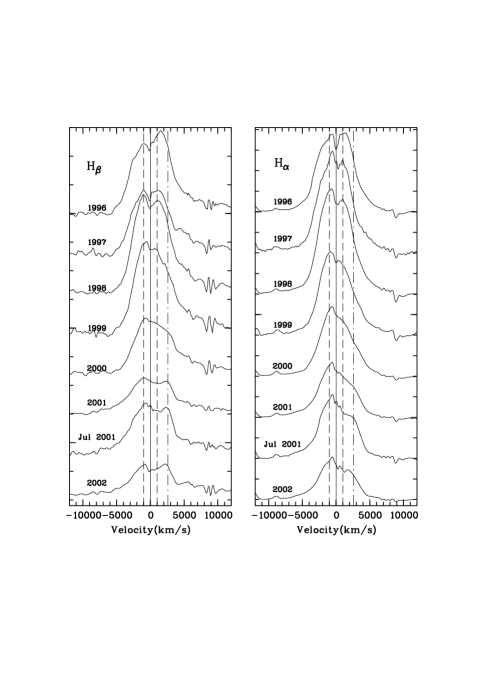
- The H and H broad line profiles displayed double-peaked profiles, at radial velocities with respect to the narrow components. The relative intensities and radial velocities of the peaks varied. During 1996, the red peak was the brightest, while in 1998 - 2002, the blue peak became brighter. Their radial velocities vary between and (see Fig. 2).
- In 2000 - 2002, a distinct peak was observed in the red wings of H and H, at a radial velocity of . Its radial velocity decreased from 2000 to 2002 by (see Fig. 3).

- On small time scales, the flux of different parts of the profiles changed in almost the same manner, being highly correlated both with each others (correlation coefficient ) and with the continuum flux (). These results indicate that the flux variability on short time scales is caused mainly by the reverberation effect (see Fig. 4). In Fig. 4 flux 1,2,3,4 and shape 1,2,3,4 correspond to the flux or shape in the H and H profile segments in the following radial velocity intervals: flux1 and shape1 for (, ) km/s; flux2 and shape2 for (, ) km/s; flux3 and shape3 for (, ) km/s and flux4 and shape4 for (, ) km/s. The shape determination is given in Shapovalova et al. (2004, 3.3.1) using method suggested by Wanders & Peterson (1996).
- On long time scales, the variations of different parts of the line profiles were mildly correlated with each others and with the continuum variations, or simply did not correlate at all. So, the profile changes on long time scales are not due to reverberation, as earlier discussed by Wanders & Peterson (1996).
- Changes of the integral Balmer decrement were, on average, anticorrelated with the continuum flux variations. This is probably due to an increasing role of collisional excitation as the ionizing flux decreases. The behavior of the Balmer decrement in various parts of the line profiles was different in 1996-2000 as compared with 2001.
- From CCF-analysis of the time delay between the continuum variations and the H response during 13 years (Peterson et al., 2002), one finds that the H time lag varied from of 6 days in 2000 to 26 days in 1998-1999. The relation between the size of the BLR and the ionizing luminosity is: .
The variation in the broad line profiles of NGC 5548 indicates presence of an accretion disk emission which contributes to the BEL fluxes.

3.2 BEL profile variations in NGC 4151
The galaxy was observed in period 1996-2006. The details about observations can be found in Shapovalova et al. (2008). Here we outline some of the most important results:
- The continuum and line fluxes varied strongly (up to a factor 6) during the monitoring period. The emission was maximum in 1996-1998, and there were two minima, in 2001 and in 2005. As a consequence, the spectral type of the nucleus changed from a Sy1.5 in the maximum activity state to a Sy1.8 in the minimum state (Fig. 5).

- There are three characteristic periods (1996-1999, 2000-2001 and 2002-2006) in the profile variability. In the first period, when the lines were the most intense, a highly variable blue component was observed, which showed two peaks or shoulders at and in the rms H profiles and, to a less extent, in H. In the second period, the broad lines were much fainter; the feature at disappeared from the blue part of the rms profiles of both lines; only the shoulder at was present. A faint shoulder at was present in the red part of rms line profiles. In the third period a red feature (a bump or a shoulder) at was clearly seen in the red part of both the mean and the rms line profiles. The behavior of the rms profiles in the three periods indicates that the BLR has a complex structure and that its geometry probably changes with time.


.


In 2005 (May-June), when the nucleus of NGC 4151 was in the minimum activity state, the line profiles had a structure with two distinct peaks (bumps) at radial velocities of in H and in H. In 2002 a distinct bump appeared in the red wing of both lines at . The radial velocity of the bump in the red wing changed from in 2002 to in 2006 (Fig. 6). In 1999-2001 we observed a broad deep absorption line in H at the radial velocity .
- The CCFs are often asymmetrical and the time lags between the lines and the continuum are badly defined, indicating the presence of a complex BLR, with dimensions of 1 to 50 light-days.
- The Balmer decrement () was maximum in . An anti-correlation with the continuum was observed in the form of two almost parallel series corresponding to and with a difference in by a factor . In the BD did not show any dependence with the continuum variations. The fact that the BD had the different values during the monitoring period (as well as different values along the profiles) also indicates a multi– component origin of the broad lines. It may be caused either by absorption, or by different physical conditions in different parts of the BLR (Shapovalova et al., 2009a).
- There was a linear relationship between the emission line and the continuum flux variations when the continuum flux Fc was small (Fc ). The fact that the H and H fluxes were well correlated to the continuum flux means that the ionizing continuum was a good extrapolation of the optical continuum. When Fc , the line fluxes either were weakly correlated, or simply did not correlate at all with the continuum flux. So it seems that the lines were saturated at high fluxes (see Fig. 7).
3.3 BEL profile variations in 3C 390.3
The observations of 3C 390.3 were performed from 1995 to 2007. The results of the first part of the monitoring period were published in Shapovalova et al. (2001) and Shapovalova et al. (2008), and those of the last part will be published soon (Shapovalova et al., 2009b). The main results can be outlined as follows:
– The broad component of the H and H lines and the continuum flux varied by a factor of 3-4 during 1995-2007.
– The H profiles changed drastically: the wings were very strong in 1996-1998 (like those of a Sy1), with a prominent bump in blue wing, at with respect to the narrow H component, and with a less intense flat bump in the red wing; in 1997 the wings were very weak (like those of a Sy1.8). The blue wing was always brighter than the red one in 1995-2007 (see Fig. 8).
– The shift of the blue peak in the integral H profiles closely follows the trend found by Eracleous et al. (1997). These authors have shown that, if the displacement of the blue bump peak velocity originates in individual regions associated with a massive binary BH, then the inferred rotation period would be about 800 years, and the corresponding mass would then be larger than . They argued that such large binary black hole masses are difficult to reconcile with other observations and with theory. Therefore, they reject the hypothesis of a binary black hole for 3C 390.3. Our results provide further support to their conclusion.

– From the cross-correlation analysis, the time lag of the H emission line response relative to the continuum variations was found to vary with time: during a time lag of about 100 days was detected, whereas for the period a double-valued time lag of days and days (double-peaks in the CCF) is present in our data (see Fig. 9).
– The observed flux of the H wings varied quasi-simultaneously with the same lag relative to the continuum variations. Also, the CCF analysis of the H wings did not reveal any delay between the variations of the wings and the central part of the line, or between two parts of the wings. This behavior is a strong evidence for predominantly circular motions in the BLR.
– From the profile differences of H, we found that the variations in velocity of the blue and red bumps and their differences were anticorrelated with the flux variations of the H and with its time lag with respect to the continuum. It means that the maximum of the line emissivity moves across the disk and corresponds to smaller radii when the continuum flux decreases (the bump velocities increase), and to larger radii when the continuum flux increases (the bump velocities decrease). These transient phenomena are expected to result from a variable rate of accretion close to the black hole. Shapovalova et al. (2001) concluded that these results favor the formation of the H broad emission line in the accretion disk. The modeling of the H integral profiles was performed within the framework of the accretion disk model, and a satisfactory agreement for the disk with an inclination of , and with a region of maximum emission located at about was obtained (Rg : gravitation radius).
4 CONCLUSIONS
Here we briefly outline some results obtained using long-term monitoring campaigns of the three AGN. We investigate the variations of the H and H line fluxes and profiles, as well as the correlations between the line and the continuum flux variations. Our conclusions for the three objects are:
1. For NGC 5548 our results favor the formation of the broad Balmer lines in a turbulent accretion disk containing big moving optically thick inhomogeneities, able to reprocess the central continuum.
2. The BLR of NGC 4151 seems much more complex. The broad lines are likely produced at least in two or three distinct regions with different physics (one photoionized by the AGN central source and another non-radiatively heated).
3. In 3C 390.3 the double-peaked broad emission lines clearly indicate a disk emission. The variations in line profiles can be explained as a perturbation in an accretion disk (more details will be given in forthcoming paper by Shapovalova et al. (2009b)).
In Table 1 we compare some characteristics of variations of the three AGN. As can be seen, the variability can be strong (factor 3-6 in the spectral lines), and during a long period the type of an AGN can change, e.g. from a Sy1 to a Sy1.8. Two objects show evidence of disk emission.
It is interesting that during a long period, not only the dimension, but also the geometry of the BLR, can change (as in NGC4151). All these results should be taken into account when BELs are used to estimate the SMBH masses and accretion rates.
Acknowledgments
This work was supported by INTAS (grant N96-0328), RFBR (grants N97-02-17625 N00-02-16272, N03-02-17123 and 06-02-16843,09-02-01136), State program ’Astronomy’ (Russia), CONACYT research grant 39560-F and 54480 (México) and the Ministry of Science and Technological Development of Serbia through the project Astrophysical Spectroscopy of Extragalactic Objects (146002).
References
- Antonucci (1993) Antonucci, R. 1993, ARA&A, 31, 473
- Antonucci & Miller (1985) Antonucci, R. , Miller, J. S. 1985, ApJ, 297, 621
- Arshakian et al. (2008) Arshakian, T G., Le n-Tavares, J., Lobanov, A. P., Chavushyan, V. H., Popović, L.Č., Shapovalova, A. I., Burenkov, A., Zensus, J. A. 2008, Mem.S.A.It., vol.75
- Eracleous et al. (1997) Eracleous, M., Halpern, J. P., Gilbert, A. M., Newman, J. A. Filippenko, A. V. 1997, ApJ 490, 216
- Osterbrock (1989) Osterbrock, D. E. 1989, Astrophysics of gaseous nebulae and active galactic nuclei, Mill Valley, CA, University Science Books
- Peterson (1993) Peterson, B.M. 1993, PASP, 105, 207
- Peterson (2008) Peterson, B. M. 2008, NewAR, 52, 240
- Peterson et al. (2002) Peterson, B. M., Berlind, P., Bertram, R. et al. 2002, ApJ, 581, 197
- Peterson et al. (1993) Peterson, B. M., Ali, B., Horne, K., Bertram, R., Lame, N. J., Pogge, R. W., Wagner, R. M. 1993, ApJ, 402, 469
- Peterson et al. (1999) Peterson, B. M., Barth, A. J., Berlind, P. et al. 1999, ApJ, 510, 659
- Shapovalova et al. (2004) Shapovalova, A. I., Doroshenko, V. T., Bochkarev, N. G. et al. 2004, A&A, 422, 925
- Shapovalova et al. (2001) Shapovalova, A.I., Burenkov, A. N., Carrasco, L., Chavushyan, V. H., Doroshenko, V. T., Dumont, A. M. et al. 2001, A& A, 376, 775
- Shapovalova et al. (2008) Shapovalova, A. I., Popović, L. Č., Collin, S., et al. 2008, A&A, 486, 99S
- Shapovalova et al. (2009a) Shapovalova, A. I., Popović, L. Č., Burenkov A. N., et al. 2009a, A&A, sent.
- Shapovalova et al. (2009b) Shapovalova, A. I., Popović, L. Č., Burenkov A. N., et al. 2009b, in preparation.
- Stalevski et al. (2008) Stalevski, M., Jovanović, P, Popović L. Č. 2008, Publ. Astron. Obs. Belgrade, 84, 491.
- Stalevski et al. (2009) Stalevski, M., Jovanović, P, Popović L. Č., Shapovalova, A. 2009, Book of Abstracts of VII SCSLSA (eds. L. Č. Popović, M.S. Dimitrijević, D. Jevremović, D. Ilić) p. 58.
- Van Groningen & Wanders (1992) Van Groningen, E. & Wanders, I. 1992, PASP, 104, 700
- Wanders & Peterson (1996) Wanders, I., Peterson, B. M. 1996, ApJ, 466, 174
- Weedman & Khachikyan (1968) Weedman, D. W.; Khachikyan, Eh. E. 1968a, Astroph. Zhurnal, 4, 587