17\Yearpublication2009\Yearsubmission2009
A continuum of structure and stellar content from Virgo cluster early-type dwarfs to giants?
Abstract
Based on the wealth of multiwavelength imaging data from the SDSS, we investigate whether dwarf and giant early-type galaxies in the Virgo cluster follow a continuum in their structural parameters and their stellar population characteristics. More specifically we study the relation between size and brightness for the galaxies and their color magnitude relation. In both cases, we find noticeable deviations from a simple joint behavior of dwarfs and giants. We discuss these findings in the light of the different formation mechanisms commonly assumed for dwarf and giant early types, thereby taking into account the existence of several distinct early-type dwarf subclasses. By comparing our results to a semianalytic model of galaxy formation, we argue that the analyzed relations might be reproduced by processes that form dwarfs and giants altogether. The work presented here is based on Janz & Lisker 2008, 2009.
keywords:
galaxies: elliptical and lenticular, cD — galaxies: dwarf — galaxies: fundamental parameters — galaxies: clusters: individual: (Virgo Cluster)1 Introduction
Early-type dwarf (dE) galaxies are commonly expected to play a key role in understanding galaxy cluster evolution. Their importance is given by their abundances – they outnumber all other galaxy types in dense cluster environments by far – and the fact that they provide not too massive, not too dense test particles to probe processes that let the cluster environment alter the appearance of galaxies. At the same time, dEs are predicted to form in models of a CDM universe as the descendants of building blocks in hierarchical structure formation and to be in that sense close relatives to their giant counterparts, sharing a cosmological origin. A better understanding of dEs is therefore not only linked to our knowledge of formation and evolution of galaxy clusters but also of structure formation itself.
Once believed to be systems of simple appearance and well-defined properties, dEs were recently shown to exhibit a puzzling variety among their structures and stellar populations (see e.g. T. Lisker, this issue). This diversity opens the door widely for different formation scenarios. And indeed there are different suggestions, for example the transformation of other galaxy types by the cluster environment via ram pressure stripping or harassment, which are partly able to explain the appearance of dEs and also reproduce with some successes fundamental scaling relations of early-type galaxies. But still today, it remains an open question to what extent these different processes play a role and whether some of the early-type dwarf galaxies share the same origin and formation mechanisms with their more massive relatives.
The above mentioned scaling relations have ever been an important tool not only to study galaxy properties but also to link those properties to their formation and evolution, and thus to answer the question. Very well studied examples are the relations between surface brightness and size (“Kormendy relation”, Kormendy 1985), between surface brightness and luminosity (e.g. Binggeli & Cameron 1991). In combination with velocity dispersion, the Faber-Jackson relation (Faber & Jackson, 1976) and the extensionto the Fundamental Plane (Dressler et al. 1987, Djorgovski & Davis 1987) became famous. Every time these relations were analyzed for dwarfs and giants in conjunction, it was discussed, whether or not they show a common behavior and what causes it. Any dwarf formation scenario has to reproduce the observationally found relations. Additionally to these morphological and kinematical relations, the color magnitude relation (CMR), connecting the global parameter total brightness of a galaxy to its stellar population, was extensively studied, e.g. Baum (1959); Bower et al. (1992); Faber (1973); Sandage & Visvanathan (1978b, a); Visvanathan & Sandage (1977). The CMR is typically explained by an increase of mean stellar metallicity (and age; see e.g. Gavazzi et al. 2002) with increasing galaxy mass as the dominant effect. The common underlying idea is that more massive galaxies have deeper potential wells, which can retain metal-enriched stellar ejecta more effectively and subsequently recycle the enriched gas into new stars (Kodama & Arimoto, 1997; Ferreras et al., 1999; Gallazzi et al., 2006; Chang et al., 2006). Also here it was explored whether and, if so, how much these processes shape the CMR of giants and dwarfs in a similar way.
2 Sample Selection and Imaging Data
Our sample is based on the Virgo Cluster Catalog (VCC; Binggeli et al. 1985). All early-type galaxies therein with a certain cluster member status and mag are taken into account, which is the same magnitude limit up to which the VCC was found to be complete. This translates into mag with our adopted distance modulus of m-M=31.09 mag (d=16.5 Mpc, Mei et al. 2007).
Uncertain classifications are treated as follows: galaxies listed as “S0:”, “E/S0”, “S0/Sa”, and “SB0/SBa” are taken as S0, and one S0 (VCC1902) is excluded, since it shows clear spiral arm structure. For the dwarfs, we selected galaxies classified as dE, dS0, and “dE:”, whereas “dE/Im” as well as possible irregulars based on visual inspection are excluded (Lisker et al., 2007). We exclude 37 galaxies for the following reasons: the Petrosian aperture (see below) could not be obtained, the objects were too strongly contaminated by the light of close neighbour objects, or the in either the or the band was too low. Our working sample thus consists of 468 galaxies.
The Sloan Digital Sky Survey (SDSS) Data Release Five (DR5) (Adelman-McCarthy et al., 2007) covers all but six early-type dwarf galaxies of the VCC. Since the quality of sky level subtraction of the SDSS pipeline is insufficient, we use sky-subtracted images as provided by Lisker et al. (2007), based on a careful subtraction method. The images were flux-calibrated and corrected for galactic extinction (Schlegel et al., 1998).
For each galaxy, we determined a “Petrosian semimajor axis” (Petrosian, 1976), i.e. we use ellipses instead of circles in the calculation of the Petrosian radius (see, e.g., Lotz et al. 2004). The total flux in the -band was measured within , yielding a value for the half-light semimajor axis (SMA), . This Petrosian aperture still misses some flux, which is of particular relevance for the giant galaxies (Trujillo et al., 2001). The brightness and the half-light SMA were corrected for this missing flux according to Graham et al. (2005). Axial ratio and position angle were then determined through an isophotal fit at . The effective radius is then given by with the axis ratio . Additionally we fitted Sérsic profiles to the radial intensity profiles, keeping half light radius fixed and using an implementation of the nonlinear least-squares Levenberg-Marquardt algorithm. For the fits we used the intensities at with and . We omitted intensities at radii in order to avoid seeing effects.
Colors were measured within the elliptical -band half-light aperture for each filter. Errors were estimated from the and calibration uncertainties (which we estimate to have a relative effect of 0.01 mag in each band, which is smaller than the absolute values given by SDSS), as described in Lisker et al. (2008).
3 Sizes of early-type galaxies
3.1 Introduction
The scaling relation of size and brightness of early types was not as widely studied as its relatives, like the Kormendy relation and the relation between brightness and effective surface brightness. Studies of the sizes, for example, are: Bender et al. (1992); Guzman et al. (1993); Kormendy (1977), and for the Virgo Cluster in particular by Binggeli & Cameron (1991) for dwarfs and by Caon et al. (1993) for giants. But all of them share a similar history: Early studies until the 1990’s came to the conclusion that giant and dwarf early-type galaxies show a distinct behavior in the scalings such as the relation between size and brightness. The dwarfs were seen to show less change of size with luminosity than the giants. This together with the other scaling relations was interpreted as evidence for a different origin of dwarf and giant early-type galaxies.
Towards the turn of the millenium, however, it became more widely realized that the light profile shapes of early types vary continuously with luminosity. Neither do dwarf galaxies simply follow exponential profiles, nor do all giants exhibit de Vaucouleurs profiles. Instead, all early types are well described by the generalized Sérsic profile (Sérsic, 1963) with different Sérsic indices (Young & Currie, 1994; Ferrarese et al., 2006). Several authors reasoned that the scaling relations naturally follow what is predicted by changing linearly with magnitude, and that all these galaxies can indeed be of the same kind (Jerjen & Binggeli 1997; Binggeli & Jerjen 1998; Graham & Guzmán 2003; Gavazzi et al. 2005). In Janz & Lisker (2008) we studied the size brightness relation of early types in Virgo and analyzed it in the light of a continuous variation of profile shapes.
3.2 Results
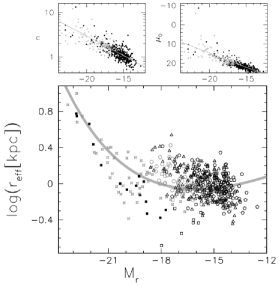
In Fig. 1 (bottom panel) we present the size luminosity diagram for our sample. At first glance the sequence from dwarf to giant early-type galaxies does not look very continuous: the giants follow a steep relation with a well-defined edge on the bright end of their distribution. The bunch of dwarfs apparently lie with a larger scatter around an effective radius of kpc, their sizes showing weak to no dependence on luminosity.
A similar impression can also be obtained from other previous studies, e.g. Binggeli & Cameron 1991, Fig. 1b; Bender et al. 1992, Table 1; Kormendy et al. 2009, Fig. 37. It is, however, not as clearly seen in the compilation of sizes of elliptical galaxies from several different studies presented by Graham & Worley (2008) (Fig. 10). In this more heterogeneous data set, the relative number of small low-luminosity giants as well as that of large bright dwarfs appears to be somewhat smaller.
Varying profile shapes ?
Graham & Guzmán (2003) suggested that the apparent dichotomy between dwarfs and giants in scaling relations can be explained just by the fact that the profile shape of a galaxy scales with magnitude. They describe the light profiles with Sérsic profiles and show the effect of a linear relation between magnitude and logarithm of the Sérsic index on the other scaling relations. As a result, the dependence of effective radius on magnitude becomes stronger at higher luminosities and the brightest galaxies are naturally larger (Fig. 11 in Graham & Worley 2008).
For investigating whether our galaxies display the predicted behavior, we use the Sérsic indices and central surface brightnesses to obtain linear fits to the and relations, using a least squares fitting algorithm (Fig. 1, top panels). For those fits we exclude systems with a (probable) disk component, namely galaxies classified as S0, dEs with disk features (Lisker et al., 2006a), and dEs with blue centers (Lisker et al., 2006b). This is to ensure that the light profiles can be well parametrized by Sérsic profiles. Our fits (Fig. 1, top panels) together with equation (16) of Graham & Worley (2008) predict a non-linear sequence in the diagram. The predicted relation is shown together with the observed galaxies in the bottom panel of Fig. 1. With the visual guidance of the line, it appears more likely that the data points follow one common continuous relation. And the gross trend in the diagram can indeed be explained by varying profile shapes. However, at luminosities brightwards of the transition between dwarfs and giants, a substantial amount of galaxies fall below the relation, while faintwards most of the dwarfs lie above it.
As we showed in Janz & Lisker (2008) this finding holds also if all objects with signs of disk components are omitted in order to have a purer sample of dynamically hot systems not biased by systems with more complex kinematics. Furthermore, we analyzed the deviations statistically and found significance (Fig. 2 therein). We will discuss the implications in Sect. 5 and Sect. 6.
Our analysis showed two things. First, the distribution of data points does not resemble a quite large random scatter around the relation. And therefore the size luminosity relation can not be fully explained by varying profile shapes. Second, the abrupt change in the behavior of faint and bright galaxies is even emphasized through the above examination, and this break is a real discontinuity of the sequence from lowest to highest luminosities.
4 Color magnitude relation
4.1 Introduction
From early on, it was discussed whether the universality of the CMR also holds over the whole range of galaxy masses, i.e. whether dwarf and giant early-type galaxies follow the same CMR. Studies of different clusters show consistency with one common CMR for dwarfs and giants, albeit with a significant increase in the scatter at low luminosities (Secker et al. 1997 for Coma, Conselice et al. 2002 for Perseus, Karick et al. 2003 and Mieske et al. 2007 for Fornax, Smith Castelli et al. 2008 for Antlia, and Misgeld et al. 2008 for Hydra I). More explicitely, Caldwell (1983) stated that there is a common linear relation. But his Fig. 3 might hint at a change of slope from high to low luminosities, similar to what de Vaucouleurs (1961) suggested. Interestingly, visual examination of the diagrams presented by most of the above-mentioned studies indicates consistency also with a change of slope – yet linear relations were fitted in most cases (see, however, Ferrarese et al. 2006; our colors are consistent with the ones in their Virgo cluster study in the range of brightness common to both). In Janz & Lisker (2009) we revisited the question of the universality of the CMR for dwarfs and giants.
4.2 Result
We showed the CMRs for four different representative colors in Janz & Lisker (2009). Here we choose to show the CMR in , the color with the longest wavelength baseline available to SDSS. It looks remarkably similar to the CMRs in the other colors (Fig. 1 in Janz & Lisker 2009).
First of all, the impression one can get by examining just the black points in Fig. 2 is that there is not one common linear relation from the faint to the bright galaxies.The overall shape appears more like “S” shaped. The brightest () galaxies have almost constant color, i.e. no correlation between color and brightness; the very brightest galaxies show a larger scatter. These were reported before to be morphologically different from the other galaxies in more detailed studies of the inner light profiles (e.g. Ferrarese et al. 2006; Kormendy et al. 2009; Lauer et al. 2007; Ravindranath et al. 2001; Trujillo et al. 2004). For the remaining galaxies several descriptions seem to be plausible, ranging from just an offset between two relations with similar slopes up to a curved relation.
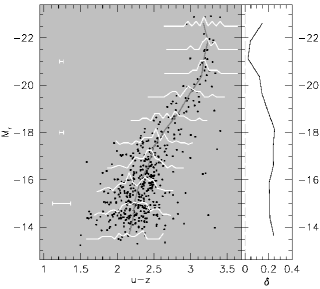
With the non-linear shape, it seems not very favorable to fit a straight line. This would not describe the data well, and there is no theoretical prediction what other function is expected. So at first, we want to make the overall shape more clearly visible, using continous, overlapping magnitude bins, in which mean and scatter are calculated. In Fig. 2 these derived relations are shown with grey lines. The first impression is confirmed: one common linear relation for dwarfs and giants cannot be seen. Moreover, the white histograms showing the galaxy distributions in the bins are clearly peaked towards the bright and the faint end, while they are rather flat at intermediate luminosity.
The scatter about the relation is greatly influenced by increasing photometric errors towards faint brightness. In order to measure the intrinsic scatter, we calculate the RMS of the scatter around the mean in running bins (clipping one time at 3) and subtract the RMS of the photometric errors
with color and mean color , averaging over the galaxies in the respective bin. Here we exclude dEs with blue cores, since they are known to have different colors (Lisker et al., 2008). This RMS difference should be zero if the scatter is only due to the measurement errors and larger if there is an intrinsic scatter. In Fig. 2 we show the CMR along with the RMS difference .
Indeed, the RMS difference is enhanced for the dwarfs and peaks around , indicating an intrinsically increased scatter, consistent with the increased intrinsic scatter for dwarfs found by Secker et al. (1997) in the Coma cluster. One can argue about the significance of the RMS difference increase for the brightest galaxies, since it is just a handful of them – nevertheless, this larger scatter might be related to the absence of a well-defined CMR at the brightest magnitudes.
5 Comparison to a Semi-Analytic Model
Dark-halo merger trees of a high resolution -body simulation of CDM structure formation were taken as input for a semi-analytic model (SAM) of the physical processes governing galaxy formation and evolution in order to produce the Numerical Galaxy Catalog (Nagashima et al., 2005). In particular, the dynamical response to starburst-induced gas removal after gas-rich mergers (also for cases intermediate between a purely baryonic cloud and a baryonic cloudfully supported by surrounding dark matter as in Yoshii & Arimoto 1987) were taken into account. This process plays a crucial role for the sizes of early-type dwarf galaxies, since the subsequent variation of the potential results in an increase in size.
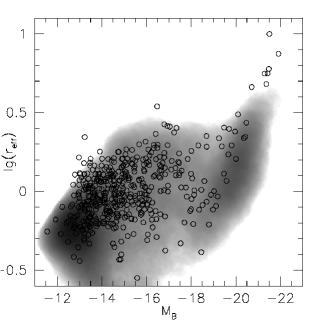
We identify model galaxies as early-type galaxies if they are bulge dominated (bulge to total ratio . To compare our data with the model we transformed SDSS magnitudes into according to Smith et al. (2002), using the galaxies’ color measured within . B-V was obtained likewise. In Fig. 3 one can see how the model galaxies compare with our observed Virgo early types. In the left panel the comparison is displayed for the size brightness relation. The model galaxies show a bimodality similar to what we observe, with low galaxy density between the two regions. Note that Nagashima et al. assume de Vaucouleurs profiles to calculate projected half-light radii from half-mass radii. For exponential profiles, which would be more appropriate for dwarfs, the model galaxies would shift upwards in the diagram by 0.11 dex (Nagashima & Yoshii, 2003).
In the model, a starburst follows in those dwarfs that form by gas-rich major mergers and the dwarfs are enlarged by the dynamic response to the subsequent gas loss. This mechanism is not at work in gas-deficient mergers, and the resulting galaxies stay smaller. Note, though, that this appears to be in contrast with the SAM of Khochfar & Silk (2006), where gas-rich mergers lead to more compact early-type galaxies than gas-poor mergers.
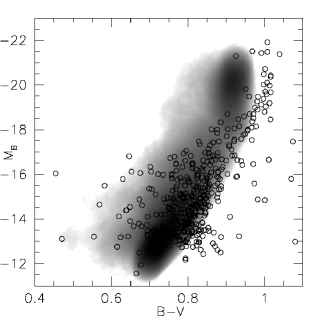
In the right panel of Fig. 3 the comparison is displayed for the CMR. The shapes of the distribution of Virgo galaxies and the model CMR are indeed not well represented by linear relations. Both the CMR and the relation between size and brightness do not show a linear, nor one common behaviour of dwarfs and giants. Nevertheless, it needs to be emphasized that there is a qualitative similarity in the shapes of observed and model CMR, in the sense that both show a similar bend at intermediate luminosities. This is noteworthy, since in the framework of the SAM, both dwarf and giants form by the same physical processes, which govern CDM structure formation, and thus both can be of cosmological origin (see also Chilingarian 2009).
Beside the similarity in the overall shape, an offset is observed. This offset could partly be due to uncertainties of the adopted synthetic stellar population model. Furthermore, the relative number of bright galaxies exceeds the observed one and the luminosity function is clearly different, which could possibly be explained with model input physics.
6 Discussion
We studied two scaling relations of the Virgo cluster early-type galaxies, based on model-independent size measurements from SDSS imaging data. In both, the relation of size and brightness and the CMR, we find noticeable unsteadinesses between dwarfs and giants. In the former relation dwarfs do not fall on the extension of the rather steep sequence of the giants. While the gross trend in the size luminosity relation can be explained by light profile shapes becoming steeper for more luminous galaxies, a closer look reveals a statistically significant distinctness in the behaviour of faint and bright galaxies. The CMR is continuous over the whole range. Yet the observed change in slope and the variation of the scatter might hint at more complex reasons for this particular behavior than what might be naively expected from having one common origin, with the very same processes shaping the CMR in the same way.
But with the comparison to the semianalytic model (notwithstanding our rather crude way of selecting early types in the SAM) we show that neither of the two findings necessarily implies a formation by substantially distinct processes. Instead, the qualitatively similar distributions of the model galaxies in the two scaling relations might hint at a formation in a cosmological context for the dwarf galaxies, hence an origin common to the giant ellipticals. This is in accordance with previous claims of no distinction between them (Ferrarese et al. 2006; Gavazzi et al. 2005; Graham & Guzmán 2003; Misgeld et al. 2008).
It must be mentioned that different approaches can also successfully explain the dwarf behavior. For example, ram pressure stripping can reproduce the radius brightness relation (Boselli et al. 2008, see also A. Boselli, this issue). Given the newly appreciated diversity of dwarf appearances we see that as an advantage rather than a shortcoming.
For future studies, the following procedure seems promising: Both relations seem to be related in one or the other way with the galaxies’ dynamics. Bernardi et al. (2005) concluded that the CMR is a result of two more fundamental relations: the Faber-Jackson relation and a relation between color and velocity dispersion. Given the slope change of the Faber-Jackson relation from giants to dwarfs (Matković & Guzmán, 2005; de Rijcke et al., 2005) a change of slope of the CMR would actually be expected. And in the semianalytic model the sizes are strongly influenced by the dynamic feedback. In the model’s context this should be closely related to the internal dynamics of the galaxies. Therefore it is desirable to obtain central velocity dispersions and kinematics for early-type dwarfs in greater numbers.
Acknowledgements.
We thank the organizers for financial support to participate in the conference. J.J. is supported by the Gottlieb Daimler and Karl Benz Foundation. J.J. and T.L. are supported by the Excellence Initiative within the German Research Foundation (DFG) through the Heidelberg Graduate School of Fundamental Physics (grant number GSC 129/1). The study is based on SDSS (http://www.sdss.org/).References
- Adelman-McCarthy et al. (2007) Adelman-McCarthy, J. K., et. al. 2007, ApJS, 172, 634
- Baum (1959) Baum, W. A. 1959, PASP, 71, 106
- Bender et al. (1992) Bender, R., Burstein, D., & Faber, S. M. 1992, ApJ, 399, 462
- Bernardi et al. (2005) Bernardi, M., Sheth, R. K., Nichol, R. C., Schneider, D. P., & Brinkmann, J. 2005, AJ, 129, 61
- Binggeli & Cameron (1991) Binggeli, B. & Cameron, L. M. 1991, A&A, 252, 27
- Binggeli & Jerjen (1998) Binggeli, B. & Jerjen, H. 1998, A&A, 333, 17
- Binggeli et al. (1985) Binggeli, B., Sandage, A., & Tammann, G. A. 1985, AJ, 90, 1681
- Boselli et al. (2008) Boselli, A., Boissier, S., Cortese, L., & Gavazzi, G. 2008, A&A, 489, 1015
- Bower et al. (1992) Bower, R. G., Lucey, J. R., & Ellis, R. S. 1992, MNRAS, 254, 601
- Caldwell (1983) Caldwell, N. 1983, AJ, 88, 804
- Caon et al. (1993) Caon, N., Capaccioli, M., & D’Onofrio, M. 1993, MNRAS, 265, 1013
- Chang et al. (2006) Chang, R., et al. 2006, MNRAS, 366, 717
- Chilingarian (2009) Chilingarian, I. 2009, MNRAS, 394, 1229
- Conselice et al. (2002) Conselice, C. J., Gallagher, III, J. S., & Wyse, R. F. G. 2002, AJ, 123, 2246
- de Rijcke et al. (2005) de Rijcke, S., Michielsen, D., Dejonghe, H., Zeilinger, W. W., & Hau, G. K. T. 2005, A&A, 438, 491
- de Vaucouleurs (1961) de Vaucouleurs, G. 1961, ApJS, 5, 233
- Djorgovski & Davis (1987) Djorgovski, S. & Davis, M. 1987, ApJ, 313, 59
- Dressler et al. (1987) Dressler, A., et.al. 1987, ApJ, 313, 42
- Faber (1973) Faber, S. M. 1973, ApJ, 179, 731
- Faber & Jackson (1976) Faber, S. M. & Jackson, R. E. 1976, ApJ, 204, 668
- Ferrarese et al. (2006) Ferrarese, L., et. al. 2006, ApJS, 164, 334
- Ferreras et al. (1999) Ferreras, I., Charlot, S., & Silk, J. 1999, ApJ, 521, 81
- Gallazzi et al. (2006) Gallazzi, A., Charlot, S., Brinchmann, J., & White, S. D. M. 2006, MNRAS, 370, 1106
- Gavazzi et al. (2002) Gavazzi, G., et. al. 2002, ApJ, 576, 135
- Gavazzi et al. (2005) Gavazzi, G., et al. 2005, A&A, 430, 411
- Graham et al. (2005) Graham, A. W., et. al. 2005, AJ, 130, 1535
- Graham & Guzmán (2003) Graham, A. W. & Guzmán, R. 2003, AJ, 125, 2936
- Graham & Worley (2008) Graham, A. W. & Worley, C. C. 2008, MNRAS, 388, 1708
- Guzman et al. (1993) Guzman, R., Lucey, J. R., & Bower, R. G. 1993, MNRAS, 265, 731
- Janz & Lisker (2008) Janz, J. & Lisker, T. 2008, ApJ, 689, L25
- Janz & Lisker (2009) Janz, J. & Lisker, T. 2009, ApJ, 696, L102
- Jerjen & Binggeli (1997) Jerjen, H. & Binggeli, B. 1997, in ASP Conf. Ser. 116, The Nature of Elliptical Galaxies; ed. M. Arnaboldi, G. S. Da Costa, & P. Saha, 239
- Karick et al. (2003) Karick, A. M., Drinkwater, M. J., & Gregg, M. D. 2003, MNRAS, 344, 188
- Khochfar & Silk (2006) Khochfar, S. & Silk, J. 2006, ApJ, 648, L21
- Kodama & Arimoto (1997) Kodama, T. & Arimoto, N. 1997, A&A, 320, 41
- Köppen et al. (2007) Köppen, J., Weidner, C., & Kroupa, P. 2007, MNRAS, 375, 673
- Kormendy (1977) Kormendy, J. 1977, ApJ, 218, 333
- Kormendy (1985) —. 1985, ApJ, 295, 73
- Kormendy et al. (2009) Kormendy, J., Fisher, D. B., Cornell, M. E., & Bender, R. 2009, ApJS, 182, 216
- Lauer et al. (2007) Lauer, T. R., et al. 2007, ApJ, 664, 226
- Lisker et al. (2006a) Lisker, T., Grebel, E. K., & Binggeli, B. 2006a, AJ, 132, 497
- Lisker et al. (2006b) Lisker, T., Glatt, K., Westera, P., & Grebel, E. K. 2006b, AJ, 132, 2432
- Lisker et al. (2008) —. 2008, AJ, 135, 380
- Lisker et al. (2007) Lisker, T., Grebel, E. K., Binggeli, B., & Glatt, K. 2007, ApJ, 660, 1186
- Lisker & Han (2008) Lisker, T. & Han, Z. 2008, ApJ, 680, 1042
- Lotz et al. (2004) Lotz, J. M., Primack, J., & Madau, P. 2004, AJ, 128, 163
- Matković & Guzmán (2005) Matković, A. & Guzmán, R. 2005, MNRAS, 362, 289
- Mei et al. (2007) Mei, S., Blakeslee, J. P., et al. 2007, ApJ, 655, 144
- Mieske et al. (2007) Mieske, S., Hilker, M., Infante, L., & Mendes de Oliveira, C. 2007, A&A, 463, 503
- Misgeld et al. (2008) Misgeld, I., Mieske, S., & Hilker, M. 2008, A&A, 486, 697
- Nagashima et al. (2005) Nagashima, M., Yahagi, H., Enoki, M., Yoshii, Y., & Gouda, N. 2005, ApJ, 634, 26
- Nagashima & Yoshii (2003) Nagashima, M. & Yoshii, Y. 2003, MNRAS, 340, 509
- Nagashima & Yoshii (2004) —. 2004, ApJ, 610, 23
- Petrosian (1976) Petrosian, V. 1976, ApJ, 209, L1
- Ravindranath et al. (2001) Ravindranath, S., Ho, L. C., Peng, C. Y., Filippenko, A. V., & Sargent, W. L. W. 2001, AJ, 122, 653
- Sandage & Visvanathan (1978a) Sandage, A. & Visvanathan, N. 1978a, ApJ, 225, 742
- Sandage & Visvanathan (1978b) —. 1978b, ApJ, 223, 707
- Schlegel et al. (1998) Schlegel, D. J., Finkbeiner, D. P., & Davis, M. 1998, ApJ, 500, 525
- Secker et al. (1997) Secker, J., Harris, W. E., & Plummer, J. D. 1997, PASP, 109, 1377
- Sérsic (1963) Sérsic, J. L. 1963, Boletin de la Asociacion Argentina de Astronomia La Plata Argentina, 6, 41
- Smith et al. (2002) Smith, et. al. 2002, AJ, 123, 2121
- Smith Castelli et al. (2008) Smith Castelli, A. V., et al. 2008, MNRAS, 386, 2311
- Trujillo et al. (2004) Trujillo, I., Erwin, P., Asensio Ramos, A., & Graham, A. W. 2004, AJ, 127, 1917
- Trujillo et al. (2001) Trujillo, I., Graham, A. W., & Caon, N. 2001, MNRAS, 326, 869
- Visvanathan & Sandage (1977) Visvanathan, N. & Sandage, A. 1977, ApJ, 216, 214
- Yoshii & Arimoto (1987) Yoshii, Y. & Arimoto, N. 1987, A&A, 188, 13
- Young & Currie (1994) Young, C. K. & Currie, M. J. 1994, MNRAS, 268, L11