Modeling scientific-citation patterns and other triangle-rich acyclic networks
Abstract
We propose a model of the evolution of the networks of scientific citations. The model takes an out-degree distribution (distribution of number of citations) and two parameters as input. The parameters capture the two main ingredients of the model, the aging of the relevance of papers and the formation of triangles when new papers cite old. We compare our model with three network structural quantities of an empirical citation network. We find that an unique point in parameter space optimizing the match between the real and model data for all quantities. The optimal parameter values suggest that the impact of scientific papers, at least in the empirical data set we model is proportional to the inverse of the number of papers since they were published.
pacs:
89.65.-s, 89.75.-kI Introduction
The boom of networks studies of the last decade Newman2003rev ; Boccaletti2006pr has potentially an impact of the structure of science itself. Network measures can help creating better bibliometric quantities to evaluate scientific impact Redner2005phystoday and the sociological aspect of scientific collaboration and exchange of ideas. Indeed, the study of scientific citations has become a subfield of complex network studies price ; Redner1998epjb ; Klemm2002pre ; Zhu2003pre ; Lehmann2003pre ; Sen2005pa ; Hajra2005pa ; Hajra2006pa ; leicht ; Wang2008pa .
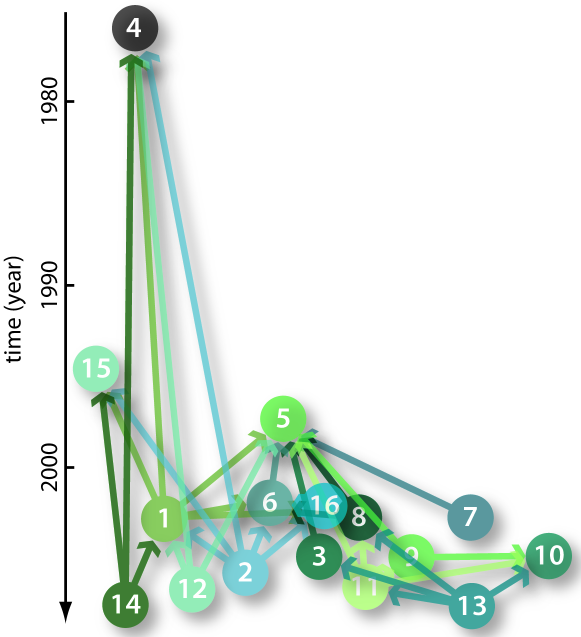
One typical feature of academic citation networks is that the number of citations to a paper decreases with its age. Inspired by this point, many works have been focused on how a paper’s age influences its ability to attract new citations Sen2005pa ; Hajra2005pa ; Hajra2006pa ; Wang2008pa (or, equally, new attachments in the network). Specifically, it is believed that the attachment rate (the rate of new citations to an old paper) is dependent on both the current number of citations (its in-degree in the network) and its age. (Here we consider citations going back in time meaning that out-degree is the number of references and in-degree is the number of citations.) Another important constraint of citation networks is that they are time ordered — of any pair of papers, one is the oldest. (It might, in practice, be more relevant to consider papers published almost simultaneously unordered, but in this work we assume this is a negligible effect). An important consequence of the time ordering is that citation networks are acyclic, i.e. there are no closed (directed) paths. In Fig. 1 we show a small citation network as an example. This network shows is the references of this paper and how they cite each other. In a recent paper Karrer2009prl , Karrer and Newman (KN) proposed a random graph model for directed acyclic graphs. In the KN model, the vertices are ordered by time and their in- and out-degrees are pre-assigned (similar to the undirected “configuration model” Molloy1995rsa ). The vertices are added to the network iteratively (from to , with being the network size), and for each new vertex , arcs (directed edges) are added from old vertices whose in-degree is lower than their prescribed value until ’s out-degree is as large as its prescribed value. Karrer and Newman validate their model with empirical measurements and get good agreements for some quantities Karrer2009prl , but their model does, as we will show, not generate as many triangles as real citation networks have. (Note that there are two topologically different directed triangles, but only one of them is acyclic, which makes the word “triangle” unique in this study.) In this work, we present a model of academic citation networks that remedies the lack of triangles in the KN model by building on mechanisms arguably at work in the scientific process. In this paper, we first discuss the structure of empirical citation networks, then present the model and last test it against three network-structural quantities of real citation networks.
II Empirical measurements and the predictions of the KN model
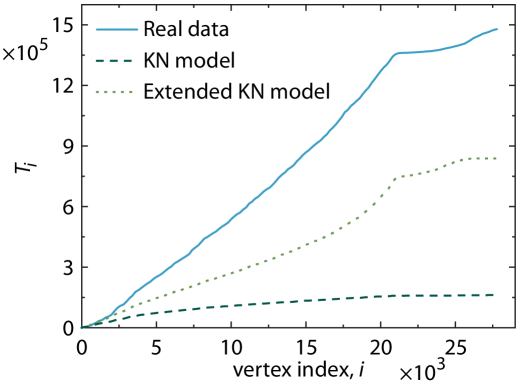
Before presenting our model we state the most important motivation for this study. In Fig. 2 we show the number of triangles in an empirical citation network consisting of papers (or rather preprints) on theoretical high-energy physics. There are in total citations (or arcs, directed edges) among them. The data set comes from preprints posted on arxiv.org between 1992 and 2003. By measurement, we define a triangle as the pattern “paper citing and , and citing ”, and calculate the number of such patterns present in the network when going through the papers from to (the order of their appearance on the website). To reduce the computational complexity, we sample each ’th -value. For comparison, we also plot the predicted number of triangles of the KN model, and a simple extension of the KN model introducing more triangles: When a new vertex enters the network, rather than randomly matching all its out-degrees with those in-degrees among the existing vertices, after first matching one out-degree randomly with an in-degree belonging to an older vertex (like the KN model), we let as many of the remaining arcs as possible to come from neighbors of (and after that, also the neighbors of its new neighbor). Note that, by the definition of the KN model both the network size and the degree sequences (both in- and out-degrees) are identical with the empirical data. Both the KN model and the extension underestimate the number of directed triangles in the real network.
III Motivation and definition of the model
In this section we will discuss and motivate our model. We start by ordering the vertices temporally as in the real data, and their out-degrees (the number of citations) are kept as the same as the original. (Alternatively the degrees can be drawn from some appropriate distribution.) We do not restrict the number of in-degrees — that will be an emergent property of the model that we will use for validation. We add the vertices one by one and fill up the out-degrees of the new vertex before adding a new.
A common assumption is that the relevance of a paper decays with its age Redner2005phystoday ; Redner1998epjb ; Klemm2002pre ; Zhu2003pre ; Sen2005pa ; Hajra2005pa ; Hajra2006pa ; Karrer2009prl . In other words, science will move away from any paper. For this reason, we let the first arc from a new vertex go to an old vertex with a probability proportional to its age to a power (where a negative reflect an attachment probability decaying with age). For to fill up the remaining out-degrees of , we attach arcs with probability to random (in- or out-) neighbors of , and otherwise (i.e. with probability ) attach arcs to older vertices with probability as above. If there is no available neighbor to attach to (we assume one vertex cannot link to another vertex twice, or to itself), we make an attachment of the first type. Note that the number of candidates whom can connect to increases with more out-degrees in the system, i.e. with time. This triangle-formation step (proposed in Ref. HK as a model of scale-free networks with a tunable clustering coefficient) is a mechanism that, we argue fits well to citation networks. To put a scientific paper in the right context one cite papers of the same theme, since these papers are similar to each other they are likely to each other. This in itself means that we can expect many triangles — if paper A cites B and C and B also cites C with a relatively large probability, which is effectively the same as the triangle formation sketched above. As a more explicit mechanism one can imagine that when working on paper A the researchers may find paper C from the reference list of paper B. In sum, our model has two input parameters and (in addition to the degrees), governing the two key ingredients — aging and triangle formation.
IV Measured quantities
Following Ref. Karrer2009prl , for each vertex , we define a parameter
| (1) |
is thus the sum of in-degrees of the vertices that have been added in the network before (i.e., from the vertex to the vertex ) minus the sum of in-degrees. As pointed out in Ref. Karrer2009prl , this parameter should satisfy the conditions for and . The interpretation of is that it is the number of arcs that connecting vertices later than to vertices earlier than Karrer2009prl . We will also measure , the probability of randomly selecting a vertex whose in-degree is , and . After the networks are constructed, we measure these three quantities and compare them with the corresponding empirical values. The results presented below for models are averages over independent network realizations.
V Results
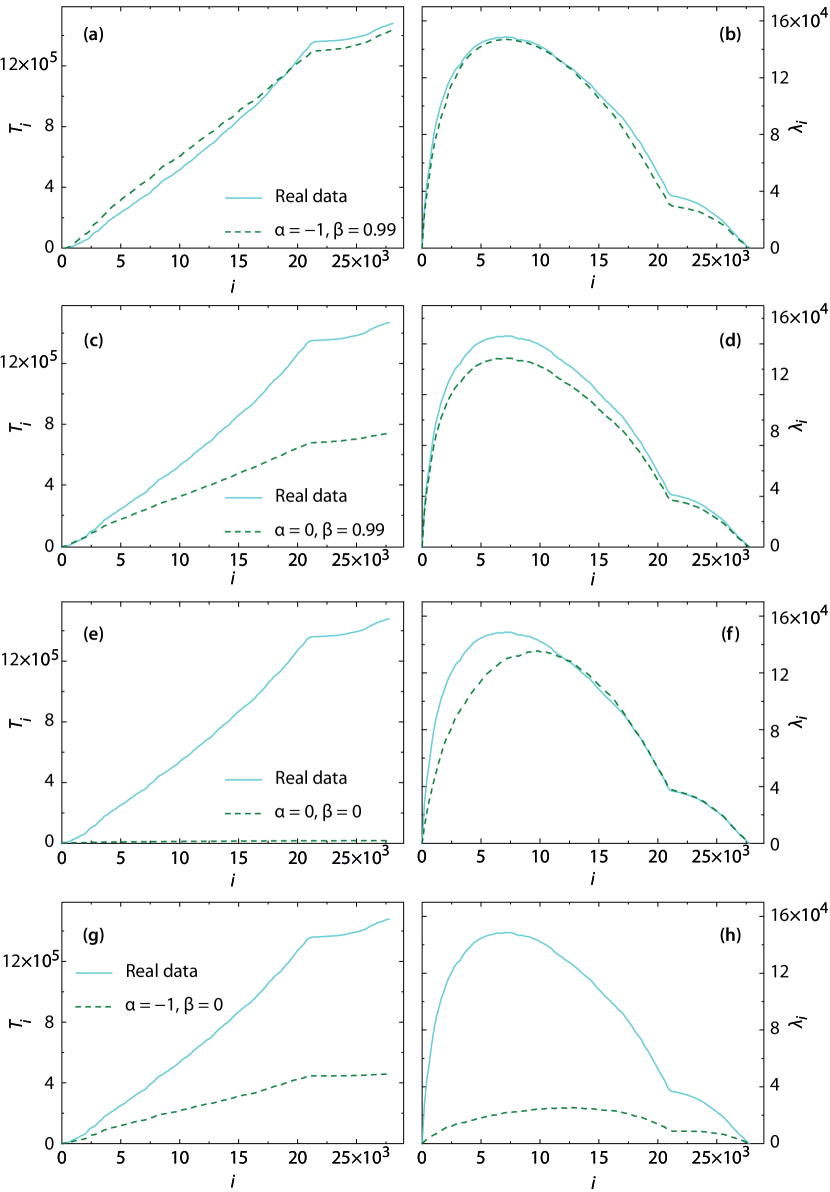
Now we turn to the numerical results for our model. We first investigate the model dependence on the parameters and and compare the values of and to the real data. By construction, large -values give large numbers of triangles. As seen in Fig. 3(a) there are (unlike the results in Fig. 2) parameters giving a number of triangles that matches the empirical curves. A negative -value is important, not only to get -values matching the empirical data, but also to obtain matching -values (Fig. 3(b)). We have scanned the region of and , and found that the combination and gives the best fit to the empirical data Notes . To give an overview of the model’s behavior we plot three other combinations of - and -values in Fig. 3. In Fig. 3 (c) and (d) we show the results for and . When the chance of acquiring new arcs is independent of age. The chance of reaching a vertex with a triangle-formation step is proportional to the degree of the vertex leading to a preferential attachment (an attachment probability increasing with degree) for high and low . (Note that the first network model with preferential attachment was a model of citation networks price .) Fig. 3 (c) shows that even though is nearly maximal, the number of triangles is not as large in the empirical data. The reason for this is that there are more successful triangle-formation steps — or, equally, that it is less probable to attach to a vertex with lower total degree than the desired total degree of the new vertex — for negative . In Fig. 3(d) and (e) we present the results for and . In this case, both the aging effect and clustering effect are absent. Not surprising, neither nor match the real data. Even though the arcs reach longer back in time for this case, the number of arcs passing (i.e. ) is lower. The data for and are plotted in Fig. 3(g) and (h). We note that with the absence of the triangle-formation step, not only the number of triangles, but also is underestimated. As a final comment to Fig. 3, the cusps around is due to a change in the raw data where the sampled database was split into different categories and the sampled papers after this point cites, on average, fewer other papers.
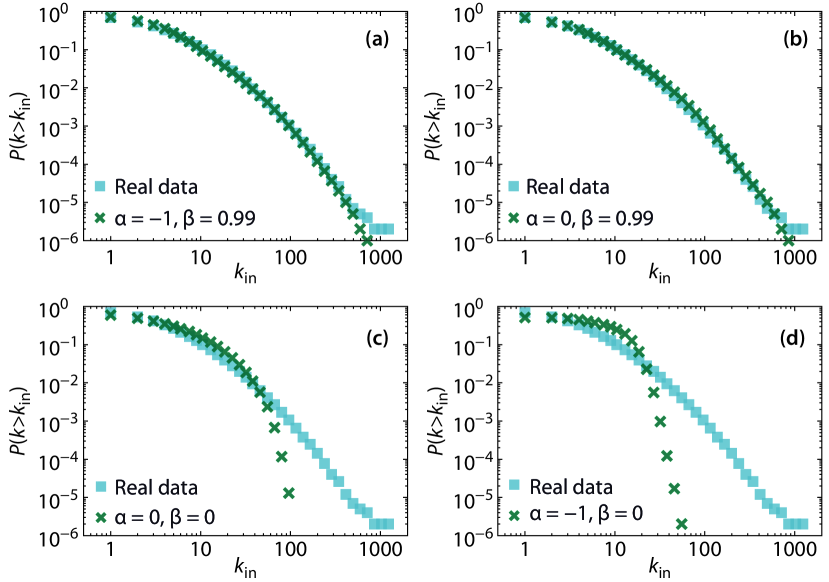
Our third quantity is the in-degree distribution that we plot in Fig. 4. The both curves with fit the real distribution well. As mentioned, there is an effective (though no necessarily linear) preferential attachment in this case, which explains the broad distributions. puts strong constraints on the in degree distribution — if both and the out-degree distribution would be fixed to the observed data (not only the out-degree distribution as in our case), then the in-degree distribution is the same as the observed data. With low -values, the in-degree distribution becomes much more narrow than the empirical data. Combining Figs. 3 and 4, we note that though appropriate large value of could generate networks with in-degree distribution fitting the empirical data, the lacking of ageing effect would fail to modeling the evolution of citation network of scientific papers. Taking all these observations into account, both aging and triangle formation seem to be important mechanisms in the citation network.
VI Conclusions
We have proposed a random, evolving network model for scientific paper citations. In our model, the attractiveness of a vertex (paper) decays with its age with power , another parameter determines the number of triangle formations (when a new paper cites two papers where one cite the other). We compared our proposed model with an empirical citation network of high-energy physics preprints posted at arxiv.org. The out-degree distribution is an input to our model. In this paper we take it from empirical data. We use three quantities to validate our model — the number of triangles, the number of arcs passing the vertex and the degree distribution. All these quantities are best modeled for parameter values and Notes . From these observations, our model suggests that in citation network of scientific papers, the probabilities of attracting new citations of the papers are about inversely proportional to their age (measured in its position in the sequence of publication) and that there is a strong tendency of citing papers where one paper cites the other. For the future, we believe it would be informative, as a complement to generative models like the present, to study the mechanisms of citations by interview studies and questionnaires to researchers.
Acknowledgements.
This research is supported by the Swedish Research Council (Z.X.W.) and the Swedish Foundation for Strategic Research (P.H.).References
- (1) M. E. J. Newman, SIAM Rev. 45, 167 (2003).
- (2) S. Boccaletti, V. Latora, Y. Moreno, M. Chavez, and D.-U. Hwang, Phys. Rep. 424, 175 (2006).
- (3) S. Redner, Phys. Today 58, 49 (2005).
- (4) D. J. de S. Price, J. Amer. Soc. Inform. Sci. 27, 292 (1976).
- (5) S. Redner, Eur. Phys. J. B 4, 131 (1998).
- (6) K. Klemm and V. M. Eguíluz, Phys. Rev. E 65, 036123 (2002).
- (7) S. Lehmann, B. Lautrup, and A. D. Jackson, Phys. Rev. E 68, 026113 (2003).
- (8) H. Zhu, X. Wang, and J.-Y. Zhu, Phys. Rev. E 68, 056121 (2003).
- (9) P. Sen, Physica A 346, 139 (2005).
- (10) K. B. Hajra and P. Sen, Physica A 346, 44 (2005).
- (11) K. B. Hajra and P. Sen, Physica A 368, 575 (2006).
- (12) E. A. Leicht, G. Clarkson, K. Shedden, and M. E. J. Newman, Eur. Phys. J. B 59, 75 (2007).
- (13) M. Wang, G. Yu, and D. Yu, Physica A 387, 4692 (2008).
- (14) B. Karrer and M. E. J. Newman, Phys. Rev. Lett. 102, 128701 (2009).
- (15) M. Molloy and B. Reed, Random Struct. Algorithms 6, 161 (1995).
- (16) P. Holme and B. J. Kim, Phys. Rev. E 65, 026107 (2002).
- (17) To fit our model to the data, we scan the region of and , with the increment for and for . For each combination of and , we obtain average and over . After that, we calculate the goodness-of-fit function , where and are obtained for our model and and for the empirical data. The sum is over each ’th -value (like the analysis of Fig. 3). The combination of and resulting in the smallest are our best fit to the empirical data.