Dense Iron Ejecta and Core-collapse Supernova Explosion in the Young Supernova Remnant G11.2–0.3111Based in part on data collected at Subaru Telescope, which is operated by the National Astronomical Observatory of Japan.
Abstract
We present the results of near-infrared spectroscopic observations of dense ( 103 cm-3) iron ejecta in the young core-collapse supernova remnant G11.2–0.3. Five ejecta knots projected to be close to its center show a large dispersion in their Doppler shifts: two knots in the east are blueshifted by more than 1,000 , while three western knots have relatively small blueshifts of 20–60 . This velocity discrepancy may indicate that the western knots have been significantly decelerated or that there exists a systematic velocity difference among the knots. One ejecta filament in the northwestern boundary, on the other hand, is redshifted by 200 , while opposite filament in the southeastern boundary shows a negligible radial motion. Some of the knots and filaments have secondary velocity components, and one knot shows a bow shock-like feature in the velocicty structure. The iron ejecta appear to be devoid of strong emission from other heavy elements, such as S, which may attest to the -rich freezeout process in the explosive nucleosynthesis of the core-collapse supernova explosion close to its center. The prominent bipolar distribution of the Fe ejecta in the northwestern and southeastern direction, along with the elongation of the central pulsar wind nebula in the perpendicular direction, is consistent with the interpretation that the supernova exploded primarily along the northwestern and southeastern direction.
1 Introduction
The final fatal scene of a massive ( 8 ) star is a sudden collapse of its Fe core and a subsequent appearance of a supernova (SN). The study of the core-collapse SNe has been one of the centerpieces of the modern astrophysics, accompanying various fundamental physics aided by the state-of-art numerical simulations and dedicated observations. Although how the core-collapse SNe explode still needs to be understood despite extensive studies of the past and present, one unequivocal prediction is the formation of Fe ejecta as the final product of the nucleosynthesis deep inside a progenitor. Since the formation and expulsion of the Fe is very sensitive to the SN explosion details, the dynamics and chemistry of the Fe ejecta in young core-collapse SN remnants (SNRs) can in principle provide critical information to understanding the core-collapse SN explosion. However, Fe ejecta in SNRs are elusive, with very limited detections to date concentrated on hot diffuse X-ray ejecta. In the optical waveband, which is sensitive to dense, cold ejecta, all the observed ejecta are dominated by the O, N, Si, or S with little contribution from the Fe. So far dense Fe-rich ejecta have never been detected as far as we are aware, and we report here the first such case in G11.2–0.3.
G11.2–0.3 is a young SNR thought to be the remains of the historical SN of AD 386 (Clark & Stephenson, 1977). It has a shell of 2′ radius at 5 kpc distance (Green et al., 1988), bright both in the radio and X-rays, along with a central pulsar and its elongated wind nebula (Green et al., 1988; Kaspi et al., 2001). G11.2–0.3 was proposed to be an evolved version of the Cassiopeia A (Cas A) SNR because of their similar radio shells (Green et al., 1988), and both may be a SN IIL/b with a red supergiant progenitor (Chevalier, 2005). Recently we discovered bright near-infrared (IR) [Fe II] emission from the Fe ejecta in G11.2–0.3 (Koo et al., 2007, hereafter Paper I). The [Fe II] emission concentrates on two opposite filaments at its northwestern (NW) and southeastern (SE) boundaries, while numerous smaller clumpy knots scattered across the SNR. Our high-resolution spectroscopic observations of the [Fe II] emission presented here reveal clear velocity differences among the Fe ejecta as well as its chemical composition, providing information for understanding the nature of the ejecta in connection with the core-collapse SN explosion in G11.2–0.3.
2 Observations and Results
We performed near-IR [Fe II] line spectroscopic observations of the SNR G11.2–0.3 in 2006 June 6–9 using the Long-slit Near-Infrared Spectrograph (Larkin et al., 1996) of the Palomar 5-m Hale Telescope. The long-slit spectrograph is equipped with a NICMOS 256 256 pixels HgCdTe detector, and the slit length and width were 38″ and 1″, respectively. We first obtained high-resolution ( 4000) spectra of the [Fe II] 1.644 m line from five bright Fe knots (which we name knots A–E) around the central pulsar222The pulsar is located very close to the geometrical center of G11.2–0.3 (Kaspi et al., 2001), and we adopt the pulsar position as the central position of the SNR in this study. and the NW and SE filaments, measuring their radial velocities (Fig. 1). We then observed the knots and filaments with the low-resolution ( 700) mode to detect both [Fe II] 1.644 and 1.599 m lines simultaneously and used their line intensities to calculate the electron number densities (see below). We also observed He I (1.083 m) and [S II] (1.029–1.037 m) lines from the knots and filaments, but detected only the He I line emission from the SE filament. All the knots and filaments were observed at least twice dithered along the slit, and the sky emission, including the OH sky lines, was subtracted using the dithered frame. In addition, we observed the knot A with the Infrared Camera and Spectrograph (IRCS; Kobayashi et al., 2000) of the 8-m Subaru Telescope on 2006 July 25. We obtained a spectrum covering almost the entire near-IR atmospheric windows of bands in the range of 1.03–2.49 m using the echelle mode with two Aladdin III InSb arrays. The slit width of IRCS was which corresponds to the spectral resolution 5,000.
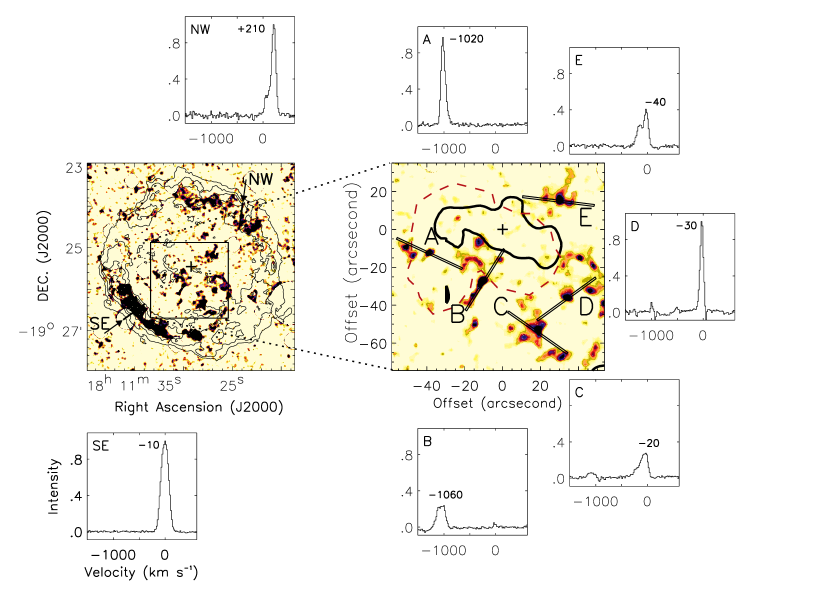
Fig. 1 presents the Palomar near-IR spectra of the [Fe II] 1.644 m transition of five Fe knots projected to be around the center and two Fe filaments at the NW and SE boundaries of G11.2–0.3 overlaid on a [Fe II] 1.644 m line emission image (Paper I). The contours in the main left panel represent the VLA radio image (Green et al., 1988). In the right panel, the thick solid contour delineates the boundary of the strong Chandra X-ray emission of the pulsar wind nebula (PWN) elongated in the northeastern (NE) and southwestern (SW) direction, while the red dashed contour represents the boundary of the PWN from radio tomography (Kaspi et al., 2001; Tam et al., 2002). The ejecta knots are projected to be within or close to the radio boundary of the PWN. The [Fe II] spectra exhibit clear velocity differences among the knots and filaments: A, B in the east are blueshifted by 1,000 ; C, D, E in the west have relatively small blueshifts of 60 . The NE filament, in contrast, shows redshifts of 200 ; the SW filament has a small Doppler shift motion of –10 . The NW–SE direction of the two filaments is almost perpendicular to the NE–SW elongation direction of the X-ray PWN. We note that in the spectra of the knots C and D there appear to be weak emission components around –1,000 , which are mainly caused by the imperfect sky subtraction of the OH sky line at 1.6389 m. The imperfect sky subtraction is also responsible for the negative dips adjacent to the emission components in the spectra. However, for the knot C, in addition to the contribution from the imperfect sky subtraction, we find that there might be additional emission from the source itself around –1,000 , although the intensity is too faint to be confirmed. Similarly the weak emission component in the knot B around 0 is also caused by the imperfect sky subtraction of the OH sky line at 1.6442 m.
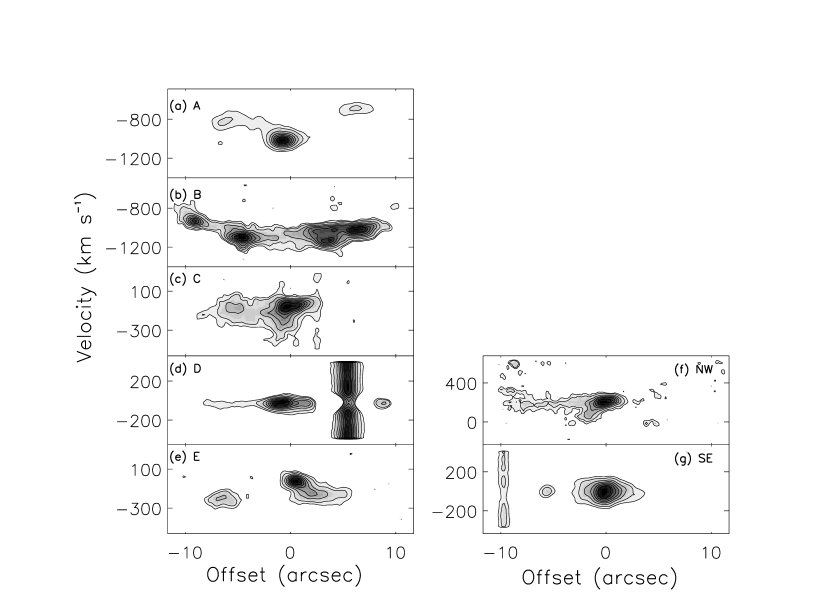
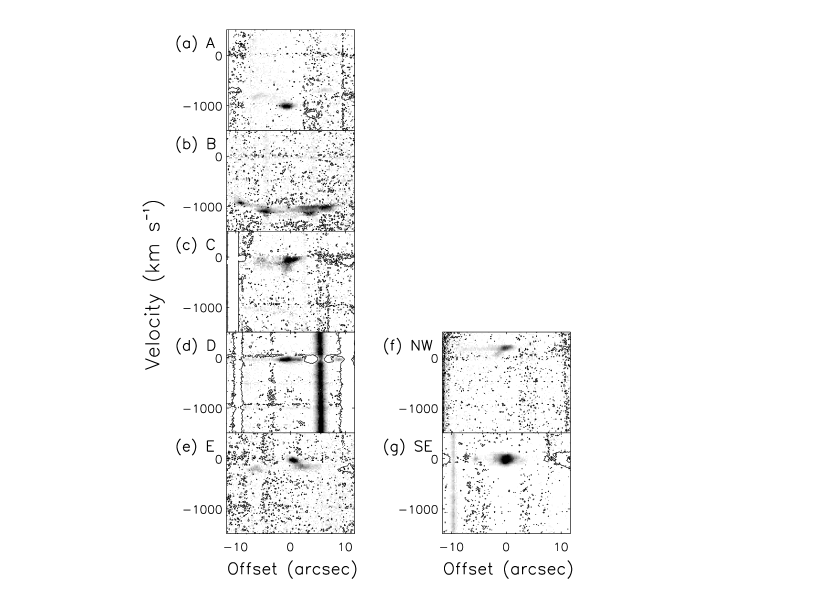
The [Fe II] 1.644 m line spectra in Fig. 1 show deviations from a simple symmetric shape except for the SE filament. It is apparent for B, C, and E with broad double-peak or flat-top profiles, while A, D, and the NW filament appear to have relatively weak secondary components slightly deviating from a symmetric profile. Fig. 2 compares their position-velocity (P-V) diagrams of the [Fe II] 1.644 m line emission, revealing the velocity structures more clearly. A and B in the east have secondary velocity components redshifted from the main component by 200 ; to the contrary, C, E and the NW filament in the west have blueshifted secondary components. For the knot A, its central part appears to have a bow shock-like feature in the P-V diagram (see below). In Fig. 3 we present the P-V diagrams of the entire velocity range of –1400 and 400 covered by our observations, highlighting negative pixels caused by the subtraction of a dithered frame by contours. The aforementioned negative OH residuals are visible in some panels, especially in (d), while there is no bright Fe emission outside the velocity ranges covered in Fig. 2.
Fig. 4 (top panel) presents our Subaru spectrum of the knot A covering most of the near-IR atmospheric windows in the 1.02–2.4 m range. Only the lines from Fe ion (Fe+) are detected, including the strong transitions at 1.257 and 1.644 m and relatively weak ones at 1.321, 1.534, and 1.664 m. The spectrum is somewhat noisy at 1.1 m, but appears to be devoid of the S ([S II] 1.290–1.037 m and [S I] 1.082 m) and O (O I 1.129 m) lines which are much brighter than the Fe lines in the O-rich SN ejecta of Cas A (Gerardy & Fesen, 2001). The upper limits, at the 90 % confidence level, of the line intensities of these lines are approximately 0.17 ([S II] lines), 0.15 ([S I] line), and 0.47 (O I lines) times of that of the [Fe II] line at 1.257 m. If the Cas A ejecta suffered the same extinction 13 of G11.2–0.3, the [S II] lines would be 10 times brighter than the [Fe II] line at 1.257 m, while the [S I] and O I lines would be roughly as bright as the [Fe II] line, indicating that the dense [Fe II] knots in G11.2–0.3 are different from the O-rich ejecta found in other SNRs such as Cas A. The absence of He I line (1.083 m) in the spectrum of the knot A is also consistent with its ejecta origin, not the circumstellar origin. The upper limit of the He I line is almost the same as that of the [S I] line. The inset in Fig. 4 shows a magnified view of the [Fe II] 1.644 m line emission, identifying a weak velocity component at the longer wavelength buried in the main component. The bottom panel presents a bow shock-like P-V diagram of the 1.644 m line emission: the weak velocity component in the line profile appears as the redshifted emission at the both edges compared to the peak emission at the center in the P-V diagram.
The electron number densities of the knot A and the NW filament based on the intensity ratios of the [Fe II] 1.644 and 1.599 m transitions are 3 104 and 5 103 , respectively. (Note that it is 7 103 for the SE filament [Paper I].) For this we used the atomic parameters from CLOUDY (Ferland et al., 1998) and solved the rate equations of 16 levels. We also corrected for the extinction effect of = 13 mag and assumed the electron temperature to be 5,000 K. The observed (= reddened) fluxes of the 1.644 m line emission of the five ejecta knots (A–E) are in the range of (3.8–9.0) 10-14 ergs sec-1 cm-2, which, together with the above electron number density of the knot A, corresponds to the mass of the ejecta knots in the range of (0.8–1.8) 10-6 .
3 Discussions and Conclusions
The [Fe II] emission in G11.2–0.3 primarily consists of two bipolar filaments in the NW and SE boundaries and clumpy internal knots scattered across the SNR. In Paper I we proposed an interpretation that the internal knots and the NW filament are Fe ejecta from the SN explosion, while the SE filament has contributions from both the Fe ejecta and swept-up circumstellar material (CSM). Our results here reaffirm the previous interpretation and also provide new information as follows. First, the large ( 1,000 ) blueshifts of the two eastern knots (A, B) evince that they are indeed Fe ejecta produced in the SN explosion. Their radial velocities are roughly comparable to those of the SN ejecta knots in other young SNRs (e.g., Ghavamian et al., 2005), while they move much faster than shocked CSM (e.g., Fesen, 2001). The lack of strong emission from any elements other than Fe is consistent with the interpretation of the SN ejecta origin of A, B as well. The ejecta nature of A, B then asserts that other Fe knots are SN ejecta, including C, D, E in the west. For the NW and SE filaments, the former shows the large redshift of 200 , which, together with its knotty emission feature along the inner boundary of the SNR shell, supports the interpretation that it is an aggregate of Fe SN ejecta knots. The absence of any significant Doppler shift in the SE filament, on the other hand, confirms its location at the tangential boundary of G11.2–0.3, and the detection of the He I (1.083 m) line emission (see § 2) manifests the existence of the swept-up CSM in the SE filament in addition to the Fe ejecta.
The most conspicuous feature in the radial velocity distribution of the Fe ejecta in G11.2–0.3 is the large ( 1,000 ) differences between the eastern (A, B) and western (C, D, E) knots which are projected to be close to the center. Obviously the large blueshifts of A, B are quite notable; however, the small Doppler shifts of C, D, E are also rather unexpected, given that even the NW filament near the SNR boundary shows more substantial radial velocities. We briefly consider two possibilities as the origin of the velocity distribution of the knots. First, the small Doppler shifts of C, D, E can be explained if they have been significantly decelerated compared to A, B since the SN explosion. The circumstellar material from the progenitor or material from the outer envelop of the SN can in principle be responsible for the deceleration. Secondly, if there is a systematic velocity shift of –500 between the eastern and western knots, their velocity discrepancy can be explained as A, B move towards us while C, D, E move away from us. Such a systematic velocity of the SN ejecta is not rare and has been reported in several other young SNRs (e.g., Ghavamian et al., 2005). Or, for the case of G11.2–0.3, if the central ejecta have been swept up by the central PWN, the latter may produce such a systematic velocity (e.g., van der Swaluw et al., 2004). We note that the bow-shock like P-V diagram of the knot A can be explained by this scenario: if the knot A has moved towards us, the ram pressure-conserving reverse shock of the SNR can produce such a bow shock feature.
No other lines are identified from the Fe ejecta in G11.2–0.3 than the He I line from the SE filament. This supports the interpretation that the SE filament, in contrast to the other knots and filament, has contributions from both the SN ejecta and shocked CSM (Paper I). While the detection of the He I line supports for the existence of the CSM, the increased abundances in the best-fit spectrum of the Chandra X-ray data (Roberts et al., 2003) may reaffirm the existence of the ejecta in the SE filament, although the X-ray spectrum appears to be inadeqaute for thorough abundance analyses. On the other hand, the absence of S (both S I and S+) and O I in our Subaru spectrum suggests that the Fe ejecta in G11.2–0.3 can be much different from those found in O-rich SNR Cas A (§ 2) in their chemical compositions and/or ionization states. Given the ionization potentials of Fe I (7.90 eV), Fe+ (16.18 eV), S+ (23.33 eV), and O I (13.62 eV), it is highly unlikely that S is in S++ while Fe is in Fe+, although some O could in principle be O+. The absence of S indicates that the Fe ejecta in G11.2–0.3 may have little contribution from other heavy elements of the SN nucleosysnthesis, suggesting that at least part of Fe ejecta in core-collapse SN explosion can be produced without intense microscopic material mixing. One way to produce such Fe ejecta in the explosive nucleosynthesis of the core-collapse SNe can be the -rich freezeout process where the high temperature and relatively low density of the shocked innermost layers of a SN exclusively produce the Fe (Woosley & Hoffman, 1991; Meyer et al., 1998; Hwang & Laming, 2003). Therefore, the Fe ejecta in G11.2–0.3 may represent the end product of the explosive SN nucleosynthesis via the -rich freezeout process at the progenitor’s core which were expelled outside without significant material mixing.
The prominent mode of the distribution of the dense Fe ejecta in G11.2–0.3 is the bipolar pattern along the NW–SE direction of the two filaments. This direction is almost perpendicular to the NE–SW elongation direction of the X-ray PWN (Fig. 1), and the latter direction most likely represents either the rotational (= polar) or equatorial axis of the pulsar (Kaspi et al., 2001). It is now generally accepted that the core-collapse SN explosion is mostly asymmetric with major explosion along the progenitor’s rotational axis (e.g., Janka et al., 2005; Burrows et al., 2005; Leonard et al., 2006; Wheeler et al., 2008), which predicts the Fe ejecta from the core to mainly distribute in a bipolar pattern along the rotational axis. Therefore, it may be the case that the NW–SE direction of the Fe ejecta represents the progenitor’s rotational axis along which the SN primarily exploded. If so, the NE–SW elongation of the X-ray PWN may correspond to equatorial flows from the pulsar as observed around the Crab pulsar (Weisskopf et al., 2000). The collimation angles of the NW and SE filaments are somewhat large ( 60∘); however, this is consistent with some predictions of core-collapse SN explosions induced by neutrino heating or even magneto-hydrodynamics jets. For the latter case, it is required that the progenitor is possessed of normal (or weak) magnetic field and slow rotation to have large collimation angles, which agrees with the inferred magnetic field ( 1.7 1012 G) and observed rotational period ( 65 ms) of the central pulsar of G11.2–0.3 (Torii et al., 1999).
References
- Burrows et al. (2005) Burrows, A., Walder, R., Ott, C. D., & Livne, E. 2005, ASPC, 332, 350
- Chevalier (2005) Chevalier, R. A. 2005, ApJ, 619, 839
- Clark & Stephenson (1977) Clark, D. H., & Stephenson, F. R. 1977, The Historical Suprenovae, Pergamon, New York
- Cordes et al. (1993) Cordes, J. M., Romani, R. W., & Lundgre, S. C. 1993, Nature, 362, 133
- Ferland et al. (1998) Ferland, G., J., Korista, K. T., Verner, D. A., Ferguson, J. W., Kingdon, J. B., & Verner, E. M. 1998, PASP, 110, 761
- Fesen (2001) Fesen, R. A. 2001, ApJS, 133, 161
- Fesen et al. (2006) Fesen, R. A., et al. 2006, ApJ, 645, 283
- Gerardy & Fesen (2001) Gerardy, C. L., & Fesen, R. A. 2001, AJ, 121, 2781
- Ghavamian et al. (2005) Ghavamian, P., Hughes, J. P., & Williams, T. B. 2005, ApJ, 635, 365
- Green et al. (1988) Green, D. A., Gull, S. F., Tan, S. M., & Simon, A. J. B. 1988, MNRAS, 231, 735
- Haas et al. (1990) Haas, M. R., et al. 1990, ApJ, 360, 257
- Hughes et al. (2000) Hughes, J. P., Rakowski, C. E., Burrows, D. N., & Slane, P. O. 2000, ApJ, 528, L109
- Hwang & Laming (2003) Hwang, U., & Laming, J. M. 2003, ApJ597, 362
- Janka et al. (2005) Janka, H.-Th., Scheck, K., Kifonidis, K., Muller, E., & Plewa, T. 2005, ASPC, 332, 363
- Kaspi et al. (2001) Kaspi, V. M., Roberts, M. E., Vasisht, G., Gotthelf, E. V., Pivovaroff, M., & Kawai, N. 2001, ApJ, 560, 371
- Kifondis et al. (2000) Kifondis, K., Plewa, T., Hanka, H.-TH, & Muller E. 2000, ApJ, 531, L123
- Kobayashi et al. (2000) Kobayashi, N., et al. 2000, Proc. SPIE, 4008, 1056
- Koo et al. (2007) Koo, B.-C., Moon, D.-S., Lee, H.-G., Matthews, K., & Lee, J.-J. 2007, ApJ, 657, 308 (Paper I)
- Larkin et al. (1996) Larkin, J. E., Knop, R. A., Lin, S., Matthews, K., & Soifer, B. T., 1996, PASP, 108, 211
- Leonard et al. (2006) Leonard, D. C., et al. 2006, Nature, 440, 505
- Meyer et al. (1998) Meyer, B. S., Krishnan, T. D., & Clayton, D. D. ApJ, 498, 808
- Roberts et al. (2003) Roberts, M. S. E., Tam, C., Kaspi, V. M., Lyutikov, M., Vasisht, G., Pivovaroff, M., Gotthelf, E. V., & Kawai, N. 2003, ApJ, 588, 992
- Tam et al. (2002) Tam, C., Roberts, M. E., & Kaspi, V. M. 2002, ApJ, 572, 202
- Torii et al. (1999) Torii, K., Tsunemi, H., Dotani, T., Mitsuda, K., Kawai, N., Kinugasa, K., Saito, Y., & Shibata, S. 1999, ApJ, 523, L69
- van der Swaluw et al. (2004) van der Swaluw, E., Downes, T. P., & Keegan, R. 2004, å, 420, 937
- Walder et al. (2005) Walder, R., Burrows, A., Ott, C. D., Livne, E., Lichtenstadt, I., & Jarrah, M. 2005, ApJ, 626, 317
- Wang et al. (2001) Wang, L., Howell, D. A., Höflich, P., & Wheeler, J. C. 2001, ApJ, 550, 1030
- Wheeler, Meier, & Wilson (2002) Wheeler, J. C., Meier, D. L., & Wilson, J. R. 2002, ApJ, 568, 807
- Weisskopf et al. (2000) Weisskopf, M. C. 2000, ApJ, 536, L81
- Wheeler et al. (2008) Wheeler, J. C., Maund, J. R., & Couch, S. M. 2008, ApJ, 677, 1091
- Woosley & Hoffman (1991) Woosley, S. E., & Hoffman, R. D. 1991, ApJ, 368, L31