Comparison of reconstruction algorithms for digital breast tomosynthesis
Abstract
Digital breast tomosynthesis (DBT) is an emerging modality for breast imaging. A typical tomosynthesis image is reconstructed from projection data acquired at a limited number of views over a limited angular range. In general, the quantitative accuracy of the image can be significantly compromised by severe artifacts and non-isotropic resolution resulting from the incomplete data. Nevertheless, it has been demonstrated that DBT may yield useful information for detection/classification tasks and thus is considered a promising breast imaging modality currently undergoing pre-clinical evaluation trials. The purpose of this work is to conduct a preliminary, but systematic, investigation and evaluation of the properties of reconstruction algorithms that have been proposed for DBT. We use a breast phantom designed for DBT evaluation to generate analytic projection data for a typical DBT configuration, which is currently undergoing pre-clinical evaluation. The reconstruction algorithms under comparison include (i) filtered backprojection (FBP), (ii) expectation maximization (EM), and (iii) TV-minimization algorithms. Results of our studies indicate that FBP reconstructed images are generally noisier and demonstrate lower in-depth resolution than those obtained through iterative reconstruction and that the TV-minimization reconstruction yield images with reduced artifacts as compared to that obtained with other algorithms under study.
I Introduction
The breast cancer death rate declined by an average of 2.3% per year between 1990 and 2002 [1]. This has been attributed to earlier detection of breast cancer through mammography screening. In a mammographic exam, two x-ray projections of each breast are acquired in cranio-caudal and mediolateral-oblique views. While mammography is considered the gold standard in breast imaging, mass lesion detection is limited by anatomic background structures [2], which can obscure lesions or mimic a lesion appearance.
This limitation can be significantly reduced in tomosynthesis imaging, in which a volume image is reconstructed from projection data acquired at a limited number of views over a limited angular range. Typically, the number of views ranges between 11 and 21, whereas the angle ranges between 15 and 50 degrees. Tissue structures that are overlaying in conventional mammography can be resolved in the reconstructed volume, and lesions can thus become more conspicuous. Because of the data incompleteness in DBT the quantitative accuracy of DBT images is generally compromised significantly by severe artifacts and non-isotropic resolution. However, the purpose of DBT is not to provide an accurate attenuation map of the breast. Instead, DBT is aiming only at providing a clinically useful image, i.e., to “remove visual clutter” [3], in terms of detection/classification tasks.
The advent of digital detectors for mammography has made DBT become tangible since the late 1990s. The development of DBT was initialized by a breast mammographer, Daniel Kopans and colleagues, at the Massachusetts General Hospital [4]. Currently, a number of DBT prototypes have been built, implementing a range of acquisition geometries [5, 6, 7, 8]. In general, reconstruction algorithms for DBT that have been explored fall into two broad categories, namely filtered backprojection [5, 6], and iterative methods [8, 9].
Accurate image reconstruction in DBT is challenging because of the high degree of data incompleteness. Therefore no analytic solution exists for quantitatively accurate image reconstruction from projection data. On the other hand, iterative methods have been used to address image reconstruction in DBT, and they appear to yield visually improved images over those obtained with the non-iterative algorithms. In DBT, high in-plane resolution is required in order to visualize microcalcification clusters. The in-depth resolution of the images is poor largely because of the limited angular range. Typically, the image sampling is non-isotropic, with an in-plane resolution of up to a factor of 10 higher than the in-depth resolution, which can lead to artifacts during reconstruction. While this anisotropy could in principle be remedied by increasing the sampling grid resolution, this approach is not practically feasible because of the large data size. Currently, a typical tomosynthesis image that adequately covers the breast volume consists of about 1.328 voxels (corresponding to a resolution of mm3).
The purpose of this work is to compare reconstruction methods that are currently used for and/or have been proposed for DBT reconstruction. Our comparison study is based on an analytic phantom that we have developed for the purpose of DBT algorithm evaluation. Dominant features of clinical relevance have been incorporated into this model, namely the overall breast shapes which causes a drop-off in intensity towards the skinline, spherical structures to represent tumor lesions, as well as microcalcification clusters.
II Breast Phantom


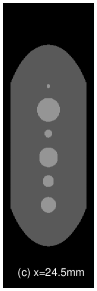

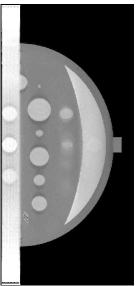
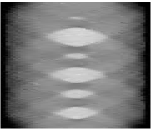
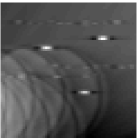
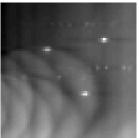
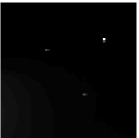
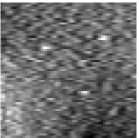
A breast phantom was designed to provide a basis for algorithm comparison. It consists of objects with different geometric shapes to allow for analytic computation of the projection data. The overall shape of the compressed breast of 50 mm thickness is modeled by a truncated ellipsoid. Attenuation coefficients at a photon energy of 30 keV [10] were used for phantom materials simulating the fibroglandular, tumour and muscle tissues, as well as microcalcifications in the breast. In Fig. 1, we display the phantom images within 2D planes specified by (a) mm, by (b) mm, (c) mm, and (d) mm, respectively. As shown in Fig. 1a, the crescent-shaped region, representing the fibroglandular tissue region of the breast, is attached to a rectangular slab of higher attenuation, simulating the pectoralis muscle. It can be observed in Fig. 1 that numerous test objects of different sizes and contrast levels are embedded in the phantom for simulating mass lesions and microcalcifications. In particular, a row of three ellipsoids is embedded in the pectoralis muscle (see Fig. 1(b)), with equal in-plane diameters but varying flatness, thus allowing one to evaluate whether shapes of equal in-plane profile, but different in-depth profiles, can be resolved. Furthermore, six spheres of different diameters, ranging from 5 mm to 15 mm, are equally distributed in the fatty area of the breast (see Fig. 1(c)). It can also be observed in Fig. 1(d) that three pairs of stacked spheres of identical diameter mm are embedded in the breast region with different spacings of , , and , respectively, for these pairs. Finally, two clusters of small spheres of diameters 0.3 mm and 0.15 mm are included to model microcalcifications.
III Scanning Configuration
In this work, we consider a tomosynthesis scanning configuration with parameters similar to those of the first GE tomosynthesis prototype for breast imaging [9]. In this configuration, the source is acquiring data at 11 projection views uniformly distributed over an arc of 90 degrees. The source-to-detector distance is 660 mm, whereas the distance between the source and center-of-rotation is 460 mm. The detector plane is perpendicular to the line connecting the x-ray source and the detector center, at the center (6th) projection, and the detector remains stationary while the x-ray source rotates along the arc. The detector size is 180 mm85 mm with the shorter side perpendicular to the plane of rotation, and the detector-bin size is 200 microns. In our configuration, the object center is located 50 mm above the detector.
IV Reconstruction Algorithms
Noiseless projection data were computed analytically from the breast phantom for the scanning configuration described above. Noisy data were created by adding Poisson noise to the noiseless projection data. The photon counts in projection data were weighted to account for variations in the source-to-detector-bin distance as well as variations in the effective area of the detector-bin surface due to oblique x-ray incidence. We have used a typical clinical exposure to determine the added noise level. From the projection data, images within 3D arrays with a voxel size of 0.2 x 0.2 x 1mm3 were reconstructed by use of different reconstruction algorithms.
IV-A The FBP algorithm
For the filtering and backprojection reconstruction (FBP) [11], each projection image is filtered with a ramp filter and then back-projected using a cone-beam geometry. A von Hann window is applied to supress high frequencies.
IV-B The EM algorithm
In each iteration of the expectation-maximization algorihtm, the current image estimate is updated by
| (1) |
where is the projection data, and are the forward and backprojection operators, , and indicates a division between the vector elements. In our implementation, a matched projector/backprojector pair is used with Gaussian smoothing between iterations.
IV-C The TV-minimization algorithm
In the TV-minimization algorithm [12], the image is obtained by solving an optimization problem:
| (2) |
where and are discrete image and data, and M is the linear operator representing the cone-beam forward projection and is the reconstructed image. The parameter can be selected for controlling the impact level of potential data inconsistency on the image reconstruction.
V Results
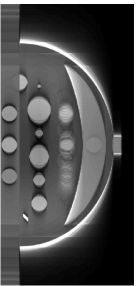


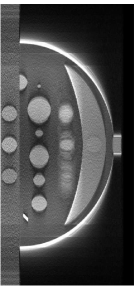
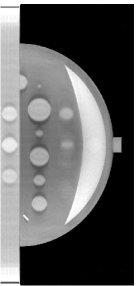
Using the tomosynthesis data produced from the breast phantom with the scanning configuration described, we have carried out a preliminary numerical studies to compare the performance of the FBP, EM, and TV algorithms. In Fig. 2, we displayed the images within the plane mm reconstructed by use of the FBP (left), EM (middle), and TV (right) algorithms. The true image within the corresponding slice is shown in Fig. 1(a). As expected, because of the strong data incompleteness in tomosynthesis, all reconstructions exhibit obvious artifacts. Out-of-plane objects create conspicuous ghosting artifacts in all reconstructions, but most severe in the FBP reconstruction. We refer to these artifacts as structure noise. Among these algorithms, TV algorithm appears to produce more uniform images than do others. Furthermore, in the FBP reconstruction, edges are ”enhanced” by the ramp filtering. The noisy reconstructions are visually similar, suggesting that the image noise is dominated by structure noise caused by out-of-plane objects. It is also observable that the noise properties of each algorithm is different. The EM reconstruction appears most smooth, while the TV reconstruction exhibits some “speckle noise”, i.e., spikes, in an otherwise smooth image.
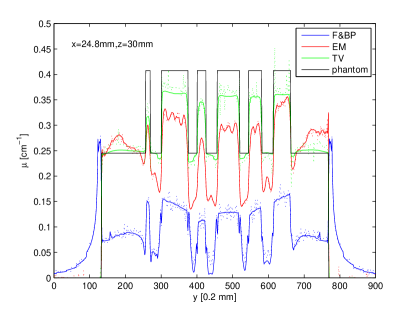
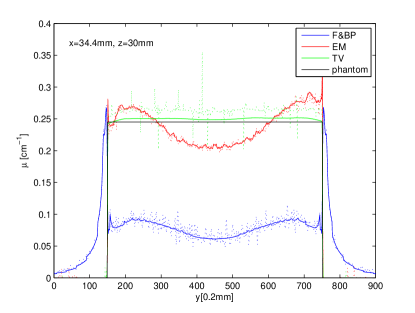
In Figs. 3, and 4, we show the image profiles on three different lines through the reconstructed image within the center plane (i.e., mm) of the image. The reconstruction properties discussed above can be observed in these profile results. Clearly, the FBP reconstruction appears most noisy, which is expected because the ramp filtering tends to amplify noise. There is a considerable DC shift for FBP reconstruction, as well as for the EM reconstruction. From the profile across spheres of varying diameters in Fig. 3, it can be observed that that in-plane resolution is maintained in DBT, which is the reason for the clinical usefulness of DBT. The profile in Fig. 4 is on a line through a uniform section of the phantom. Uniformity appears to be best reproduced by the TV reconstruction. In the TV reconstruction, a shift between noiseless and noisy data can be observed.
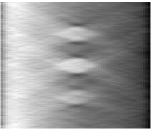
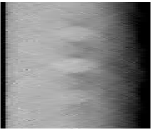
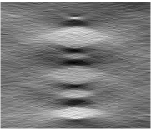
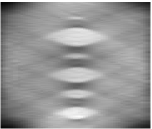
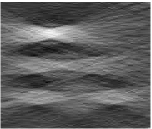
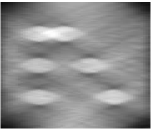
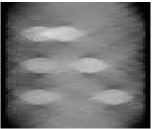
We also show in Fig. 5 the images from noisy data within planes that are parallel to the source-motion plane and perpendicular to the detector. The true images corresponding to those in rows 1, 2, and 3 of Fig. 5 are shown in in Figs. 1(b), 1(c), and 1(d), respectively. As the results indicate, none of the algorithms recover the true shape of the the ellipsoids of varying flatness in the first row. Rather, the variation in flatness results in a variation of contrast. Furthermore, an increase in overall intensity across the uniform pectoralis muscle can be observed for the iterative algorithms. For all reconstructions, as shown in the second row of Fig. 5, the spheres of different sizes are elongated due to the limited angular range. Objects are most uniform in the TV reconstruction and most blurred in the FBP slice. The improved in-depth resolution of the iterative algorithms is also demonstrated for stacked spheres shown in the third row of Fig. 5. Both algorithms clearly separate spheres spaced by 2d, while FBP still shows some overlap. In all slices obtained through FBP reconstruction, quantum noise is quite pronounced. For the iterative algorithms, structure noise is dominant.
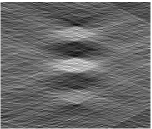
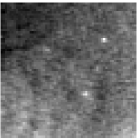
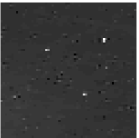
Finally, we show in Fig. 6 a region-of-interest (ROI) in the in-focus plane of a microcalcification (MC) cluster. The top row shows reconstructions from noiseless data, the bottom row shows reconstructions from noisy data. The entire cluster consists of 6 MC, with another triangular arrangement 6 mm below the one depicted. In the noiseless images, patterns caused by streaking artifacts can be perceived for the FBP and EM reconstructions. Image quality in the TV reconstruction is clearly superior in this situation.
VI Conclusion
We presented a systematic comparison of three reconstruction methods (FBP, EM and TV), for noiseless and noisy phantom data acquired for a tomosynthesis scanning configuration. The comparison was based on a phantom that was specifically designed for evaluating tomosynthesis images. Our study demonstrates that all reconstructed images exhibit artifacts, because of the incomplete projection data available for reconstruction. However, in-depth resolution was higher in images from iterative reconstructions, and therefore ghosting artifacts were also less conspicuous in the iterative reconstructions. Furthermore, structure noise from out-of-plane objects was dominant for iterative reconstructions, while quantum noise became visible in the FBP reconstruction. The FBP reconstruction also showed artifacts caused by the ramp filtering. In summary, our study indicates that iterative algorithms may provide higher image quality for tomosynthesis image reconstruction than FBP-based reconstruction.
Acknowledgment
This work was funded in part by NIH grants R33 CA109963, R01 EB000225, and K01 EB003913 (EYS).
References
- [1] American Cancer Society. Cancer Facts and Figures 2006. American Cancer Society, Atlanta, 2006.
- [2] A E Burgess, F L Jacobson, and P F Judy. Human observer detection experiments with mammograms and power-law noise. Med. Phys., 28:419–437, 2001.
- [3] J T Dobbins, III and D J Godfrey. Digital x-ray tomosynthesis: current state of the art and clinical potential. Phys. Med. Biol., 48:R65–R106, 2003.
- [4] L T Niklason, B T Christian, L E Niklason, D B Kopans, D E Castleberry, B H Opsahl-Ong, C E Landberg, P J Slanetz, A A Giardino, R Moore, D Albagli, M C DeJule, P F Fitzgerald, D F Fobare, B W Giambattista, R F Kwasnick, J Liu, S J Lubowski, G E Possin, J F Richotte, C-Y Wei, and R F Wirth. Digital tomosynthesis in breast imaging. Radiology, 205:399–406, 1997.
- [5] B Ren, C Ruth, J Stein, A Smith, I Shaw, and Z Jing. Design and performance of the prototype full field breast tomosynthesis system with selenium-based flat panel detector. In Proc. SPIE, volume 5745, page 550, 2005.
- [6] T Mertelmeier, J Orman, W Haerer, and M K Dudam. Optimizing filtered backprojection reconstruction for a breast tomosynthesis prototype device. In Proc. SPIE, volume 6142, page 61420F, 2006.
- [7] A D A Maidment, C Ullberg, K Lindman, L Adelöw, J Egerström, M Eklund, T Francke, U Jordung, T Kristoffersson, L Lindqvist, D Marchal, H Olla, E Penton, J Rantanen, S Solokov, N Weber, and H Westerberg. Evaluation of a photon-counting breast tomosynthesis imaging system. In Proc. SPIE, volume 6142, page 61420B, 2006.
- [8] Y H Zhang, H P Chan, B Sahiner, J Wei, M M Goodsitt, L M Hadjiiski, J Ge, and C A Zhou. A comparative study of limited-angle cone-beam reconstruction methods for breast tomosynthesis. Med. Phys., 33:3781–3795, 2006.
- [9] T Wu, A Stewart, M Stanton, T McCauley, W Phillips, D B Kopans, R H Moore, J W Eberhard, B Opsahl-Ong, L Niklason, and M B Williams. Tomographic mammography using a limited number of low-dose cone-beam projection images. Med. Phys., 30:365–380, 2003.
- [10] P C Johns and M J Yaffe. X-ray characterisation of normal and neoplastic breast tissues. Phys. Med. Biol., 32:675–695, 1987.
- [11] T Wu, R H Moore, E A Rafferty, and D B Kopans. A comparison of reconstruction algorithms for breast tomosynthesis. Med. Phys., 31:2636–2647, 2004.
- [12] EY Sidky, CM Kao, and X Pan. Accurate image reconstruction from few-views and limited-angle data in divergent-beam CT. Journal of X-Ray Science and Technology, 14:119–139, 2006.