The outburst duration and duty-cycle of GRS 1915+105
Abstract
The extraordinarily long outburst of GRS 1915+105 makes it one of the most remarkable low-mass X-ray binaries (LMXBs). It has been in a state of constant outburst since its discovery in 1992, an eruption which has persisted 100 times longer than those of more typical LXMBs. The long orbital period of GRS 1915+105 implies that it contains large and massive accretion disc which is able to fuel its extreme outburst. In this paper, we address the longevity of the outburst and quiescence phases of GRS 1915+105 using Smooth Particle Hydrodynamics (SPH) simulations of its accretion disc through many outburst cycles. Our model is set in the two- framework and includes the effects of the thermo-viscous instability, tidal torques, irradiation by central X-rays and wind mass loss. We explore the model parameter space and the examine the impact of the various ingredients. We predict that the outburst of GRS 1915+105 should last a minimum of 20 years and possibly up to years if X-ray irradiation is very significant. The predicted recurrence times are of the order of years, making the X-ray duty cycle a few . Such a low duty cycle may mean that GRS 1915+105 is not an anomaly among the more standard LMXBs and that many similar, but quiescent, systems could be present in the Galaxy.
keywords:
binaries: close – stars: evolution – method: numerical, SPH1 Introduction
Low mass X-ray binaries (LMXB) are bright X-ray sources consisting of an accreting black hole/neutron star primary and a Roche-lobe filling, low-mass secondary star. Matter is transferred from the secondary star via the inner-Lagrange (L1) point and forms an accretion disc around the primary. In some cases the accretion disc undergoes sporadic outbursts which are thought to be triggered by a thermal-viscous instability, resulting in an increased mass accretion rate onto the primary (e.g. Lasota, 2001) and a rapid X-ray brightening. Many transient systems have been observed in the local neighbourhood (Milky Way, LMC, SMC, e.g. Liu et al. (2007)) and the duration of the outbursts is typically of the order of months. The quiescence period between outbursts in these systems generally lasts one to a few years, making their duty cycle . Such a value for the duty cycle, based only on these short period well-studied systems, is the one generally assumed in the models of X-ray luminosity functions of nearby galaxies (e.g. Belczynski et al., 2004). However, nothing suggests that it holds for the systems that have not been observed going through a full cycle. This is the case, for example, of some long-duration transients for which the quiescence phase duration, hence duty cycle, can only be indirectly estimated from the cooling curve of the neutron star primary111For example, Wijnands et al. (2001) estimated that the quiescence phase of the quasi-persistent transient KS 1731-260 could be several hundreds years long. (e.g. Wijnands et al., 2001; Cackett et al., 2008). Furthermore, such a value of the duty cycle could be valid for the shorter period systems only but not for their longer period counterparts. It is this latter question we address in this work by exploring the case of the long period system GRS 1915.
GRS 1915+105 is one of the most well studied LMXBs (see Fender & Belloni (2004) for a review). Recent observations (Harlaftis & Greiner, 2004) suggest the system contains a 14.0 4.4 black hole with a 0.8 0.5 secondary, in a binary of orbital period 33.5 days (Greiner et al., 2001). The outburst which lead to the system’s detection in 1992 (Castro-Tirado et al., 1992) is still proceeding to this day, lasting 20 times longer than any other LMXB. This longevity can be explained in simple terms by the long orbital period, which means there is plenty of room in the system for a very large accretion disc to form around the black hole ( cm, Truss & Done, 2006). A large disc ensures there is a large reservoir of mass available to fuel the long outburst. Analytic estimates of the duration of GRS 1915+105’s outburst were derived by Truss & Done (2006). By their nature, these estimates were not able to account for the dynamical and viscous evolution of the accretion disc. In this paper we re-address the duration of the outbursts of GRS 1915+105 and also consider its X-ray duty cycle using smooth particle hydrodynamics (SPH) simulations of the accretion disc through many outburst cycles. In section 2 we present the physical effects included in the simulations and the associated free parameters. Section 3 deals with the implementation of these ingredients in the SPH code. In section 4 we present our results and estimate the duty cycle of GRS 1915+105. In the last section we discuss the implications of this work.
2 Physical ingredients
2.1 The disc instability model (DIM)
The disc instability model was first developed to explain the outbursts of cataclysmic variables (dwarf novae) and has been successfully extended to explain the X-ray outbursts of LMXBs (Mineshige & Wheeler, 1989; Dubus et al., 2001). Here, we briefly address the DIM and refer the reader to Lasota (2001) for a review.
Vertical (the direction perpendicular to the orbital plane of the binary) thermal equilibrium in the disc results in a relation between the surface density of the disc and its temperature at any given radius. The locus of equilibrium positions in the plane, takes the shape of an S-curve. The negatively sloped middle branch is caused by the sudden change of opacity as hydrogen ionises at K. When conditions dictate that the equilibrium position is situated on this middle branch the disc is forced to follow a limit-cycle between hot and cold states, defined by the critical surface densities and . These hot and cold states are thought to be respectively associated with enhanced and suppressed angular momentum transport within the disc. Many solutions utilise the Shakura-Sunyaev viscosity prescription (Shakura & Syunyaev, 1973), namely,
| (1) |
where is the scale height, is the local sound speed in the disc, and a free parameter. The hot state is assumed to be associated with high disc viscosity , and the cold state with low disc viscosity . This two-alpha approach was introduced early in the development of the models to reproduce observed outbursts durations. This translates into and . If anywhere in the disc , the annulus enters the hot, high-viscous state, which propagate to nearby annuli. The front propagating inward forces the disc in the hot viscous state on its way: this high viscosity implies a high accretion rate onto the central object, leading to the X-ray outburst. The disc returns to quiescence (low viscosity, small accretion rate) once .
2.2 Irradiation
As discussed above wherever , the disc is in the hot highly-viscous state. However, this is not the only grounds for the disc entering the hot state. X-ray irradiation by the central object can keep the disc ionised and in the hot state out to a radius . For typical black hole and disc parameters, King & Ritter (1998) find
| (4) |
where is the central accretion rate in units of g s-1, the accretion efficiency (we keep throughout this work) and the illumination efficiency. The latter parametrises the geometric properties of the disc (incident angle of irradiation, albedo), whereas gives the fraction of the accretion energy that is radiated away. The accretion onto the black hole can, at most, proceed at the Eddington rate,
| (5) |
for GRS 1915+105 ( is the black hole radius). Hence, from eq. (4), one gets the largest extent of the disc that can be switched to the hot state via accretion-powered radiation is
| (6) |
We cap the irradiation radius at its Eddington value so that whenever .
2.3 Wind Loss
Mass loss due to the local mass transfer rate exceeding the Eddington limit is also included in the model. The local accretion rate at radius is given by,
| (7) |
where is the radial velocity. The Eddington rate at the same radius is,
| (8) |
where is the Eddington luminosity. If a wind should carry away the energy in excess of the Eddington limit. To allow for some freedom in the wind efficiency, we parametrise the latter by triggering the wind whenever
| (9) |
The parameter allows us to depart from the strict Eddington limit (): the smaller , the smaller the threshold at which a wind is emitted.
The three mechanisms detailed above contain the free parameters that are varied throughout this work in order to reveal their relative effects, namely: , , and . Note also that the expressions for and are estimates only and that we allow for a change in their normalisations which gives us two extra parameters. This is detailed in the numerical setup below.
3 Numerical implementation
We study the long term evolution of GRS 1915+105 using the SPH code first developed by Murray (1996) and later modified by Truss & Wynn (2004). It includes the thermal viscous instability, disc irradiation, and wind loss as described above. Moreover, the system is followed in the full binary potential, hence it naturally includes any tidal effects that may arise.
3.1 Particle injection and rejection
The particles are injected from the L1 point, and into the primary’s potential, with the transfer rate given by Ritter (1999):
| (10) |
Using GRS 1915+105 system characteristics, this gives yr-1.
Particles are removed from the simulation when they are within 0.04 ( is the binary separation) of the black hole, if they return to the secondary’s Roche lobe or if they are at a distance with a velocity greater than the escape velocity. The first condition implies that the accretion rates we derive are not the accretion rates onto the black hole (as where is the Schwarzschild radius of the black hole). Some material may still be blown away in a wind before it reaches the black hole surface but resolution issues prevent us from studying the most inner regions of the accretion disc.
3.2 Triggering the disc instability
Practically, the disc is divided into one hundred annuli into which the surface density is evaluated. Whenever , the corresponding ring is switched into the hot state (). Conversely, the disc switches back to the cold state () wherever . Using Eqs. (2) and (3) with the parameters of GRS 1915+105 and the typical values and , one gets
| (11) |
and
| (12) |
In practice, we cannot use the values of shown above. Building the disc up to would take a prohibitive amount of time: and are typical values we use. The quantities and are also to be varied to explore how a less or more massive disc would behave.
Along the same lines, and are also increased from their canonical values given above, in order to speed up the outburst and recurrence times. Doing so allows the system to quickly reach steady-state and undergo several outburst events during a single run. The draw-back is that results need to be scaled in order to get actual the recurrence and outburst times. This is detailed in §3.3 below.
The last technical point is that of the disc transition between the cold and hot states. It is performed following Truss & Wynn (2004), and is set up to occur on the thermal time scale of the system, ( is the keplerian frequency). Once a switch is triggered, follows
| (13) |
where
| (14) |
3.3 Scaling outburst and recurrence timescales
As discussed in §3.2, computational time considerations have forced us to use values for and which are different from their generally inferred values. In this section we detail the procedure we follow to scale the raw outburst and recurrence durations to that of the physical system. In the following, we denote by real and sph the quantities related to the physical and the simulated system respectively.
During an outburst most of the mass inside a certain radius, , will be accreted. At the start of the outburst, the surface density inside this radius will be near (see Fig.3, left panel). The outburst timescale is then given by
| (15) |
where is the accretion rate in the disc for and is the total mass in that region. The latter is given by,
| (16) |
Using eqns. (2) and (3), one gets
| (17) |
Assuming is constant, eqns. (11), (12) and (17) give,
| (18) |
Given that (see Frank et al. (2002))
| (19) |
then
| (20) |
This provides a scaling for the results from the SPH code. The ratio of the physical outburst time to the simulated one is therefore,
| (21) |
The quiescence time is scaled in a similar fashion; the time spent in quiescence is roughly the time needed to replenish the mass lost in the outburst by the mass transfer rate from the secondary
| (22) |
where is given by eq. (18). Hence,
| (23) |
which gives the ratio of the physical to the simulated quiescence times as,
| (24) |
The recurrence time of the system is simply obtained by . As will be seen later on, in the case of GRS 1915+105, so that . When interpreting the results based on these scalings, consideration needs to be given to the assumptions made deriving them. The main assumption is that is independent of the value of . It is not exactly the case from one simulation to another, but stays true within a few percent.
Our canonical simulation has the following parameters , , , , , and . The values of are typically a factor of larger than the generally assumed values and .
4 Results
Outputs from the simulations are presented hereafter. The typical evolution of the accretion is described in §4.1. We then explore the parameter space of our simulations and report the effects on the disc outburst and quiescence durations in §4.2, 4.3 and 4.4. Parameters and outburst/recurrence times of all the simulations presented below are compiled in table 1.
| Simulation | Out. | Quiesc. | Scaled out. | Scaled quiesc. | duty cycle | |||||||||
|---|---|---|---|---|---|---|---|---|---|---|---|---|---|---|
| Name | () | () | (days) | (days) | (yr) | (yr) | () | |||||||
| base | 55 | 4.785 | 1.0 | 0.1 | 0.1 | 7 | 1 | 1.4 | 0.05 | 967 | 868 | 23.8 | 10722 | 2.22 |
| irr 1 | 55 | 4.785 | 1.0 | 0.1 | 0.1 | 3 | 1 | 1.4 | 0.04 | 974 | 873 | 24.0 | 10778 | 2.23 |
| irr 2 | 55 | 4.785 | 1.0 | 0.1 | 0.1 | 5 | 1 | 1.4 | 0.05 | 973 | 877 | 24.0 | 10829 | 2.21 |
| irr 3 | 55 | 4.785 | 1.0 | 0.1 | 0.1 | 9 | 1 | 1.4 | 0.05 | 978 | 864 | 24.1 | 10673 | 2.26 |
| irr 4 | 55 | 4.785 | 1.0 | 0.1 | 0.1 | 12 | 1 | 1.3 | 0.07 | 1044 | 850 | 26.2 | 10629 | 2.46 |
| sig max 1 | 40 | 4.785 | 1.0 | 0.1 | 0.1 | 7 | 1 | 1.2 | 0.01 | 924 | 582 | 22.8 | 7185 | 3.17 |
| sig max 2 | 47.5 | 4.785 | 1.0 | 0.1 | 0.1 | 7 | 1 | 1.4 | 0.03 | 904 | 769 | 22.3 | 9499 | 2.35 |
| sig max 3 | 62.7 | 4.785 | 1.0 | 0.1 | 0.1 | 7 | 1 | 1.4 | 0.07 | 1016 | 948 | 25.0 | 11715 | 2.14 |
| sig max 4 | 70 | 4.785 | 1.0 | 0.1 | 0.1 | 7 | 1 | 0.8–1.8 | 0.04–0.2 | 690–1040 | 650–990 | 17–26 | 8029–12229 | 1.39–3.23 |
| sig min 1 | 55 | 3 | 1.0 | 0.1 | 0.1 | 7 | 1 | 1.3 | 0.02 | 1125 | 872 | 27.7 | 10772 | 2.57 |
| sig min 2 | 55 | 7 | 1.0 | 0.1 | 0.1 | 7 | 1 | 1.5 | 0.08 | 839 | 846 | 20.7 | 10454 | 1.98 |
| sig min 3 | 55 | 10 | 1.0 | 0.1 | 0.1 | 7 | 1 | 1.6 | 0.12 | 741 | 800 | 18.3 | 9882 | 1.85 |
| sig min 4 | 55 | 15 | 1.0 | 0.1 | 0.1 | 7 | 1 | 1.7 | 0.25 | 622 | 713 | 15.3 | 8801 | 1.74 |
| alpha h 1 | 55 | 4.785 | 0.5 | 0.1 | 0.1 | 7 | 1 | 0.9 | 0.04 | 1625 | 343 | 40.04 | 4241 | 9.44 |
| alpha h 2 | 55 | 4.785 | 0.8 | 0.1 | 0.1 | 7 | 1 | 1.3 | 0.06 | 1104 | 780 | 27.2 | 9635 | 2.82 |
| alpha h 3 | 55 | 4.785 | 1.3 | 0.1 | 0.1 | 7 | 1 | 1.6 | 0.16 | 733 | 825 | 18.1 | 10191 | 1.77 |
| alpha h 4 | 55 | 4.785 | 1.5 | 0.1 | 0.1 | 7 | 1 | 1.7 | 0.18 | 623 | 717 | 15.3 | 8853 | 1.73 |
| alpha c 1 | 55 | 4.785 | 1.0 | 0.05 | 0.1 | 7 | 1 | 1.4 | 0.07 | 974 | 934 | 24.0 | 21795 | 1.17 |
| alpha c 2 | 55 | 4.785 | 1.0 | 0.08 | 0.1 | 7 | 1 | 1.4 | 0.05 | 971 | 898 | 23.9 | 13716 | 1.74 |
| alpha c 3 | 55 | 4.785 | 1.0 | 0.13 | 0.1 | 7 | 1 | 1.4 | 0.05 | 1022 | 830 | 25.2 | 5565 | 4.53 |
| alpha c 4 | 55 | 4.785 | 1.0 | 0.2 | 0.1 | 7 | 1 | ** | ** | ** | ** | ** | ** | ** |
| wind 1 | 55 | 4.785 | 1.0 | 0.1 | 0.1 | 7 | 0.6 | 0.7–1.4 | 0.24–0.90 | 605–885 | 625–985 | 15–22 | 7720–12167 | 1.23–2.85 |
| wind 2 | 55 | 4.785 | 1.0 | 0.1 | 0.1 | 7 | 0.8 | 1.3 | 0.21 | 970 | 908 | 23.9 | 11211 | 2.13 |
| wind 3 | 55 | 4.785 | 1.0 | 0.1 | 0.1 | 7 | 1.2 | 1.4 | 0.01 | 975 | 857 | 24.0 | 10582 | 2.27 |
| wind 4 | 55 | 4.785 | 1.0 | 0.1 | 0.1 | 7 | 1.4 | 1.4 | 0.00 | 976 | 865 | 24.1 | 10685 | 2.25 |
| high irr 1 | 55 | 4.7853 | 1.0 | 0.1 | 0.1 | 28 | 1 | 0.5 | 0.01 | 21500 | ** | 86 | ** | ** |
| high irr 2 | 55 | 4.7853 | 1.0 | 0.1 | 0.1 | 43 | 1 | 0.4 | 0.01 | 22400 | ** | 115 | ** | ** |
| high irr 3 | 55 | 4.7853 | 1.0 | 0.1 | 0.1 | 51 | 1 | 0.4 | 0.02 | 22900 | ** | 130 | ** | ** |
4.1 Typical behaviour
As stated in 3.1 particles are injected from the L1 point and proceed to build up in a disc around the accreting black hole. We present here a canonical simulation of GRS 1915’s disc which was run using the parameters recorded in the field base of table 1. The particle mass and are chosen to ensure approximately particles in the quiescent disc. We wait until the system reaches steady-state over several outbursts222In this context, steady-state must be understood as the state reached by the disc when the number of particles oscillates around a constant average value when going through outburst and quiescence phases (see Fig. 1, lower panel). to begin our analysis. It is important to emphasise that we do not assume any given density profile for the disc but let it build up and find its own steady-state. This is in contrast to the analytic treatment of Truss & Done (2006) where the surface density profile of the disc was prescribed by the authors.
The steady-state of the disc is illustrated in Fig. 1 where the central accretion rate (top-panel), irradiation radius (second panel), wind loss (third panel) and number of particles in the simulations (bottom panel) are plotted against time.

In the time interval depicted in here, the disc goes through four outbursts during which the central accretion rate increases by at least three orders of magnitude up to yr-1. The luminosity of GRS 1915+105 makes it slightly super-Eddington, and the inferred typical accretion rate onto the black hole is yr-1. The discrepancy between these two values can be explained by the fact that we do not resolve the inner disc. The mass transfer of yr-1 in our simulations represents the transfer rate through the disc at . The amount of mass crossing our inner boundary is not the amount of mass that will eventually reach the black hole and we expect most of it to be blown away in a wind. In fact, there are good reasons to expect that the mass transfer rate through such a large disc as is present in GRS 1915+105 must be much larger than yr-1 and we discuss that point further in §5.2. The accretion in GRS 1915+105 proceeds at super-Eddington rates and this explains the plateau observed in as the latter is capped at the Eddington radius (see §2.2). This is a general feature of all our simulations.
Caution is needed when reading outburst and quiescence durations from this figure as the plotted time is a direct output from the code: outburst and recurrence times have to be scaled according to §3.3. Doing so, one gets yrs and yrs for this particular simulation.
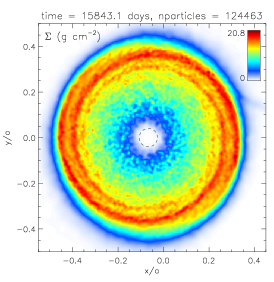
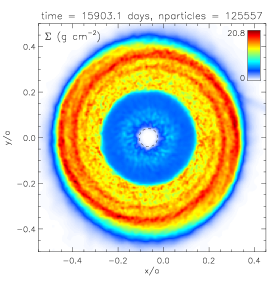
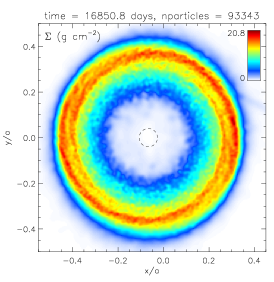
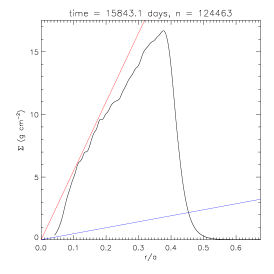
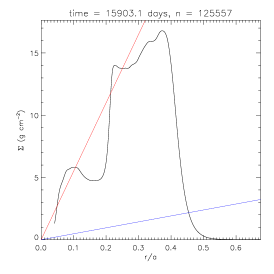
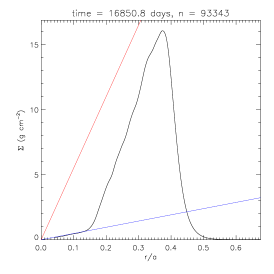
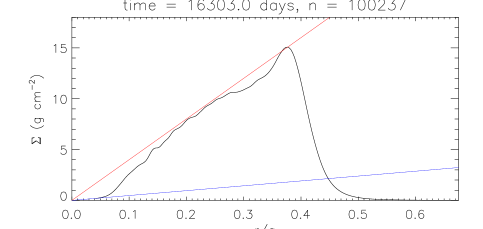
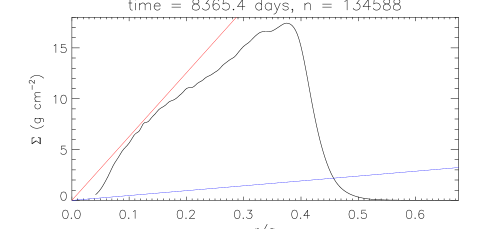
Figures 3 and 3 follow the evolution of the surface density in the disc for the base simulation through an outburst. In fig. 3, the surface density at a given radius has been averaged over 2. In each case, the three snapshots (a), (b) and (c) are taken just before, during, and after the outburst respectively.
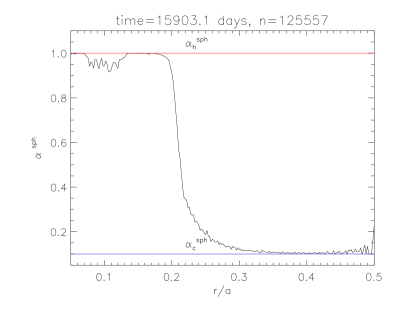
In fig. 3a, the surface density in the inner disc closely follows the prescription. Exceeding this limit at triggers the switch to the hot viscous state and marks the beginning of the outburst phase (see §3.2). The switch in viscosity is illustrated in fig. 4 showing the radial variation of the SPH parameter at the start of the outburst. The particles in the annulus that enter the hot state spread to increase the surface density in neighbouring annuli and have them switch to the high viscosity state as well (fig. 3b). Because of these matter waves propagating inward and outward, a significant portion of the disc enters the hot state, to be eventually accreted onto the black hole (but for the part blown away in the wind).
Typically 20-30% of the particles (i.e. of the mass of the disc) are accreted during an outburst (Fig. 1, lower panel). Once most of the material has been accreted, the surface density in the inner disc decreases to eventually become smaller than , as seen in fig. 3c. This is the trigger for the disc to switch back to the cold low-viscosity state and ends the outburst phase. During quiescence the disc regains the mass it lost in outburst and the cycle repeats.
Figure 3 is another representation of the above, where one clearly sees the inner disc being emptied throughout the outburst. The 2D plots have also the benefit to show the existence non axi-symmetric features, e.g. large spiral arms developing in the outer disc.
4.2 Varying the viscosity
The -parametrisation of the viscosity in accretion discs has been widely used since Shakura & Syunyaev (1973). However, to date some confusion still exists around the actual value(s) that should take to describe the angular momentum transport in accretion discs (King et al., 2007). In this section, we allow for and to depart from their canonical values and report their effect on the disc’s limit cycle. The following results have been obtained from the simulations alpha h [1-4] and alpha c [1-4] which full set of parameters can be found in tab. 1. For numerical reasons, we could not change with as eqs. (2) and (3) require. Indeed, changing on a large range of values results in the loss of the transient behaviour we are studying here. Nevertheless, the scaling of the outburst and recurrence times accounts for this technical detail. Figure 5 shows the effect of varying (solid line) and (dashed line) on , and duty cycle. Note that the values of displayed are the physical values and not the SPH ones (). The timescales are scaled as described in §3.3 if not stated otherwise.
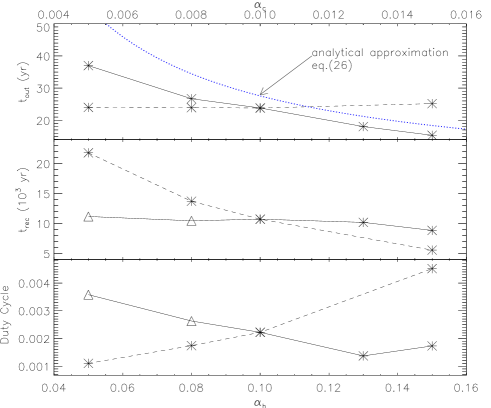
The effects of changing are straightforward: little effect if any on the outburst time (fig. 5, top panel, dashed line) as one would expect and an increasing recurrence time with decreasing (middle panel). Reducing implies an increase of according to eq. (2). Assuming that the outer radius of the outburst and the density profile of the disc are only slightly affected by this change333This is verified in §4.3. The trigger point of the outburst changes with the critical density profile but the radius to which the hot state propagates is roughly unchanged. then more mass should be lost in the outburst for a smaller . The transfer rate from the secondary being fixed, this translates into longer quiescence times.
The outburst time decreases with increasing as accretion proceeds much faster for larger values of the viscosity (fig. 5, top panel, solid line). As a result, the mass rate at the inner boundary increases making the flow even more super-Eddington. This however, does not translate into more mass being lost in the outburst. The number of particles (not shown here) actually lost during an outburst decreases as increases. With high values of , the inner disc empties quickly and quenches the outburst before the outward matter wave could turn more of the disc into the hot state. The outburst time is roughly governed by the viscous time calculated at the outermost part of the outburst and reads Pringle (1981),
where has been used. The simulations give at most and , which gives
| (26) |
This simple analytical estimate is a rough upper limit for the outburst time and is plotted as the dotted blue line in fig. 5 (top panel) where it can be seen to reasonably reproduce the behaviour of the numerical results.
The recurrence time also marginally decreases with increasing . This is understood when remembering that the quiescence phase of the disc is roughly the time needed to replenish the mass lost in the outburst at a rate . As mentioned earlier, more mass is lost in the outburst for smaller values of which explains the trend reported in fig. 5 (middle panel, solid line). Note that the two triangle points have not been scaled using the method reported in §3.3. Indeed, the latter is only valid if . This would always be the case if working with the real disc mass, but because of the numerical setup (small and ), we only get for the lowest values of . This means that, for these two simulations, the disc significantly replenishes while still in outburst. This indicates the disc is close to persistent outburst. However, it is a limitation of the simulations and limits the range over which parameters are allowed to vary. The duration measured from the evolution plots (like that of fig. 1) largely underestimates the actual quiescence times. To overcome that issue, the quiescence times of these two points have been explicitly calculated from , where is the total mass lost in the outburst and not from the raw value of output from the code.
The lower panel in fig. 5 shows the variation of the duty cycle. Both and affect it in opposite ways, similar in amplitude. Nonetheless, it spans on a very narrow range with an average value from 0.1% to 0.45%.
4.3 Changing the critical density profiles
The critical density profiles we use are given by eq. (11) and (12). which are fitted on the vertical disc structure obtained by Cannizzo et al. (1988). Different fits can be obtained depending on the disc model (irradiated or not) used and other prescriptions can be found in the literature (Cannizzo & Wheeler, 1984; Hameury et al., 1998; Dubus et al., 2001). Our setup does not allow for irradiation feedback on the disc structure or changing accordingly. As also mentioned in the previous section, we do not have much freedom to change their normalisations and still retain the transient behaviour of the system. Within the range of values where the transient behaviour is present, fig. 6 displays the effects of (solid line) and (dashed line) parameters on the outburst and recurrence times and on the duty cycle (simulations sig max [1-3] and sig min [1-4] in table 1).
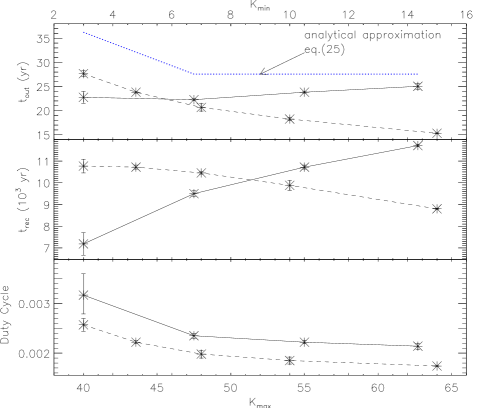
Increasing implies a steeper slope for the critical surface density . As the outburst proceeds and the surface density in the inner disc diminishes, the latter falls below quicker for higher values of (also see fig. 3c). The outburst time is then smaller for higher values of (fig. 6, top panel, dashed line). The mass lost in the outburst is decreased in a similar fashion (see eq. (18)) so that the time needed to replenish the disc also decreases with increasing (middle panel, dashed line).
The behaviour of the outburst and recurrence times with varying is less straightforward. First of all, a steeper slope of means a smaller trigger radius for the outburst. This is shown in fig. 7 where the snapshots are taken just before the outburst. In the upper panel, has a low value: the outburst is triggered in the outer disc, at , and will propagate inward (outside-in outburst). For a high value of (lower panel), the surface density crosses its critical value at and the front will propagate outward, up to (inside-out outburst, similar to that of fig. 3). In an inside-out outburst, the outer radius of the outburst does not appear to depend on : this is the case for the base and sig max [2-3] simulations. In the latter, the hot state always propagates up to so according to eq. (4.2), the outburst time should remain unchanged. This is seen in fig. 6 (top panel, solid line). The only deviation from the analytical upper estimate is for the lowest value of where the outburst propagates outside-in and is triggered at . Used in eq. (4.2), it gives an outburst duration much larger than the simulated one. This indicates that this analytical estimate breaks down for outside-in outbursts. With increasing , more mass is lost in the outburst, regardless of its type, and the quiescence time increases accordingly (middle panel, solid line).
The duty cycle decreases with both and . Again, it spans on a narrow range around 0.25%.
4.4 Effect of the irradiation and wind efficiency
The last two free parameters of our model are the irradiation and wind efficiency, and respectively. The former defines the irradiation radius given by eq. (4) and the latter the threshold mass rate for the wind to be active444The higher the larger the threshold, hence the less efficient the wind. as established by eq. (9). The irradiation efficiency depends on the disc structure555The disc structure itself depends on the irradiation heating. and albedo of the gas (see Frank et al. (2002)), two quantities our model does not include and we treat as a free parameter. There is evidence for slow winds being emitted from accretion discs in LMXBs (Miller et al., 2006; Ueda et al., 2009). However, our code does not possess the ingredients for the disc to consistently emit a wind, given its thermodynamical properties. Varying allows us to artificially give more or less importance to the wind without resolving its origin. Figure 8 illustrates the impact of varying these two parameters on the temporal evolution of the disc (simulations irr [1-4] and wind [1-4] from table 1).

The efficiency of the wind has no noticeable effect on the outburst time (fig. 8, top panel, dashed line). Indeed, is not changed significantly whatever so that the viscous time in the hot state remains the same. The rate at which mass is lost in the wind is roughly equal to the central mass accretion rate but these high rates lasts only during a small fraction of the outburst duration (fig. 1, top and third panel): the mass lost in the wind is much smaller than that accreted during an outburst. Therefore, the recurrence time does not show any significant change, as long as is high enough. For the smallest value of however, the threshold for the wind is so low that a wind is emitted during quiescence. It then takes longer to replenish the disc, hence the slight increase of when . The main effect of the wind during outburst is to reduce the central accretion rate (not shown here).
Changing the irradiation efficiency leads to much more striking behaviour (solid lines, crosses and diamonds). The system always presents super-Eddington accretion so that the irradiation radius is capped at Eddington and simply given by eq. (6). The effect of the irradiation is twofold: i) it maintains the irradiated region in the hot state, even if , ii) it can switch external regions where into the hot state. Both effects should tend to increase the outburst time. For low values, up to , and only the first effect is at play (top panel, solid line, crosses). That regime only affects a small amount of mass and the outburst duration plateaus for and increases only when . The scale of the graph makes it difficult to visualise and we refer the reader to table 1 for the actual values.
To explore the second regime, is required. Because of the scaled-down disc we simulate, pushing to higher values leads to and leads the disc to be in a continuous outburst state. To overcome that difficulty, we turn off the injection of particles during the outburst phase () in order to get the outburst to come to an end (this corresponds to the simulations high irr [1-3] in table 1). This is a valid approach since GRS 1915+105 has . In fig. 8 these simulations are represented by the diamond symbol. In that regime, is much larger and a significant amount of mass enters the hot state in the outer disc, resulting in much longer outbursts. Remembering that and , one gets . This is in reasonable agreement with the behaviour followed by the three diamond simulations, where . For the highest values of the entire disc is irradiated and 80% of its mass is lost in the outburst.
The recurrence time follows directly from there. The longer the outburst time, the more mass there is to replenish, hence the longer the recurrence time.
5 Discussion
5.1 The outburst duration
Truss & Done (2006) analytically estimated the outburst duration of GRS 1915+105. We briefly outline the framework of their calculation before comparing to our results. In their work, the outburst time was calculated following
| (27) |
The surface density in the disc was taken to follow in the inner 10% of the disc before flattening off at larger radii. Hence,
| (28) |
where was simply the irradiation radius (eq. (4)). The average mass transfer rate through the disc read
| (29) |
Remembering that and using , the inclusion of as free parameter resulted in a maximum and a minimum length of an outburst for a given irradiation efficiency666This cannot be directly compare to our set up, where we showed that the efficiency of the wind had little influence on the outburst time (fig. 8, top panel, dashed line). It is difficult to make an analogy between our two approaches, but we can understand this apparent discrepancy in the following way: in our simulation, the measured in knows of the existence of a wind (i.e. the stronger the wind, the smaller ) so that overall and whatever the wind.. Their maximum outburst time is obtained when and the minimum one when .
In fig. 9 are plotted the outburst times predicted by Truss & Done (2006) and our work, against the irradiation efficiency.

For values of , our outburst durations are larger than those of Truss & Done (2006). This is due to the fact that their model is solely based on the irradiation to switch the disc into the hot state. Therefore, for small values of their predicted outburst times vanishes to zero. As discussed in §4.4 in the low regime of our simulations, the small irradiation radius has the mere effect of keeping a small amount of mass in the hot state a bit longer than without irradiation. When and the effect of the irradiation becomes significant, the two approaches are in fair agreement. The duration of the current outburst of GRS 1915+105 in conjunction with these models may provide some evidence of the irradiation efficiency in this system.
The black hole LMXB 4U 1755-33 is very reminiscent of GRS 1915+105. It went through a year long outburst that ended around 1995, has a long orbital period of 4.4 days777Long orbital period compared to usual LMXBs. and also shows jet-like signatures (Angelini & White, 2003; Park et al., 2005; Kaaret et al., 2006). To the authors’ knowledge, the masses of the binary components have not been determined yet, which exclude any direct attempt to dynamically model this system. However, its outburst duration lies at the lower end of the range we find GRS 1915+105 which is reasonable given that its orbital period, hence accretion disc, is smaller.
5.2 Central accretion rate and the need for a wind
The accretion rate measured at the inner boundary of the disc ( cm) in the simulations yield yr-1. As mentioned in §4.1, this is much larger than the Eddington rate, at which the black hole is observed to accrete, i.e. yr-1 at cm.
So far, the outburst of GRS 1915+105 has lasted 17 years. Using eq. (4.2) with and gives a minimum outer radius cm. Assuming the surface density profile of the disc follows (given by eq. (11)), a rough upper estimate of the mass lost in the outburst is
| (30) |
If the outburst were to stop in the near future, this mass implies a transfer rate through the disc yr-1, in agreement with the transfer rate we measure at the inner boundary of the simulations.
Conversely, if one takes the observationnaly inferred Eddington rate ( yr-1) as the transfer rate through the disc and use yrs, one gets . Assuming the same density profile gives cm, which is incompatible with a viscous/outburst time of 17 years. Hence, it would seem a wind or outflow must carry away the excess mass and we suggest that most () of the mass flow through the disc must be lost in this way.
We note that Ueda et al. (2009) recently concluded in the existence of a thermally and/or radiation-driven disc wind in GRS 1915+105 from the absorption lines in its spectra and inferred a launching radius . This corresponds to the innermost regions our simulations. However, they estimate the mass loss rate in the wind to be yr-1, of the same order that the accretion rate onto the black hole. However, such mass loss rates are difficult to measure and we suggest that the loss rate could be significantly higher.
6 Conclusion
In this work, we have studied the long term evolution of the GRS 1915+105 LMXB using global SPH simulations of its accretion disc, which include the two-alpha disc instability model, irradiation and wind. The parameter space has been scanned with the limitation of retaining transient behaviour in the simulations. We showed that all parameters (but for the wind efficiency) can play a significant role in the determination of the outburst and recurrence times.
In agreement with both intuition and previous work, the outburst duration is affected by (the smaller , the longer the outburst) but not by . The opposite effect is noted for the recurrence time (the smaller , the longer the recurrence time and a very marginal effect of .)
Increasing the slope of the critical density profiles is also important: i) the outburst is shorter if is increased but only marginally affected by , ii) an increase of and respectively decreases and increases the recurrence time of the system.
When the irradiation efficiency is small () the variations of and are non negligible but span on a relatively narrow range: years, years and the duty cycle . However, as soon as the irradiation becomes non-negligible in determining the outer radius of the hot state region of the disc, the outburst duration increases considerably, potentially reaching 130 years for .
In Truss & Done (2006), the authors relied on the irradiation to set the outburst duration. For large values of the irradiation efficiency, our results are in agreement with their analytical modelling. However, for small values of , the thermal-viscous instability is at the origin of the outburst and we show that GRS 1915+105’s outburst can be expected to last at least . As the outburst began in 1992 this raises the possibility that the outburst could end in the next decade. If so this would indicate that the X-ray irradiation efficiency is small, . If however the outburst persists any longer, the conclusion that significant fractions of the outer disc are being irradiated is unavoidable.
The extraordinary duration of the outburst of GRS 1915+105 (and possibly of 4U 1755-33) is due to its long orbital period resulting in an unusually large amount of gas available in its accretion disk. These extraordinarily long outbursts of long period, transient LXMBs should not be confused with the persistent outbursts of short period systems such as Sco-X1 or 4U 1957+11, in which stable, persistent accretion can be easily established by irradiation at moderate mass transfer rates (King et al., 1996).
Except if the irradiation efficiency is high, the duty cycle of GRS 1915+105 is , at best. Our canonical values gives : these values are slightly smaller than the typical duty-cycles measured in shorter periods LMXBs (), or that generally assumed for population models and X-ray luminosity functions of nearby galaxies (Belczynski et al., 2004; Ivanova & Kalogera, 2006). This suggests than one needs to be careful when considering long period systems (for which very little (long-term evolution) data exists) and we will consider a more generic approach to these objects in a forthcoming paper.
Acknowledgments
The authors thank the anonymous referee for their comments that have helped putting this work into a broader context. CC and GW acknowledge support from the theoretical astrophysics group STFC rolling at the university of Leicester. PD acknowledges a STFC studentship.
References
- Angelini & White (2003) Angelini L., White N. E., 2003, Ap. J. Lett, 586, L71
- Belczynski et al. (2004) Belczynski K., Kalogera V., Zezas A., Fabbiano G., 2004, Ap. J. Lett, 601, L147
- Cackett et al. (2008) Cackett E. M., Wijnands R., Miller J. M., Brown E. F., Degenaar N., 2008, Ap. J. Lett, 687, L87
- Cannizzo et al. (1988) Cannizzo J. K., Shafter A. W., Wheeler J. C., 1988, ApJ, 333, 227
- Cannizzo & Wheeler (1984) Cannizzo J. K., Wheeler J. C., 1984, ApJS, 55, 367
- Castro-Tirado et al. (1992) Castro-Tirado A. J., Brandt S., Lund N., 1992, IAU Circ, 5590, 2
- Dubus et al. (2001) Dubus G., Hameury J.-M., Lasota J.-P., 2001, A&A, 373, 251
- Fender & Belloni (2004) Fender R., Belloni T., 2004, ARA&A, 42, 317
- Frank et al. (2002) Frank J., King A., Raine D. J., 2002, Accretion Power in Astrophysics: Third Edition, Accretion Power in Astrophysics, by Juhan Frank and Andrew King and Derek Raine, pp. 398. ISBN 0521620538. Cambridge, UK: Cambridge University Press, February 2002.
- Greiner et al. (2001) Greiner J., Cuby J. G., McCaughrean M. J., 2001, Nature, 414, 522
- Hameury et al. (1998) Hameury J.-M., Menou K., Dubus G., Lasota J.-P., Hure J.-M., 1998, MNRAS, 298, 1048
- Harlaftis & Greiner (2004) Harlaftis E. T., Greiner J., 2004, A&A, 414, L13
- Ivanova & Kalogera (2006) Ivanova N., Kalogera V., 2006, ApJ, 636, 985
- Kaaret et al. (2006) Kaaret P., Corbel S., Tomsick J. A., et al., 2006, ApJ, 641, 410
- King et al. (1996) King A. R., Kolb U., Burderi L., 1996, Ap. J. Lett, 464, L127+
- King et al. (2007) King A. R., Pringle J. E., Livio M., 2007, MNRAS, 376, 1740
- King & Ritter (1998) King A. R., Ritter H., 1998, MNRAS, 293, L42
- Lasota (2001) Lasota J.-P., 2001, New Astronomy Review, 45, 449
- Liu et al. (2007) Liu Q. Z., van Paradijs J., van den Heuvel E. P. J., 2007, A&A, 469, 807
- Miller et al. (2006) Miller J. M., Raymond J., Fabian A., et al., 2006, Nature, 441, 953
- Mineshige & Wheeler (1989) Mineshige S., Wheeler J. C., 1989, ApJ, 343, 241
- Murray (1996) Murray J. R., 1996, MNRAS, 279, 402
- Park et al. (2005) Park S. Q., Miller J. M., McClintock J. E., Murray S. S., 2005, Ap. J. Lett, 618, L45
- Pringle (1981) Pringle J. E., 1981, ARA&A, 19, 137
- Ritter (1999) Ritter H., 1999, MNRAS, 309, 360
- Shakura & Syunyaev (1973) Shakura N. I., Syunyaev R. A., 1973, A&A, 24, 337
- Truss & Done (2006) Truss M., Done C., 2006, MNRAS, 368, L25
- Truss & Wynn (2004) Truss M. R., Wynn G. A., 2004, MNRAS, 353, 1048
- Ueda et al. (2009) Ueda Y., Yamaoka K., Remillard R., 2009, ArXiv e-prints
- Wijnands et al. (2001) Wijnands R., Miller J. M., Markwardt C., Lewin W. H. G., van der Klis M., 2001, Ap. J. Lett, 560, L159