Near-infrared spectroscopy of the Blue Compact Dwarf galaxy Markarian 59
Abstract
We present near-infrared (NIR) spectroscopic observations of the blue compact dwarf (BCD) galaxy Mrk 59, obtained with the TripleSpec spectrograph mounted on the 3.5m APO telescope. The NIR spectrum of Mrk 59, which covers the 0.90 m – 2.40 m wavelength range, shows atomic hydrogen, molecular hydrogen, helium, sulfur and iron emission lines. The NIR data have been supplemented by a SDSS optical spectrum. We found extinction in the BCD to be low [=0.24 mag] and to be the same in both the optical and NIR ranges. The NIR light does not reveal hidden star formation. The H2 emission comes from dense clumps and the H2 vibrational emission line intensities can be accounted for by photon excitation. No shock excitation is needed. A CLOUDY photoinization model of Mrk 59 reproduces well the observed optical and NIR emission line fluxes. There is no need to invoke sources of ionization other than stellar radiation. The [Fe ii] 1.257 and 1.643 m emission lines, often used as supernova shock indicators in low-excitation high-metallicity starburst galaxies, cannot play such a role in high-excitation low-metallicity H ii regions such as Mrk 59.
1 INTRODUCTION
The Blue Compact Dwarf (BCD) galaxy Markarian 59 (Mrk 59) I Zw 49 belongs to the class of cometary BCDs defined by Loose & Thuan (1985) as characterized by an intense starburst at the end of an elongated low surface brightness stellar body. In the case of Mrk 59, the elongated body is the galaxy NGC 4861. Arp (1966) describes NGC 4861 in his Atlas of Peculiar Galaxies as “an object with irregular clumps, resolved into knots with a very bright knot (diameter = 1 kpc) at the southeastern end”. The knots are in fact a chain of H ii regions, most likely resulting from propagating star formation along the galaxy’s elongated body and ending with the high-surface-brightness supergiant H ii region at the southeastern end (Noeske et al., 2000). Fabry-Pérot maps of NGC 4861 by Thuan et al. (1987) show that Mrk 59 is 50 times brighter in H than any other feature in NGC 4861. The H velocity field of NGC 4861 shows a northeast-southwest velocity gradient which can be interpreted as the rotation of an inclined disk, with the bright end approaching and the faint end receding.
Dinerstein & Shields (1986) first detected broad Wolf-Rayet stellar features in Mrk 59 indicating the presence of late nitrogen and early carbon Wolf-Rayet stars. Guseva et al. (2000), using the spectroscopic observations of Izotov et al. (1997) found that several dozens of Wolf-Rayet stars are present. Noeske et al. (2000) used deep ground-based spectrophotometric observations of the supergiant H ii region to derive an oxygen abundance (log O/H)i = 4.011 0.003 [or /5, using log (O/H)⊙ = 3.3] for the ionized gas, typical of BCDs. On the other hand, Thuan et al. (2002b) have found from FUSE far-UV absorption spectra that the oxygen abundance of the neutral gas in Mrk 59 is about a factor of ten lower, (log O/H)n = –5.0 0.3. They also did not find any evidence for the presence of diffuse molecular hydrogen in the BCD. Wilcots et al. (1996) and Thuan et al. (2002a) have used the VLA to map NGC 4861 and Mrk 59 in the 21 cm line. With a beam size of 15″ (780 pc), the latter authors found a very clumpy interstellar medium (ISM) with H i column densities ranging from several 1019 to a few 1021 cm-2. Despite irregularities, the H i velocity field of NGC 4861 resembles that of a rotating disk seen almost edge-on. Thuan et al. (2002a) obtained a H i heliocentric velocity of 833 km s-1 for NGC 4861. Then, adopting a Hubble constant of 73 km s-1 Mpc-1 and correcting for the Virgocentric infall motion, the distance of Mrk 59 is 10.7 Mpc (Thuan et al., 2002a). Since the apparent magnitude of Mrk 59 is = 12.64 (Noeske et al., 2000), then its absolute magnitude is equal to –17.51.
In the near-infrared (NIR), NGC 4861 and Mrk 59 have been studied spectroscopically by Calzetti et al. (1996) and Vanzi & Rieke (1997), respectively. Calzetti et al. (1996) (see also Calzetti, 1997) have obtained spectra of NGC 4861 in the wavelength range 1.236 - 1.340 m ( spectrum) and 2.113 - 2.250 m ( spectrum). They detected the [Fe ii] 1.26 m, Pa 1.28 m, Br 2.17 m and H2 2.12 m lines. Vanzi & Rieke (1997) have obtained a spectrum of Mrk 59 covering the 2.0 – 2.4 m wavelength range. Those authors detected only three emission lines: the Br 2.17 m hydrogen line, the He i 2.06 m line and the H2 2.12 m line, with the last line being barely detected. With advances in NIR detector sensitivities, and with the commisionning in 2008 of the new TripleSpec spectrograph at the Apache Point Observatory (APO) 3.5-meter telescope111The Apache Point Observatory 3.5-meter telescope is owned and operated by the Astrophysical Research Consortium., which allows simultaneous coverage of the NIR bands, we decided to obtain a new NIR spectrum of Mrk 59 with considerably more signal-to-noise and wavelength coverage. These improved observations will allow us to study in more detail the physical conditions in Mrk 59: its extinction in the NIR and the excitation mechanisms of line emission of ionized species in the H ii region. We can also check for the presence of molecular hydrogen emission.
We describe the 3.5m APO observations in section 2. In section 3, we discuss the extinction and star formation in Mrk 59, both in the optical and NIR ranges, the excitation mechanisms for molecular hydrogen and iron emission in the NIR range, and CLOUDY modeling of the H ii region. We summarize our findings in section 4.
2 OBSERVATIONS
A NIR spectrum of Mrk 59 was obtained with the 3.5 m APO telescope on the night of 2008 March 22. The observations were made with the TripleSpec spectrograph by the instrument commissioning team. TripleSpec (Wilson et al., 2004) is a cross-dispersed NIR spectrograph that provides simultaneous continuous wavelength coverage from 0.95 to 2.46 m in five spectral orders during a single exposure. A 1143″ slit was used, resulting in a resolving power of 3500.
The A0/A1IV standard star HIP 73613 was observed for flux calibration. Spectra of Ar comparison arcs were obtained on the same date for wavelength calibration. Since both Mrk 59 and HIP 73613 are much smaller than the length of the slit, the nod-on-slit technique was used to acquire the sky spectrum. Both objects were observed by nodding between two positions A and B along the slit. Mrk 59 had a total integration time of 20 minutes. During that time the galaxy was observed in four five-minute integrations, alternating in slit position following the sequence ABBA.
The data reduction was performed using IRAF222IRAF is the Image Reduction and Analysis Facility distributed by the National Optical Astronomy Observatory, which is operated by the Association of Universities for Research in Astronomy (AURA) under cooperative agreement with the National Science Foundation (NSF). and include the following steps. We first used the summed frame of the standard star and the IRAF routines IDENTIFY, REIDENTIFY, FITCOORD and TRANSFORM to correct for the distortion of each frame. This distortion is an unavoidable consequence of cross-dispersed grating spectrographs. This was done for all frames of the standard star, Mrk 59 and the comparison argon lamp. We then extracted from each of the distortion-corrected frames the five two-dimensional spectra corresponding to the five spectral orders. For each order, we use the two-dimensional distortion-corrected spectrum of the comparison argon lamp and the IRAF routines IDENTIFY, REIDENTIFY, FITCOORD, TRANSFORM to perform wavelength calibration and correct for the tilt of the slit for each frame. We checked the accuracy of the two-dimensional transformation by examining the strong lines in the A and B spectra of Mrk 59. We found that the wavelengths of these do not differ by more 0.1 – 0.2Å in the A and B spectra. Then, for each order, the two A and two B distortion-corrected, tilt-corrected and wavelength-calibrated frames, each with an exposure time of 5 mn, were summed separately. The B+B frame was subtracted from the A+A frame to remove the background. Then, the -(B+B) spectrum was shifted along the spatial axis to match the (A+A) spectrum and subtracted from it, resulting in the two-dimensional background subtracted spectrum (A+A)+(B+B) of Mrk 59 with a total exposure time of 1200 s. The standard star observations were processed similarly, resulting in a spectrum with a total exposure time of 300 s. Finally, we use the routine CRMEDIAN to remove cosmic ray hits in each spectrum.
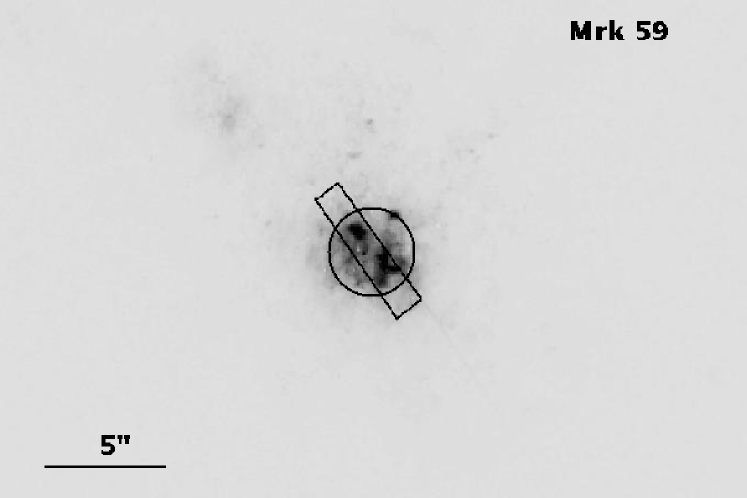
A one-dimensional non-flux-calibrated spectrum of Mrk 59 was extracted from the two-dimensional frame using the APALL IRAF routine, within a 116″ rectangular aperture so as to include the brightest star-forming regions. The extraction aperture is shown in Fig. 1, overlaid on an archival HST/WFPC2 image of Mrk 59. We will hereafter refer to it as the NIR aperture.
We simultaneously correct for telluric absorption and flux-calibrate the spectrum of Mrk 59 by dividing the non flux-calibrated spectrum of Mrk 59 by that of the standard star HIP 73613 and by multiplying the result by the synthetic flux-calibrated spectrum of that same standard star. Since there does not exist a published absolute spectral energy distribution of the standard star HIP 73613, we have used the synthetic absolute spectral energy distribution of the star Vega ( Lyrae) which has a similar spectral type (A0V), and scaled it to the brightness of HIP 73613.
3 RESULTS AND DISCUSSION
The resulting rest-frame NIR spectra of Mrk 59, corrected for telluric absorption, are shown in Fig. 2. Each of the five orders is shown in a separate panel, with the identified lines labeled. Each panel shows two spectra. The upper spectrum is the blown-up version, corresponding to the flux scale given on the y-axis. It excludes the noisy parts. The lower spectrum is the downscaled version of the upper one by a factor of 50. It shows the whole wavelength range of the spectrum in each order.
To have a more complete physical picture of the extinction and the ionization mechanisms in Mrk 59, we have supplemented the NIR observations with optical ones. We have used the optical spectrum of Mrk 59 in the Sloan Digital Sky Survey (SDSS) archives obtained within a circular aperture of 3″ diameter, which covers the wavelength range 0.38 – 0.93 m. The optical and NIR apertures are centered on the same spatial location in Mrk 59 and include the same brightest star-forming regions (see Fig. 1), so the optical and NIR spectra are directly comparable. They overlap in the wavelength range of 0.90 – 0.93 m, allowing us to match one to the other. Specifically, we have adjusted the optical and NIR spectra by scaling the latter by a factor 1.03, so that the flux of the [S iii] 0.907 m emission line is the same in both spectra. This procedure works well despite the fact that this line is located in a noisy part of the NIR spectrum and its flux is derived with an error of 10% (the flux error of the same line in the optical spectrum is smaller, of the order of 3%). The combined redshift-corrected optical and NIR spectrum is shown in Fig. 3. Gaps in the NIR spectrum are regions of strong absorption by the telluric lines.
Emission-line fluxes in both the optical and NIR ranges were measured by using the SPLOT routine in IRAF. The errors of the line fluxes are based on the photon statistics in the non-flux-calibrated spectra. Additionally, we have also included an error of 10% to all lines. This error is that of the [S iii] 0.907 m emission line flux, and including it takes into account the fact that this line was used to adjust the NIR spectrum to the optical one. The observed fluxes () of emission lines derived from the adjusted optical and NIR spectra are shown in the second columns of Tables 1 and 2. They are normalized to the observed H flux, (H) = (2.3050.008)10-13 erg s-1 cm-2, and multiplied by a factor of 100. In Table 2, we have indicated the emission lines that are affected by telluric absorption. Note that several important emission lines in the optical SDSS spectrum are absent: [O ii] 0.373 m is out of the wavelength range of the SDSS spectrum, while the H 0.656 m and [O iii] 0.501 m emission lines are clipped. For these lines, we have adopted the observed fluxes (relative to H) derived by Izotov et al. (1997). This is a valid procedure because the relative intensities of the common emission lines in the SDSS and Izotov et al. (1997) spectra are in good agreement within the errors.
Previously, Mrk 59 has been observed in the NIR by Vanzi & Rieke (1997). The line fluxes of the three emission lines they detected (Br, He i 2.06 m and H2 2.12 m) are lower than ours by a factor of 2.5 – 3.0. However, the continuum level in the Vanzi & Rieke (1997) spectrum is a factor of two higher than that in our spectrum. While the higher continuum level can be explained by the larger aperture used by Vanzi & Rieke (1997) (2412″ as compared to our 116″ extraction aperture), aperture effects cannot account for the lower line fluxes. The reasons for such differences are not clear. Calzetti et al. (1996) (see also Calzetti, 1997) have also observed the Br and [Fe ii] 1.257 m lines in Mrk 59. Their considerably larger aperture (6920″) gives continuum and emission line fluxes that are 4-5 times larger than our fluxes. However, the Br to [Fe ii] 1.257 m line ratio is consistent with ours within the errors. We obtain (Br)/([Fe ii]1.257) = 105 while Calzetti (1997) gets 156.
The presence of many emission lines in the optical and NIR spectra (Figs. 2, 3 and Tables 1 and 2) allows us to study extinction and star formation, H2 and Fe ii emission and excitation mechanisms in Mrk 59. We discuss these issues in the following sections.
3.1 Extinction and star formation
The fact that the NIR spectrum of Mrk 59 has been obtained simultaneously over the entire wavelength range and that it is possible to directly match the optical spectrum to it, using common emission line fluxes in both spectra, eliminates uncertainties introduced by the use of different apertures in the optical and NIR observations and by the adjusting of the continuum levels of NIR spectra obtained separately in different orders. In all previous studies of BCDs, the NIR spectra of BCDs were obtained in separate observations (e.g., Vanzi et al., 2002), and there was no wavelength overlap between the optical and NIR spectra. The elimination of these adjusting uncertainties permits us to compare directly the optical and NIR extinctions.
In the second column of Table 3 we show the observed fluxes () of the strongest hydrogen lines in both optical and NIR spectra which are not affected by telluric absorption. For comparison, the fourth column of Table 3 shows theoretical recombination flux ratios, calculated by Hummer & Storey (1987) for case B with an electron temperature = 15000 K and an electron number density = 100 cm-3, which approximate well the values observed in Mrk 59 (e.g., Izotov et al., 1997). It is seen from Table 2 that the observed and theoretical ratios are close to each other for all hydrogen lines, suggesting very little extinction. Adopting the Cardelli et al. (1989) reddening curve with = / = 3.2, we derive an extinction (H) = 0.11 from the optical spectrum (Table 1). This value of (H) corresponds to = 0.24 mag, consistent with the value = 0.2 mag obtained by Izotov et al. (1997). The extinction-corrected fluxes () of the strong hydrogen lines are shown in the third column of Table 3. There is a very good agreement between the corrected and theoretical recombination values of the line fluxes in both the optical and NIR ranges. This implies that a single (H) [or ] can be used over the whole 0.38 – 2.40 m range to correct line fluxes for extinction. The extinction-corrected fluxes () of all emission lines are shown in the third column of Tables 1 and 2 respectively for the optical and NIR ranges. The fact that does not increase when going from the optical to the NIR wavelength ranges implies that the NIR light does not probe more extinct regions with hidden star formation as compared to the optical light. This appears to be a general result for BCDs (e.g. Vanzi et al., 2000, 2002). Even in the extreme case of the BCD SBS 0335–052E where far-infrared observations imply a very large extinction [ 15–20 mag] and three times as much hidden star formation as seen in the visible (Thuan et al., 1999; Houck et al., 2004), the = 0.73 mag derived in the NIR is only slightly greater than the optical = 0.55 mag (Vanzi et al., 2000).
Using the equivalent width of 154 Å of the H line, Starburst99 (Leitherer et al., 1999) gives a cluster age of about 4.5 Myr in the instantaneous burst case, in good agreement with the age derived by Barth et al. (1994) for Mrk 59. The presence of Wolf-Rayet stars in Mrk 59 (Guseva et al., 2000) also implies that the age of the youngest stellar clusters is greater than 3 Myr. Another age indicator is the clear presence of the CO2.3m absorption feature. Models (Leitherer et al., 1999) predict the appearance of this feature only after 10 Myr. This implies the presence of slightly older clusters in Mrk 59 which do not contribute substantially to the ionization of the gas.
The total H luminosity of Mrk 59 corrected for both Galactic and internal extinction at a distance of 10.7 Mpc is 7.4 1039 ergs s-1 (Gil de Paz et al., 2003). This corresponds to a star formation rate (SFR) of stars more massive than 5 of 0.017 yr-1 (Condon, 1992). The total SFR including all stars more massive than 0.1 is 0.09 yr-1, typical of SFRs of BCDs. The thermal radio continuum flux at 1.4 GHz corresponding to the extinction-corrected H flux is expected to be about 6 mJy (Condon, 1992). Thuan et al. (2002a) have observed a 1.4 GHz flux of 10 mJy in Mrk 59. Thus most of the radio continuum emission is of thermal nature. The remaining flux probably comes from supernova remnants or some hidden star formation. We favor the latter hypothesis as the spectral index is small, equal to 0.15 (Thuan et al., 2002a), while that of supernova remnants is larger, 0.8.
3.2 H2 emission
Molecular hydrogen lines do not originate in the H ii region, but in neutral molecular clouds. In the near-infrared, they are excited through two mechanisms. The first one is the thermal mechanism consisting of collisions between neutral species (e.g., H, H2) resulting from large-scale shocks driven by powerful stellar winds, supernova remnants or molecular cloud collisions (e.g. Shull & Beckwith, 1982). The second one is the fluorescent mechanism due to the absorption of ultraviolet photons (e.g. Black & Dalgarno, 1976). It is known that these two mechanisms mostly excite different roto-vibrational levels of H2. By comparing the observed line ratios with those predicted by models, such as those calculated by Black & van Dishoeck (1987), it is possible to discriminate between the two processes. In particular, line emission from the vibrational level =2 is virtually absent in collisionally excited spectra, while they are relatively strong in fluorescent spectra.
We detect four H2 emission lines in our NIR spectrum: the 2.034 m 1-0 S(2), the 2.122 m 1-0 S(1), the 2.223 m 1-0 S(0) and the 2.248 m 2-1 S(1) lines. The 2.034/2.122, 2.223/2.122 and 2.248/2.122 line flux ratios are close to 0.5 (Table 2), in agreement with the values expected for fluorescent excitation, but significantly higher than those predicted for thermal excitation (Black & van Dishoeck, 1987). In particular, the presence of the 2.248 m 2-1 S(1) line strongly favors the fluorescent mechanism. We conclude that the H2 lines in Mrk 59 are mainly excited by fluorescence. Vanzi et al. (2008) also found the fluorescence excitation process to be responsible for the presence of H2 lines in II Zw 40. This galaxy has an equivalent width EW(H) = 258Å (Guseva et al., 2006), implying that its starburst has a slightly younger age of 3 Myr. How do we reconcile the fact that H2 emission lines are seen in the NIR spectrum while Thuan et al. (2002b) did not detect any H2 absorption line in their FUSE spectrum of Mrk 59? The situation is similar to the one in the BCD SBS 0335–052E (Thuan et al., 2005) where H2 emission is detected in the NIR, but no UV absorption lines are seen. The explanation for the lack of UV absorption lines in Mrk 59 is the same as for SBS 0335–052E: the NIR H2 emission does not come from a uniform low-density neutral interstellar medium but from dense clumps. FUSE observations are not sensitive to such a clumpy H2 distribution. They can only probe diffuse H2 along the lines of sight to the several hundreds of UV-bright massive stars in Mrk 59. As in the case of other BCDs, the absence of diffuse H2 in Mrk 59 can be explained by the combined effects of a low H i density, a scarcity of dust grains on which H2 molecules can form, and a large UV flux that destroys molecules (Thuan et al., 2002b).
3.3 Stellar photoionization CLOUDY model of the H ii region
We next examine the excitation mechanisms for the NIR emission lines in the H ii region of Mrk 59. For this purpose, we have constructed a stellar photoionization model for the H ii region, using the CLOUDY code of Ferland (1996) and Ferland et al. (1998). We list in Table 4 the input parameters of this model. (H) is the log of the number of ionizing photons per second, calculated from the H luminosity at a distance of 10.7 Mpc (Thuan et al., 2002a), is the effective temperature of stellar radiation, is the electron number density and is the filling factor. The remaining input parameters are the number ratios of different species to hydrogen. We varied the abundances of different elements to obtain agreement between the observed and predicted line fluxes. Exceptions are the oxygen abundance for which we use the value derived from the SDSS spectrum, and the carbon and silicon abundances. There are no strong emission lines of these species in the optical and NIR ranges. We have therefore taken their abundances from Kobulnicky & Skillman (1998). For the ionizing stellar radiation, we have adopted a Kurucz (1979) stellar atmosphere model with =50000 K. We have also experimented with other forms of the ionizing stellar radiation such as those given by Starburst99 models (Leitherer et al., 1999) or by models based on Geneva stellar evolutionary tracks with a heavy element mass fraction = 0.004 (Meynet et al., 1994). In all cases, we were able to reproduce well the observed line intensities by varying only slightly the input parameters. Thus our results are robust and do not depend sensitively on a particular adopted grid of models.
The CLOUDY-predicted fluxes of the optical emission lines are shown in the fourth column of Table 1. Comparison of the third and fourth columns of that table shows that, in general, the agreement between the optical observations and the CLOUDY predictions is very good. The most notable difference is for sulfur. The model reproduces well the [S iii] emission line fluxes, but the predicted fluxes for the [S ii] nebular lines are lower by a factor of 2 than the observed ones. A probable cause for this discrepancy is the poorly known dielectronic recombination coefficients of sulfur, on which the ionic abundances depend sensitively (e.g., Izotov et al., 2006).
Examination of the third and fourth columns of Table 2 shows that the same CLOUDY model reproduces also very well the observed emission-line fluxes in the NIR spectrum. This agreement implies that a H ii region model including only stellar photoionization as ionizing source is able to account for the observed fluxes both in the optical and NIR ranges. No additional excitation mechanisms such as shocks from stellar winds and supernova remnants are needed. This situation is again similar to that in the BCD II Zw 40 where Vanzi et al. (2008) found that the interstellar medium (ISM) is mainly photoexcited by stars.
3.4 [Fe ii] line emission
The [Fe ii] 1.257 and 1.643 m emission lines are clearly detected (Fig. 1). They have often been used as indicators of the importance of shock excitation relative to photoionization (Moorwood & Oliva, 1988; Oliva et al., 1990, 2001). In the Galaxy, the intensities of these lines are considerably smaller in regions where photoionization dominates than in those where shock excitation dominates, such as in SN remnants. For example, the ratio of the [Fe ii] 1.643 m line to Br is 0.06 in the Orion nebula, while it is more than 30 in Galactic SN remnants (Moorwood & Oliva, 1988; Oliva et al., 1990). This is because fast shocks propagating in the diffuse ISM can destroy dust grains through sputtering processes or grain-grain collisions,and replenish the ISM with gas-phase iron. The gaseous iron is then collisionally excited in the cooling post-shock gas, and produces the observed infrared emission.
In the Mrk 59 spectrum, the ratios of the [Fe ii] 1.257 m and [Fe ii] 1.643 m line intensities to that of Br have the very low values of 0.099 and 0.118, respectively. Calzetti (1997) also found that the [Fe ii] 1.257 m line flux is some 30 times smaller in Mrk 59 (for a given Pa flux) as compared to the remaining galaxies in her sample of 19 starburst galaxies, all having higher metallicity (about solar) and lower excitation. Does this mean that there is no significant SN shock excitation in Mrk 59? If this is the case, this raises a puzzle since the age of the ionizing cluster in Mrk 59 is 4.5 Myr. For a Salpeter IMF and an upper mass limit of 100 , Starburst99 (Leitherer et al., 1999) gives a SN rate of 1.410-4 yr-1. Since the first SN explodes around 3 Myr, we would expect 200 SNe to have occurred by the age of 4.5 Myr.
Examination of Table 2 shows that the stellar photoionization CLOUDY model reproduces reasonably well the observed [Fe ii] 1.257 and 1.643 m line fluxes. We have also run a CLOUDY model where the ionization radiation does not come from stars like in the model discussed in Section 3.3, but from fast radiative shocks, as modeled by Allen et al. (2008). We use the slowest available shock model from Allen et al. (2008), with a velocity of 100 km s-1. With the observed log Q = 51.953 (Table 4), we again obtain [Fe ii] 1.257 m/Br and 1.643 m/Br line flux ratios of 0.1, similar to those obtained with the model with stellar ionizing radiation (Table 2). It is clear that, in a high-excitation H ii region as Mrk 59, the [Fe ii] 1.257 and 1.643 m emission lines are not particularly sensitive to the presence of shocks, since CLOUDY models with a stellar ionizing spectrum or with a shock ionizing spectrum produce the same line intensities. However, the shock model fails to reproduce the strong forbidden emission line fluxes, for example overpredicting the [O ii] 0.373 m emission line by 40% and underpredicting the [O iii] 0.501 m emisssion line by 80%. It is clear that shocks, although likely present in Mrk 59, cannot be the main source of ionization in it. Stellar radiation is.
We thus conclude that the [Fe ii] 1.257 and 1.643 m emission lines cannot be used as shock indicators in high-excitation low-metallicity H ii regions. This means, for example, that the Starburst99 (Leitherer et al., 1999) predictions for the [Fe ii] 1.257 line flux as a function of the supernova rate cannot be applied to Mrk 59. This is because these predictions are based on mean relations established by Calzetti (1997) for [Fe ii] line emission in low-excitation high-metallicity starburst galaxies. Calzetti (1997) found that the [Fe ii] 1.257 line flux of the high-excitation low-metallicity BCD Mrk 59 (= NGC 4861) deviates strongly from that mean relation, being a factor of 30 below the [Fe ii] 1.257 line flux – Pa line flux mean relation. This could be due to two reasons: 1) the lower metallicity in Mrk 59 results in a lower Fe abundance; and 2) the higher excitation of Mrk 59 results in an iron ionic composition which is very different from that for other galaxies. Our CLOUDY stellar photoionization model predicts that most of the iron in Mrk 59 is in the Fe iv ionization stage, there being about 10 times more Fe iv ions than Fe ii ions (by volume), and about 3 times more Fe iii ions than Fe ii ions.
4 CONCLUSIONS
We discuss here the results of near-infrared (NIR) spectroscopic observations of the blue compact dwarf (BCD) galaxy Mrk 59. The NIR data have been supplemented by the optical spectrum from the Sloan Digital Sky Survey (SDSS), resulting in a total wavelength coverage of 0.38 – 2.46 m. The overlap in the 0.90 - 0.93 m wavelength range allows to adjust the flux level of the NIR spectrum to that of the optical spectrum, using fluxes of common emission lines.
We have arrived at the following conclusions:
1. Using the Balmer decrement of hydrogen emission lines in the optical range, we find that the extinction in Mrk 59 is low, amounting to = 0.24 mag. Correcting the observed hydrogen emission line fluxes in the NIR range for this optically-derived reddening gives values that are very close to the theoretical recombination values. Thus, extinction in Mrk 59 is the same in both optical and NIR ranges. The NIR light does not probe more extinct regions with hidden star formation as compared to the optical light.
2. We have detected four molecular hydrogen emission lines in the NIR spectrum of Mrk 59. Comparison of the observed fluxes with modeled ones suggests that the main excitation mechanism of H2 emission in Mrk 59 is fluorescence. The H2 emission comes not from a uniform low-density neutral medium but from dense clumps.
3. A CLOUDY model with a pure stellar ionizing radiation reproduces well the observed emission line fluxes in both optical and NIR ranges. Shocks are likely present in the H ii region, but play a minor role in the ionization.
4. CLOUDY stellar ionizing and shock excitation models show that the [Fe ii] 1.257 and 1.643 m emission lines, often used as SN shock indicators in low-excitation high-metallicity starburst galaxies, cannot play such a role in high-excitation low-metallicity H ii regions such as Mrk 59. Both types of models predict similarly low [Fe ii] emission line fluxes for the latter category of objects, so that these line fluxes cannot discriminate between the two mechanisms.
References
- Allen et al. (2008) Allen, M. G., Groves, B. A., Dopita, M. A., Sutherland, R. S., & Kewley, L. J. 2008, ApJS, 178, 20
- Arp (1966) Arp, H. C. 1966, ApJS, 14, 1
- Barth et al. (1994) Barth, C. S., Cepa, J., Vilchez, J. M., & Dottori, H. A. 1994, AJ, 108, 2069
- Black & Dalgarno (1976) Black, J. H., & Dalgarno, A. 1976, ApJ, 203, 132
- Black & van Dishoeck (1987) Black, J. H., & van Dishoeck, E. F. 1987, ApJ, 322, 412
- Calzetti (1997) Calzetti, D. 1997, AJ, 113, 162
- Calzetti et al. (1996) Calzetti, D., Kinney, A. L., & Storchi-Bergmann, T. 1996, ApJ, 458, 132
- Cardelli et al. (1989) Cardelli, J. A., Clayton, G. C., & Mathis, J. S. 1989, ApJ, 345, 245
- Condon (1992) Condon, J. J. 1992, ARA&A, 30, 575
- Dinerstein & Shields (1986) Dinerstein, H. L., & Shields, G. A. 1986, ApJ, 311, 45
- Ferland (1996) Ferland, G. J. 1996, Hazy: A brief Introduction to CLOUDY, Univ. Kentucky Phys. Dept. Int. Rep.
- Ferland et al. (1998) Ferland, G. J., Korista, K. T., Verner, D. A., Ferguson, J. W., Kingdon, J. B., & Verner, E. M. 1998, PASP, 110, 761
- Gil de Paz et al. (2003) Gil de Paz, A., Madore, B. F., & Pevunova, O. 2003, ApJS, 147, 29
- Guseva et al. (2000) Guseva, N. G., Izotov, Y. I., & Thuan, T. X. 2000, ApJ, 531, 776
- Guseva et al. (2006) Guseva, N. G., Izotov, Y. I., & Thuan, T. X. 2006, ApJ, 644, 890
- Houck et al. (2004) Houck, J. R. et al. 2004, ApJS, 154, 211
- Hummer & Storey (1987) Hummer, D. G., & Storey, P. J. 1987, MNRAS, 224, 801
- Izotov et al. (1997) Izotov, Y. I., Thuan, T. X., & Lipovetsky, V. A. 1997, ApJS, 108, 1
- Izotov et al. (2006) Izotov, Y. I., Stasińska, G., Meynet, G., Guseva, N. G., & Thuan T. X. 2006, A&A, 448, 955
- Kobulnicky & Skillman (1998) Kobulnicky, H. A., & Skillman, E. D. 1998, ApJ, 497, 601
- Kurucz (1979) Kurucz, R. L. 1979, ApJS, 40, 1
- Leitherer et al. (1999) Leitherer, C., et al. 1999, ApJS, 123, 3
- Loose & Thuan (1985) Loose, H.-H., & Thuan, T. X. 1985, in Star-forming Dwarf Galaxies and Related Objects, ed. D. Kunth, T. X. Thuan & J. T. T. Van (Gif-sur-Yvette: Editions Frontières), 73
- Meynet et al. (1994) Meynet, G., Maeder, A., Schaller, G., Schaerer, D., & Charbonnel, C. 1994, A&AS, 103, 97
- Moorwood & Oliva (1988) Moorwood, A. F. M., & Oliva, E. 1988, A&A, 203, 278
- Noeske et al. (2000) Noeske, K. G., Guseva, N. G., Fricke, K. J., Izotov, Y. I., Papaderos, P., & Thuan, T. X. 2000, A&A, 361, 33
- Oliva et al. (1990) Oliva, E., Moorwood, A. F. M., & Danziger, I. J. 1990, A&A, 240, 453
- Oliva et al. (2001) Oliva, E., et al. 2001, A&A, 369, L5
- Shull & Beckwith (1982) Shull, J. M., & Beckwith, S. 1982, ARA&A, 20, 163
- Thuan et al. (1987) Thuan, T. X., Williams, T. B., & Malumuth, E. 1987, in Starbursts and Galaxy Evolution, ed. T. X. Thuan, T. Montmerle, & J. T. T. Van (Gif-sur-Yvette: Editions Frontières), 151
- Thuan et al. (1999) Thuan, T. X., Sauvage, M., & Madden, S. 1999, ApJ, 516, 783
- Thuan et al. (2002a) Thuan, T. X., Lévrier, F., & Hibbard, J. E. 2002a, AJ, 128, 617
- Thuan et al. (2002b) Thuan, T. X., Lecavelier des Etangs, A., & Izotov, Y. I. 2002b, ApJ, 565, 941
- Thuan et al. (2005) Thuan, T. X., Lecavelier des Etangs, A., & Izotov, Y. I. 2005, ApJ, 621, 269
- Vanzi & Rieke (1997) Vanzi, L., & Rieke, G. H. 1997, ApJ, 479, 694
- Vanzi et al. (2000) Vanzi, L., Hunt, L. K., Thuan, T. X., & Izotov, Y. I. 2000, A&A, 363, 493
- Vanzi et al. (2002) Vanzi, L., Hunt, L. K., & Thuan, T. X. 2002, A&A, 390, 481
- Vanzi et al. (2008) Vanzi, L., Cresci, G., Telles, E., & Melnick, J. 2008, A&A, 486, 393
- Wilcots et al. (1996) Wilcots, E. M., Lehman, C., & Miller, B. 1996, AJ, 111, 1575
- Wilson et al. (2004) Wilson, J. C., et al. 2004, SPIE, 5492, 1295
| Ion | 100()/(H)aa(H)=(2.3050.008)10-13 erg s-1 cm-2. | 100()/(H)bbCorrected for extinction with (H)=0.11. | CLOUDY |
|---|---|---|---|
| 0.373 [O ii]ccObserved flux is from Izotov et al. (1997). | 104.703.00 | 113.243.50 | 124.16 |
| 0.384 H9 | 6.310.23 | 6.900.29 | 7.69 |
| 0.387 [Ne iii] | 45.491.32 | 48.831.51 | 49.80 |
| 0.389 He i+H8 | 18.140.55 | 19.560.64 | 19.86 |
| 0.389 [Ne iii]+H7 | 28.120.83 | 30.120.94 | 31.31 |
| 0.403 He i | 1.350.12 | 1.430.13 | 1.91 |
| 0.407 [S ii] | 0.920.12 | 0.970.12 | 0.63 |
| 0.408 [S ii] | 0.200.11 | 0.210.12 | 0.21 |
| 0.384 H | 24.720.73 | 26.240.81 | 26.31 |
| 0.434 H | 46.831.36 | 48.731.44 | 47.37 |
| 0.436 [O iii] | 8.530.28 | 8.840.29 | 8.85 |
| 0.439 He i | 0.350.10 | 0.360.10 | 0.51 |
| 0.447 He i | 3.480.15 | 3.580.15 | 3.95 |
| 0.466 [Fe iii] | 0.600.10 | 0.610.10 | 0.64 |
| 0.471 [Ar iv]+He i | 1.260.10 | 1.280.10 | 1.28 |
| 0.474 [Ar iv] | 0.710.10 | 0.710.10 | 0.59 |
| 0.486 H | 100.002.87 | 100.002.87 | 100.00 |
| 0.492 He i | 0.800.09 | 0.800.09 | 1.06 |
| 0.496 [O iii] | 207.145.92 | 205.705.89 | 197.09 |
| 0.499 [Fe iii] | 0.580.09 | 0.580.09 | 0.02 |
| 0.501 [O iii]ccObserved flux is from Izotov et al. (1997). | 594.0017.0 | 588.4916.9 | 593.23 |
| 0.502 He i | 2.270.12 | 2.240.12 | 2.53 |
| 0.520 [N i] | 0.330.08 | 0.320.08 | 0.09 |
| 0.527 [Fe iii] | 0.260.08 | 0.260.08 | 0.32 |
| 0.552 [Cl iii] | 0.380.08 | 0.360.07 | 0.36 |
| 0.554 [Cl iii] | 0.290.08 | 0.280.07 | 0.27 |
| 0.575 [N ii] | 0.130.07 | 0.130.07 | 0.11 |
| 0.588 He i | 10.520.33 | 9.990.32 | 9.91 |
| 0.630 [O i] | 1.770.09 | 1.660.09 | 1.57 |
| 0.631 [S iii] | 1.960.09 | 1.840.09 | 1.76 |
| 0.636 [O i] | 0.560.07 | 0.520.06 | 0.50 |
| 0.655 [N ii] | 1.700.09 | 1.580.08 | 1.58 |
| 0.656 HccObserved flux is from Izotov et al. (1997). | 307.208.77 | 285.158.71 | 283.73 |
| 0.658 [N ii] | 4.680.16 | 4.340.16 | 4.65 |
| 0.668 He i | 3.060.12 | 2.830.12 | 2.74 |
| 0.672 [S ii] | 9.850.30 | 9.090.30 | 4.74 |
| 0.673 [S ii] | 7.220.23 | 6.670.23 | 3.59 |
| 0.707 He i | 2.520.10 | 2.300.10 | 3.15 |
| 0.714 [Ar iii] | 8.650.27 | 7.870.27 | 7.83 |
| 0.728 He i | 0.640.06 | 0.580.06 | 0.67 |
| 0.732 [O ii] | 1.590.08 | 1.440.08 | 2.18 |
| 0.733 [O ii] | 1.310.07 | 1.180.07 | 1.73 |
| 0.775 [Ar iii] | 2.020.09 | 1.800.09 | 1.89 |
| 0.847 Pa17 | 0.370.15 | 0.320.14 | 0.29 |
| 0.850 Pa16 | 0.470.15 | 0.410.14 | 0.34 |
| 0.855 Pa15 | 0.470.15 | 0.410.14 | 0.45 |
| 0.860 Pa14 | 0.710.15 | 0.620.14 | 0.99 |
| 0.867 Pa13 | 0.730.15 | 0.630.14 | 1.03 |
| 0.875 Pa12 | 1.080.15 | 0.950.14 | 1.20 |
| 0.886 Pa11 | 1.460.17 | 1.260.16 | 1.49 |
| 0.901 Pa10 | 2.080.19 | 1.790.18 | 1.92 |
| 0.907 [S iii] | 16.960.50 | 14.620.54 | 15.06 |
| Ion | 100()/(H)aa(H)=(2.3050.008)10-13 erg s-1 cm-2. | 100()/(H)bbCorrected for extinction with (H)=0.11. | CLOUDY |
|---|---|---|---|
| 0.907 [S iii] | 16.981.63 | 14.631.40 | 15.06 |
| 0.953 [S iii]ccThe observed flux is affected by telluric absorption. | 43.434.27 | 37.133.88 | 37.35 |
| 0.955 PaccThe observed flux is affected by telluric absorption. | 3.260.43 | 2.790.41 | 3.66 |
| 1.005 Pa | 5.440.56 | 4.610.45 | 5.47 |
| 1.029 [S ii] | 0.150.06 | 0.130.06 | 0.15 |
| 1.032 [S ii] | 0.150.08 | 0.130.08 | 0.20 |
| 1.083 He i | 24.442.42 | 20.282.28 | 25.96 |
| 1.091 He i | 0.430.08 | 0.340.08 | 0.28 |
| 1.094 Pa | 9.080.91 | 7.610.66 | 8.77 |
| 1.163 He ii | 0.120.07 | 0.090.06 | 0.00 |
| 1.197 He i | 0.160.07 | 0.140.07 | 0.19 |
| 1.253 He i | 0.160.06 | 0.140.06 | 0.19 |
| 1.257 [Fe ii] | 0.280.09 | 0.250.09 | 0.34 |
| 1.279 He i | 0.960.12 | 0.940.11 | 0.53 |
| 1.282 Pa | 16.401.60 | 14.641.45 | 15.65 |
| 1.544 Br17 | 0.220.07 | 0.180.06 | 0.14 |
| 1.556 Br16 | 0.240.07 | 0.190.06 | 0.17 |
| 1.570 Br15 | 0.300.09 | 0.240.07 | 0.22 |
| 1.588 Br14 | 0.350.07 | 0.290.07 | 0.47 |
| 1.611 Br13 | 0.450.08 | 0.360.07 | 0.49 |
| 1.641 Br12 | 0.530.08 | 0.430.08 | 0.58 |
| 1.643 [Fe ii] | 0.360.07 | 0.300.07 | 0.33 |
| 1.681 Br11 | 0.780.11 | 0.630.10 | 0.71 |
| 1.700 He i | 0.380.09 | 0.300.07 | 0.28 |
| 1.732 He i | 0.100.04 | 0.080.03 | |
| 1.736 Br10 | 1.020.13 | 0.820.09 | 0.92 |
| 1.745 [Fe ii]+He i | 0.070.05 | 0.060.04 | |
| 1.876 PaccThe observed flux is affected by telluric absorption. | 33.633.18 | 26.972.78 | 31.74 |
| 1.944 BrccThe observed flux is affected by telluric absorption. | 2.160.37 | 1.730.28 | 1.77 |
| 2.034 H2 1-0 S(2) | 0.130.04 | 0.100.04 | |
| 2.058 He iccThe observed flux is affected by telluric absorption. | 1.320.16 | 1.070.14 | 1.45 |
| 2.122 H2 1-0 S(1) | 0.260.09 | 0.210.08 | |
| 2.165 Br | 3.180.32 | 2.540.30 | 2.64 |
| 2.223 H2 1-0 S(0) | 0.100.06 | 0.080.05 | |
| 2.248 H2 2-1 S(1) | 0.150.06 | 0.110.05 |
| Line | 100()/(H)aa(H)=2.30510-13 ergs s-1cm-2. | 100()/(H)bbCorrected for extinction with (H)=0.11. | Theor.ccRecombination ratios for =15000 K and = 100 cm-3 from Hummer & Storey (1987). |
|---|---|---|---|
| a) Optical spectrum | |||
| 0.410 H | 24.7 | 26.2 | 26.2 |
| 0.434 H | 46.8 | 48.7 | 47.3 |
| 0.434 H | 100.0 | 100.0 | 100.0 |
| 0.875 Pa12 | 1.1 | 1.0 | 1.0 |
| 0.886 Pa11 | 1.5 | 1.3 | 1.3 |
| 0.901 Pa10 | 2.1 | 1.8 | 1.8 |
| b) NIR spectrum | |||
| 1.094 Pa | 9.1 | 7.6 | 8.6 |
| 1.282 Pa | 16.4 | 14.6 | 15.2 |
| 2.165 Br | 3.2 | 2.5 | 2.5 |
| Parameter | Value |
|---|---|
| (H) | 51.953 |
| , K | 50000 |
| , cm-3 | 100 |
| 0.07 | |
| log He/H | –1.07 |
| log C/H | –4.48 |
| log N/H | –5.34 |
| log O/H | –3.97 |
| log Ne/H | –4.72 |
| log Si/H | –5.35 |
| log S/H | –5.69 |
| log Cl/H | –7.59 |
| log Ar/H | –6.32 |
| log Fe/H | –6.22 |