Survival probability for diffractive dijet production in collisions from next-to-leading order calculations
Abstract
We perform next-to-leading order calculations of the single-diffractive and non-diffractive cross sections for dijet production in proton-antiproton collisions at the Tevatron. By comparing their ratio to the data published by the CDF collaboration for two different center-of-mass energies, we deduce the rapidity-gap survival probability as a function of the momentum fraction of the parton in the antiproton. Assuming Regge factorization, this probability can be interpreted as a suppression factor for the diffractive structure function measured in deep-inelastic scattering at HERA. In contrast to the observations for photoproduction, the suppression factor in proton-antiproton collisions depends on the momentum fraction of the parton in the Pomeron even at next-to-leading order.
pacs:
12.38.Bx,12.38.Qk,12.39.St,12.40Nn,13.87CeDESY 09-130
LPSC 09-112
I Introduction
Diffractive events in high-energy or collisions are characterized by the presence of a leading proton or antiproton, which remains intact, and/or by a rapidity gap, defined as a (pseudo-)rapidity region devoid of particles. Theoretically, diffractive interactions are described in the framework of Regge theory 1 as the exchange of a trajectory with vacuum quantum numbers, the so-called Pomeron () trajectory. Diffractive scattering involving hard processes (hard diffraction) such as the production of high- jets has been studied experimentally to investigate the parton content of the Pomeron (or additional lower-lying Regge poles). In this framework, hard diffraction can be expressed as a two-step process, , and similarly diffractive deep-inelastic scattering (DDIS) as . The subprocess is interpreted as deep-inelastic scattering (DIS) on the Pomeron target for the case that the virtuality of the exchanged photon is sufficiently large. In analogy to DIS on a proton target, , the cross section for DIS on a Pomeron target is expressed as a convolution of partonic cross section and universal parton distribution functions (PDFs) of the Pomeron. The partonic cross sections are the same as for DIS. The Pomeron PDFs are multiplied with vertex functions for the vertex , yielding the diffractive PDFs (DPDFs). The additional vertex functions depend on the fractional momentum loss and the four-momentum transfer squared of the recoiling proton. The DDIS experiments measure the diffractive structure function of the proton integrated over , where is the momentum fraction of the parton in the Pomeron and is the virtuality of the . The evolution of the DPDFs is calculated with the usual DGLAP 2 evolution equations known from DIS. Except for the evolution, the DPDFs are not calculable in the framework of perturbative QCD and must be determined from experiment. Such DPDFs have been obtained from the HERA inclusive measurements of 3 ; 4 . The presence of a hard scale such as the squared photon virtuality in DIS or a large transverse jet energy in hard diffractive processes, as for example in or , allows for the calculation of the corresponding partonic cross sections using perturbative QCD. The central issue is whether such hard diffractive processes obey QCD factorization, i.e. can be calculated in terms of parton-level cross sections convolved with universal DPDFs.
For DIS processes, QCD factorization has been proven to hold 5 , and DPDFs have been extracted at low and intermediate 3 ; 4 from high-precision inclusive measurements of the process using the usual DGLAP evolution equations. The proof of the factorization formula also appears to be valid for the direct part of photoproduction () of jets 5 . However, factorization does not hold for hard processes in diffractive hadron-hadron scattering. The problem is that soft interactions between the ingoing hadrons and their remnants occur in both the initial and final states. This was also the result of experimental measurements by the CDF collaboration at the Tevatron 6 , where it was found that the single-diffractive dijet production cross section was suppressed by up to an order of magnitude as compared to the prediction based on DPDFs determined earlier by the H1 collaboration at HERA 7 . In the CDF experiment 6 , the suppression factor was determined by comparing single-diffractive (SD) and non-diffractive (ND) events. SD events are triggered on a leading antiproton in the Roman pot spectrometer and at least one jet, while the ND trigger requires only a jet in the CDF calorimeters. The ratio of SD to ND dijet production rates is in a first approximation proportional to the ratio of the corresponding structure functions , i.e.
| (1) |
An approximation to the SD structure function , , was obtained by multiplying the above ratio of rates by the known effective
| (2) |
after integrating this ratio over and and changing variables from to using . The result was then compared to the DPDFs from H1 7 using the same approximate formula, Eq. (2), relating the structure function to gluon and quark DPDFs as in the ND case. The above formula for the ratio is certainly not sufficient for estimating the suppression factor for diffractive dijet production in collisions. It is based on a leading order (LO) calculation of the cross section in the numerator and in the denominator. Furthermore, it is assumed that the convolutions of the PDFs in the numerator and the denominator with the partonic cross sections are identical and drop out in the ratio together with the PDFs for the ingoing proton. These approximations are not valid in next-to-leading order (NLO), where, in particular, the cross sections in the numerator and denominator depend on the jet algorithm and on the kinematics of the SD and ND processes.
Since 2002, the two HERA collaborations have presented results for diffractive dijet photoproduction in order to establish a possible suppression factor. The factorization breaking was first investigated on the basis of NLO predictions by us in 2004 8 ; 9 by comparing to preliminary H1 data 10 . Already in 2004 it became clear that in photoproduction the breaking could be shown only by comparing with NLO predictions, which produced by a factor of two larger cross sections than the LO predictions. Concerning factorization breaking, the conclusions were the same based on a preliminary ZEUS analysis 11 . Both collaborations, H1 and ZEUS, have now published their final experimental data 12 ; 13 . Whereas H1 confirm in 12 their earlier findings based on the analysis of their preliminary data and preliminary DPDFs, the ZEUS collaboration 13 reached somewhat different conclusions from their analysis. In particular, the H1 collaboration 12 obtained a global suppression of their measured cross sections as compared to the NLO calculation of approximately . In addition they concluded that also the direct cross section together with the resolved one does not obey factorization. The ZEUS collaboration, however, concluded from their analysis 13 that, within the large uncertainties of the NLO calculations and the differences in the DPDF input, their data are compatible with the NLO QCD calculation, i.e. a suppression could not be deduced from their data. In several recent reviews, we have shown, however, that the ZEUS data are compatible with the older H1 12 and with even more recent H1 data 14 , if one adjusts the ZEUS large rapidity-gap inclusive DIS diffractive data to the analogous H1 data, which are the basis of the recent H1 DPDFs 4 and which are used to predict the diffractive dijet photoproduction cross sections. In these recent reviews 15 we also investigated whether the NLO prediction with resolved suppression only, which would be more in line with the findings in 5 , will also describe the H1 and ZEUS data in a satisfactory way. The result is, that this is indeed possible, and the resolved suppression factor is of the order of . For the global suppression, i.e. direct and resolved component equally, the suppression factor is larger, and in addition, depends on , which is not the case for the resolved suppression only.
In this work we want to bring the theoretical analysis of diffractive dijet production in collisions to the same level as has been done for diffractive dijet photoproduction, i.e. to calculate the cross sections up to NLO and then compare with the CDF data, to establish the suppression factor in the Tevatron energy range. For this purpose we shall calculate the ratio . For this we need the NLO cross sections for SD and ND with the cuts as in the CDF measurements. The outline of the paper is as follows. In Section 2 we shall describe shortly the kinematic restrictions for the CDF analysis based on measurements at Run I for GeV 6 and on measurements at GeV and GeV 16 obtained for comparison at two different center-of-mass energies. In this section we shall also specify the various inputs for our calculation. Our results and the comparison with the CDF data are presented in Sect. 3. The first GeV data are compared with the calculations in Sect. 3.1. The comparative study of the 630 and the new 1800 GeV cross sections are presented in Sect. 3.2. An interpretation of the observed suppression factor is given in Sect. 3.3. Sect. 4 contains a summary and our conclusions.
II Kinematic cuts and input for the calculations
The data, which we want to compare our NLO calculations with, are published in Ref. 6 and Ref. 16 . In the first paper 6 , the CDF collaboration measured non-diffractive and single-diffractive dijet cross sections at a center-of-mass energy of GeV using Run IC (1995-1996) data. From an inclusive sample of single-diffraction (SD) events, , triggering on a detected in a forward Roman pot spectrometer, a diffractive dijet subsample with transverse energy GeV was selected. In addition to the two leading jets, these events contain other lower- jets. Similarly, a non-diffractive (ND) dijet sample was selected. From the and the rapidity of the jets, the fraction of the momentum of the antiproton carried by the struck parton was calculated, where is given by
| (3) |
The jets were detected and their energy measured by calorimeters covering the pseudorapidity range . The was defined as the sum of the calorimeter ’s within an cone of radius 0.7. The jet energy correction included a subtraction of an average underlying event of of 0.54 (1.16) GeV for diffractive (non-diffractive) events. The recoil antiproton fractional momentum loss and four-momentum transfer squared were in the range and GeV2, respectively, which was in the final sample restricted to GeV2. In the second paper 16 , the study of diffractive dijet events was extended to GeV. These data were compared to new measurements at GeV in order to test Regge factorization. This study is similar to the previous diffractive dijet study in experimental setup and methodology. For the SD sample, the -region is the same, , but GeV2. Again in the SD sample events with at least two jets with GeV were selected, where again the was defined as the sum of the calorimeter ’s within a cone of 0.7 in space. The jet energy correction included a subtraction of an average underlying event of 0.5 (0.9) GeV for SD (ND) events.
The calculation of the cross sections for dijet production in non-diffractive and single-diffractive processes has been performed up to NLO. For the comparison we have calculated these cross sections also in LO. For our calculations, we rely on our work on dijet production in the reaction 17 , in which we have calculated the cross sections for inclusive one-jet and two-jet production up to NLO for both the direct and the resolved contribution. The version for the resolved contribution can be used immediately for two-jet production in collisions by substituting for the photon PDF the antiproton PDF (for ND) or the Pomeron PDF (for SD). For the (anti-)proton PDF we have chosen the version CTEQ6.6M 18 for the NLO calculation with active flavors. The strong coupling constant is calculated from the two-loop formula with MeV. For the calculation in LO we have chosen CTEQ6L1 19 with determined from the one-loop formula and MeV. The diffractive PDFs are taken from the recent H1 fits to the inclusive diffractive DIS data 4 . They are only available at NLO and come in two versions, ’H1 2006 fit A’ and ’H1 2006 fit B’. These differ mostly in the gluon density, which is poorly constrained by the inclusive diffractive scattering data, since there is no direct coupling of the photon to gluons, so that the gluon density is constrained only through the evolution. The ’H1 2006 fit A’ has a much larger gluon for larger momentum fractions at the starting scale of GeV than ’fit B’, which leads to a larger gluon also for larger scales . The original fit on the data in 4 is performed with massless flavors. The production of charm quarks was treated in the Fixed-Flavor Number Scheme (FFNS) in NLO with non-zero charm-quark mass yielding a diffractive . This is contained in the ’H1 fit 2006 A, B’ parameterizations and is then converted into a charm PDF. The H1 collaboration constructed a third set of DPDFs, which is called the ’H1 2007 fit jets’ and which is obtained through a simultaneous fit to the diffractive DIS inclusive and dijet cross sections 20 . It is performed under the assumption that there is no factorization breaking in the diffractive dijet cross sections. Including the diffractive DIS dijet cross section in the analysis leads to additional constraints, mostly on the diffractive gluon distribution. On average, the ’H1 2007 fit jets’ is similar to the ’H1 2006 fit B’, except for the gluon distribution at large momentum fraction and small factorization scale. The DPDFs of H1 contain as a factor the vertex function , which describes the coupling of the Pomeron to the proton, i.e. the proton-proton-Pomeron vertex. This vertex function is parameterized by the Pomeron trajectory and an additional exponential dependence on . This function is used also for our calculations, as it has been determined by the H1 collaboration when fitting their data. The normalization factor of this function is included in the Pomeron PDFs. Therefore the H1 DPDFs are products of the Pomeron flux factors and the Pomeron PDFs. These H1 DPDFs include also low-mass proton dissociative processes with invariant mass GeV, which increases the inclusive diffractive DIS cross section as compared to cross sections with a pure (anti-)proton final state. We have to keep this in mind, when we compare to the CDF data, which use a forward Roman pot spectrometer to trigger on the final antiproton and therefore have no antiproton dissociative contributions.
III Results
In this section we present our results and compare them to the experimental data obtained with TeV in 6 and to the more recent data with TeV and TeV published in 16 . In this latter publication, the kinematic constraints differ in some points from the constraints used in 6 . First we compare to the normalized differential cross sections and for non-diffractive and diffractive dijet production. Second, the ratio of the number of SD dijet events to the number of ND dijets is compared to the CDF data. This function , obtained by integrating the cross sections in the numerator of Eq. (1) over and , is the main result, and from the theoretical and experimental distribution as a function of the suppression factor can be deduced and can be studied for the three H1 DPDFs, ’H1 2006 fit A’, ’H1 2006 fit B’ 4 and ’H1 2007 fit jets’ 20 for the NLO and the LO (which has been done only for the ’H1 2006 fit B’) calculations.
III.1 Comparison with 1800 GeV data
First we have calculated the distribution as a function of , where refers to the jet with the largest (second largest) for ND and SD dijet production with GeV center-of-mass energy, integrated over the rapidities of the jets in the range . Jets are defined with the usual cone algorithm within a chosen cone of radius and a partonic distance to match the experimental analysis 20a . is the integrated cross section with the cut GeV. The lower limit of the leading and subleading jet differ slightly in order to avoid infrared sensitivity in the computation of the NLO cross sections, when integrated over 21 . Unfortunately in the experimental analysis such an asymmetric choice of and has not been made, since both and are restricted by GeV, so that we do not know whether the choice GeV is in accord with the experimental analysis. Therefore we have also varied the cut slightly to GeV. The results for are
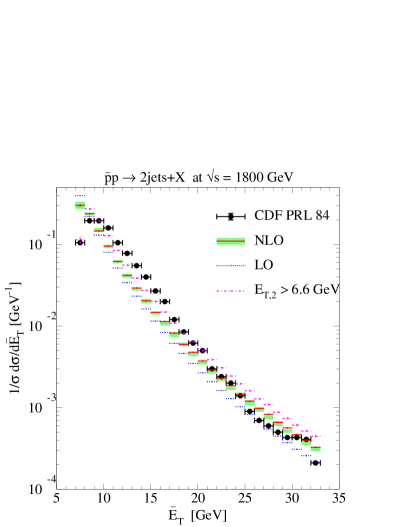
shown in Fig. 1 (left) for GeV (full histogram) and GeV (dot-dashed histogram), respectively. Together with the NLO cross section, we also show the LO cross section (dotted histogram) and the scale variation of the NLO result (shaded band), where the renormalization and factorization scales are varied simultaneously by factors of 0.5 and 2.0 compared to the default scale, which is chosen equal to , i.e. the largest of both jets. As is often the case, the scale uncertainty is relatively small in the normalized distributions. In Fig. 1 (left) we have included also the measured cross section from 6 , which unfortunately is given without the experimental uncertainties. Besides the statistical errors, which should be similar to those in the single-diffractive distributions given the similar number of ND and SD events 20a , there are also systematic errors, as for example those associated with the jet energy scale. These would be needed for a fair comparison. Second, the theoretical cross sections should be corrected for hadronization effects when comparing to data. These are not known to us, but could be calculated through Monte Carlo models. If we compare the calculations in Fig. 1 (left) with the data, we observe that the results with GeV agree reasonably well with the data in the large range, GeV, but much less for the low and medium range. Conversely, for GeV the small and medium range agrees better and the large range less. The experimental errors will be larger in the large range. Therefore the cross section with the cut GeV would be preferred, in particular also because we have perfect agreement in the first, second and third bin, which are the most important ones for the integrated cross section , which determines the normalization.
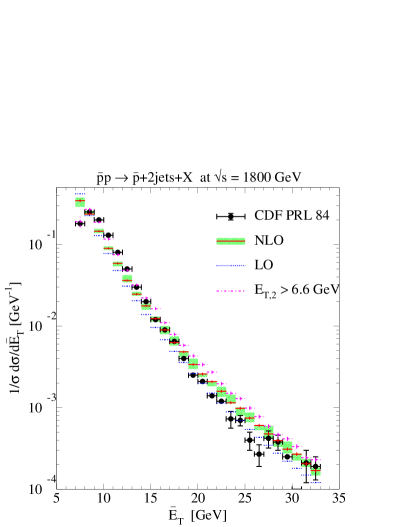
The equivalent comparison for the SD dijet -distribution is shown in Fig. 1 (right) for GeV (full) and GeV (dot-dashed). Here we have chosen only the ’H1 2006 fit B’ as DPDF. The comparison of data versus theory in Fig. 1 (right) shows the same pattern as for the ND distributions in Fig. 1 (left). In general the agreement with the data is even somewhat better now, in particular for the GeV cut. As for the ND distribution, we present also the LO prediction (dotted). From the unnormalized distributions (not shown), we obtain ratios of NLO to the LO cross sections (-factors), which increase from relatively small values of 0.5 (0.6) in the infrared-sensitive region close to the cuts to unity at larger for the ND (SD) cross sections, indicating good perturbative stability and no sensitivity to the cut on there.
The ND -distribution , where , is plotted in Fig. 2 (left), again for the two
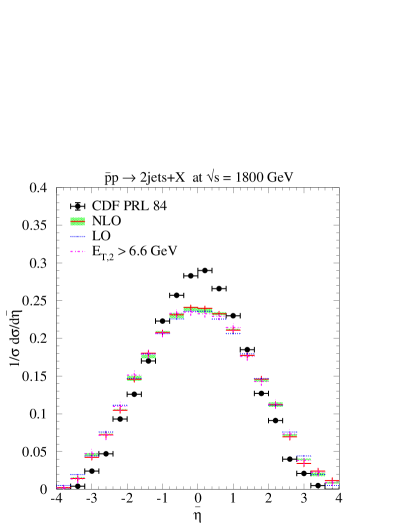
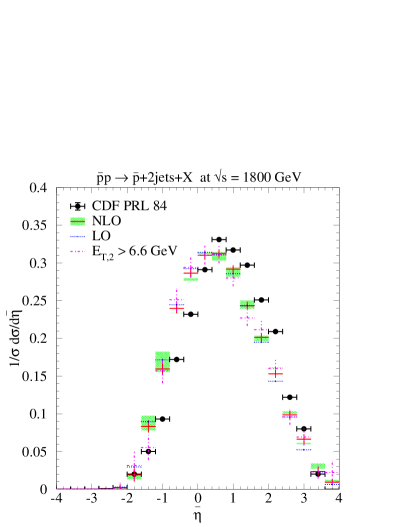
cuts, and the SD -distribution in Fig. 2 (right). For ND and SD, the two choices for the have little influence on the result. The cross sections are somewhat smaller (by about 20%) at the maximum as compared to the ND experimental data, again given without experimental errors, but are in agreement with the SD data. The theoretical diffractive -distribution is boosted towards positive , as is the experimental one. We conclude from these comparisons that there is satisfactory agreement between the measured and distributions and our theoretical predictions based on the ’H1 2006 fit B’ DPDF. This motivates us to move on to the calculation of the ratio of SD to ND cross sections. Actually, if the experimental cross sections above had been known to us in the unnormalized form, we would have been in the position to deduce suppression factors as a function of and .
The ratio of the SD to ND cross sections is evaluated as a function of , the fraction of the momentum of the antiproton transferred to the struck parton. It is calculated from the and of the jets with the relation in Eq. (3), where the sum over is taken over the two leading jets plus the next highest jet with GeV. The cross section in the numerator is integrated over in the range and over in the range GeV2 and over the of the highest and second highest with GeV for both the SD and ND jet sample. As already mentioned, the data samples have the constraint GeV. We have checked that the choice GeV for the ND and SD cross sections has negligible influence on .
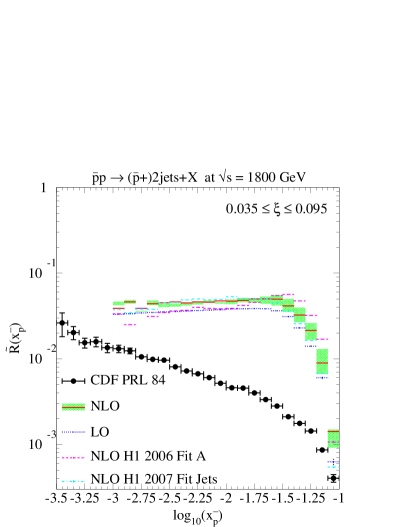
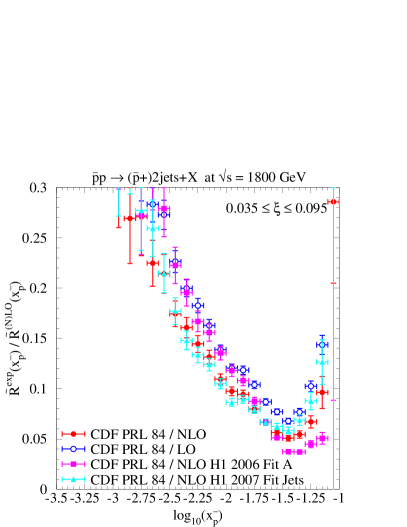
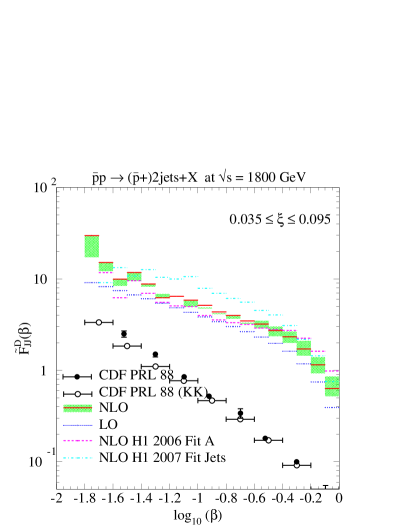
The results are plotted in Fig. 3 (left) as a function of for three choices of the DPDFs, ’H1 2006 fit B’ (full), ’H1 2006 fit A’ (dashed) and ’H1 2007 fit jets’ (dot-dashed). All three are calculated in NLO. The NLO scale uncertainty for ’H1 2006 fit B’ (shaded band) cancels out to a large extent in this ratio of cross sections. The LO prediction for ’H1 2006 fit B’ is also given (dotted). The CDF data, which are plotted in Ref. 6 in six bins of width , have been integrated to give in the range . They were available in numerical form with statistical errors 22 and are also plotted in Fig. 3 (left). From these presentations it is obvious that the theoretical ratios are, depending on , by up to an order of magnitude larger than the measured in agreement with the result in 6 . There are quite some differences for the different DPDF choices. In general ’fit B’ and ’fit jets’ lie closely together, whereas ’fit A’ deviates more or less from these two depending on the range. For ’fit B’ we also show the scale error and the LO prediction. The hierarchy between the three DPDFs at large is easily explained by the fact that the corresponding gluon DPDFs are at large the largest for ’fit A’ and the smallest for ’fit jets’ 4 ; 20 . The same pattern between the different DPDFs is seen even more clearly if we plot the ratio of the experimental and the theoretical as a function of . The result for this (double) ratio is seen in Fig. 3 (right). As can be seen, this ratio varies in a rather similar way for the three DPDFs in NLO and for ’fit B’ in LO in the range . The variation is strongest for the ’fit A’ DPDF, where this ratio varies by more than a factor of seven. For the other two DPDFs this variation is somewhat less, but still appreciable. Actually, we would expect that the ratio plotted in Fig. 3 (right), which gives us the suppression factor, should vary only moderately with . After presenting the GeV and the more recent GeV data below, we shall discuss possible interpretations of this result. We also observe that the suppression factor for ’fit B’ in NLO and LO are different, in particular for the very small .
In Ref. 6 , the ratio was multiplied with an effective PDF governing the ND cross section to obtain the effective DPDF as a function of . This effective non-diffractive PDF is calculated from the formula in Eq. (2), where the gluon PDF and the quark PDFs are taken from the GRV98 LO parton density set 23 and evaluated at the scale GeV2, corresponding to the average of the SD and ND jet cross sections. Then, the effective diffractive PDF of the antiproton is obtained from the equation
| (4) |
We use this relation for the experimental and theoretical values of . However, both are integrated over and are not given as function of . We consider them as only moderately -dependent and evaluate and at an average value of . This works quite well over the -range of interest, if we compare the values obtained in this way with the in the CDF publication 6 , as is seen in Fig. 4
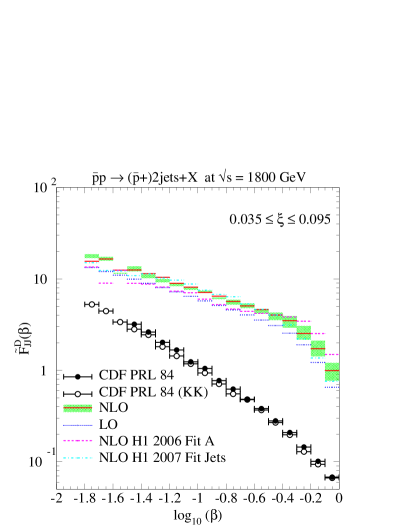
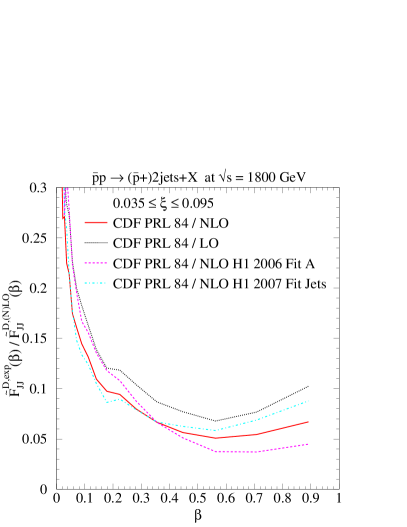
(left), where the full published points from 6 , denoted CDF PRL 84, coincide rather well with the open points deduced from the above equation and the published values of , denoted CDF PRL 84 (KK). The ratio , plotted in Fig. 4 (right) as a function of linearly, gives the suppression factor as a function of instead of as in Fig. 3. For example, for the ’fit B’ DPDF it varies between 0.3 at and 0.13 at to 0.07 at . In the range the suppression factor varies only moderately with , but increases strongly for , independently of the chosen DPDF. Above , ’fit B’ and ’fit jets’ show the most constant behavior. Here one should note that the result in Fig. 4 (right) is independent of the assumptions inherent in Eq. (4), since cancels in the ratio. The information in this figure concerning the suppression factor is equivalent to Fig. 4 of the CDF publication 6 . The main difference to the CDF plot is the fact that now the suppression factor is given by comparing to calculated NLO cross sections without using the approximate formula Eq. (4) above, which can be justified only in LO.
To obtain an idea how large the effect of our NLO dijet evaluation compared to a simple combination of LO parton densities in the Pomeron is, we have calculated the ratio for the three DPDFs. Here the numerator is the from Eq. (4) with evaluated in NLO, i.e. Fig. 4 (left), and the denominator is calculated from the formula
| (5) |
where the Pomeron flux factor and the gluon and quark PDFs in the Pomeron and are taken from the fits ’H1 fit A’, ’H1 fit B’ and ’H1 fit jets’ at the scale GeV2, respectively. At , we obtain ratios of 0.95, 1.05 and 1.1 for these three fits, respectively, indicating that our more accurate NLO calculations lead to very similar suppression factors as the simple approximation in Eq. (5) for all three DPDFs. This ratio is more or less constant as a function of in the considered range, meaning that already in the CDF publication 6 one has the strong variation of the suppression factor with as mentioned above. It is interesting to note that replacing the approximate Eq. (5) with the experimentally used Eq. (4) compensates the effect of the NLO corrections, as the ratio of SD to ND -factors, or equivalently the ratio of the NLO over the LO value of , is approximately for the GeV calculation discussed here and for the GeV calculation presented in the next subsection. To compute the effect of this approximation alone, i.e. the ratio of Eq. (4) at LO over Eq. (5), one must divide the values of 0.95, 1.05 and 1.1 by the ratio of -factors, i.e. 1.35.
III.2 Comparison with 630 GeV and new 1800 GeV data
In a second publication, the CDF collaboration presented data for diffractive and non-diffractive jet production at GeV and compared them with a new measurement at GeV 16 . From both measurements they deduced diffractive structure functions using the formula Eq. (4) with the expectation that is larger at GeV than at GeV. The experimental cuts are similar to the cuts in the first analysis 6 with the exception that now GeV2 and in addition to the GeV cut they require GeV. This second cut on is very important for the comparison with the NLO predictions, since with this additional constraint the infrared sensitivity is not present anymore.
With these cuts and the integration over in the range , we have calculated the normalized cross sections and as in the previous subsection, but now for GeV. For ND (left) and SD (right) jet production, the results are shown in Fig. 5 and compared to the data from Ref.
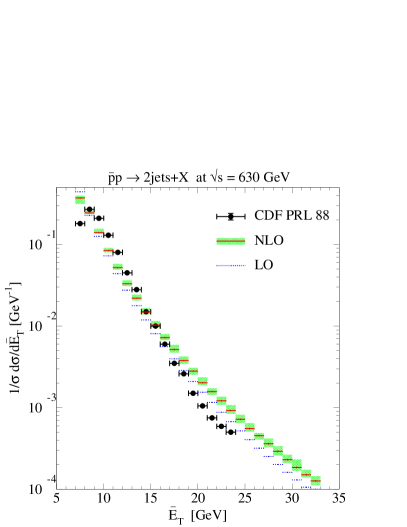
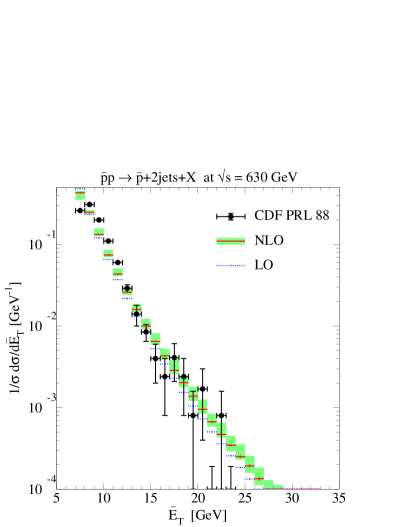
16 . Here, the ND data sample was larger by about two orders of magnitude compared to the SD data sample, so that the statistical errors, which were not given in Ref. 16 , should be smaller by about a factor of ten 20a . Again, no information about systematic errors was available. We find reasonably good agreement in the medium- range. In these figures, we have also plotted the LO predictions (dotted). For the DPDF, we have chosen as before the ’H1 2006 fit B’ set. Due to the large experimental errors for GeV for the SD case, we also find good agreement in the large- range.
The equivalent result and comparison with the data for the -distribution is shown in Fig. 6, again for ND (left)
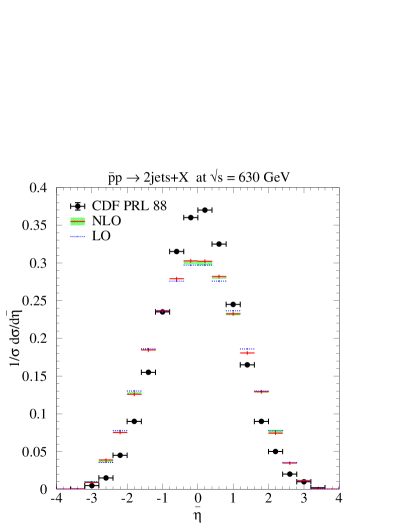
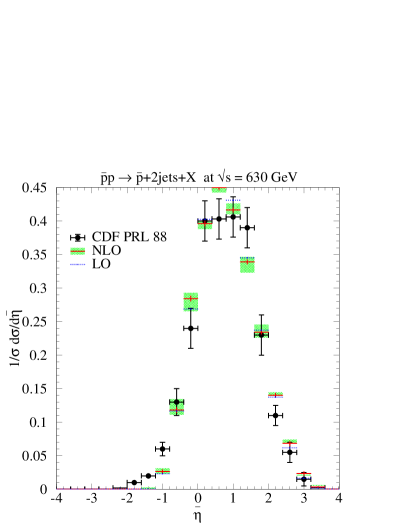
and SD (right) jet production for NLO (full) and LO (dotted) predictions. The agreement between the theoretical results and the CDF data is similar as in the previous subsection, where we compared to the GeV data. This justifies to go on with the calculation of the ratio of SD to ND cross sections.
The momentum fraction is calculated as before from Eq. (3), and then the cross sections can be calculated with the same restrictions on the number of included jets as before. The only difference is the different cut on . The results for at GeV are presented in Fig. 7
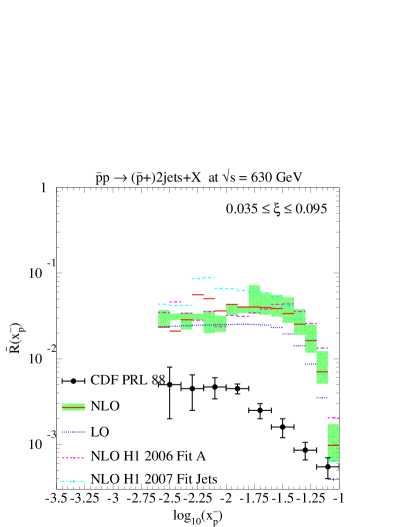
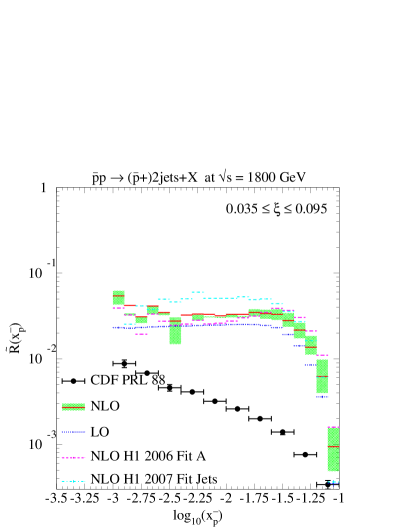
(left) for the three choices of DPDFs, ’fit B’ (NLO and LO), ’fit A’ (NLO) and ’fit jets’ (NLO). In this figure, also the experimental data from Ref. 16 are included. The range of is now much smaller than for the GeV case. It ranges from to . From this plot, the suppression of the SD cross section is clearly visible. The suppression factor is of the same order of magnitude as in the previous subsection. The same plot for the new GeV data 16 together with the predictions is given in Fig. 7 (right).
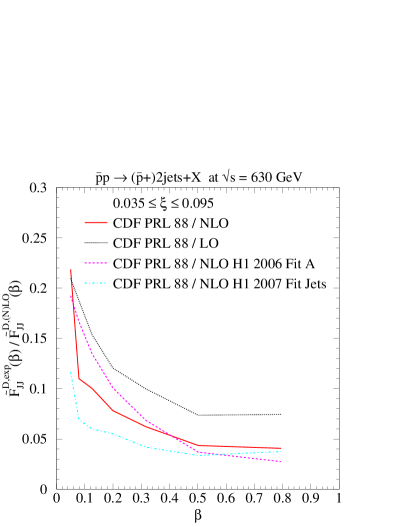
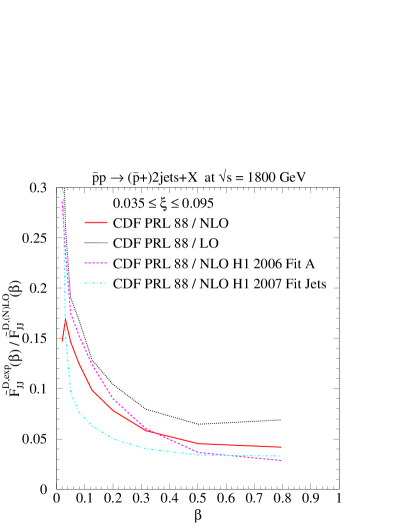
From the two plots in Fig. 7 we have calculated the corresponding suppression factors , exhibited in Fig. 8 (left: GeV; right:
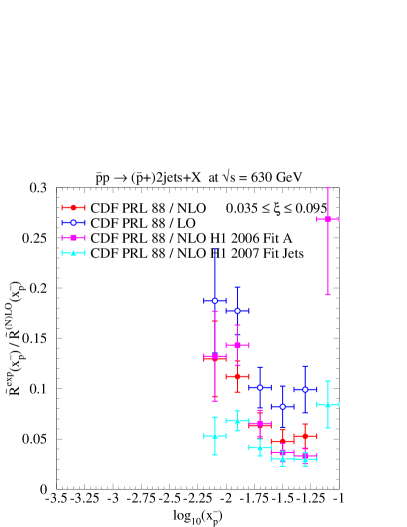

GeV). In both figures we observe that the LO and NLO results for the suppression factors differ significantly (LO only given for ’fit B’), but also the three different DPDFs give different suppression factors, although with smaller variation compared to the LO and NLO result. Due to the variation of this factor with it is difficult to compare the suppression of the GeV result (left) with the GeV result (right) in Fig. 8. On average, it seems that for larger the two suppression factors are more or less equal and we cannot say that the suppression factor for GeV is larger than for GeV, as we would expect it. In the region , the suppression factors for both are fairly constant (), in particular for the DPDF ’fit jets’. This is not the case for the analysis in the previous subsection, where, as we see in Fig. 4, the suppression factor varies already much more in this particular range.
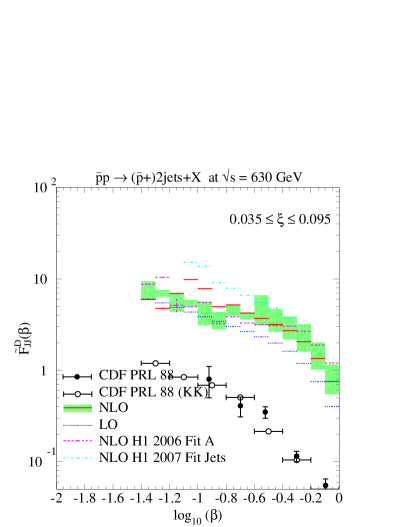
From the results in Fig. 7, we have calculated by changing variables from to with and and multiplying with the effective PDF for ND jet production as in Eq. (4). The results, together with the corresponding experimental data from Ref. 16 and those calculated with the chosen , which agree inside errors except for two points at small , are shown in Fig. 9 (left: GeV, right: GeV).
From these results we have again calculated, as in the previous subsection, the suppression factor as a function of in the range . The plots for the ratios are seen in Fig. 10 for the lower (left) and
the higher center-of-mass energy data (right), again for the three DPDF fits in NLO and ’fit B’ also in LO. First we observe that the ratios in Fig. 10 differ very little, except perhaps at very small . This means that from these data there is no essential difference seen in the suppression at GeV and GeV. Second, we notice that with the ’fit jets’ we have the most constant behavior of the suppression for . Furthermore, comparing Fig. 10 (right) with Fig. 4 (right) we see some differences. While the general pattern is the same, the suppression factor for ’fit jets’ in particular is less constant and larger in Fig. 4 (right) than in Fig. 10 (right), which is obviously correlated with the more restrictive cuts on and in the latter.
For completeness we also compared our NLO dijet calculation to the approximate LO formula in Eq. (5). For GeV and , we obtain the same values of 0.95, 1.05, and 1.1 for ’H1 2006 fit A’, ’H1 2006 fit B’, and ’H1 2007 fit jets’ as for the older CDF analysis. They depend again weakly on . For GeV and we obtain larger values of 1.15, 1.35, and 1.45, which is in line with the larger ratio of -factors (1.6 instead of 1.35) for SD and ND events at this lower center-of-mass energy.
As stated above, the calculation of the effective diffractive structure function from the ratio was based on the assumption that the latter was only weakly -dependent, so that Eq. (4) could be evaluated at an average value of . This weak -dependence is indeed observed in the newer CDF data, published in the lower part of Fig. 4 of Ref. 16 and reproduced in our Fig. 11 (full circles). These data agree well with
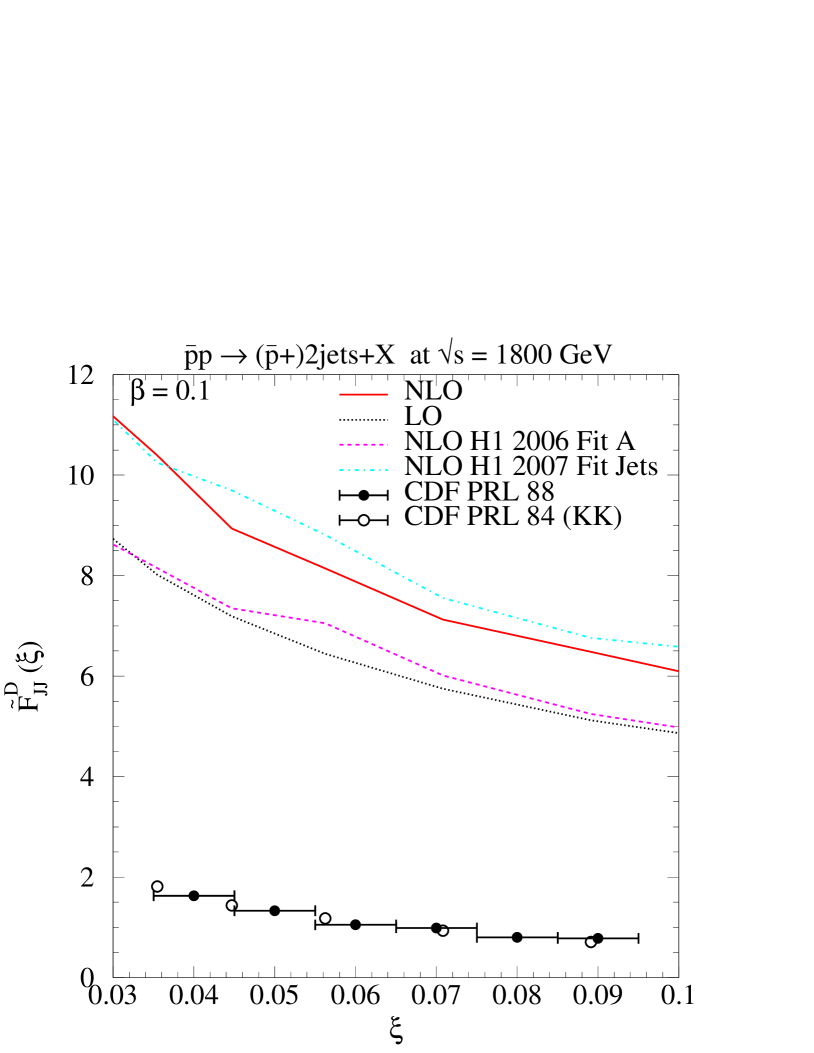
the -dependent values of published in Fig. 3 of Ref. 6 when transformed into using Eq. (4) and with (open circles). The same weak -dependence is also observed in our theoretical calculations when using the same procedure, except with different normalization, reflecting the -dependence of the H1 fits to the Pomeron flux factors with (0.9 in the CDF fit to their data). At the considered value of , the NLO suppression factors for ’fit A,B’ and ’fit jets’ are 0.15, 0.12 and 0.11, respectively, and are almost independent of . At LO, the suppression factor for ’fit B’ is larger, i.e. 0.15, which corresponds to the fact that the ratio of SD over ND -factors is 1.35. Note that Fig. 11 is based on the higher statistics CDF data without the stronger cuts on and and should therefore be not compared to Fig. 10 (right), but to Fig. 4 (right), where consistency of these numbers with the values shown at can be found.
The (small) difference of the theoretical (1.1) and experimental (0.9) values of can be explained by a subleading Reggeon contribution, which has not been included in our predictions. To study its importance, we have computed the ratio of the Reggeon over the Pomeron contribution to the LO single-diffractive cross section at GeV as a function of , , and . The Reggeon flux factor was obtained from ’H1 2006 fit B’ and convolved, as it was done in this fit, with the parton densities in the pion of Owens 24 . Very similar results were obtained for the ’H1 2007 fit jets’ Reggeon flux. On average, the Reggeon adds a 5% contribution to the single-diffractive cross section, which is almost independent of , but is smaller in the proton direction at large and small and (2.5%) than at large and (8%). This corresponds to the graphs shown in Figs. 5 () and 6 () of the H1 publication 4 , e.g. at GeV2. While the Reggeon contribution thus increases the diffractive cross section and reduces the suppression factor at large in Figs. 3, 8, and 9, making the latter more constant, the same is less true at small values of .
III.3 Interpretation of the observed suppression factor
Our main results are the plots for the suppression factors as a function of in Fig. 3 (right) deduced from the data of Ref. 6 and in Fig. 8 from the data of 16 at GeV (left) and GeV (right). The qualitative behavior of the suppression factor in these three figures is very similar. We observe an appreciable dependence of the suppression factor on the chosen DPDFs and a dependence on with a minimum at ( and a rise towards smaller by up to a factor of five. The equivalent result as a function of is shown in Fig. 4 (right) for the data of Ref. 6 and in Fig. 10 (left) for the GeV data of Ref. 16 and in Fig. 10 (right) for the GeV data of Ref. 16 . Depending on the chosen DPDFs, the suppression factor as a function of is minimal with the value at and rises with decreasing to a value in Fig. 4 (right) and Fig. 10 (right) and to a value in Fig. 10 (left) at (considering ’fit B’ as an example). Of course, this rise of the suppression factor towards small is directly related to its rise as a function of towards small .
A comparison of the H1 data 4 , which are used to obtain the DPDFs applied in our calculation, with a similar measurement, in which the leading proton is directly detected H1LP , yields a ratio of cross sections for GeV and of 4 . Since the CDF measurements are performed by triggering on the leading antiproton, these measurements must be multiplied by this ratio to normalize them to the GeV constraint for the H1 DPDFs. Therefore, all suppression factors obtained so far must be multiplied by this ratio.
Any model calculation of the suppression factor, which is also sometimes called the rapidity gap survival factor, must try to explain two points, first the amount of suppression, which is at , and second its dependence on the variable (or ). Such a calculation has been performed by Kaidalov et al. K . In this calculation, which we call KKMR, the hard scattering cross section for the diffractive production of dijets was supplemented by screening or absorptive corrections on the basis of eikonal corrections in impact parameter () space. The parameters of the eikonal were obtained from a two-channel description of high-energy inelastic diffraction. The exponentiation of the eikonal stands for the exchange of multi-Pomeron contributions, which violate Regge and QCD factorization and modify the predictions based on single Pomeron and/or Regge exchange. The obtained suppression factor is not universal, but depends on the details of the hard subprocess as well as on the kinematic configurations. The first important observation in the KKMR analysis is that in the Tevatron dijet analysis the mass squared of the produced dijet system as well as are almost constant, so that small implies large . The second important ingredient in the KKMR model is the assumption that the absorption cross section of the valence and the sea components, where the latter includes the gluon, of the incoming proton are different, in particular, that the valence and sea components correspond to smaller and larger absorption. For large or small , the valence quark contribution dominates, which produces smaller absorptive cross sections as compared to the sea quark and gluon contributions, which dominate at small . Hence the survival probability (or suppression factor) increases as increases and decreases. In Ref. K , the convolution of the old H1 DPDFs H1 and the -dependent absorption corrections produced a -distribution corrected for the soft rescattering, which was in very good agreement with the corresponding experimental distribution in the CDF publication 6 (see Fig. 4 in K ). We have no doubt that using our single-diffractive NLO cross sections based on the more recent DPDFs of H1 4 will lead to a very similar result.
An alternative model for the calculation of the suppression factor was developed by Gotsman et al. G . However, these authors did not convolve their suppression mechanism with the hard scattering cross section. Therefore a direct comparison to the CDF data is not possible.
At variance with the above discussion of diffractive dijet production in hadron-hadron scattering, the survival probability in diffractive dijet photoproduction was found to be larger ( for global suppression, for resolved photon suppression only) and fairly independent of (or ) 12 ; 15 . This can be explained by the fact that the HERA analyses are restricted to large values of (as opposed to small and intermediate values of … ), where direct photons or their fluctuations into perturbative or vector meson-like valence quarks dominate. The larger suppression factor in photoproduction corresponds also to the smaller center-of-mass energy available at HERA.
IV Conclusions
In conclusion, we have performed the first next-to-leading order calculation of single-diffractive and non-diffractive cross sections for dijet production in proton-antiproton collisions at the Tevatron, using recently obtained parton densities in the (anti-)proton from global fits and in the Pomeron from inclusive deep-inelastic scattering and DIS dijet production at HERA. The normalized distributions in the average transverse energy and rapidity of the two jets agreed well with those measured by the CDF collaboration at two different center-of-mass energies of and 630 GeV. However, the ratios of single-diffractive and non-diffractive cross sections had two be multiplied by factors of about 0.05 and up to 0.3, depending on the momentum fraction of the parton in the antiproton, the center-of-mass energy, the order of the calculation, and the DPDF. Assuming Regge factorization, the ratios of cross sections were interpreted as ratios of effective diffractive structure functions, exhibiting similar suppression factors.
We found that the ratios of SD over ND -factors of 1.35 and 1.6 at and 630 GeV, respectively, were partially compensated by the simplification inherent in the definition of the effective structure functions, but that the suppression factors were still smaller at NLO than at LO. They were also less dependent on the momentum fraction of the parton in the Pomeron at NLO than at LO, in particular at the lower center-of-mass energy and to a smaller extent also for the more restricted kinematics at the higher . The DPDF fit by the H1 collaboration using DIS dijet data to better constrain the gluon density in the Pomeron showed the most constant behavior.
We pointed out that all suppression factors obtained so far must be corrected by a factor of due to the fact that the DPDFs were obtained from H1 data that includes diffractive dissociation, while the CDF data were triggered on a leading antiproton. We also recalled that the remaining momentum-fraction dependence can be explained by a two-channel eikonal model that predicts different behaviors for the regions dominated by valence quarks and sea quarks and gluons in the proton. This is in contrast to the constant behavior observed in photoproduction, which is governed by direct photon or valence-like quark contributions. We finally confirmed that the single-diffractive data are dominated by a single Pomeron exchange, since its momentum fraction dependence in the antiproton is well described in shape by the Pomeron flux factors fitted to the H1 DIS data. An additional Reggeon exchange would add only two to eight percent to the single-diffractive cross section for smaller and larger values of the Reggeon momentum fraction.
Acknowledgements.
We thank K. Hatakeyama for useful discussions concerning the CDF data analyses. This work has been supported by the Theory-LHC-France initiative of the CNRS/IN2P3.References
- (1) P.D.B. Collins, An Introduction to Regge Theory and High-Energy Physics, Cambridge University Press, Cambridge (1977).
- (2) V.N. Gribov and L.N. Lipatov, Sov. J. Nucl. Phys. 5, 438 (1972) and Sov. J. Nucl. Phys. 20, 94 (1975); G. Altarelli and G. Parisi, Nucl. Phys. B 126, 298 (1977); Y.L. Dokshitzer, Sov. Phys. JETP 46, 641 (1977).
- (3) ZEUS Collaboration, S. Chekanov et al., Eur. Phys. J. C 38, 43 (2004).
- (4) H1 Collaboration, A. Aktas et al., Eur. Phys. J. C 48, 715 (2006).
- (5) J.C. Collins, Phys. Rev. D 57, 3051 (1998) [Erratum ibid. 61, 019902 (2000)]; J. Phys. G 28, 1069 (2002).
- (6) CDF Collaboration, T. Affolder et al., Phys. Rev. Lett. 84, 5043 (2000).
- (7) H1 Collaboration, paper 980, submitted to the 31st Int. Conf. on High-Energy Physics (ICHEP02), Amsterdam (2002).
- (8) M. Klasen and G. Kramer, in Proc. of the 12th Int. Workshop on Deep Inelastic Scattering (DIS04), eds. D. Bruncko, I. Ferencei and P. Strizenec, Kosize, Inst. Exp. Phys., SAS, p. 492 (2004), hep-ph/0401202.
- (9) M. Klasen and G. Kramer, Eur. Phys. J. C 38, 93 (2004).
- (10) H1 Collaboration, paper 987, submitted to the 31st Int. Conf. on High-Energy Physics (ICHEP02), Amsterdam (2002); paper 087, submitted to the Int. Europhysics Conf. on High-Energy Physics (EPS03), Aachen (2003); F.P. Schilling, Eur. Phys. J. C 33, S530 (2004).
- (11) ZEUS Collaboration, abstract 6-0249, contributed to the 32nd Int. Conf. on High-Energy Physics (ICHEP04), Beijing (2004).
- (12) H1 Collaboration, A. Aktas et al., Eur. Phys. J. C 51, 549 (2007).
- (13) ZEUS Collaboration, S. Chekanov et al., Eur. Phys. J. C 55, 177 (2008).
- (14) H1 Collaboration, K. Cerny et al. in Proc. of the 16th Int. Workshop on Deep-Inelastic Scattering (DIS08), London (2008), http://dx.doi.org/10.3360/dis.2008.69.
- (15) M. Klasen and G. Kramer, Mod. Phys. Lett. A 23, 1885 (2008); Proc. of the Workshop on HERA and the LHC, eds. H. Jung et al., DESY-PROC-2009-02, Mar 2009, arxiv:0903.3861; arXiv:0808.3700; LPSC 08-115 (to be published); G. Kramer, Nucl. Phys. B (Proc. Suppl.) 191, 231 (2009).
- (16) CDF Collaboration, D. Acosta et al., Phys. Rev. Lett. 88, 151802 (2002).
- (17) M. Klasen, T. Kleinwort and G. Kramer, Eur. Phys. J. direct C 1, 1(1998) and the earlier papers quoted there; for a review see M. Klasen, Rev. Mod. Phys. 74, 1221 (2002).
- (18) CTEQ Collaboration, P.M. Nadolsky et al., Phys. Rev. D 78, 013004 (2008).
- (19) CTEQ Collaboration, I. Pumplin et al., JHEP 07, 021 (2002).
- (20) H1 Collaboration, A. Aktas et al., JHEP 10, 042 (2007).
- (21) K. Hatakeyama, private communication.
- (22) M. Klasen and G. Kramer, Phys. Lett. B 366, 385 (1996); S. Frixione and G. Ridolfi, Nucl. Phys. B 507, 315 (1997).
- (23) See http:/physics.rockefeller.edu/hatake/phys/sdjj1800prl.html.
- (24) M. Glück, E. Reya and A. Vogt, Eur. Phys. J. C 5, 461 (1998).
- (25) J. Owens, Phys. Rev. D 30, 943 (1984).
- (26) H1 Collaboration, A. Aktas et al., Eur. Phys. J. C 48, 749 (2006).
- (27) A.B. Kaidalov, V.A. Khoze, A.D. Martin and M.G. Ryskin, Eur. Phys. J. C 21, 521 (2001).
- (28) H1 Collaboration, T. Ahmed et al., Phys. Lett. B 348, 681 (1995); H1 Collaboration, C. Adloff et al., Z. Phys. C 76, 613 (1997).
- (29) G. Gotsman, E. Levin, U. Maor, E. Naftali and A. Prygarin, Proc. of the Workshop on HERA and the LHC, part A, p. 221 (2005).