Preparation of electron-doped La2-xCexCuO4±δ thin films with various Ce doping by dc magnetron sputtering
Abstract
A series of -axis oriented electron-doped high-Tc superconducting La2-xCexCuO4 thin films, from heavily underdoped =0.06 to heavily overdoped =0.19, have been synthesized by dc magnetron sputtering technique on SrTiO3 substrates. The influence of various fabrication conditions, such as the deposition temperature and the deposition rate, etc., on the quality of the thin films has been scrutinized. We find that the quality of the films is less sensitive to the deposition temperature in the overdoped region than that in the underdoped region. In the phase diagram of T, the superconducting dome indicates that the optimally doping level is at the point with the transition temperature T K. Further more, both the disappearance of the upturn in the (T) curve at low temperature under H=10 T and the positive differential Hall coefficient, , are observed around , implying a possible rearrangement of Fermi surface at this doping level.
pacs:
74.78.Bz, 74.25.Fy, 74.72.-h, p74.25.DwI 1. Introduction
Electron-doped cuprate superconductors have attracted more and more attention since its discovery Tokura . This type of cuprates may have a great impact on our understanding of the mechanism of high temperature superconductivity, not only because of the common properties shared with the hole-doped cuprates, but also due to its unique features. The common points are that (i) the parent compounds are perovskite Mott insulators; (ii) the CuO2 plane is the key element responsible for the superconductivity Orenstein ; (iii) two types of carriers coexist Leboeuf ; Greene ; kuiJ1 . The above items imply the electron-hole symmetry in the cuprate superconductors. However, the unique properties of the electron-doped cuprates are as following: (i) broad antiferromagnetic phase doping range, which can extend to or even coexist with the superconducting (SC) phase in some sense, (ii) narrow SC dome Devereaux , (iii) Fermi liquid behavior with a quadratic rather than linear temperature dependence of the resistivity Zhao ; WH , (iv) the order parameter symmetry, which does not come to a general consensus on electron-doped cuprates, while it has been accepted as d-wave type on the hole-doped ones Tsuei ; Sato ; Armitage1 , (v) low SC transition temperature Tc and low upper critical field Hc2, which give us the opportunity to suppress the superconductivity even at extremely low temperature by the magnetic field and explore the normal state properties, e.g., the quantum phase transition and the anomalous upturn of the low-temperature resistance Li ; Dagan1 .
Ln2-xCexCuO4 (Ln=Nd, Pr, Sm, and Eu) family with the so-called T’-phase structure is the extensively explored material in the electron-doped cuprates. Among them, La2-xCexCuO4 (LCCO), with the largest Ln3+ ion radius Naito1 ; Cooper ; Arima , has the highest transition temperature up to about 30 K. However, due to the difficulty to get rid of the excess oxygen to achieve the superconduting T’ phase phase , LCCO was first synthesized by Yamada Yamada in 1994 by a rather complicated precursor technique. Recently, Naito et al. synthesized superconducting T’-LCCO films by molecular beam epitaxy (MBE) Naito2 . Sawa et al. got various doped LCCO thin films on SrTiO3 substrate using BaTiO3 as a buffer layer by the pulsed laser deposition (PLD) method Sawa . Zhao et al. also successfully grew the optimal doped LCCO thin film on SrTiO3 by dc magnetron sputtering Zhao . In this paper, we systematically study the fabrication conditions for the c-axis oriented LCCO thin films on SrTiO3 substrates by dc magnetron sputtering method, including the deposition temperature and the deposition rate for various Ce doping levels, ranging from heavily underdoped to heavily overdoped, i.e. . Besides that, the optimal deposition conditions are discussed in detail. The SC dome in the phase diagram T is obtained and the optimal doping level is at =0.105 with the highest transition temperature Tc0=26.5 K. By investigating the evolution of the resistivity and the differential Hall coefficient R with the doping level , we find that the rearrangement of the Fermi surface (FS) at the doping level =0.15.
II 2. Experiments
We prepared a series of -axis thin film La2-xCexCuO4±δ (LCCO) with different Ce doping concentration ranging from 0.06 to 0.19 on the (100) oriented SrTiO3 by dc magnetron sputtering method. The targets were synthesized by conventional solid-state reaction Zhao . To obtain the high quality LCCO thin films, we carefully adjusted the sputtering pressure, the deposition temperature, the gas ratio of Ar to O2, the deposition rate and the annealing process for each doping. The background pressure of the chamber prior to deposition was less than Pa. The total pressure during the deposition was Pa with O2:Ar=1:4. The deposition temperature TD for the LCCO thin film is in the range of C, depending on the Ce doping level. More specific studies focusing on the optimal deposition temperature at different doping levels are investigated in part 3. All the films used in the present work are typically about 100 nm in thickness, and they were patterned into the standard micro-bridge with 1 mm long and 500 m wide by photolithography and ion milling techniques. All the transport measurements were carried out by the Quantum Design PPMS-14 equipment.
III 3. Results and discussions
Fig. 1 shows the X-ray diffraction (XRD) data of the LCCO thin films with . All the samples are synthesized at their optimal deposition temperatures for the highest Tc, respectively. As shown in Fig. 1, all the LCCO thin films are in -axis orientation with peaks signed. The results agree with those obtained by other methods, such as MBE and PLD Naito2 ; Sawa . In detail, the remain of the T-phase in the LCCO samples can be disclosed by the tiny humps near the sharp peak of T’-(004) and (006) in the heavily underdoped samples at x=0.06. The inset of Fig. 1 presents the dependence of the -axis lattice parameter on the doping level . decreases monotonically from 12.48 Å to 12.39 Å with increasing. This can be attributed to the fact that the atom radius of Ce is smaller than that of La.
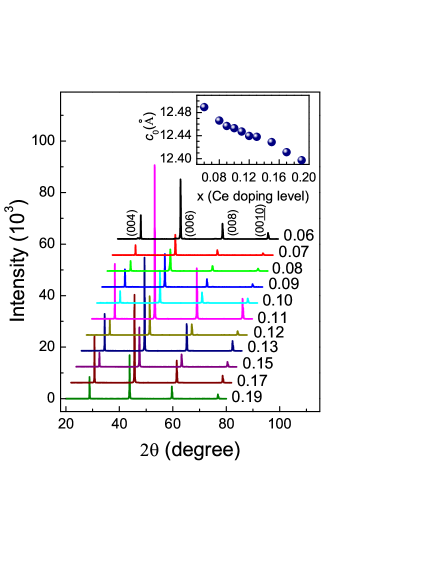
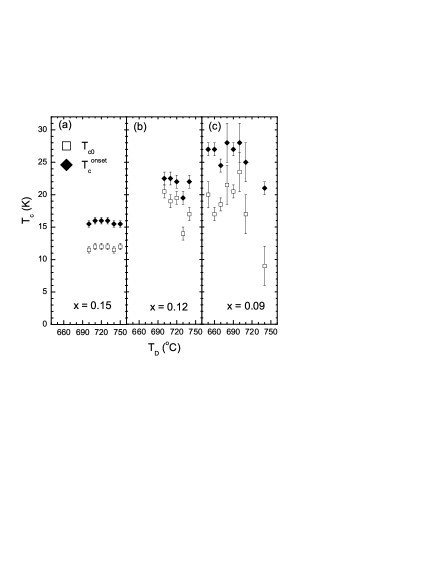
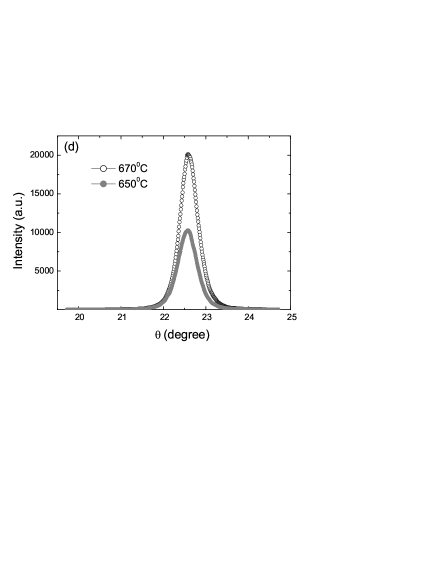
Fig. 2(a)-(c) shows both the onset and the zero resistance superconducting transition temperature, T and Tc0, for the LCCO films deposited at various temperatures with three different doping levels, i.e. =0.15, 0.12 and 0.09, respectively. The error bar is determined by the variance of the reproducibility, and the uncertainty of the Tc due to the slight upturn of the (T) curve is also included as concerning the error bar at underdoped region. For the case of =0.15, both Tc0 and T of the films deposited around C have the maximum values, i.e. 12 K and 16 K, respectively. When TC, 740∘C and 750∘C, both Tc and T decrease within K. Since this variance is rather small, the optimal TD for =0.15 is in a quite wide temperature region C with good reproducibility. For , the best deposition temperature is between 700∘C and 720∘C, where Tc shows small variation within K. While, if the film deposited at higher temperature, Tc decreases obviously. The films with =0.09 are fabricated at TC, and the transition temperature Tc shows stronger dependence on the deposition temperature TD with bad reproducibility as seen in Fig. 2(c). The films have both the highest Tc and the sharpest transition width when deposited around the optimal TC. The structure information shown in Fig. 2(d) gives the rocking curve of the (006) peak for the films of =0.08 deposited at 650∘C and 670∘C, respectively. The full-widths at the half maximum (FWHM) of (006) peak are about 0.42 for the sample deposited at 650∘C and 0.37 at 670∘C, which indicate that the quality of the film deposited at 670∘C is better than the one deposited at 650∘C.
Both the transport and structure data show that the quality of the underdoped films is affected strongly by the deposition temperature TD. And the high quality films can only be achieved in a small deposition temperature region. The quality of the underdoped samples is much more sensitive to TD than that of the overdoped ones, and the reproducibility becomes worse for the samples with lower doping. The XRD data in Fig. 1 also show the unexpected T-phase in the heavily underdoped sample, e.g. =0.06, which is hard to eliminate no matter how we adjust the deposition condition, and it agrees with the fact that there are strict restrictions for the deposition in the underdoped region Naito2 ; Sawa .
Moreover, we find that the optimal deposition temperature for the films decreases with the doping level decreasing from the overdoped to the underdoped region as shown in Fig. 2(a)-(c). For the LCCO material, the analysis of the perovskite crystallographic Goldschmidt tolerance factor indicates that the non-superconducting T-phase tends to be built because the SC T’-phase is unstable at relatively high synthesis temperatures phase . Manthiram and Goodenough tolerant predicted that T’-phase can only be stabilized below 425∘C, while partial substitution of La3+ by smaller Ce4+ can reduce and shift the T/T’-phase boundary to a higher temperature about 600∘C for =0.15. However, 600∘C is still too low to prepare the bulk material. This can be the reason for the fact that the optimal deposition temperature tends to be higher with the increase of the Ce doping level .
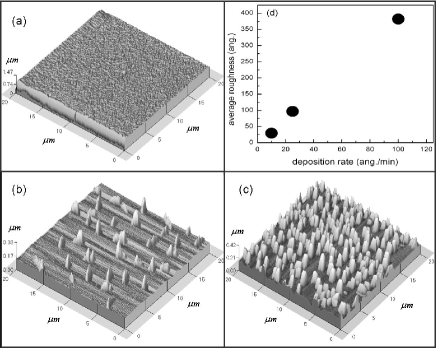
Fig. 3 shows the atomic force microscope (AFM) 3D images of the surface for the LCCO thin films =0.105 synthesized at their optimally deposition temperature TC with different deposition rates. Each scanning region is mm. The deposition rates for the samples in Fig. 3(a)(c) are 10 Å/min, 25 Å/min and 100 Å/min, respectively. We tune the deposition time for each rate to assure all the films with the same thickness of about 100 nm. The deposition time for films in Fig. 3(a) to (c) is chosen as 100 min, 40 min and 10 min, respectively. We can see that the surface of film in Fig. 3(a) is quite smooth with only a few grains scattered in the area. With the increase of the deposition rate, a large quantity of ions will be accelerated and rush to the substrate with a large velocity, which lead to an extended glow plasma during the sputtering. Therefore, most of the arrived ions may not have enough relaxation time to build the desirable epitaxial structure in the film surface, which will result in the imperfect features in the samples as shown in Fig. 3(b) and (c). Furthermore, the surface of film in Fig. 3(c) is covered with many big grains and the film almost grows in island rather than layer-by-layer at this quite large deposition rate 100 Å/min. Fig. 3(d) shows that the roughness of the film increases almost monotonically with the deposition rate. Importantly, the films deposited at about 25 Å/min have the highest Tc, and any deflection of the deposition rate will result in lower Tc. This is helpful for us to fabricate the desirable films with either the smooth surface or the highest Tc with a tolerable roughness.
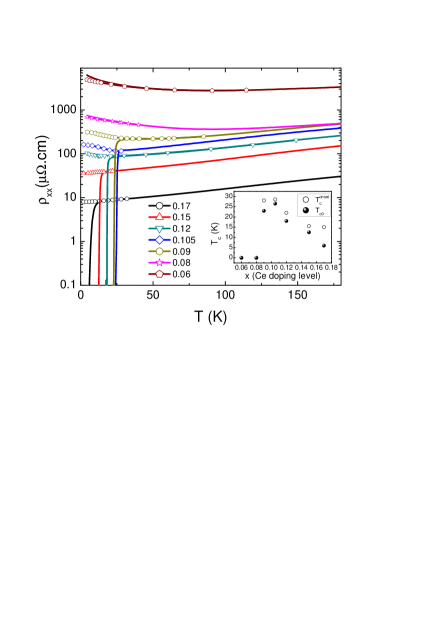
A series of -axis oriented thin films of LCCO with various Ce doping levels, from heavily underdoped to heavily overdoped, were deposited at the same deposition rate of 25 Å/min with 40 minutes, which results in the same thickness of about 100 nm for each film. The resistivity versus the temperature curves for the various doping levels have been measured as seen in Fig. 4. The (T) curves show that the optimal doping level is at =0.105 with the highest transition temperature Tc0=26.5 K and the sharpest transition width T 1.5 K. The phase diagram is shown in the inset of Fig. 4. The results are consistent with those reported by Naito et al. Naito2 . The optimal doping concentration in LCCO is lower than those of Pr2-xCexCuO4 and Nd2-xCexCuO4, where =0.15 for both materials. It is clear that the residual resistivity of the samples decreases with the increase of . The dependence of the normal state resistivity on temperature shows an insulator-metal transition near the optimally doped concentration =0.105. As seen in the phase diagram T in the inset of Fig. 4, there is a sharp drop of Tc when the doping level is biased from the optimal doping level =0.105 to the underdoped regime, and the superconductivity is suppressed at 0.08. While in the overdoped region, it decreases more slowly and the superconductivity disappears at .
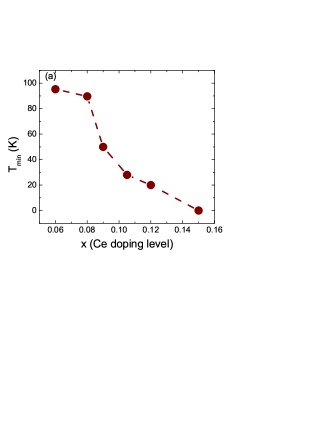
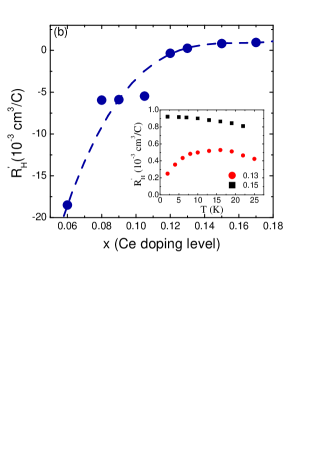
The (T) curves under H=10 T, as shown with the open symbols in Fig. 4, exhibit anomalous upturn at low temperature, which is related to the carrier localization Dagan1 ; WL1 ; Kondo1 ; Kondo2 . When the superconductivity is suppressed by an applied field, e.g. H=10 T, the temperature Tmin, where the sample has the minimum resistivity, decreases with the increase of the doping concentration , and it becomes zero in the overdoped side at =0.15, as seen in Fig. 5(a). Moreover, we have studied the low temperature Hall effect of the LCCO thin films at various doping levels, which could reflect the electronic structure of the material in some sense due to its free from complicated inelastic scattering Kui1 ; Kui2 . In Fig. 5(b), we show the Ce doping dependence of the differential Hall coefficient R at 2 K, obtained from the slope of a linear fit to the Hall data at H=10 T, i.e. . R increases from a strong negative value to a positive value with the increase of , and a minor positive R starts to emerge at 0.13. However, the temperature dependence of R for the films with =0.13 shows a tendency to be negative when the temperature decreasing lower than 16 K, as seen in the inset of Fig. 5(b). This indicates that the coexistence of the hole-like and electron-like Fermi pockets, which may be formed by the intersection of the FS and the antiferromagnetic Brillouin Zone Armitage2 , is still resident in this doping level at low temperature. On the other hand, for =0.15, R is positive in the whole temperature region from 2 K to 300 K, and saturates to a positive value when T decreasing close to zero, which implies the formation of the large hole-like FS at this doping. Therefore, both the Tmin and the R data indicate that the rearrangement of the FS takes place at the doping level =0.15, compatible to the results obtained in Pr2-xCexCuO4 Dagan . We noticed that there were similar results in both the electron-doped cuprates and the hole-doped cuprates. An antiferromagnetic phase starts at =0 and extends to the SC dome in the electron-doped cuprates Luke . A low temperature phase transition from insulator to metal as a function of doping is observed in hole-doped materials Boebinger and the evolution of the FS versus the doping concentration has also been revealed by the ARPES method Armitage2 ; Matsui . More efforts on the FS evolution with doping concentration at extremely low temperature are still necessary for the further understanding of the cuprates superconductors.
IV 4. Conclusion
We have prepared a series of LCCO thin films with various Ce doping levels (=0.060.19). The XRD results indicate that the LCCO thin films are of high quality. The influence of the deposition conditions is discussed in detail. Compared with the overdoped films, the underdoped films are hard to be synthesized due to the crucial restriction on the deposition temperature, which can be attributed to the instability caused by the emergence of the T-phase in the heavily underdoped region. Furthermore, the optimal deposition temperature increases with the increase of doping concentration . We also find that a large deposition rate may lead to a rough surface due to the lack of enough relaxation. The deposition rate at around 25 Å/min can achieve a high-Tc film with acceptable roughness, and either small or large deposition rate will result in a lower-Tc value. The SC dome in the phase diagram indicates the optimal doping at =0.105 with Tc0=26.5 K and a narrow transition width T=1.5 K. Both the longitudinal resistivity and differential Hall coefficient R versus the doping level are discussed, and a possible rearrangement of the FS is revealed at =0.15.
V Acknowledgments
We thank B. Xu, S.L. Jia, W.W. Huang and H. Chen for their help with the measurements. The work is supported by the MOST, NSF, SRF for ROCS, SEM Projects of China.
References
- (1) Y. Tokura, H. Takagi, S. Uchida, Nature 337 (1989) 345.
- (2) J. Orenstein, A.J. Millis, Science 288 (2000) 468.
- (3) D. LeBoeuf, N. Doiron-Leyraud, J. Levallois, R. Daou, J.-B. Bonnemaison, N.E. Hussey, L. Balicas, B.J. Ramshaw, R. Liang, D.A. Bonn, W.N. Hardy, S. Adach, C. Proust, L. Taillefer, Nature 450 (2007) 533.
- (4) W. Jiang, S.N. Mao, X.X. Xi, X. Jiang, J.L. Peng, T. Venkatesan, C.J. Lobb, R.L. Greene, Phys. Rev. Lett. 73 (1994) 1291.
- (5) K. Jin, B.Y. Zhu, J. Yuan, H. Wu, L. Zhao, B.X. Wu, Y. Han, B. Xu, L.X. Cao, X.G. Qiu, B.R. Zhao, Phys. Rev. B 75 (2007) 214501.
- (6) T.P. Devereaux, R. Hack, Rev. Mod. Phys. 79 (2007) 000175.
- (7) L, Zhao, H, Wu, J. Miao, H. Yang, F.C. Zhang, X.G. Qiu, B.R. Zhao, Supercond. Sci. Technol. 17 (2004) 1361.
- (8) H. Wu, L. Zhao, J. Yuan, L.X. Cao, J.P. Zhong, L.J. Gao, B. Xu, P.C. Dai, B.Y. Zhu, X.G. Qiu, B.R. Zhao, Phys. Rev. B 73 (2006) 104512.
- (9) C.C. Tsuei, J.R. Kirtley, Phys. Rev. Lett. 85 (2000) 182.
- (10) T. Sato, T. Kamiyama, T. Takahashi, K. Kurahashi, K. Yamada, Science 291 (2001) 1517.
- (11) N.P. Armitage, D.H. Lu, D.L. Feng, C. Kim, A. Damascelli, K.M. Shen, F. Ronning, Z.-X. Shen, Y. Onose, Y. Taguchi, Y. Tokura, Phys. Rev. Lett. 86 (2001) 1126.
- (12) P.C. Li, F.F. Balakirev, R.L. Greene, Phys. Rev. Lett. 99 (2007) 047003.
- (13) Y. Dagan, M.C. Barr, W.M. Fisher, R. Beck, T. Dhakal, A. Biswas, R.L. Greene, Phys. Rev. Lett. 94 (2005) 057005.
- (14) M. Naito, M. Hepp, Jpn. J. Appl. Phys. 39 (2000) L485.
- (15) S.L. Cooper, G.A. Thomas, A.J. Millis, P.E. Sulewski, J. Orenstein, D.H. Rapkine, S.-W. Cheong, P.L. Trevor, Phys. Rev. B 42 (1990) 10785.
- (16) T. Arima, T. Kikuchi, M. Kasuya, S. Koshihara, Y. Tokura, T. Ido, S. Uchida, Phys. Rev. B 44 (1991) 917.
- (17) A. Manthiram, J.B. Goodenough, J. Solid State Chem. 87 (1990) 402.
- (18) T. Yamada, K. Kinoshita, H. Shibata, Jpn. J. Appl. Phys. 33 (1994) L168.
- (19) M. Naito, S. Karimoto, A. Tsukada, Supercond. Sci. Technol. 15 (2002) 1663.
- (20) A. Sawa, M. Kawasaki, H. Takagi, Y. Tokura, Phys. Rev. B 66 (2002) 014531.
- (21) A. Manthiram, J.B. Goodenough, J. Solid State Chem. 92 (1991) 231.
- (22) P. Fournier, J. Higgins, H. Balci, E. Maiser, C.J. Lobb, R. L. Greene, Phys. Rev. B 62 (2000) R11993.
- (23) T. Sekitani, M. Naito, N. Miura, Phys. Rev. B 67 (2003) 174503.
- (24) J. Bobroff, W.A. MacFarlane, H. Alloul, P. Mendels, N. Blanchard, G. Collin, J.-F. Marucco, Phys. Rev. Lett. 83 (1999) 4381.
- (25) K. Jin, B.Y. Zhu, B.X. Wu, J. Vanacken, V.V. Moshchalkov, B. Xu, L.X. Cao, X.G. Qiu, B.R. Zhao, Phys. Rev. B 77 (2008) 172503.
- (26) K. Jin, B.Y. Zhu, B.X. Wu, L.J. Gao, B.R. Zhao, Phys. Rev. B 78 (2008) 174521.
- (27) N.P. Armitage, F. Ronning, D.H. Lu, C. Kim, A. Damascelli, K.M. Shen, D. L. Feng, H. Eisaki, Z.-X. Shen, P.K. Mang, N. Kaneko, M. Greven, Y. Onose, Y. Taguchi, Y. Tokura, Phys. Rev. Lett. 88 (2002) 257001.
- (28) Y. Dagan, M.M. Qazilbash, C.P. Hill, V.N. Kulkarni, R.L. Greene, Phys. Rev. Lett. 92 (2004) 167001; Y. Dagan, R. L. Greene, Physica C 460-462 (2007) 1109-1110.
- (29) G.M. Luke, L.P. Le, B.J. Sternlieb, Y.J. Uemura, J.H. Brewer, R. Kadono, R.F. Kiefl, S.R. Kreitzman, T.M. Riseman, C.E. Stronach, M.R. Davis, S. Uchida, H. Takagi, Y. Tokura, Y. Hidaka, T. Murakami, J. Gopalakrishnan, A.W. Sleight, M.A. Subramanian, E.A. Early, J.T. Markert, M.B. Maple, C.L. Seaman, Phys. Rev. B 42 (1990) 7981.
- (30) G.S. Boebinger, Y. Ando, A. Passner, T. Kimura, M. Okuya, J. Shimoyama, K. Kishio, K. Tamasaku, N. Ichikawa, S. Uchida, Phys. Rev. Lett. 77 (1996) 5417.
- (31) H. Matsui, T. Takahashi, T. Sato, K. Terashima, H. Ding, T. Uefuji, K. Yamada, Phys. Rev. B 75 (2007) 224514.