A microscopic model for colloidal
gels with directional effective interactions:
Network induced glassy dynamics.
Abstract
By means of molecular dynamics, we study the structure and the dynamics of a microscopic model for colloidal gels at low volume fractions. The presence of directional interactions leads to the formation of a persistent interconnected network at temperatures where phase separation does not occur. We find that large scale spatial correlations strongly depend on the volume fraction and characterize the formation of the persistent network. We observe a pre-peak in the static structure factor and relate it to the network structure. The slow dynamics at gelation is characterized by the coexistence of fast collective motion of the mobile parts of the network structure (chains) with large scale rearrangements producing stretched exponential relaxations. We show that, once the network is sufficiently persistent, it induces slow, cooperative processes related to the network nodes. We suggest that this peculiar glassy dynamics is a hallmark of the physics of colloidal gels at low volume fractions.
pacs:
82.70.Gg, 82.70.Dd, 64.70.PfI Introduction
Soft solids obtained from suspensions of attractive colloidal particles are of central relevance in fields ranging from food processing to the design of new smart materials new . In most cases of practical interest these solids are not crystalline but gels or soft glasses suzanne : they arise from the structural arrest of the suspension into a disordered state, in which the particles can support external stress and therefore behave macroscopically like a solid. The mechanical and rheological properties of this soft matter depend crucially on its structural features which, in turn, are the result of a delicate interplay between the underlying thermodynamics and the arrest conditions. Hence, the understanding of the mechanisms leading to structural arrest is decisive for many technological applications in which colloidal suspensions are involved. Whereas it is clear that in dense suspensions the crowding of the particles is the main mechanism leading to structural arrest and yielding, suspensions of attractive colloids allow to form soft solids also at low volume fractions, where aggregation produces large scale structures lau05 ; trappe_nature ; luca_fd03 ; segre_01 ; exp1 ; edinburgh ; bartlett05 ; lu06 ; exp2 . At intermediate volume fractions (say above - depending on the specific system) possible scenarios for the arrest are the crowding of the aggregates acting as the new units of a dense glassy system cates ; delgado_na_04 ; alessio_letter ; reichman_08 , or the geometrically frustrated arrangements of locally stable large scale structures (such as lamellae or mesoscopic elongated aggregates) decandia_pre06 ; tarzia_prl06 ; charbonneau_prl ; last . At sufficiently low volume fractions, instead, the structure of the arrested states, although created via reversible aggregation, resembles more the open fractal networks typically created by diffusion-limited aggregation processes dlca . In this situation, where the arrest seems to be intimately related to the network structure, the understanding of the arrest phenomenon is far from being reached.
Our work addresses this last situation, which has received only a limited attention in past theoretical and numerical studies. Although experiments show that reversible aggregation processes lead to the formation of open, persistent network structures, most of the established models for the attractive effective interactions, very successful for many aspects likos , fail to produce at these low volume fractions network structures that are stable against macro- or micro-phase separation. Confocal microscopy images obtained in recent experiments dinsmore_prl06 ; solomon ; royall demonstrate that the gel networks formed at low volume fractions have a distribution of the particle coordination number that is strongly peaked around , suggesting that the effective interactions include also many-body terms.
As a matter of fact, in these systems there are several possible sources for such anisotropies, since the particle surface may not be smooth or the building blocks of the gel are not the primary particles but larger aggregates of irregular shape exp2 . Because, up to now, there is no possible quantitative, microscopic derivation of effective interaction which accounts for these complications, we have recently proposed a phenomenological model containing the relevant qualitative ingredients. Following up the idea that directional terms in the effective interactions can lead to the formation of an open network that is thermodynamically stable, our phenomenological model for the effective interactions contains a directional term which introduces a local rigidity delgado_kob_05 ; delgado_kob_prl ; delgado_kob_jnnfm . Our aim is not to reproduce one specific experimental system but to understand how this type of effective interaction might be relevant for the gelation phenomena as observed in diluted suspensions of attractive colloidal particles.
In our model, without imposing a maximal local connectivity zacca -martin , the network structure arises from the balance between the internal energy and the entropy, depending on temperature and volume fraction. In a first study we have shown delgado_kob_prl ; delgado_kob_jnnfm that the formation of the persistent network produces the coexistence, in the gel, of very different relaxation processes at different length scales: the relaxation at high wave vectors is due to the fast cooperative motion of pieces of the gel structure (e.g. the chains connecting two nodes), whereas at low wave vectors the overall rearrangements of the heterogeneous gel make the system relax via a stretched exponential decay of the time correlators. The coexistence of such diverse relaxation mechanisms is characterized by a typical crossover length which is of the order of the network mesh size footnote0 .
In this paper we present a systematic molecular dynamics study of the model for different temperatures and volume fractions. We will argue that the structural and dynamical features of this model should be quite general and could be relevant to different experimental gel-forming systems.
II Model and numerical simulations
We consider identical particles of radius , interacting via a potential . As mentioned above we seek a phenomenological model for the effective interactions which can lead to gelation in attractive colloidal suspensions at low volume fractions. For this, for the inter-particle attraction we consider a Lennard-Jones-like potential of the form , producing a narrow attractive well ( is the distance between the centers of particles and ). To introduce directionality, we have considered an additional soft-sphere repulsion modulated by a geometric term, which reduces the attractive well of unless particles and are in specific relative configurations. To define such configurations the particles are decorated with sticky points occupying the vertices of the icosahedron inscribed in the sphere of diameter and centered in the particle position (see Fig.1).
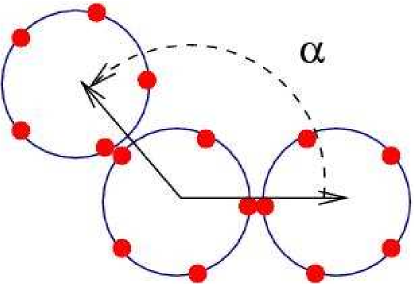
Between particles and the directional effect is then obtained in the following way:
| (1) | |||||
Here is the position of , gives the position of the point on particle . The sum runs over the points of respectively and . so that, if there is one of these points whose distance from the center of particle is small compared to , and the additional soft sphere repulsion does not contribute. If this distance is larger, then , reducing the depth of the original attractive well to . As a consequence, two bonded particles will be subjected to the full attraction only if they touch in those specific configurations and a reduced attraction otherwise. The choice of points allows us to define such relative configurations without imposing a local maximum connectivity to the particles: for example, the choice of or points would anyway lead to the formation of an open network interfering with the effect of directionality which is more appropriate for the physics of these systems.
The term alone is not able to effectively limit the functionality of the particles at the volume fraction and temperatures considered here delgado_kob_unp and will lead to a gel network whose structure and dynamics are strongly affected by phase separation kinetics. Therefore, in our effective interactions we consider a third term which imposes a certain angular rigidity to the bonds and :
| (2) |
making that the angle among the three neighbor particles is unlikely to be smaller than a certain value (see Fig.1).
The resulting interaction potential is
| (3) |
The choice of including both the terms and has been made in the spirit of investigating more deeply their relative contribution to the formation of the open network (and to its dynamics), at a stage where the presence itself of any directional effect was questioned in the scientific community and therefore not considered in most of the cases. Our investigation of the different role of the two terms, albeit partial, indicates that a simplified version of the model with only should lead to very similar structural and dynamical features kob_sastry_09 .
We have implemented in a constrained molecular dynamics code to perform micro-canonical simulations, using a suitable combination of the algorithms RATTLE and SHAKE md .
Although the model may seem quite complicate, in the following sections it will be shown how it undoubtedly picks relevant aspects of the physics it was meant to describe and it does contribute to its understanding.
In Eqs.1-3, the parameters , , , and can be used to tune the effective interactions thus giving rise to a large variety of interesting possibilities (e.g. varying the connectivity from chains to compact structures, changing the local rigidity of the network…). However the desired features of the persistent structure do not correspond to a very specific combination of the parameters, but to reasonable ranges of values which allow for extensive investigations. In particular, we have selected the ranges which allow to give rise to the desired features, like a relatively narrow attractive well, a connectivity greater than and a certain angular rigidity. Here we consider one reasonable choice which guarantees the formation of a persistent open network, i.e. , , , and . We have already shown that with these parameters at a volume fraction , the static structure of this system at low temperature is an open network structure delgado_kob_05 , in qualitative agreement with the one of colloidal gels. Furthermore the system does not show any sign of phase separation in the temperature range investigated and its relaxation time increases rapidly with decreasing , i.e. the static and dynamic properties of the system are indeed very similar to the ones found in real colloidal gels segre_01 .
In the following sections we will discuss the results of molecular dynamics simulations in the micro-canonical ensemble, using a time step of . The unit of time is , with the mass of a particle. All the data refers to simulations performed with 8000 particles in cubic boxes of size in unit of , corresponding respectively to particle densities of , , and from which we have estimated approximately a volume fraction , , and . For every value of we have studied the system at the temperatures 1.0, 0.7, 0.5, 0.3, 0.2, 0.15, 0.1, 0.09, 0.08, 0.06, 0.055, and 0.05. In order to do this we have performed the following equilibration protocol: starting from initial high temperature random configurations, the system is equilibrated at each temperature by replacing all the velocities of the center of mass of the particles and the angular velocities with values extracted from a Maxwell-Boltzmann distribution every time steps ( is suitably varied with temperature from to MD steps). We have checked that after equilibration the energy is constant, showing no significant drift over the simulation time window. We have monitored independently translational and rotational contributions to kinetic energy. Finally, we have verified that different one- and two- time autocorrelation functions reach the equilibrium behavior, i.e. do not age.
From these equilibrated configurations we start the data production. The equilibration time grows accordingly to the relaxation time in the system. At the lowest temperatures the equilibration procedure required up to MD steps. For each temperature and volume fraction we generated five independent runs, over which the results presented here have been averaged.
III Structure
We investigate the structural changes in the system at the different temperatures by means of a comparative study of the density fluctuations, of the local connectivity and of the aggregation process.
III.1 Static structure factor
After equilibrating the system at different temperatures, we calculate the static structure factor:
| (4) |
where the values of the modulus of the wave vector considered are the ones compatible with the periodic boundary conditions of the simulations box.
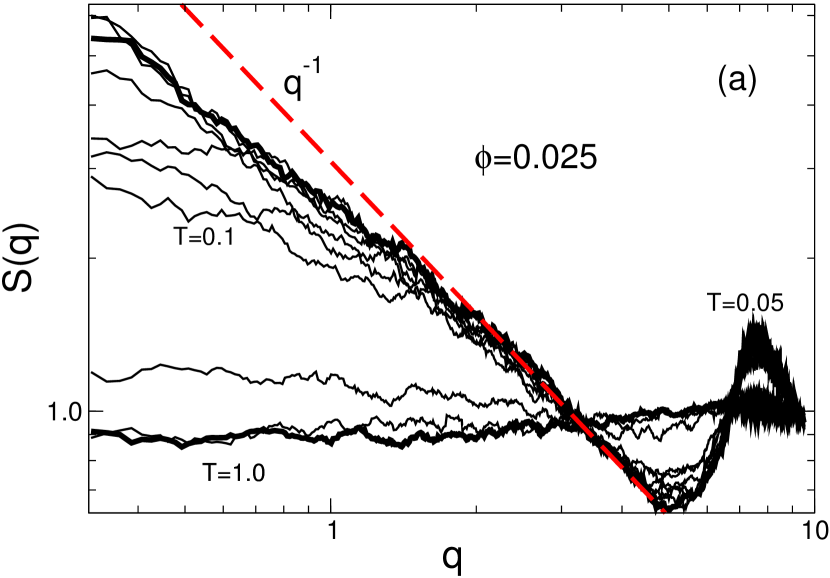
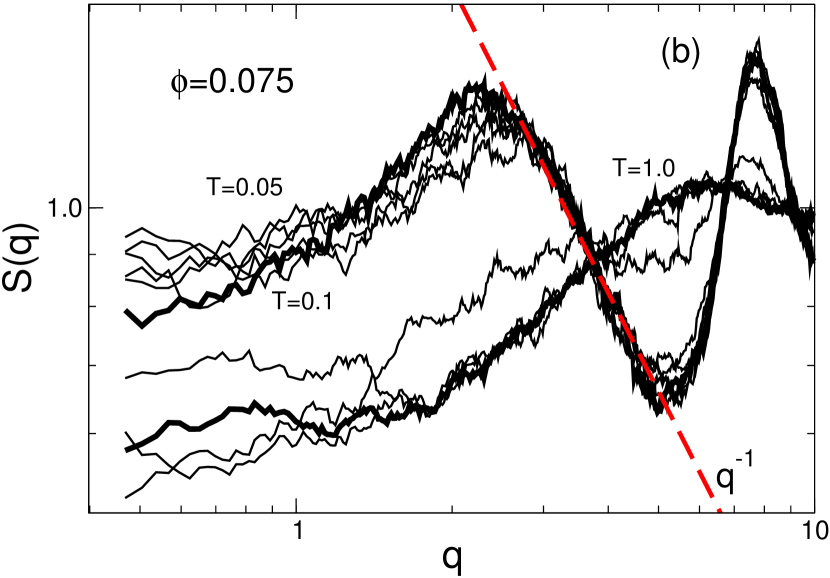
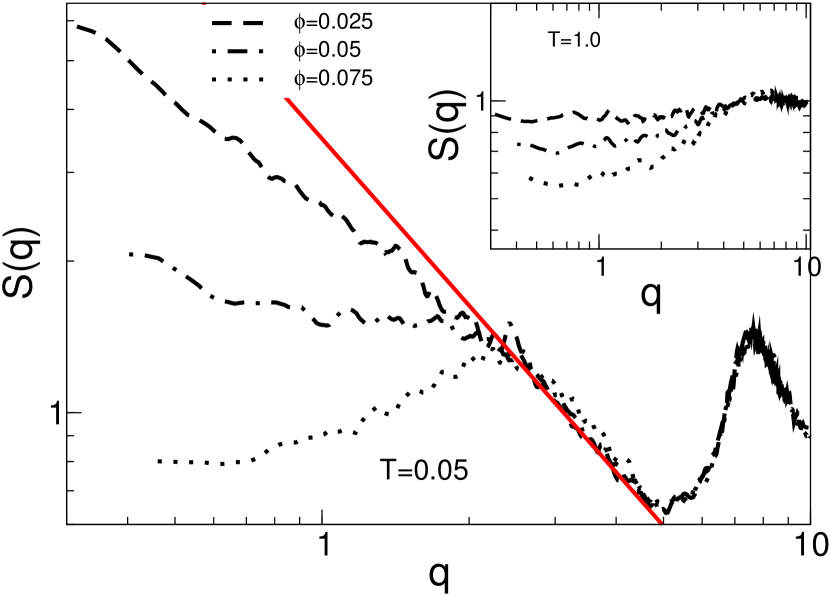
In Fig. 2, we plot as a function of for different temperatures, at the volume fractions and . The plots show that, upon lowering the temperature, major structural changes occur due to aggregation, as indicated by the peak located at a wave vector approximately corresponding to the first neighbor distance within the potential well i.e. , and, more importantly, by the simultaneous onset of spatial correlations at low wave vectors. At high wave vectors the change of from high to low temperatures looks qualitatively the same at different . The spatial correlations at low wave vectors, and therefore the mesoscopic and large scale structures, seem instead to depend strongly not only on but also on . We observe that the data of Fig. 2 show no sign of a phase separation, which would be indicated by a rapidly growing peak at low wave vectors. Instead we see at low the onset of spatial correlations extending over different length scales, suggesting the formation of an extended disordered structure. We compare in Fig. 3 the at the different : at high temperature (inset of the figure), spatial correlations in the system are mainly temperature-controlled, i.e. depend only weakly on . At the lowest temperature (main frame), instead, space correlations are dominated by temperature up to length scales of the order of a few particle diameters. In this region of , i.e. , shows the same dependence for the three values of volume fractions considered. This clearly indicates the presence of mesoscopic elongated structures (chains) as a result of the aggregation driven by the potential energy. Finally, beyond length scales of the order of - particle diameters (i.e. ), the strength and range of spatial correlations are strongly controlled by the volume fraction.
If we consider now in analogy with the static structure factor of a polymer chain solution rubinstein , we can interpret the mesoscopic length scales as an intra-molecular regime for spatial correlations due to the elongated aggregates and the macroscopic scales (i.e. for lengths up to the simulations box linear size) as an inter-molecular regime. Following this description, the intra-molecular regime is strongly controlled by the interaction potential (and therefore by temperature), and extends up to a length-scale which gives a rough estimate of the persistence length of the elongated aggregates ( 3-4 particle diameters). Beyond the persistence length, the captures the inter-molecular regime: the fact that this regime depends quite dramatically on the volume fraction even in the small interval here considered () suggests that the linear size of the aggregates extends well beyond their persistence length.
To conclude this section, we make two remarks. First, we notice that at the lowest volume fraction , one recognizes a power law regime in at intermediate and low . It is clear that this cannot be interpreted as a fractal regime, since the exponent would be less than 1.0. It should instead correspond to the crossover from the inter-molecular regime to an eventual fractal regime which is only detectable for a larger system. This will be confirmed by the analysis of the structure in the following sections. Second, we observe that, at the highest volume fraction, , displays at low a well defined pre-peak at a wave vector . In network-forming ionic liquids, this kind of pattern in scattering intensity is typically associated to the presence of a network structure ionic . In gelling colloidal suspensions it has also been related to the presence of stable clusters of a typical size of - particles segre_01 ; stradner and its connection to gelation is debated. In fact, can give information only on the typical distances between pairs of particles occurring in the structure and does not allow on its own to discriminate between pairs of particles in the same aggregate or from different aggregates. Here, the pre-peak arises from the crossover between the intra-molecular and the inter-molecular regime at this volume fraction due to two competing effects: pairs of particles in the same large aggregate (chain) will be typically separated at least by a distance of - particle diameters, due to the local rigidity; pairs of particles separated by larger distances, belonging or not to the same aggregate, will be limited instead upon increasing the volume fraction. With numerical simulations we have the possibility to access further structural features, to complement the information obtained through . Therefore in the following we exploit it by analyzing the local connectivity of particles, as well as the cluster size distribution, as a function of the temperature and of the volume fraction.
III.2 Connectivity
We define the coordination number as the fraction of particles that have exactly neighbors. Two particles are considered to be neighbors if their distance is less that =1.1, the location of the first minimum in the radial distribution function. By means of we characterize the change in the topology of the structure occurring if is decreased. In Fig. 4, is plotted as a function of inverse temperature for different values of and for the different volume fractions considered here.
As a general result, at high temperatures the vast majority of the particles are isolated, ( not shown), and the fraction of dimers, , is relatively high (). With decreasing this fraction initially increases, but for it starts to rapidly decrease with decreasing . Our data shows that this happens because particles start to form larger structure which are mainly chains: the fraction of particles with exactly two nearest neighbors increases rapidly and these (local) configurations become by far the most prevalent ones at low . Last but not least also the fraction of particles with neighbors increases with decreasing .
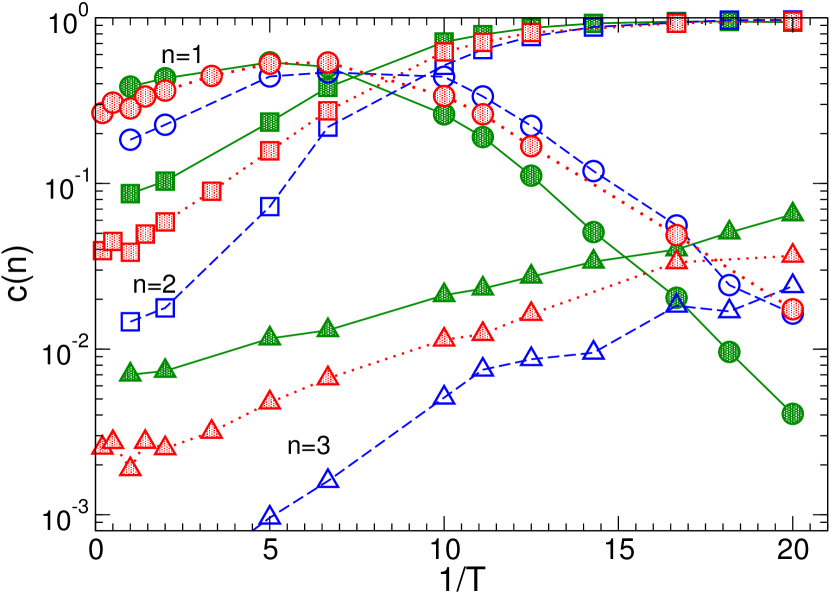
Therefore the curves of Fig. 4 indicate that upon decreasing the particles form chains which are connected by bridging points or nodes () to form an open network. It is interesting to remark that at the lowest temperature there are practically no free particles. The fraction of dimers () is minor and it significantly decreases with increasing the volume fraction. The fraction of particles with does not strongly depend on in the range of values explored, whereas the fraction of particles with monotonically increases with : this suggests that the formation of chains is strongly driven from the interaction, whereas the increasing steric hindrances between large aggregates due to increasing will favor the formation of junctions between the chains by counterbalancing the angular repulsion .
III.3 Clusters
We have monitored the aggregation process and characterized the structure of the system on large length scales using , the number of clusters that have exactly particles. We define that a particle belongs to a cluster if its distance from at least one member of the cluster is less than , the location of the first minimum in the radial distribution function.
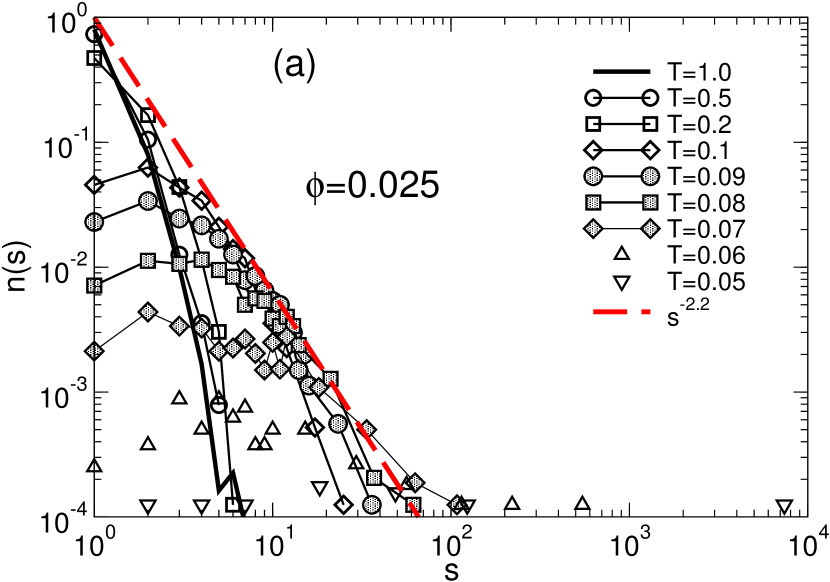
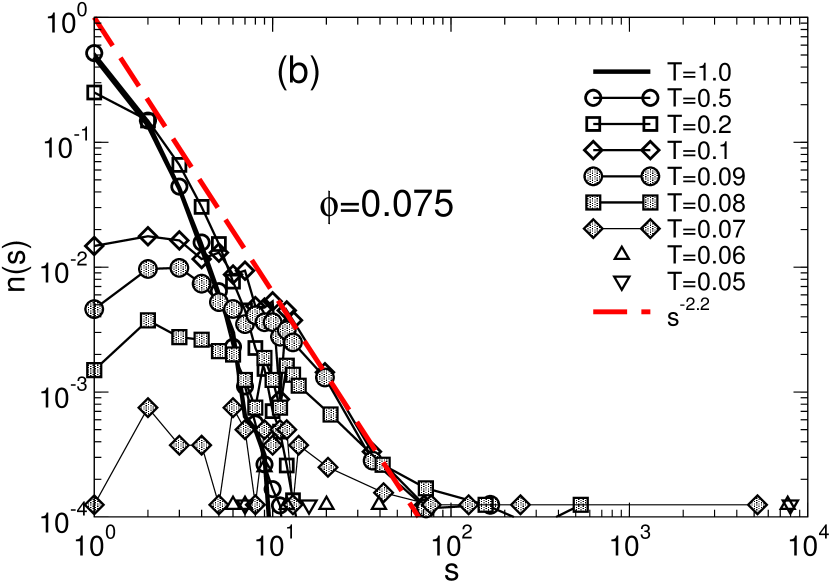
This distribution is shown in Fig. 6 for all temperatures and volume fractions investigated. For the different volume fractions, at high temperatures () the distribution nicely follows an exponential law, a behavior that corresponds to the random formation of transient clusters of non-bonded particles at low densities. Around the shape of the distribution starts to change strongly, indicating that dimers are the most probable clusters. At the same time, also starts to show a tail at large , with clusters sizes of the order of a few hundreds particles. At lower temperatures, displays a power law regime for high values of , with a crossover point that moves to larger with decreasing . This regime is compatible with an exponent around (the dashed line in the plots of Fig. 6) in agreement with random percolation stauffer . By comparing the data at different volume fractions we observe that the temperature at which the power law tail appears increases with increasing volume fraction. The percolation threshold, estimated as the temperature where of the configurations percolate, monotonically increases from at to at . This is coherent with the information obtained from , in Fig. 4: the relative higher amount of bridging between chains upon increasing volume fraction corresponds to a higher probability for the aggregating structure to percolate at the same temperature. Finally, we also conclude from Fig. 5 that, once a percolating cluster is formed, the particles rapidly aggregate into a unique interconnected structure. This is in agreement also with the data of Fig. 4 showing that, at the lowest temperature, there are practically no free particles and the fraction of particles with only one neighbor is negligible, i.e. limited to dangling ends. This feature seems qualitatively the same here and in simulations performed on systems of smaller size ( particles), suggesting that it is not much affected by the system size.
III.4 Summary and discussion of the structural analysis.
The information contained in Figs. 2-5 allows us to reach a convincing interpretation of the scattering patterns of Fig. 2. The behavior of indicates that the mesoscopic length scale discussed above corresponds to the formation of semi-flexible chains whose persistence length is directly related to the features of the effective interactions. The inter-molecular regime, strongly dependent on the volume fraction, corresponds instead to the formation of a network structure due to bridging between different chains. Depending on the the volume fraction, the extended percolating structure will have different amount of nodes (i.e. bridging connections) and therefore, presumably, significantly different mechanical properties. Interestingly, this corresponds to very different patterns in at low wave vectors: from the display of a wide crossover for the softest structure, to the presence of a well defined pre-peak (i.e. a peak at wave vectors corresponding to distances significantly larger than the particle diameter). Differently from the assumption often made that such peak of correlation corresponds to the presence of stable finite clusters, here this pattern indicates instead the persistence length of our elongated aggregates. Our interpretation suggests that, in a case like this, the position of the peak could be therefore related to the mechanical properties of the network. Finally the aggregation process seems to be characterized by the fact that, once that a percolated structure is formed, particles aggregate rapidly into a single network structure and small clusters as well as free particles completely disappear. This feature, which might be distinctive of aggregation induced colloidal gelation, significantly modifies the cluster size distribution and has some consequences also on the dynamics.
The general understanding of the structure formation discussed here will be relevant to the analysis of the dynamics, which is performed in the following section.
IV Dynamics
We characterize the dynamics in our model by means of different quantities: The mean squared displacement of the particles,
| (5) |
and the incoherent scattering function
| (6) |
In order to fully understand the role of the structure formation in the dynamics we also calculate time correlations of bonds and nodes, defined above, in the following way:
| (7) |
where if particles and are linked at time and otherwise. For the nodes (i.e. particles connected to three other particles) is defined as
| (8) |
where if particle is a node at time , otherwise.
IV.1 Characteristic time scales from time autocorrelation functions
From the time correlation functions introduced above we calculate the characteristic times , and , where suitable cut-offs have been used to evaluate the time integrals.
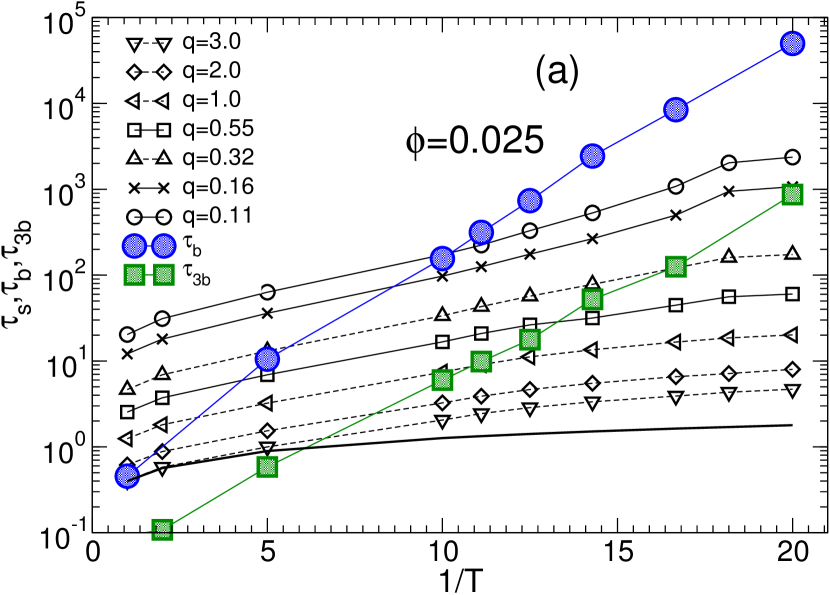
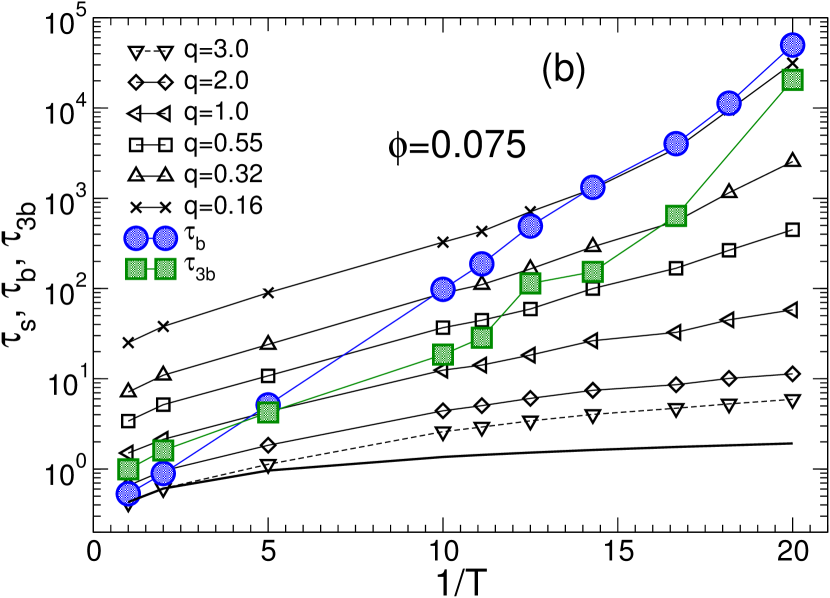
Fig. 6 shows the dependence of these different characteristic times on the inverse temperature at volume fraction (a) and (b). At high the relaxation dynamics at large can be approximated by the function , which gives (solid line). At these temperatures, bonds are not persistent enough to create long living structures. Upon lowering the temperature, bond lifetime becomes the longest relaxation time scale. Moreover, at the lowest temperatures the lifetime of the network nodes becomes comparable to the relaxation times at low wave vectors. That is, the disordered network structure is persistent enough to affect the dynamics at large length scales. From the figure we also conclude that, whereas the bond lifetime is fairly insensitive to the volume fraction, the node lifetime displays a stronger dependence on : the persistence of the nodes apparently depends on the structural features of the network, which in turn, as seen above, depends on . This already suggests, as discussed more in the following, that the network formation is related to the onset of cooperative dynamical processes. We also observe that at , as also found at delgado_kob_05 , the relaxation time at the smallest wave vector shows a temperature dependence which becomes stronger than Arrhenius at low , whereas this does not happen at the lowest volume fraction . Upon increasing , the increase of node lifetime is apparently stronger. Again, this suggests that, whereas the bond breaking is an activated process mainly controlled by the potential energy parameters, the node lifetime is actually affected by the features of the different structure at different volume fractions. From the information gained from and our analysis of section III, we expect the large lengths scale properties of the structure to play a relevant role in the node lifetime. We will come back to these considerations in the following, when analyzing the decay of time correlations of particle displacement, bonds, and nodes.
IV.2 Mean squared displacement
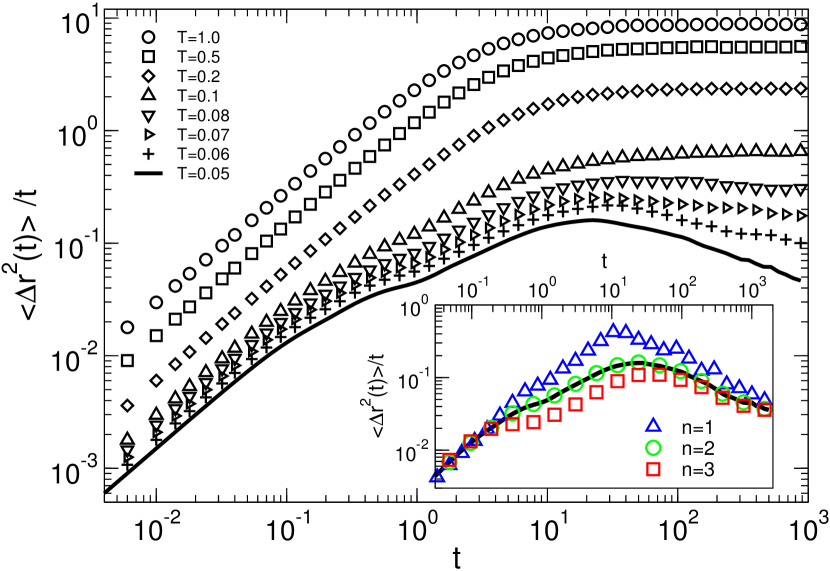
At high temperatures, the time dependence of the particle mean squared displacement (MSD) crosses over from the ballistic -dependence at short times to the diffusive, i.e. linear -dependence. Upon lowering the temperature we observe the onset of a more complex behavior at a temperature , at which the attraction starts to create persistent bonding. In Fig. 7 we plot at for the different temperatures (main frame). This plot clearly shows that, upon lowering the temperature, two different localization processes arise. The first one, at , corresponds to a localization length , which shows a relatively weak dependence on further lowering temperature: this is the onset of the caging regime in which a particle is temporarily trapped by its nearest neighbors, due to the formation of bonds delgado_kob_05 ; delgado_kob_prl ; delgado_kob_jnnfm . At the lowest temperatures, the localization process arising at times corresponds to a localization distance of the order of 10 particles diameter, i.e. comparable to the size of the mesh in the disordered network structure. In the inset, the data at the lowest temperature , where practically all the particles belong to a single percolated cluster, are directly compared to the contribution coming from the nodes of the network (particles with coordination number ), from particles belonging to chains () and from the dangling ends (). This -dependence gives two main indications: the first localization process strongly limits the mobility of the network nodes, but the overall MSD is dominated by the chain mobility; the second localization process, present only at the lowest temperature where the lifetime of the network nodes becomes comparable to the longest characteristic time scale, strongly limits the large scale mobility, dominating the MSD.
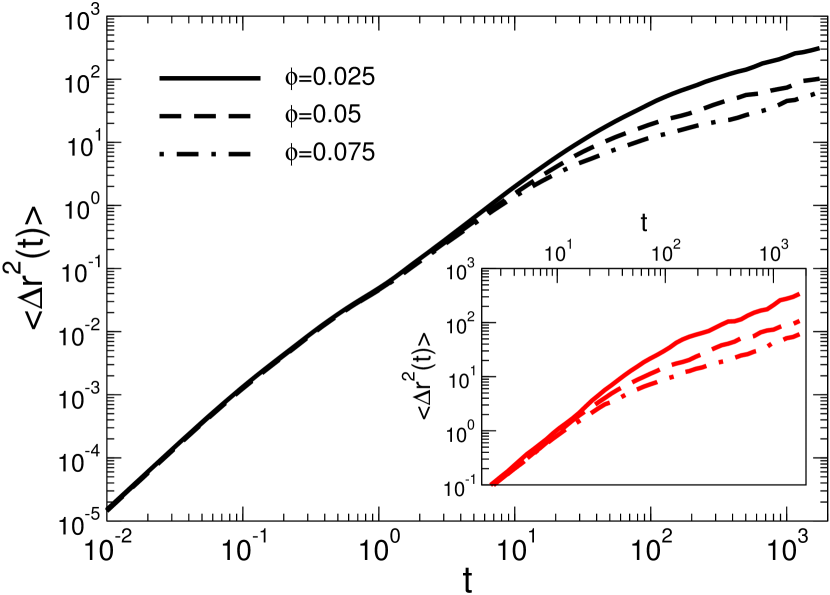
The particle MSD for the different at , i.e. when the network is fully developed, is plotted in Fig.8 (main frame) as a function of time. Here it is clear that, whereas the first localization process () is very weakly dependent on , the volume fraction dependence of the second localization process () is much stronger. This feature is also present if one isolates the contribution coming from the nodes of the network (inset of Fig.8) at the different volume fractions. These observations are coherent with the volume fraction dependence of the structure on different length scales, as shown by the in section III.
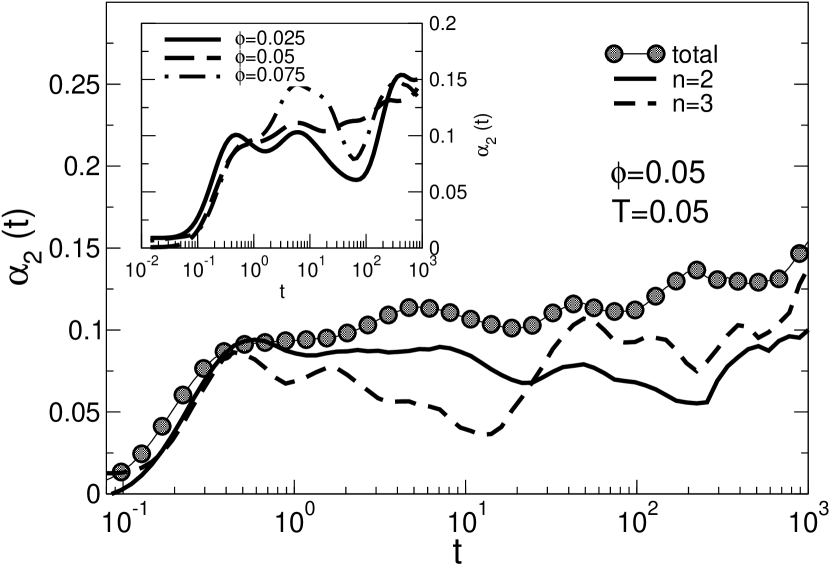
To get a deeper understanding of the correlated particle motion, it is useful to monitor the deviation from a Gaussian distribution for the particle displacements, which is quantified by the non-Gaussian parameter
| (9) |
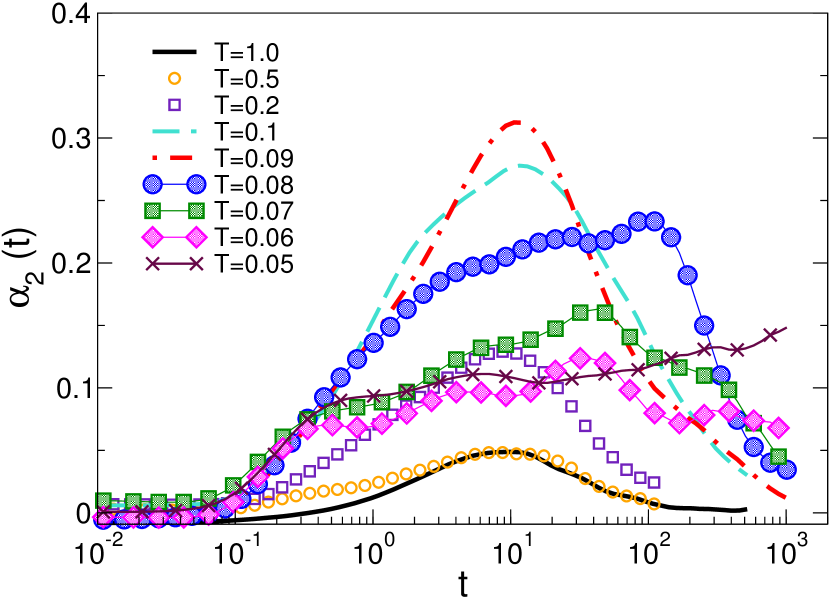
In Fig. 9 we show as a function of time at different temperatures and volume fraction : at high temperature there is a small peak in arising at the crossover between the ballistic and the diffusive regime. Upon decreasing temperature, this peak strongly increases, indicating that the first localization process induces increasing non-Gaussian contributions to the crossover into the diffusive regime. This is actually similar to what is typically observed in the non-Gaussian parameter for supercooled liquids at the onset of the caging regime. At even lower temperature, at which the network starts to form, one can clearly see a qualitative change in the non-Gaussian contribution to particle motion: the glassy peak intensity at decreases and the maximum of apparently moves towards much longer times, occurring approximately after the second localization process. This indicates that, once the aggregation leads towards the network, the main non-Gaussian contribution to particle motion is due to the second localization process, i.e. on length scales of the order of network mesh size. This indicates that there is in fact a different glassy regime of the relaxation dynamics which is set in by the formation of the persistent network and whose onset is therefore marked by the second localization process. This observation is consistent with the findings of a recent numerical study of dipolar colloidal gels miller , although in that study the role of bonds and network junctions has not been quantitatively investigated. We suggest that this type of glassy dynamics induced by the persistent network might be a distinctive feature of colloidal gelation.
It is also useful to distinguish the contribution to coming from different part of the network structure as we do in Fig. 10: In the main frame we show , as calculated from all the particles at and , and compare it to the contribution coming from chains particles () and nodes (). In spite of the fact that the different parts of the structure have been shown to give very different contributions to the dynamics, the data indicates that, at this low temperature, the for the different connectivities are quite similar. This finding is fully consistent with a recent experimental analysis of dynamical heterogeneities in colloidal gels of Ref. solomon , where it has been proposed as an indication that dynamical heterogeneity in presence of a persistent network does not originate from the heterogeneous structure but is instead due to the presence of cooperative processes as in dense glassy systems dh . Here we have been able to show that the mechanism producing this glassy regime is the formation of the persistent, open network. In the following sections we will better elucidate the nature of the cooperative processes. For this we use to investigate the time correlations of particle motions over different length scales in order to understand the connection between structural and dynamical heterogeneities in this system.
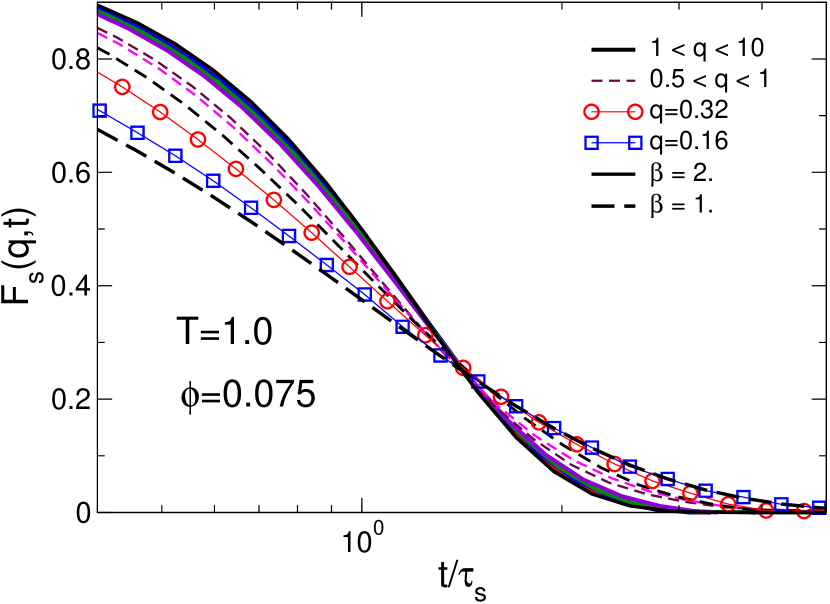
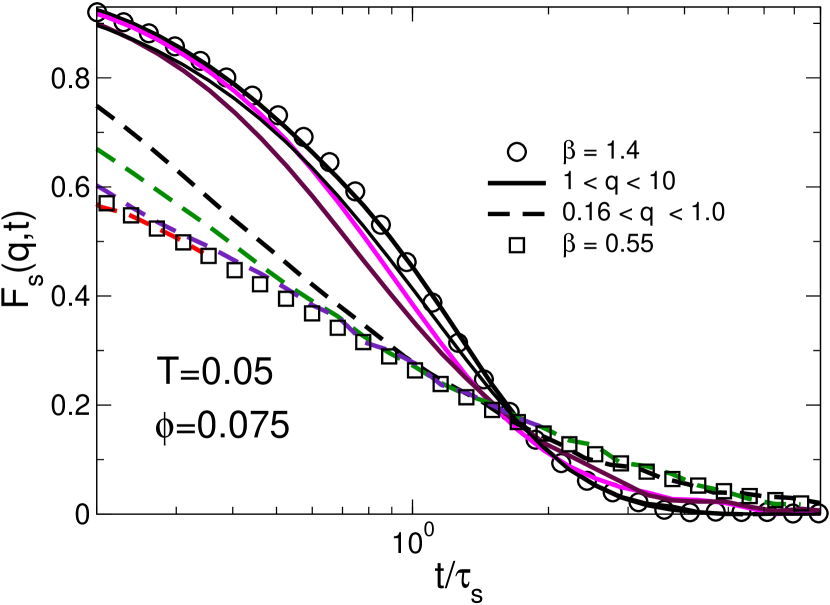
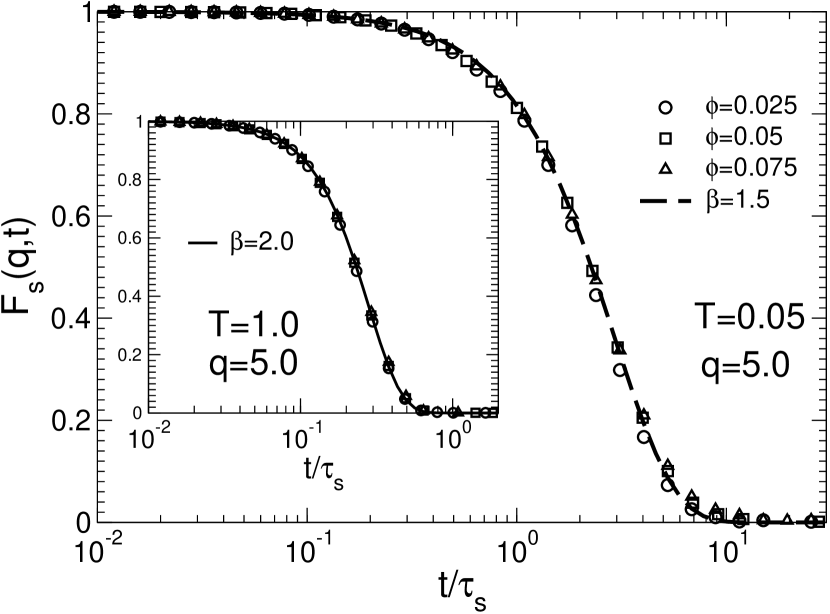
IV.3 Incoherent scattering function
In Figs. 11 and 12 the incoherent scattering function , as defined in Eq. (6), is plotted as a function of the rescaled time for different wave vectors at , and at and respectively. In agreement with the analysis performed in Ref.delgado_kob_prl at , here we also observe that at high temperature for all the curves follow a decay with and for they cross over to a decay with . This simply illustrates the crossover from the ballistic to the diffusive regime, taking place on a length scale of the order of the mean free path and is coherent with the information obtained from Figs. 6, 7, and 8. At low temperature instead, Fig. 12 shows a sharper crossover, as a function of , from a decay with for to a decay with for (see also Ref. delgado_kob_prl ; kob_sastry_09 ). At this , finite clusters and free particles are rare and the main contribution to the displacement of the particles comes from the particles of the network which are not directly connected to the nodes. This indicates that, for wave vectors corresponding to a few inter-particle distances and smaller, the motion of the branches of the percolating cluster is the main relaxation mechanism.
For intermediate and large length scales the system shows a relaxation dynamics similar to the one found in dense glass-forming liquids, i.e. the presence of the disordered structure on this length scales leads to heterogeneous dynamics characterized by a stretched exponential decay of time correlations delgado_kob_prl ; delgado_kob_jnnfm .
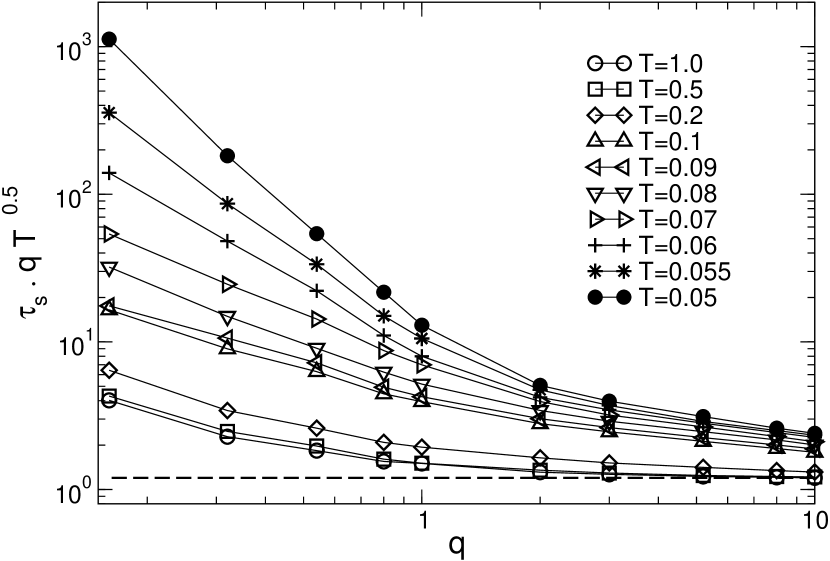
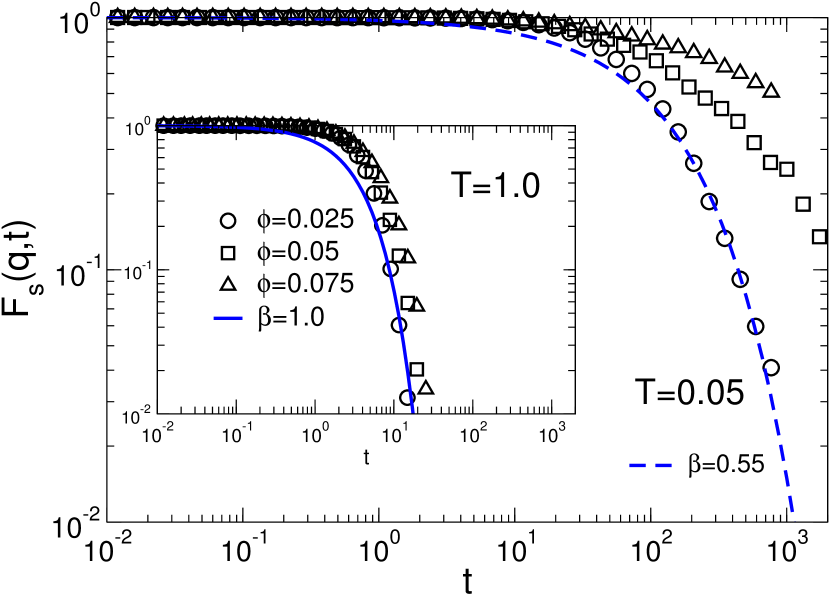
In Fig. 13 we plot as a function of at for different temperatures. The horizontal line in the figure, which approximates well the data for high and high , corresponds to . At the lowest , the data for large appears to follow a different nearly-ballistic regime. For more than of the particles belong to one percolating cluster (see Fig. 5), therefore this fast regime is not really ballistic and is instead due to the motion of the branches of the gel network footnote . The length scale marks the crossover to a different dynamic regime. Our data shows that at the relaxation time extracted from displays a strong dependence, which resembles the one found in dense glass-forming liquids. However, here this dependence is observed at wave-vectors that correspond not to an inter-particle distance, but to the mesh size of the network.
The complex structure of the network and its strong heterogeneity has also a detectable effect on the -dependence of at different wave-vectors. In Fig. 14, is plotted as a function of time for the different volume fractions , , and at high (inset) and low (main frame) temperatures for . The plots indicate the change in the time decay from high to low , but the -dependence is very weak. Although this is at the end not surprising in the low volume fraction regime chosen, Fig. 15 clearly shows that this is not obvious. There, is plotted at high (inset) and low (main frame) temperatures for .
On these length scales, one can detect not only the change in the time decay from high to low , but also a change towards a rather strong -dependence at low as compared to high . Thus, the emerging picture is basically the dynamical analogue of Fig. 3, indicating that, at small length scales, i.e. up to distances of the order of - particle diameters, the structural heterogeneity is completely dominated by the interaction potential and therefore weakly dependent on : this corresponds to a weakly -dependent relaxation dynamics. At larger length scales instead, beyond the mesh size of the network, even relatively small changes of strongly affect spatial correlations and the structure of the network, producing a strongly -dependent relaxation dynamics.
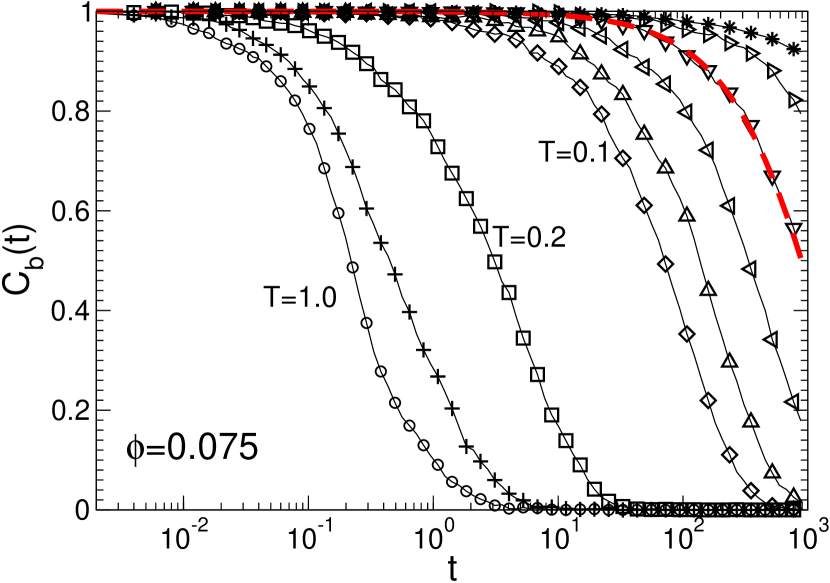
IV.4 Bond and node time correlations
The complex relaxation behavior just described has also its correspondence in the decay of time correlation functions for bonds and nodes of the network, as elucidated in Figs. 16 and 17. Here, and , as defined respectively in Eqs. (7) and (8), are plotted as a function of time at volume fraction . The long time decay of is well described by a single exponential law at all temperatures, in agreement with the Arrhenius dependence of the bond lifetime shown in Fig. 6. The activation energy related to bond breaking does not significantly depend on the volume fraction, as expected. As already noticed in Ref. delgado_kob_jnnfm , we can actually distinguish two different regimes, one at high temperatures () and a second one at low temperature (). At high temperatures the particle collisions promote uncorrelated bond breaking or formation, leading to a short time decay of bond correlation and hence to a quick decay of correlations. At low temperatures instead, the role of particle collisions decreases and the energy activation process becomes the only relevant process in the decay of bond correlation.
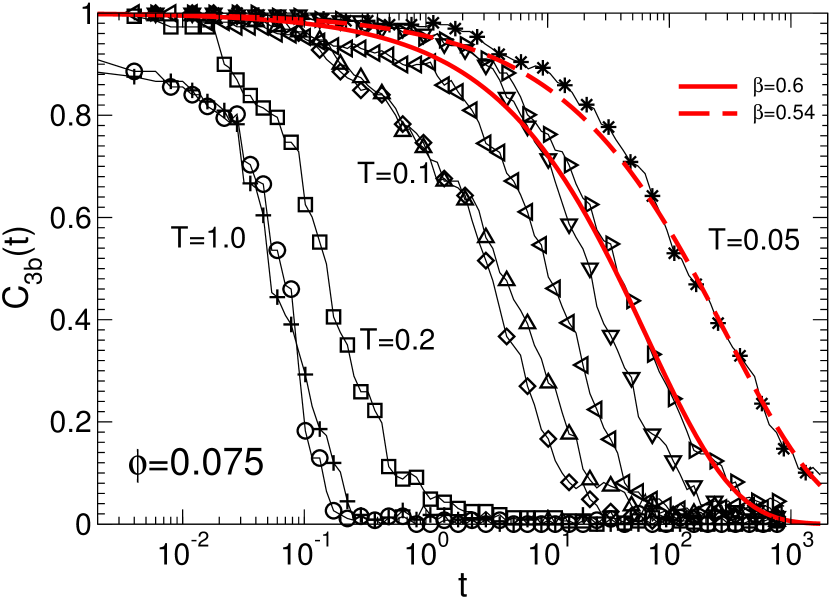
In Fig. 17, the time correlation function for particles with coordination number is plotted as a function of time. At high temperatures () particles of connectivity are rare (see Fig. 4), and therefore the statistics is rather poor. At temperatures , the long time decay of time correlation functions follows a simple exponential law, with a characteristic relaxation time increasing with decreasing . This is coherent with the Arrhenius dependence of in Fig.6. In contrast to this, at temperatures at which a persistent spanning network is present in the system, i.e. , the decay of becomes stretched, with a stretching exponent which decreases with ( at ). This indicates that, once the network is formed and it is sufficiently persistent, the process of breaking and formation of the nodes is associated not only to the overcoming of an activation energy but also to a heterogeneous and cooperative dynamic process delgado_kob_05 .
We have further investigated the type of cooperative processes in which the nodes might be involved, in particular by measuring the occurrence of events at which the breaking of one node makes that one of its neighbors of connectivity becomes itself a node. This would make the nodes to slide along the chains. We have found that in the network regime at least of the events corresponds to this situation. This behavior points out a further similarity, in spite of the very different type of interactions, between the system studied here and the dipolar colloidal gels of Ref. miller , in which one could easily expect these events to occur.
These results elucidate well the complex interplay between structure and dynamics which is fundamental in these systems: Although the slow dynamics is due to the bond lifetime becoming sufficiently long (see Fig.6), it is only the combination of sufficiently persistent bonds together with the branching of the aggregates, i.e. the formation of a stress bearing network, which eventually determines the arising of large scale cooperative relaxation processes at these low volume fractions.
IV.5 Summary and discussion of the dynamical properties
We can now put together all the elements obtained from the different quantities
into a unique coherent picture. The onset of the aggregation,
signaled for example by the change of shape of the cluster size distribution
around in Fig. 5, corresponds to the onset of a dynamical
regime at which relaxation processes are dominated by bond-breaking as opposed to
particle collisions (Fig. 6). This dynamical regime
may resemble, to some extent, the onset of caging in dense
systems: The MSD,
signals a localization process over similar length scales
(Figs. 7 and 8) accompanied by a growing degree of
heterogeneity in the
distribution of particle displacements (Figs. 9 and
10), as compared to a Gaussian one.
In spite of these similarities, we have shown that here
this regime does not imply
structural arrest. The heterogeneity of the dynamics is clearly
arising from the wide distribution of the sizes of the aggregates
delgado_kob_prl ; pablo ; tiziana_prl ; tiziana_pre .
Upon further decreasing temperature,
the aggregation process leads to the formation of an interconnected network.
Once that the network is
persistent enough, i.e. the node lifetime starts to be comparable to the
longest relaxation times in the system (Fig. 6), a
new, slow dynamic regime sets in. This has certainly the hallmark
of gelation, due to the formation of the locally rigid, persistent network,
and it is also indicated by the strong localization process in the MSD,
strikingly dominated by the network nodes (inset of Fig. 7),
over length scales of the order of the mesh size of the network.
This second dynamical regime is associated to a qualitative change in
dynamical heterogeneity (Fig. 9).
The contribution arising from the first localization process
(caging) becomes negligible: there is a new significant non-Gaussian
contribution to the distribution of particle displacements
arising from the second localization process (see the curve at in
Fig. 9) and moving towards longer and longer time scales.
The heterogeneity of this slow dynamics has no straightforward relation
to the structure (Fig. 10), therefore suggesting
that it signals instead the presence of new cooperative processes.
The study of the relaxation dynamics over different length scales
elucidates well that this second dynamical regime is characterized by
the coexistence of very different relaxation processes over different length
scales (Figs. 11-15): fast motion of pieces
(chains and dangling ends) of the gel at small distances and
slow, stretched exponential processes related to the network rearrangements
at length scales larger than the network mesh size. This clearly indicates
the network origin of this dynamical regime, which, being characterized by
slower and slower, complex relaxation, points to structural arrest.
Our comparative analysis indicates therefore that this complex dynamics
has glassy features and strong similarities to the one of dense systems,
with the difference that the strong coupling in particle motion (which originates
the structural arrest) is not induced by the crowding but
by the presence of the persistent network.
The fact that the onset of very slow, stretched exponential relaxations
only takes place at sufficiently low wave vectors is a consequence of that.
Finally, by looking to bond and nodes relaxation we have found
that the cooperative processes underlying this network induced glassy dynamics
is intimately related to the network nodes (Fig. 17).
V Conclusions
We have discussed the behavior of a model for colloidal gels based on the presence of directional effective interactions. In this model, the aggregation leads to an open persistent network structure without imposing a fixed connectivity to the gel units. With these premises, our study gives new insights into the physics of colloidal gelation. From the structural point of view, we have shown that the aggregation process takes place via a random percolation mechanism, but once a percolating structure is formed, it rapidly evolves towards a persistent, fully connected open network. Also in this case, gelation seems associated to the presence of a pre-peak in the static structure factor, here directly related to the network structure. Our comparative analysis of structure and dynamics indicates that the persistent network introduces slow, cooperative processes intimately related to the network nodes and sets in a peculiar kind of glassy dynamics. This scenario is also consistent with the results of a recent numerical study of diluted dipolar colloidal gels miller . We think that this points to the formation of a persistent network as the mechanism responsible for the onset of the glassy dynamics in colloidal gels and explains the close connection between gelation and glassy structural arrest typically observed in these systems. We therefore suggest that this scenario may in fact be relevant to the physics of colloidal gels on a more general ground.
Acknowledgments: The authors would like to thank L. Cipelletti for many fruitful discussion, and M.E. Cates for interesting suggestions. Part of this work was supported by the Marie Curie Fellowship MCFI-2002-00573 and by ANR-TSANET.
References
- (1) K. P. Velikov and E. Pelon, Soft Matter 4, 1964 (2008); K. Stratford, R. Adhikari, I. Pagonabarraga, J.C. Desplat, and M.E. Cates, Science 309, 2198 (2005); M. Anyfantakis, A. Bourlinos, D. Vlassopoulos, G. Fytas, E. Giannelis, and S. K. Kumar, Soft Matter 5, 4256 (2009).
- (2) S. M. Fielding, M. E. Cates and P. Sollich, Soft Matter 5, 2378 (2009).
- (3) L. Ramos and L. Cipelletti, J.Phys.: Condens. Matter 17, R253 (2005).
- (4) V. Trappe, V. Prasad, L. Cipelletti, P. N. Segre, and D. A. Weitz, Nature 411, 772 (2001).
- (5) L. Cipelletti, L. Ramos, S. Manley, E. Pitard, D. A. Weitz, E. E. Pashkovski, and M. Johansson, Faraday Discuss. 123, 237 (2003)
- (6) P. N. Segre, V. Prasad, A. B. Schofield, and D. A. Weitz, Phys. Rev. Lett. 86, 6042 (2001).
- (7) M. Bellour, A. Knaebel, J. L. Harden, F. Lequeux, and J. P. Munch, Phys. Rev. E 67, 031405 (2003); R. Bandyopadhyay, D. Liang, H. Yardimci, D. A. Sessoms, M. A. Borthwick, S. G. J. Mochrie, J. L. Harden, and R. L. Leheny, Phys. Rev. Lett. 93, 228302, (2004).
- (8) W. C. K Poon, A. D. Pirie, M. D. Haw and P. N. Pusey, Physica A 235, 110 (1997).
- (9) A. I.Campbell, V. A. Anderson, J. S. van Duijneveldt, and P. Bartlett, Phys. Rev. Lett. 94 (2005) 208301.
- (10) P. J. Lu, J. C. Conrad, H. M. Wyss, A. B. Schofield and D. A. Weitz, Phys. Rev. Lett 96, (2006) 028306.
- (11) M. Laurati, G. Petekidis, N. Koumakis, F. Cardinaux, A. B. Schofield, J. M. Brader, M. Fuchs, and S. U. Egelhaaf, J. Chem. Phys. 130, 134907 (2009).
- (12) K. Kroy, M. E. Cates, and W. C. K. Poon, Phys. Rev. Lett. 92, 148302 (2004).
- (13) E. Del Gado, A. Fierro, L. de Arcangelis, and A. Coniglio, Phys. Rev. E 69, 051103 (2004); Europhys. Lett. 63, 1 (2003).
- (14) A. Zaccone, H. Wu, and E. Del Gado, Phys. Rev. Lett. 103, 208301 (2009).
- (15) E. Zaccarelli, S. Andreev, F. Sciortino, and D. R. Reichman, Phys. Rev. Lett. 100, 195701 (2008).
- (16) A. de Candia, E. Del Gado, A. Fierro, N. Sator, M. Tarzia, and A. Coniglio, Phys. Rev. E 74, 010403(R) (2006).
- (17) M. Tarzia and A. Coniglio, Phys. Rev. Lett. 96, 075702 (2006).
- (18) P. Charbonneau and D. R. Reichmann, Phys. Rev. Lett. 99, 135701 (2007).
- (19) J. C. F. Toledano, F. Sciortino and E. Zaccarelli, Soft Matter 5, 2390 (2009).
- (20) R. C. Ball, D. A. Weitz, T. A. Witten, and F. Leyvraz, Phys. Rev. Lett. 58, 2967 (1987); M. Y. Lin, H. M. Lindsay, D. A. Weitz, R. C. Ball, R. Klein, and P. Meakin, Phys. Rev. A 41, 2005 (1990).
- (21) C. N. Likos, Phys. Rep. 348, 267 (2001); M. Dijkstra, R. van Roij, and R. Evans, Phys. Rev. E 59, 5744 (1999).
- (22) A. D. Dinsmore, V. Prasad, I. Y. Wong, and D. A. Weitz Phys. Rev. Lett. 96, 185502 (2006).
- (23) C. J. Dibble, M. Kogan, and M. J. Solomon, Phys. Rev. E 77, 050401 (2008).
- (24) T. Ohtsuka, C. P. Royall and H. Tanaka, Europhys. Lett. 84, 46002 (2008).
- (25) E. Del Gado and W. Kob, Europhys. Lett. 72 1032 (2005).
- (26) E. Del Gado and W. Kob, Phys. Rev. Lett. 98 028303 (2007).
- (27) E. Del Gado and W. Kob, Journal of Non-Newt. Fluid Mech. 149, 28 (2008); AIP Conf. Proc. 1027, 1030 (2008).
- (28) E. Zaccarelli, S. V. Buldyrev, E. La Nave, A. J. Moreno, I. Saika-Voivod, F. Sciortino, P. Tartaglia, Phys. Rev. Lett. 94, 218301 (2005).
- (29) E. Bianchi, J. Largo, P. Tartaglia, E. Zaccarelli, and F. Sciortino, Phys. Rev. Lett. 97, 168301 (2006).
- (30) M. Kröger, Models for polymeric and anisotropic liquids, Springer, Berlin (2005).
- (31) Some of these features are reminiscent of dynamical anomalies observed in soft-core models for network-forming liquids liquids , but their extent and relevance here are quantitatively different in terms of energy and time scales: in colloidal gels at low volume fractions the network formation is responsible for the mechanical stability of the system, which displays a solid-like response with a finite, measurable low frequency shear modulus. That is, this quantitative difference is far from trivial because it produces the qualitatively different rheological and mechanical behaviors that is our central interest for practical uses and technological applications.
- (32) P. J. Camp, Phys. Rev. E 71, 031507 (2005); A. B. de Oliveira, P. A. Netz, T. Colla, and M. C. Barbosa, J. Chem. Phys. 124, 084505 (2006).
- (33) E. Del Gado and W. Kob, unpublished.
- (34) S. Saw, N. L. Ellegaard, W. Kob, and S. Sastry, arxiv:0910.5318, PRL in press.
- (35) M. P. Allen and D. Tildesley, Computer simulation of liquids, Clarendon Press, Oxford (1989).
- (36) M. Rubinstein and R. H. Colby, Polymer Physics, Oxford University Press, Oxford (2003).
- (37) P. A. Madden and M. Wilson, J. Phys.: Condens. Matter 12, A95 (2000).
- (38) A. Stradner, H. Sedgwick, F. Cardinaux, W. C. K. Poon, S. U. Egelhaaf and P. Schurtenberger, Nature 432, 492 (2004).
- (39) A. Aharony and D. Stauffer, Introduction to percolation theory, Taylor and Francis, London (1994).
- (40) M. A. Miller, R. Blaak, C. N. Lumb and J. -P. Hansen, J. Chem. Phys. 130, 114507 (2009); R. Blaak, M. A. Miller and J. -P. Hansen, Europhys. Lett. 78, 26002 (2007).
- (41) R. Richert, J. Non-Cryst. Solids 172, 209 (1994).
- (42) As a side remark, we would like to comment that the microscopic Newtonian dynamics we use is certainly not the most appropriate to the damped microscopic dynamics of a real system, due to the presence of the solvent. From this point view, the use of Brownian dynamics would be more appropriate. On the other hand, the choice of the Newtonian dynamics has been useful here because it allows for a clearer distinction of the two different relaxation regimes and has therefore simplified our analysis.
- (43) T. Abete, A. de Candia, E. Del Gado, A. Fierro, and A. Coniglio, Phys. Rev. Lett. 98, 088301 (2007).
- (44) T. Abete, A. de Candia, E. Del Gado, A. Fierro, and A. Coniglio, Phys. Rev. E 78, 041404 (2008).
- (45) P. I. Hurtado, L. Berthier, and W. Kob, Phys. Rev. Lett. 98, 135503 (2007).