Supernova 2003bg: The First Type IIb Hypernova111This paper includes data gathered with the 6.5-m Magellan telescopes located at Las Campanas Observatory, Chile, and is partly based on observations collected at the Cerro Tololo Inter-American Observatory, operated by the Association of Universities for Research in Astronomy, Inc. (AURA), under cooperative agreement with the National Science Foundation.
Abstract
Optical and near-infrared photometry and optical spectroscopy are reported for SN 2003bg, starting a few days after explosion and extending for a period of more than 300 days. Our early-time spectra reveal the presence of broad, high-velocity Balmer lines. The nebular-phase spectra, on the other hand, show a remarkable resemblance to those of Type Ib/c supernovae, without clear evidence for hydrogen. Near maximum brightness SN 2003bg displayed a bolometric luminosity comparable to that of other Type I hypernovae unrelated to gamma-ray bursts, implying a rather normal amount of 56Ni production (0.1–0.2 M⊙) compared with other such objects. The bolometric light curve of SN 2003bg, on the other hand, is remarkably broad, thus suggesting a relatively large progenitor mass at the moment of explosion. These observations, together with the large value of the kinetic energy of expansion established in the accompanying paper (Mazzali et al., 2009), suggest that SN 2003bg can be regarded as a Type IIb hypernova.
1 INTRODUCTION
Stars with initial masses above M⊙ are thought to end their lives with the collapse of their core, when a compact remnant is formed (a neutron star, or a black hole for the more massive stars) and a powerful explosion expels the outer layers of the star. This explosion is observed as a supernova (SN).
Depending on the degree of stripping of the outer layers before the core collapses, supernovae (SNe) will have different characteristics (e.g., Filippenko, 1997). If a massive hydrogen envelope is still present at the time of explosion, H lines dominate the spectrum and H recombination dictates the light curve, and the SN is classified as Type II. If the star loses its H-rich envelope but the He-rich shell is still present, the SN is called a Type Ib event (Elias et al., 1985; Porter & Filippenko, 1987), the light curve is not affected by the recombination of hydrogen, and the spectrum shows strong He lines attributed to non-thermal excitation caused by fast particles produced in the 56Ni 56Co 56Fe decay (Lucy, 1991). If the He shell is also lost, the SN only shows lines of heavier elements (O, Mg, Si, S, Ca, Fe) and is dubbed as a Type Ic event (Wheeler & Harkness, 1986; Wheeler et al., 1987; Filippenko et al., 1990). It is thought that the loss of the outer H and He layers may be a consequence of a stellar wind and/or binary interaction (Nomoto et al., 1994a).
The details of the explosion depend on the kinetic energy, the amount of 56Ni (i.e., the SN luminosity) produced in the explosion, and the zero age main sequence (ZAMS) mass of the progenitor (Hamuy, 2003; Nomoto et al., 2005, for SNe II and SNe Ib/c, respectively). Recent studies suggest that stars more massive than M⊙ lose both their H and He shells prior to explosion, produce explosions with isotropic energies exceeding 1052 ergs (Mazzali et al., 2007, for example), and are often connected with gamma-ray bursts (GRBs; Galama et al., 1998). A signature of a high kinetic energy (more precisely, high kinetic energy per unit mass) is a spectrum with broad lines (Iwamoto et al., 1998, for example); in those cases where the total kinetic energy of expansion is shown to indeed be very high, the object has been dubbed a “hypernova.” Stars of somewhat smaller mass ( M⊙) that still collapse to a black hole can also produce broad-lined SNe Ic but show no GRB [e.g., SN 1997ef; Mazzali et al. (2000)]. For H-rich SNe, on the other hand, very large kinetic energies have not yet been observed. Only for SNe Ib is there some evidence of unusually high kinetic energies, albeit just from one event [SN 2008D; Soderberg et al. (2008); Mazzali et al. (2008)].
Here we present optical and near-infrared observations obtained of SN 2003bg in the course of the “Carnegie Type II Supernova Survey” (CATS, hereafter). These data reveal that SN 2003bg is one of the first broad-lined SNe IIb ever observed. SNe IIb are similar to SNe Ib but still show some traces of hydrogen in their early-time spectra, which suggests the presence of a low-mass H layer prior to explosion; the first known example was SN 1987K (Filippenko, 1988), and it too had high expansion velocities. The prototypical object of this subclass is SN 1993J (Filippenko et al., 1993; Swartz et al., 1993; Filippenko et al., 1994; Nomoto et al., 1994b).
This paper is organized as follows. In Section 2 we describe the observations. The analysis of the spectroscopic data and the bolometric light curve are presented in Section 3. Our conclusions are summarized in Section 4. Detailed modeling of this supernova based on our data is presented in the accompanying paper by Mazzali et al. (2009), confirming the conclusion that SN 2003bg had very high kinetic energy of expansion and thus can legitimately be classified as a hypernova.
2 OBSERVATIONS
SN 2003bg was discovered on 2003 Feb. 25.7 (UT dates are used throughout this paper) by R. Chassagne at Ste. Clotilde, Ile de Reunion, with mag = 15 on an unfiltered CCD frame taken with a 0.30-m automated telescope (Chassagne, 2003). The SN was located west and south of the nucleus of MCG-05-10-015, an SB(s)c galaxy with a heliocentric recession velocity of 1367 km s-1 obtained from 21-cm neutral hydrogen measurements (Theureau et al., 1998). According to Chassagne, nothing was visible at the position of the SN on an unfiltered image taken on 2002 Nov. 7 with a limiting magnitude of 18.0.
As soon as we learned of the discovery, we initiated detailed follow-up observations of SN 2003bg at optical and near-infrared (NIR) wavelengths, as part of the “Carnegie Type II Supernova Survey.” This program was carried out at Las Campanas Observatory during 2002–2003 with the main purpose to study nearby (redshift ) SNe II. CATS used the 1-m Swope and 2.5-m du Pont telescopes to obtain photometry and the Magellan Clay telescope for optical spectroscopy. A total of 34 SNe II were observed in 2002–2003 plus a few SNe of other types. A detailed report of the 34 SNe II is in preparation (Hamuy et al., 2009). We also refer the reader to Hamuy et al. (2006) describing the observational procedures of the “Carnegie Supernova Project” (CSP), which are nearly identical to those of CATS. In fact, CATS was a precursor to the CSP initiated in 2004 with the aim to study SNe of all types. The main difference between CATS and CSP is that the latter uses SDSS filters for optical imaging.
A complete journal of the photometric and spectroscopic observations obtained for SN 2003bg is given in Table 1. In the remainder of this section, we present the observation procedures, data reductions, and the resulting data.
2.1 Optical Photometry
The optical imaging of SN 2003bg was obtained with Johnson-Kron-Cousins filters using the Swope 1-m telescope facility Direct CCD Camera, the Wide Field Re-imaging CCD Camera (WFCCD) on the 2.5-m du Pont telescope, and the Low-Dispersion Survey Spectrograph (LDSS-2; Allington-Smith et al., 1994) on the 6.5-m Magellan Clay telescope, all at Las Campanas Observatory (LCO). A few additional optical images were obtained with the 0.9-m telescope at Cerro Tololo Inter-American Observatory (CTIO). The SN observations started on 2003 Mar. 2 and extended through 2004 Jan. 15, covering 320 days of the SN evolution. For galaxy subtraction, we used images obtained with the Direct CCD Camera on the 2.5-m du Pont telescope on 2004 Nov. 11 and 2005 Feb. 13 when the SN was no longer visible. This instrument delivers images with a typical image quality of full width at half-maximum intensity (FWHM), thus providing galaxy templates with better image quality than any of the SN+galaxy images.
All of the photometric reductions were performed with customized IRAF222IRAF is distributed by the National Optical Astronomy Observatories, which are operated by the Association of Universities for Research in Astronomy, Inc., under cooperative agreement with the National Science Foundation. scripts. The reductions started with the subtraction of the galaxy templates, which involved (1) determining the coordinate transformation between the two images and registering the template to the SN+galaxy image, (2) degrading the point-spread function (PSF) of the template to that of the SN+galaxy image, (3) matching the flux scale of the template to that of the SN+galaxy image, (4) subtracting the modified template from the SN+galaxy image, and (5) extracting a small box around the SN from the subtracted image and inserting it into the original SN+galaxy image. As a result of this procedure the SN ended up lying on a smooth background, thus allowing us to reliably measure the SN flux.
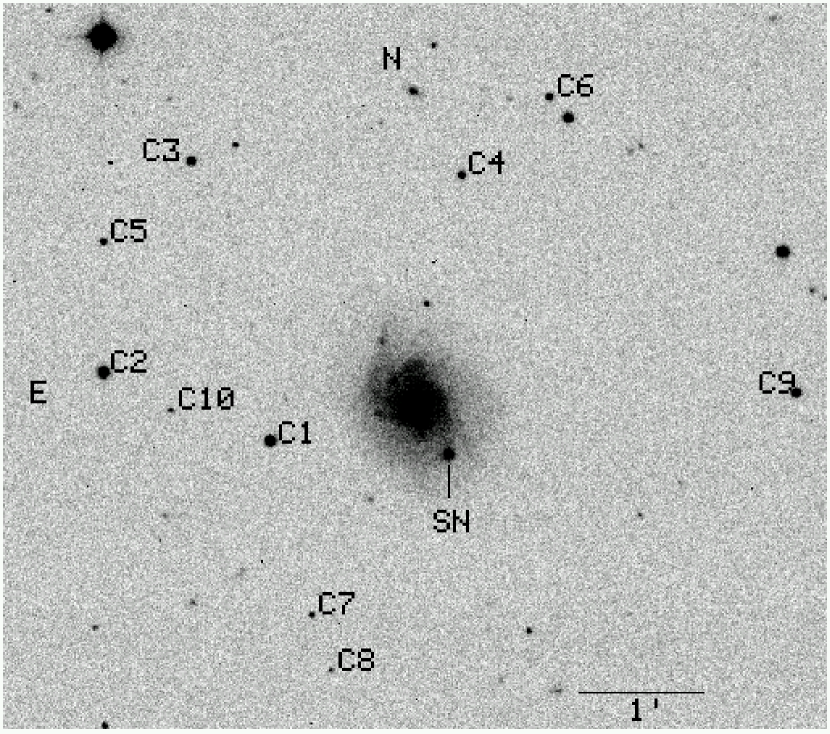
The next step consisted of establishing a photometric sequence of local standard stars in the field of SN 2003bg. For this purpose we employed observations with the Swope telescope of Landolt (1992) standard stars during eight photometric nights. Figure 1 shows the SN field and the ten selected stars, and Table 2 lists the average magnitudes for these stars.
SN magnitudes in the standard Johnson-Kron-Cousins system were obtained differentially relative to the comparison stars using PSF photometry on the galaxy-subtracted images. For this purpose, we employed all the stars of the photometric sequence to determine an average PSF for every CCD image, and we fitted the resulting PSF to the SN and the standards to a radius of . The sky was estimated locally for each star from an annulus centered around the star with an inner radius of and a width of . The instrumental magnitudes of the SN were converted to the standard system using the following equations:
| (1) |
| (2) |
| (3) |
| (4) |
In these equations (left-hand side) are the published magnitudes in the standard system (Landolt, 1992), (right-hand side) correspond to the natural-system magnitudes, is the color term, and is the zeropoint for filter .333In the case of the LDSS-2 instrument which does not have an -band filter, we used instead of in equation 2. For all four optical cameras we employed average color terms determined on multiple nights (listed in Table 3), solving only for the photometric zeropoints.
We emphasize that our photometric reductions did not include shutter-time corrections because at the time of CATS we did not have an assessment of this effect. While the differential photometry technique is immune to the shutter-time error, the calibration of the local photometric sequence performed with the Swope telescope could be potentially affected by this effect since the exposures of the Landolt (1992) standards are much shorter than those of the SN field. During the CSP survey in 2004 we measured this effect and determined that for the curtain shutter design of the CCD camera on the Swope telescope, the error introduced in the photometry is a single constant error across the field amounting to 0.08 s (Hamuy et al., 2006). For our shortest exposures of the Landolt fields (3 s), the neglect of this correction introduces an overestimate of 2.6% in the observed fluxes. The final error in the calibration of the local standards is certainly much lower than this owing to the fact that the nightly photometric calibrations were derived from 20 Landolt stars, most of which observed with longer exposures. We thus conclude that neglecting the shutter correction makes the SN appear systematically fainter, but the effect is 0.01 mag.
We also note that we did not include CCD linearity corrections for any of our instruments since we lacked such information during CATS. After the completion of the project we did carry out such measurements with the Swope “Site#3” CCD in the course of the CSP, and we reached the conclusion that the response of the detector departed 6% from linearity at 23,000 ADU pixel-1 (57,500 e- pixel-1) (Hamuy et al., 2006). Based on that information we have empirically determined that the effect of neglecting this correction introduces a systematic error in the instrumental magnitudes of 0.005 mag per magnitude unit. We therefore expect a differential bias in the SN flux with respect to the local standards. The sign and net error in the SN magnitude will depend on whether the SN is brighter or fainter than the average flux of the local standards. During our follow-up observations, the SN varied in the range –21.0 mag (see Figure 2), while the average local standard had mag (see Table 2), so we expect to overestimate the SN flux by mag around maximum light and underestimate the SN flux by mag toward the end of the campaign. These corrections are on the same order as the precision of the final photometry, and so we have not applied them.
The resulting magnitudes of SN 2003bg are listed in Table 4. The final uncertainty in the SN magnitude was the instrumental error in the PSF fit (assuming a minimum of 0.015 mag). We neglected errors due to the transformation to the standard system since the uncertainties in the color term and zeropoint were well below 0.015 mag. This table also includes synthetic magnitudes computed from our spectra (see below for details) in which case we adopted a conservative uncertainty of 0.1 mag.
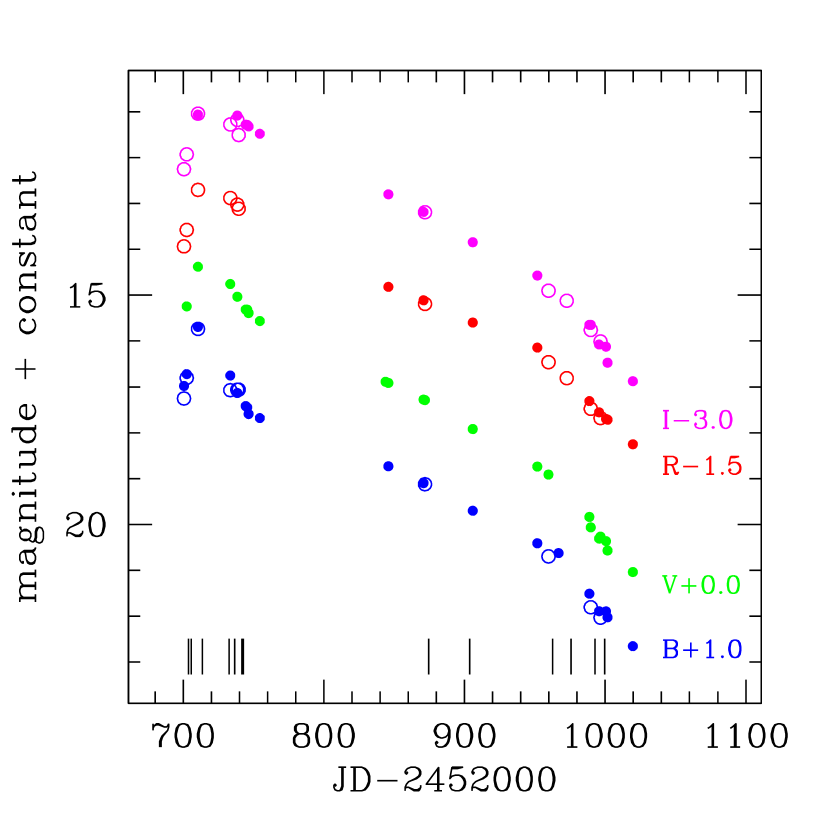
Figure 2 shows the light curves, all of which reveal that the SN was caught during an early phase of steep brightening. We estimate that the SN reached a peak of mag at JD 2,452,716–720 (2003 Mar 17–21). This relatively large uncertainty in time is caused by the fact that the light curve around maximum was not sampled in great detail. Peak brightness was followed by a steep decline of 1.3 mag in 30 days. Over the next 150 days the SN showed a slow but steady decline at 0.015 mag day-1. Starting around JD 2,452,970 (252 days past maximum), there was an evident increase in the decline rate which might be due to the formation of dust in the SN ejecta, as was the case for SN 1987A 500 days after explosion (Suntzeff & Bouchet, 1990).
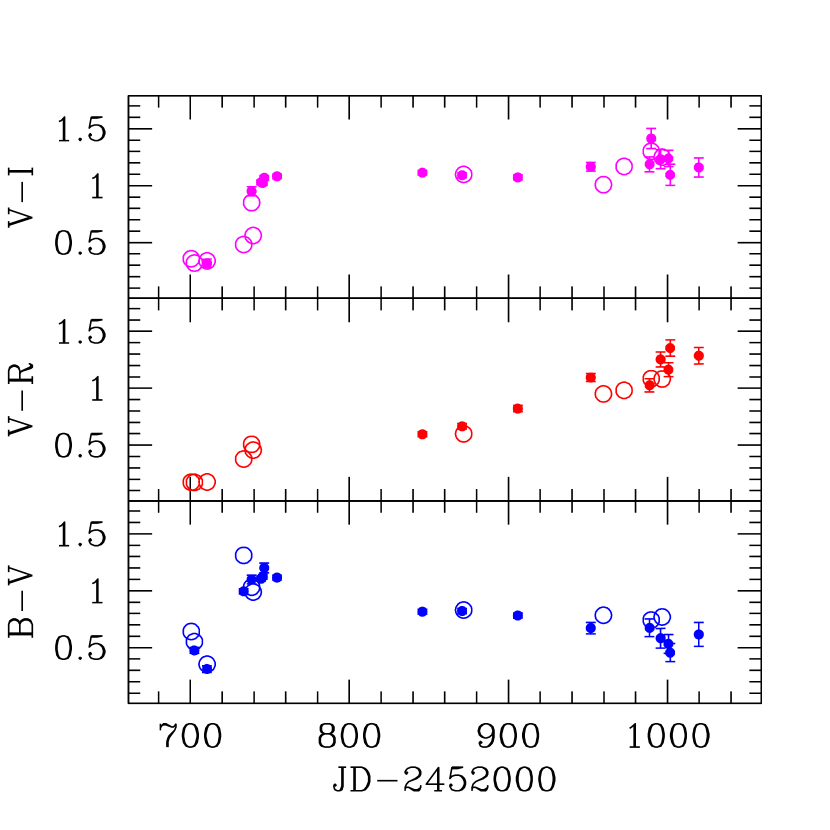
The color curves are shown in Figure 3. Prior to maximum the SN became gradually bluer in , after which it grew redder in all three colors through JD 2,452,740. After that the SN became bluer in and redder in .
2.2 Infrared Photometry
We obtained images of SN 2003bg with the Swope telescope IR Camera (C40IRC) and the Wide Field IR Camera (WIRC) on the du Pont telescope (Persson et al., 2002). C40IRC is equipped with a single pixel Rockwell NICMOS-3 HgCdTe array with a pixel-1 scale, which corresponds to a field of view (FOV) of . WIRC is equipped with four pixel Rockwell HAWAII-1 HgCdTe arrays forming a square footprint with a center-to-center spacing in the reimaged telescope focal plane. Each array covers a FOV of with a pixel-1 scale.
Sky flats were taken with C40IRC during evening twilight. Dark frames were obtained just after closing the dome at the end of the night. With WIRC we instead obtained dome flats with the dome closed at the end of the night followed by dark frames. With both instruments we observed the SN by taking sequences of dithered exposures ranging between 20 s and 90 s depending on the brightness of the SN. With C40IRC we observed SN 2003bg along with star c1 (Figure 1) in order to conduct differential photometry. The larger FOV of WIRC allowed us to include star c1 and a few other field stars. During six clear WIRC nights, we observed one to four standard stars from Persson et al. (1998) in order to calibrate star c1.
The C40IRC and WIRC reductions consisted of subtracting the dark frames from the flat images and dividing the normalized flats into all the science frames. Every time standard stars were observed with WIRC, we measured instrumental magnitudes through a standard aperture of radius (Persson et al., 1998), with a sky annulus to from the star. We corrected such magnitudes for atmospheric extinction using the canonical values given by Persson et al. (1998): , , and . A photometric zeropoint was then derived for each filter, assuming zero color terms since the instrument detector and filters used with WIRC are essentially the same as in Persson et al. (1998). The photometric transformations derived from these observations were then applied to star c1. From the six independent measurements we obtained the following average magnitudes: , , and . These values are in excellent agreement with the values , , and in the 2MASS All-Sky Catalog of Point Sources (Skrutskie et al., 2006).
We then performed differential photometry of the SN relative to star c1. To improve the instrumental precision, we measured aperture photometry of both stars using a small aperture that varied between and depending on the seeing. The instrumental magnitudes were converted to the standard system using the zeropoints derived for each filter from star c1. The resulting magnitudes of SN 2003bg are listed in Table 5. The final uncertainty in the SN magnitude is the sum in quadrature of the statistical errors in the instrumental magnitudes of the SN and star c1, and the errors in the standard magnitudes of star c1. At this point we have ignored possible errors caused by host-galaxy contamination in the SN aperture because we lack galaxy templates in the IR filters. Given the smooth background on which the SN lies, we believe this error is negligible.
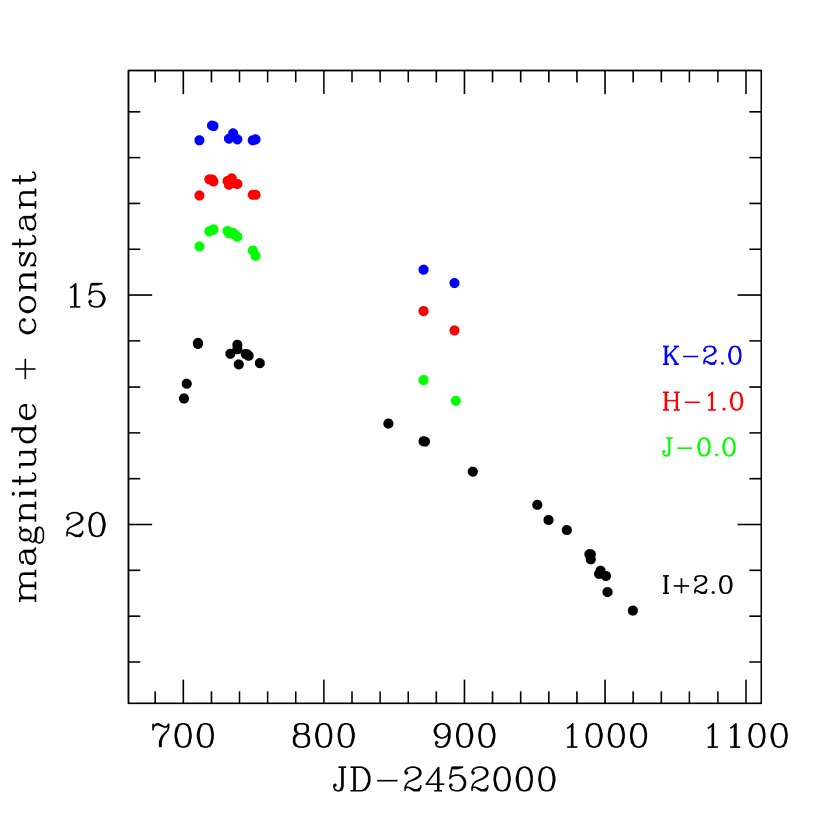
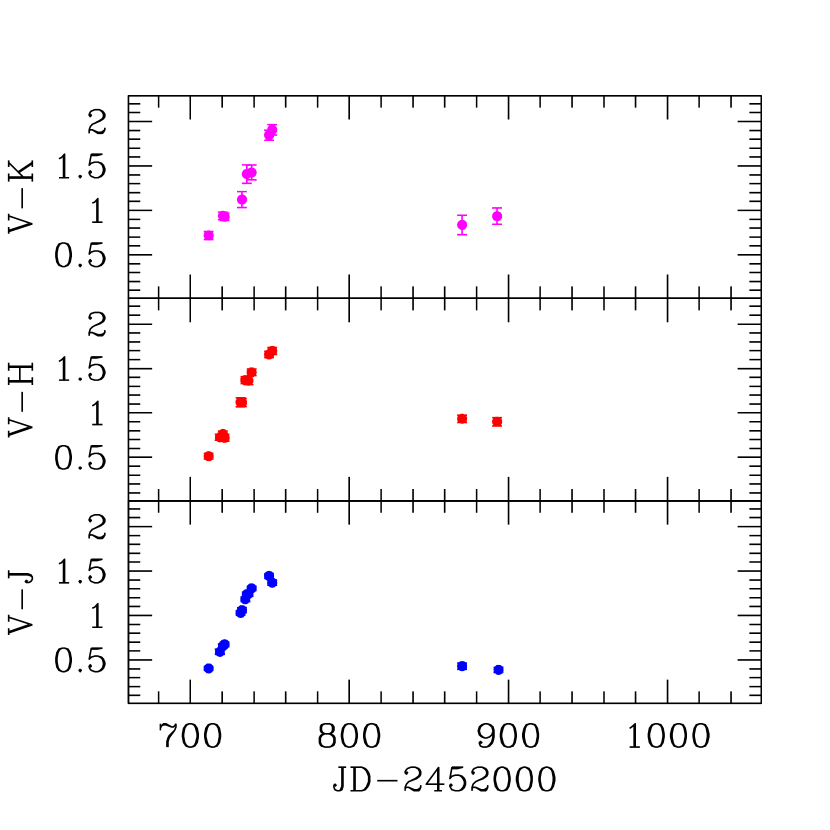
Figure 4 shows the resulting IR light curves of SN 2003bg. At these wavelengths the epoch around maximum brightness was very well sampled. The SN was found 15 days before maximum, which occurred at JD 2,452,726 1 with , , and mag. The shapes of the IR light curves are similar to those at optical wavelengths.
In Figure 5 we present the –IR colors. In all three colors, the SN evolved from blue to red through JD 2,452,740 and then became systematically bluer through the last observations on JD 2,452,900.
2.3 Spectroscopy
A total of 14 optical spectra were obtained of SN 2003bg. Table 6 gives a journal of the spectroscopic observations. The majority of our spectra were obtained with the 2.5-m du Pont telescope using the WFCCD instrument in its spectroscopic long-slit mode. A 400 line mm-1 blue grism was employed with the Tektronix pixel CCD to provide a wavelength coverage of 3800–9330 Å at a dispersion of 3.0 Å pixel-1. With the slit width used for the SN observations, this setup gave a FWHM resolution of 6.0 Å. On the 2.5-m telescope we also obtained spectra with the Las Campanas Modular Spectrograph. This instrument uses a SITe pixel CCD with 15 m pixel-1 and a 300 line mm-1 grating (blazed at 5000 Å). The resulting spectral coverage is 3780–7280 Å at a dispersion of 2.45 Å pixel-1. A slit width of was used for the SN observations, which gave a FWHM resolution of 7 Å.
On two occasions we used the 6.5-m Magellan Clay telescope with LDSS-2. For these observations, a 300 line mm-1 grism blazed at 5000 Å was employed, providing wavelength coverage of 3600–9000 Å at a dispersion of 5.3 Å pixel-1. With a slit, this translates to a FWHM resolution of Å. We also obtained a single spectrum using the Low Resolution Imaging Spectrometer (LRIS; Oke et al., 1995) on the Keck-I 10-m telescope. The D560 dichroic beamsplitter was used to split the spectrum near Å. The slit combined with the 400 line mm-1 grism blazed at 3400 Å on the blue side of the spectrograph and the 400 line mm-1 grating on the red side to give resolutions of 7 and 6 Å, respectively.
We emphasize that, with the exception of the LRIS spectrum, for none of these spectra did we employ a filter to block second-order light, which means that there could be second-order contamination redward of 6800 Å. With the WFCCD and LDSS-2 we observed the SN with the slit aligned along the parallactic angle (Filippenko, 1982) to reduce the effects of atmospheric dispersion. However, owing to a misinterpretation of the observing instructions, with the Modular Spectrograph we oriented the slit perpendicular to this angle, introducing significant errors in the relative spectrophotometry. The Keck/LRIS spectrum was obtained at a high airmass (4.2) with mediocre and variable seeing conditions, and SN 2003bg was partially vignetted by the dome shutter, so the absolute flux scale is highly uncertain. However, the slit was aligned along the parallactic angle, so the relative spectral shape is reliable.
All of the spectra were wavelength and flux calibrated using comparison lamp and standard-star observations (Hamuy et al., 1994b). No attempt was made to remove telluric absorption lines, except in the Keck/LRIS spectrum. Figures 6 and 9 show the series of spectra of SN 2003bg obtained during the photospheric and nebular phase, respectively. The wavelengths of the spectra were shifted to the SN rest frame using a heliocentric recession velocity of 1367 km s-1 measured for the host galaxy (Theureau et al., 1998). The labels to the left of the spectra indicate the rest-frame days elapsed since explosion [assumed to be on JD 2,452,695.5 (Feb 25.0) based on the spectrum fitting by Mazzali et al. (2009)]. Telluric features are indicated with the symbol. It is evident in these figures that the shape of the two spectra obtained with the Modular Spectrograph on Mar. 31 and Sep. 18 differs from that of the remaining spectra owing to the wrong orientation of the slit with respect to the parallactic angle.
We checked the spectrophotometric quality of our spectra by convolving them with the filter passbands described by Bessell (1990) and computing synthetic magnitudes. Figure 3 compares the , , and synthetic colors (open circles) with the colors computed from the observed magnitudes. In general this comparison reveals very good agreement (within 0.1 mag) between the observed and synthetic colors. The most evident discrepancies occur in (near JD 2,452,740). This is not surprising considering that we did not use an order-blocking filter in our observations and, therefore, our spectra must suffer from second-order contamination redward of 6800 Å. We note that we excluded from this comparison the two spectra obtained with the Modular Spectrograph which were not obtained along the parallactic angle.
Having checked the relative spectrophotometry of our spectra, we proceeded to combine the synthetic colors with our observed magnitudes (interpolated to the epoch of our spectroscopy)444For the first spectrum, which was obtained two days prior to the first photometric point, it proved necessary to extrapolate the -band light curve using a third-order polynomial fit to the data around maximum light in order to derive synthetic magnitudes and complement the observed light curves. The resulting synthetic magnitudes are shown with open circles in Figure 2. This plot reveals that the spectrophotometry is a very useful complement to the observed light curves, especially before maximum light.
3 ANALYSIS
3.1 Spectroscopic Analysis During the Photospheric Phase
The spectroscopic evolution of SN 2003bg is analyzed in detail in the companion paper by Mazzali et al. (2009). Here we present only a brief description of the main lines detected and the deduced velocities.
Our first spectrum, obtained on Feb. 28 with Keck/LRIS (see Figure 6), is characterized by a blue continuum and several broad P Cygni profiles. Filippenko & Chornock (2003) claimed that SN 2003bg was very similar to Type Ic hypernovae SN 1997ef, SN 1998bw, SN 2002ap, and SN 2002bl, perhaps two weeks after explosion; we see here that it was actually probably closer to just 3 days past explosion. Although one might be tempted to associate the absorption trough near 6000 Å with H having an expansion velocity of 25,000 km s-1, the model of Mazzali et al. (2009) shows that H lines make only a minor contribution at this time; instead, the 6000 Å trough is dominated by Si II 6355. Similarly, Mazzali et al. (2009) find that He lines are not easily visible at this time. In addition to Si II, there are features produced by Fe II, Co II, O I, Ca II (the near-IR triplet), and Mg II. Thus, it cannot be concluded that SN 2003bg was a SN IIb based on this spectrum alone.
By Mar. 2, H has appeared and is now comparable to (and blended with) Si II 6355 (Mazzali et al., 2009). The H expansion velocity, measured from the absorption minimum, is 19,300 km s-1; however, the blend with Si II 6355 artificially increases this over its true value. The weak feature at 5620 Å is probably He I 5876. A strong feature due to the Ca II near-IR triplet is observed around 7800–8300 Å, as well as a feature at 4780 Å which is attributed to Fe II 5018, 5169.
The spectrum obtained on Mar. 4 is generally similar to the previous one. It reveals the presence of strong, broad H emission with a P Cygni absorption component having an expansion velocity of 17,700 km s-1 at its minimum (though still probably an overestimate due to residual blending with Si II 6355, which is now weaker than H). A P Cygni absorption line corresponding to H has developed at an expansion velocity of 14,800 km s-1. Hamuy, Phillips, & Thomas-Osip (2003) noted that the overall appearance of the spectrum of SN 2003bg was similar to that of other broad-lined SNe Ic, but the presence of strong H features distinguished it, making it the first broad-lined SN II. [However, as noted below, the SN IIb 1987K (Filippenko, 1988) actually had a comparable expansion velocity at the same phase.]
On Mar. 12 (the spectrum nearest the time of maximum brightness), a prominent He I 5876 line is present with an expansion velocity of 10,900 km s-1, while the H velocity has dropped to 14,200 km s-1, close to (or perhaps even somewhat less than) that of SN IIb 1987K near maximum light (Filippenko, 1988). A prominent absorption at rest wavelength 4962 Å has emerged, possibly due to a blend of He I 5048, Fe II 5018, and Fe II 5169. The feature at 4337 Å has been identified by Mazzali et al. (2009) as a blend of He I 4471 and Mg II 4481. The Ca II near-IR triplet remains strong.
By Apr. 4 the continuum has become much redder. The Balmer lines are still present with lower expansion velocities (12,900 km s-1 for H). He I 5876 is much more conspicuous at this epoch with a velocity of 8000 km s-1. The Ca II near-IR triplet has developed an evident P Cygni profile. The spectrum obtained on Apr. 10 is the last of the photospheric phase and is not very different than the previous one.
Figure 7 compares the maximum-light spectrum of SN 2003bg with contemporaneous spectra of other core-collapse SNe (II-P, IIb, Ic unrelated to GRBs, and GRB-related Ic). Near maximum brightness, SN 2003bg stands out for its broad features compared to the typical Type II-P SN 1999em [Hamuy et al. (2001); Leonard et al. (2002); Elmhamdi et al. (2003)] and the Type IIb SN 1993J (Filippenko et al., 1993). As noted by Filippenko & Chornock (2003), the spectrum of SN 2003bg is somewhat reminiscent of that shown by the broad-lined SNe Ib/c. This can be seen in Figure 7 from the comparison with the maximum-light spectra of SN 1997ef (Garnavich et al., 1997a, b, a broad-lined supernova not associated with a GRB) and the GRB-connected SN 1998bw (Patat et al., 2001).
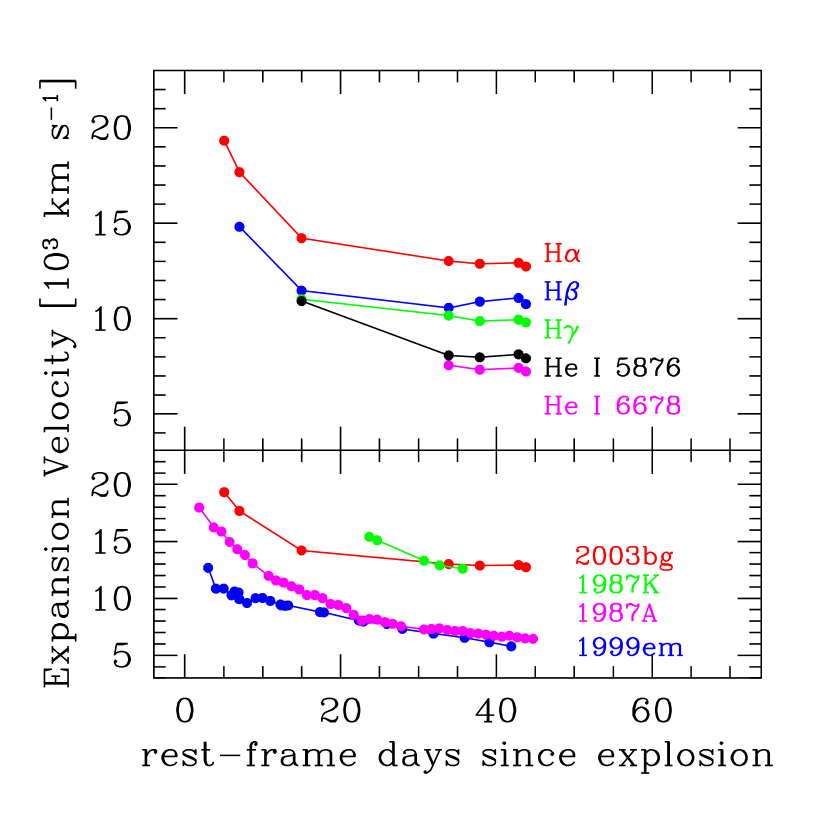
The expansion velocities for SN 2003bg during the optically thick phase measured from the minimum of the H, H, H, He I 5876, and He I 6678 absorption lines are shown in the top panel of Figure 8. We observe a rapid velocity drop during the first 20 days for the Balmer lines, followed by a leveling off between days 20 and 50, with H exhibiting much higher velocities than the other two Balmer lines throughout the photospheric phase. Both He I lines have considerably lower velocities than the H lines. The higher velocity of H is the result of saturation in that line. The weaker Balmer lines level off at a velocity of 10,000 km s-1, indicating that H is confined to velocities higher than roughly this value in the ejecta. The He lines level off at a lower velocity, 7000 km s-1, which again indicates confinement of He to velocities higher than this value. The stratification of both H and He is also confirmed by spectral modeling (Mazzali et al., 2009).
Relative to most SNe II, SN 2003bg stands out for its high expansion velocity. This can be clearly seen in the bottom of Figure 8, which compares the H velocity curve of SN 2003bg (red), the Type IIb SN 1987K [Filippenko (1988); green], the normal Type II-P SN 1999em [Hamuy et al. (2001); blue], and SN 1987A [Phillips et al. (1990); magenta]. However, note that the initial H expansion velocity of the first known SN IIb, SN 1987K, was also very high: Filippenko (1988) measured km s-1 in his first spectrum, which was obtained near maximum brightness. This value is comparable to, or even slightly exceeds, the H expansion velocity of SN 2003bg at a similar phase (March 12 spectrum, km s-1). Also, the velocity of the H absorption minimum in the spectrum of SN 1987K steadily decreased with time, as in the case of SN 2003bg. Had there been pre-maximum spectra of SN 1987K, they may well have shown H expansion velocities approaching 20,000 km s-1, close to that of SN 2003bg in the March 2 spectrum.
The rapid expansion of SN 2003bg suggests that the kinetic energy per unit mass is high. When the bolometric light curve (see Sec. 3.3) is taken into account, the models of Mazzali et al. (2009) show that the explosion kinetic energy is also very large. We conclude that (1) broad-lined spectra are not exclusive to SNe in which hydrogen is absent, and (2) SN 2003bg is the first known SN II “hypernova.”
3.2 Spectroscopic Analysis During the Nebular Phase
Our series of spectra obtained during the nebular phase is shown in Figure 9 and covers the period 176–301 days after explosion. During this timespan the evolution of SN 2003bg was slow. The most prominent features are forbidden lines such as the [Ca II] 7292, 7324 and [O I] 6300, 6363 blends, with a FWHM of 5000 km s-1. Weaker emissions due to [S II], Mg I], [Fe II], and [C I] are also present. There is no clear evidence for broad H emission from the SN. These late-time spectra are typical of SNe Ib/c such as SN 1987M (Filippenko et al., 1990; Filippenko, 1997). Thus, SN 2003bg is a transitional SN IIb, similar to SN 1993J (Filippenko et al., 1993, 1994), although with much greater initial expansion velocities than the latter.
3.3 Absolute Magnitudes and Bolometric Light Curve
In this section we derive intrinsic properties of SN 2003bg such as absolute magnitudes and the bolometric light curve. The first step involves correcting the observed magnitudes for Galactic extinction, for which we adopt mag (Schlegel, Finkbeiner, & Davis, 1998) and the standard reddening law () given by Cardelli, Clayton, & Mathis (1989).
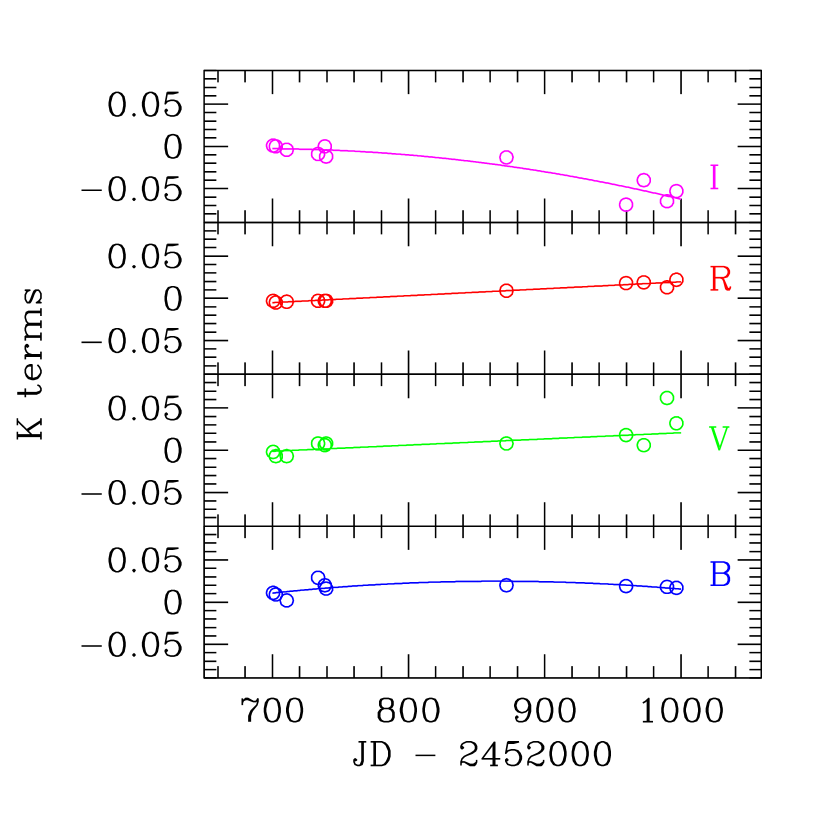
The second step corrects the magnitudes for redshift-related effects (K-terms). We use the definition appropriate for photon-counting systems given by Schneider, Gunn, & Hoessel (1983), our spectra corrected for Galactic extinction (excluding the data obtained with the Modular Spectrograph), and the filter passbands described by Bessell (1990). The resulting K-terms for km s-1 are shown in Figure 10 as a function of JD. Given the small redshift, the K-terms are small and exhibit a slow variation with time. We use the cubic polynomial fits shown in this figure to interpolate the K-terms to the time of our optical photometry. The lack of IR spectra, on the other hand, prevents us from K-correcting our magnitudes of SN 2003bg. We believe the error introduced must be small owing to the small redshift of the SN.
The third step involves correcting the magnitudes for host-galaxy extinction. Examination of our spectra reveals no presence of interstellar absorption lines of Na I D and Ca II H & K at the redshift of the galaxy, suggesting no significant extinction. Thus, we neglected such correction. The fourth and last step is to assume a distance modulus, for which we adopt mag (Kelson et al., 2000).
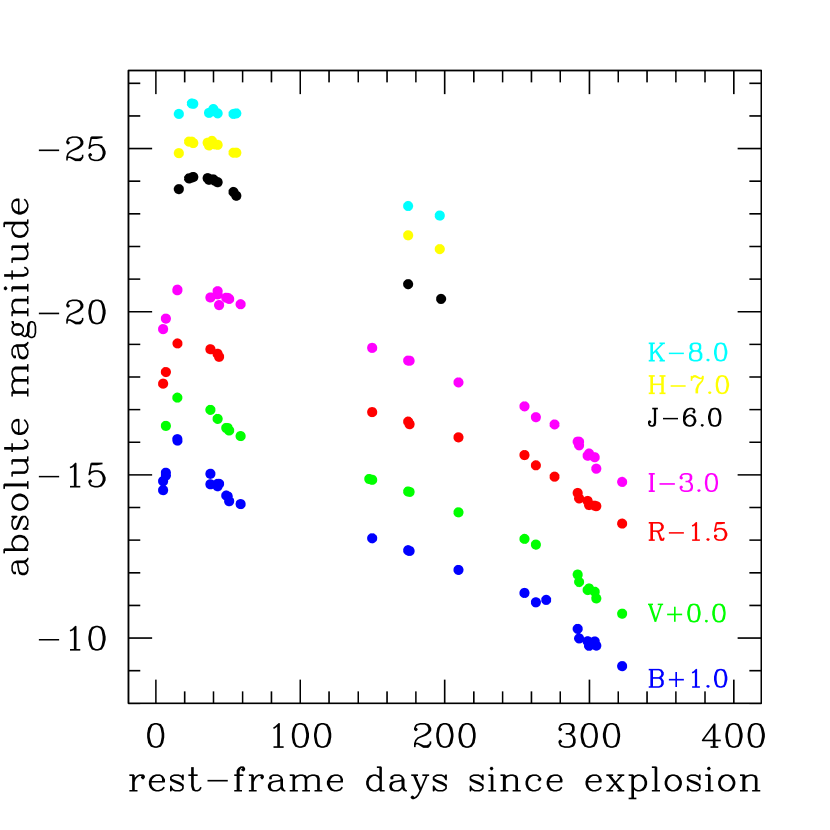
Figure 11 displays the resulting absolute magnitudes as a function of rest-frame days since explosion (assumed to be on JD 2,452,695.5). The absolute peak magnitude of does not stand out compared with other core-collapse SNe. Since the light curve is powered by the 56Ni 56Co 56Fe decay chain, this luminosity implies that the amount of Ni synthesized in the explosion was not particularly large, despite the high expansion velocities shown by SN 2003bg.
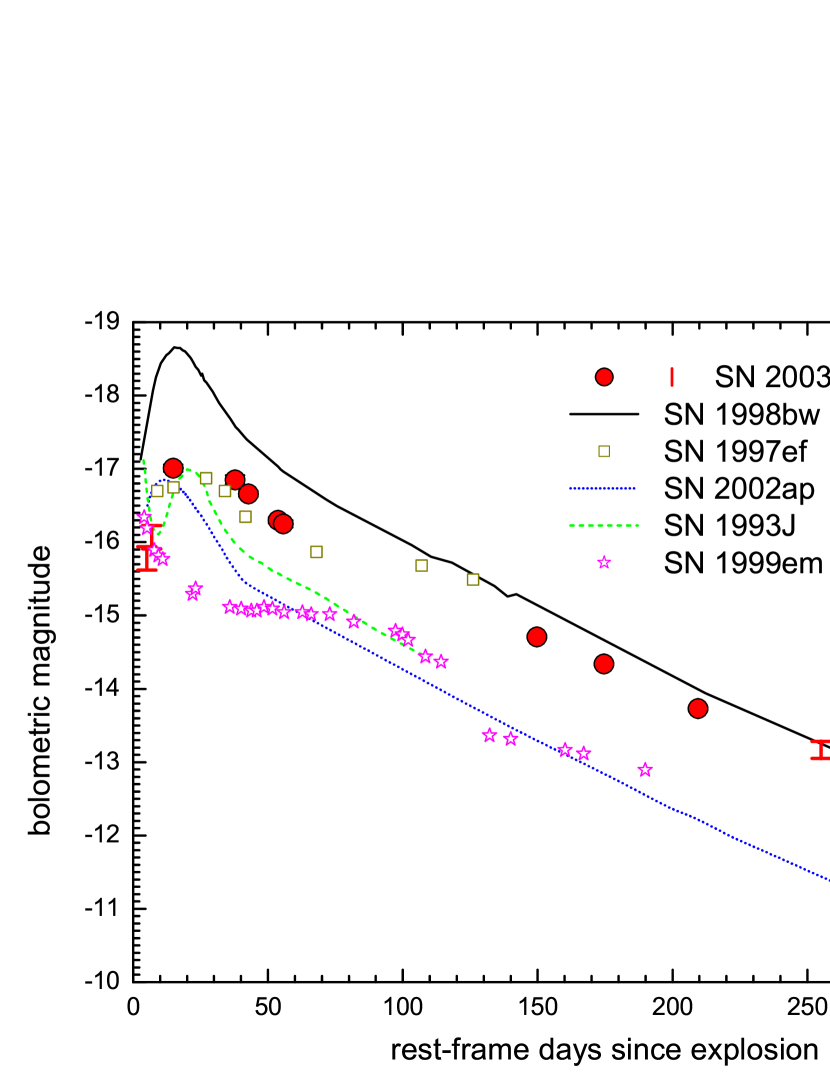
Bolometric magnitudes at day 15 and between days 37 and 210 (Figure 12; circles) were calculated using our photometry. A spectral energy distribution (SED) was built for each epoch after converting the observed broad-band magnitudes into monochromatic fluxes, using the conversion factors and effective frequencies of Bessell (2005). The SED was then integrated to obtain the bolometric flux. No bolometric magnitude was estimated in the data gap (between days 15 and 37), where the light maximum must lie. Before day 15, only the ranges of bolometric fluxes were given (vertical lines).
The lower limits were derived by integrating fluxes only, while the upper limits were found by adding the same amount of NIR contribution as at day 15 ( 25%). Both were then shifted by an extra mag to account for some -band contribution which is possibly for a SN Ib/c (Yoshii et al., 2003). Since at late times the NIR flux percentage increases as a SN evolves, the value at day 210 (34%) was used for any later epoch to get the lower bolometric limit. For the late-time upper limits, we took the most conservative approach of assuming a 56Co decay law from day 210 onward. The resulting luminosities are listed in Table 7.
Figure 12 shows the bolometric light curve of SN 2003bg (red circles and verticle bars), compared with those of other types of core-collapse SNe (II-P, IIb, Ic unrelated to GRB, and GRB-related Ic). Near maximum, SN 2003bg was nearly 1.5 dex fainter than the GRB-connected Type Ic SN 1998bw [black solid line, Patat et al. (2001)], and similar in luminosity to the Type Ic SNe 1997ef [dark yellow squares, Mazzali et al. (2000, 2004)] and 2002ap [blue dotted line, (Tomita et al., 2006)], both of which were hypernovae not associated with GRBs. This suggests a normal (0.1–0.2 M⊙) Ni production in SN 2003bg, relative to other hypernovae not associated with GRBs. At late times, however, SN 2003bg appears as luminous as SN 1998bw and much brighter than SN 2002ap. Relative to all of these objects, SN 2003bg stands out for its broad light curve, a possible indication of a larger than normal ejecta mass. Compared to the non-hypernova Type IIb SN 1993J [green dashed line, Wada & Ueno (1997)], SN 2003bg was more luminous, especially at late times. The light curve is very different in shape and brighter than that of the typical Type II-P SN 1999em [magenta stars; Elmhamdi et al. (2003)].
4 DISCUSSION AND CONCLUSIONS
Our early-time spectroscopic observations of SN 2003bg revealed the presence of Balmer lines. The nebular-phase spectra, on the other hand, showed a remarkable spectroscopic resemblance to Type Ib/c events, without clear evidence for hydrogen. These observations and the corresponding modeling of Mazzali et al. (2009) indicate a progenitor star with a hydrogen shell containing only 0.05 M⊙, similar in mass to the Type IIb SN 1993J (Shigeyama et al., 1994).
This picture is consistent with the radio model of Soderberg et al. (2006), which implies a dense circumstellar medium (CSM) caused by the large mass-loss rate from the progenitor. Soderberg et al. (2006) proposed that the bumps in the radio light curve of SN 2003bg were due to a variable Wolf-Rayet (WR) wind, but no physical mechanism for such variations was proposed. But Kotak & Vink (2006) instead suggested that these episodic bumps could be due to a variable wind of a luminous blue variable star (LBV) with a recurrence timescale of 25 years, qualitatively similar to the modulations seen in the hypernova SN 1998bw. The transitional character of SN 2003bg as a Type IIb supernova reported here implies a rather limited amount of H, consistent with an LBV scenario, as LBV atmospheres are H-rich compared with WR stars, but He-rich compared to OB stars and red supergiants (Kotak & Vink, 2006).
The expansion velocities inferred from the Balmer lines were initially at the level of 20,000 km s-1, though closer to 14,000 km s-1 near maximum brightness; this is almost unprecedented for SNe II (the notable exception being SN IIb 1987K; Filippenko, 1988). The first spectra bear resemblance to the broad-lined SNe Ib and SNe Ic such as SN 1997ef. This suggests a larger than normal kinetic energy per unit mass for a Type II event. In fact, when the bolometric light curve is taken into account, the total kinetic energy of the ejecta is found to be large; the models of Mazzali et al. (2009) yield ergs, which is well above that of normal core-collapse SNe ( ergs) although definitely less than that of the GRB-related SN 1998bw. Thus, SN 2003bg can be described as the first known Type IIb hypernova.
Near maximum brightness, SN 2003bg displayed a luminosity comparable to that of other GRB-unrelated Type I hypernovae, implying a rather normal amount of 56Ni production (0.1–0.2 M⊙). The light curve of SN 2003bg, on the other hand, is remarkably broad, thus suggesting a relatively large progenitor mass at the moment of explosion. In fact, the models in the accompanying paper by Mazzali et al. (2009) find that SN 2003bg ejected 4 M⊙ of material. This value, combined to the evolutionary models of Nomoto & Hashimoto (1988) suggests a ZAMS mass for the progenitor star of 20–25 M⊙. The uncertainty on these values depends primarily on the uncertain amount of mass loss the star suffers during its evolution, which can affect the growth of the He core. These conclusions are qualitatively consistent with the mass-energy relation reported in the literature for core-collapse SNe (Hamuy, 2003; Nomoto et al., 2005, for SNe II and SNe Ib/c, respectively).
References
- Allington-Smith et al. (1994) Allington-Smith, J., et al. 1994, PASP, 106, 983
- Bessell (1990) Bessell, M. S. 1990, PASP, 102, 1181
- Bessell (2005) Bessell, M. S., 2005, ARA&A, 43, 293
- Cardelli, Clayton, & Mathis (1989) Cardelli, J. A., Clayton, G. C., & Mathis, J. S. 1989, ApJ, 345, 245
- Chassagne (2003) Chassagne, R. 2003, IAUC 8082
- Elias et al. (1985) Elias, J. H., Matthews, K., Neugebauer, G., & Persson, S. E. 1985, ApJ, 296, 379
- Elmhamdi et al. (2003) Elmhamdi, A., et al. 2003, MNRAS, 338, 939
- Filippenko (1982) Filippenko, A. V. 1982, PASP, 94, 715
- Filippenko (1988) Filippenko, A. V. 1988, AJ, 96, 1941
- Filippenko (1997) Filippenko, A. V. 1997, ARAA, 35, 309
- Filippenko & Chornock (2003) Filippenko, A. V., & Chornock, R. 2003, IAUC 8084
- Filippenko et al. (1994) Filippenko, A. V., Matheson, T., & Barth, A. J. 1994, AJ, 108, 2220
- Filippenko et al. (1993) Filippenko, A. V., Matheson, T., & Ho, L. C. 1993, ApJ, 415, L103
- Filippenko et al. (1990) Filippenko, A. V., Porter, A. C., & Sargent, W. L. W. 1990, AJ, 100, 1575
- Galama et al. (1998) Galama, T. J., et al. 1998, Nature, 395, 670
- Garnavich et al. (1997b) Garnavich, P., Jha, S., Kirshner, R., Challis, P., Balam, D., Berlind, P., Thorstensen, J., & Macri, L. (1997b), IAUC 6798
- Garnavich et al. (1997a) Garnavich, P., Jha, S., Kirshner, R., Challis, P., Balam, D., Brown, W., & Briceno, C. (1997a), IAUC 6786
- Hamuy (2003) Hamuy, M. 2003, ApJ, 582, 905
- Hamuy, Phillips, & Thomas-Osip (2003) Hamuy, M., Phillips, M., & Thomas-Osip, J. 2003, IAUC 8088
- Hamuy et al. (1994b) Hamuy, M., Suntzeff, N. B., Heathcote, S. R., Walker, A. R., Gigoux, P., & Phillips, M. M. 1994b, PASP, 106, 566
- Hamuy et al. (2001) Hamuy, M., et al. 2001, ApJ, 558, 615
- Hamuy et al. (2006) Hamuy, M., et al. 2006, PASP, 118, 2
- Hamuy et al. (2009) Hamuy, M., et al. 2009, in preparation
- Iwamoto et al. (1998) Iwamoto, K., et al. 1998, Nature, 395, 672
- Kelson et al. (2000) Kelson, D. D., et al. 2000, ApJ, 529, 768
- Kotak & Vink (2006) Kotak., R., & Vink, J. S. 2006, A&A, 460, L5
- Landolt (1992) Landolt, A. U. 1992, AJ, 104, 340
- Leonard et al. (2002) Leonard, D. C., et al. 2002, PASP, 114, 35 [Erratum: 114, 1291 (2002)]
- Lucy (1991) Lucy, L. B. 1991, ApJ, 383, 308
- Mazzali et al. (2009) Mazzali, P. A., Deng, J., Hamuy, M., & Nomoto, K. 2009, ApJ, accepted
- Mazzali et al. (2004) Mazzali, P. A., Deng, J., Maeda, K., Nomoto, K., Filippenko, A. V., & Matheson, T. 2004, ApJ, 614 ,858
- Mazzali et al. (2000) Mazzali, P. A., Iwamoto, K., & Nomoto, K. 2000, ApJ, 545 ,407
- Mazzali et al. (2007) Mazzali, P. A., Nomoto, K., Maeda, K., & Deng, J. 2007, in Supernova 1987A: 20 Years After, ed. S. Immler, K. W. Weiler, & R. McCray (New York: AIP), 443
- Mazzali et al. (2006) Mazzali, P. A., et al. 2006, Nature, 442, 1018
- Mazzali et al. (2008) Mazzali, P. A., et al. 2008, Science, 321, 1185
- Nomoto & Hashimoto (1988) Nomoto, K., & Hashimoto, M. 1988, Phys. Rep. 163, 13
- Nomoto et al. (1994b) Nomoto, K. I., Iwamoto, K., & Suzuki, T. 1994, Phys. Rep., 256, 173
- Nomoto et al. (1994a) Nomoto, K., Yamaoka, H., Pols, O. R., van der Heuvel, E. P. J., Iwamoto, K., Kumagai, S., & Shigeyama, T. 1994, Nature, 371, 227
- Nomoto et al. (2005) Nomoto, K., Maeda, K., Tominaga, N., Ohkubo, T., Deng, J., & Mazzali, P. A. 2005, Ap&SS, 298, 81
- Oke et al. (1995) Oke, J. B., et al. 1995, PASP, 107, 375
- Patat et al. (2001) Patat, F., et al. 2001, ApJ, 555, 900
- Persson et al. (2002) Persson, S. E., Murphy, D. C., Gunnels, S. M., Birk, C., Bagish, A., & Koch, E. 2002, AJ, 124, 619
- Persson et al. (1998) Persson, S. E., Murphy, D. C., Krzeminski, W., Roth, M., & Rieke, M. J. 1998, AJ, 116, 2475
- Phillips et al. (1990) Phillips, M. M., Hamuy, M., Heathcote, S. R., Suntzeff, N. B., & Kirhakos, S. 1990, AJ, 99, 1133
- Porter & Filippenko (1987) Porter, A. C., & Filippenko, A. V. 1987, AJ, 93, 1372
- Schlegel, Finkbeiner, & Davis (1998) Schlegel, D. J., Finkbeiner, D. P., & Davis, M. 1998, ApJ, 500, 525
- Schneider, Gunn, & Hoessel (1983) Schneider, D. P., Gunn, J. E., & Hoessel, J. G 1983, ApJ, 264, 337
- Shigeyama et al. (1994) Shigeyama, T., Suzuki, T., Kumagai, S., Nomoto, K., Saio, H., & Yamaoka, H. 1994, ApJ, 420, 341
- Skrutskie et al. (2006) Skrutskie, M. F., et al. 2006, AJ, 131, 1163
- Soderberg et al. (2006) Soderberg, A. M., Chevalier, R. A., Kulkarni, S. R., & Frail, D. A. 2006, ApJ, 651, 1005
- Soderberg et al. (2008) Soderberg, A. M., et al. 2008, Nature, 453, 469
- Suntzeff & Bouchet (1990) Suntzeff, N. B., & Bouchet, P. 1990, AJ, 99, 650
- Svoboda (1987) Svoboda, R. 1987, IAUC 4340
- Swartz et al. (1993) Swartz, D. A., Clocchiatti, A., Benjamin, R., Lester, D. F., & Wheeler, J. C. 1993, Nature, 365, 232
- Theureau et al. (1998) Theureau, G., Bottinelli, L., Coudreau-Durand, N., Gouguenheim, L., Hallet, N., Loulergue, M., Paturel, G., & Teerikorpi, P. 1998, A&AS, 130, 333
- Tomita et al. (2006) Tomita, H., et al. 2006, ApJ, 644, 400
- Wada & Ueno (1997) Wada, T., & Ueno, M. 1997, AJ, 113, 231
- Wheeler & Harkness (1986) Wheeler, J. C., & Harkness, R. P. 1986, in Galaxy Distances and Deviations from Universal Expansion, ed. B. F. Madore & R. B. Tully (Dordrecht: Reidel), 45
- Wheeler et al. (1987) Wheeler, J. C., Harkness, R. P., Barker, E. S., Cochran, A. L., & Wills, D. 1987, ApJ, 313, L69
- Yoshii et al. (2003) Yoshii, Y., et al. 2003, ApJ, 592, 467
| Date (UT) | Telescope | Spectroscopy/ | Weather | ObserversaaRC: Ryan Chornock, AF: Alex Filippenko, LG: Luis González, SG: Sergio Gonzalez, MH: Mario Hamuy, LH: Leonor Huerta, kk: Kathleen Koviak, KK: Kevin Krisciunas, JM: José Maza, NM: Nidia Morrell, MP: Mark Phillips, MR: Miguel Roth, JT-O: Joanna Thomas-Osip. |
|---|---|---|---|---|
| Photometry? | ||||
| 2003 Feb 28 | Keck I | Spec | ClearbbSN 2003bg was observed at very high airmass and was partially vignetted by the dome shutter. | AF/RC |
| 2003 Mar 02 | du Pont | Phot | Clear | MR/NM |
| 2003 Mar 02 | du Pont | Spec | Clear | MR/NM |
| 2003 Mar 03 | du Pont | Phot | Clear | MP |
| 2003 Mar 04 | du Pont | Phot | Clear | MP |
| 2003 Mar 04 | du Pont | Spec | Clear | MP |
| 2003 Mar 12 | du Pont | Phot | Clear | MP/MR/NM |
| 2003 Mar 12 | du Pont | Spec | Clear | MP/MR/NM |
| 2003 Mar 13 | du Pont | Phot | Cirrus | MR |
| 2003 Mar 20 | du Pont | Phot | Clear | NM |
| 2003 Mar 22 | du Pont | Phot | Clear | NM |
| 2003 Mar 23 | du Pont | Phot | Clouds | NM |
| 2003 Mar 31 | du Pont | Spec | Clear | MH |
| 2003 Apr 02 | Swope | Phot | Clear | MH |
| 2003 Apr 03 | Swope | Phot | Clear | MH |
| 2003 Apr 04 | du Pont | Phot | Clear | JM/LH |
| 2003 Apr 04 | du Pont | Spec | Clear | JM/LH |
| 2003 Apr 05 | Swope | Phot | Clear | MH |
| 2003 Apr 06 | Swope | Phot | Clear | MH |
| 2003 Apr 07 | Swope | Phot | Clear | MH |
| 2003 Apr 09 | Swope | Phot | Clear | MH |
| 2003 Apr 09 | du Pont | Phot | Clear | JM/LH |
| 2003 Apr 09 | du Pont | Spec | Clear | JM/LH |
| 2003 Apr 10 | Clay | Phot | Clear | MH |
| 2003 Apr 10 | Clay | Spec | Clear | MH |
| 2003 Apr 15 | CTIO 0.9-m | Phot | Cirrus | LG |
| 2003 Apr 16 | Swope | Phot | Cirrus | SG |
| 2003 Apr 16 | CTIO 0.9-m | Phot | Cirrus? | LG |
| 2003 Apr 17 | CTIO 0.9-m | Phot | Cirrus? | LG |
| 2003 Apr 20 | du Pont | Phot | Clear | MP/NM |
| 2003 Apr 22 | du Pont | Phot | Clear | MP |
| 2003 Apr 25 | Swope | Phot | Cirrus | JT-O/NM |
| 2003 Jul 23 | Swope | Phot | Clouds | LG |
| 2003 Jul 25 | Swope | Phot | Clear | SG/LG |
| 2003 Aug 19 | du Pont | Phot | Clear | NM |
| 2003 Aug 19 | Swope | Phot | Clear | KK |
| 2003 Aug 20 | du Pont | Phot | Cirrus | NM |
| 2003 Aug 20 | du Pont | Spec | Cirrus | NM |
| 2003 Sep 10 | du Pont | Phot | Clear | kk |
| 2003 Sep 11 | du Pont | Phot | Clear | kk |
| 2003 Sep 18 | du Pont | Spec | Cirrus | NM |
| 2003 Sep 23 | Swope | Phot | Clear | LG |
| 2003 Nov 08 | Swope | Phot | Clear | SG |
| 2003 Nov 16 | Clay | Phot | Clouds | NM |
| 2003 Nov 16 | Clay | Spec | Clouds | NM |
| 2003 Nov 16 | Swope | Phot | Clouds | KK |
| 2003 Nov 23 | Swope | Phot | Cirrus | LG |
| 2003 Nov 29 | du Pont | Spec | Clear | MR |
| 2003 Dec 15 | Swope | Phot | Clear | SG |
| 2003 Dec 16 | du Pont | Phot | Clear | MH |
| 2003 Dec 16 | du Pont | Spec | Clear | MH |
| 2003 Dec 22 | Swope | Phot | Clear | SG |
| 2003 Dec 23 | du Pont | Phot | Clear | NM |
| 2003 Dec 23 | du Pont | Spec | Clear | NM |
| 2003 Dec 27 | Swope | Phot | Clear | SG |
| 2003 Dec 28 | Swope | Phot | Clear | SG |
| 2004 Jan 15 | Swope | Phot | Clear | LG |
| 2004 Nov 11 | du Pont | Phot | Cirrus | NM |
| 2005 Feb 13 | du Pont | Phot | Cirrus | NM |
| Star | (mag) | (mag) | (mag) | (mag) |
|---|---|---|---|---|
| c1 | 16.623(013) | 16.051(006) | 15.708(009) | 15.366(005) |
| c2 | 16.472(012) | 15.632(007) | 15.106(008) | 14.637(005) |
| c3 | 17.937(014) | 16.891(008) | 16.238(011) | 15.702(005) |
| c4 | 18.276(015) | 17.707(008) | 17.349(010) | 17.019(010) |
| c5 | 19.841(012) | 18.386(007) | 17.443(012) | 16.496(006) |
| c6 | 18.615(014) | 17.927(008) | 17.530(009) | 17.128(009) |
| c7 | 19.756(013) | 19.310(013) | 18.960(017) | 18.539(020) |
| c8 | 21.175(050) | 19.745(025) | 18.821(010) | 17.927(014) |
| c9 | 17.661(009) | 16.685(009) | 16.090(009) | 15.596(005) |
| c10 | 20.547(029) | 19.442(026) | 18.717(010) | 18.071(015) |
Note. — Uncertainties given in parentheses in thousandths of a magnitude, corresponding to the root-mean square of the magnitudes obtained on eight photometric nights, with an uncertainty of 0.015 mag for an individual measurement.
| Date (UT) | JD2,400,000 | (mag) | (mag) | (mag) | (mag) | Method | Telescope |
|---|---|---|---|---|---|---|---|
| 2003 Mar 02 | 52700.6 | 15.979(017) | DAO | du Pont | |||
| 2003 Mar 02 | 52700.6 | 16.252(100) | 15.436(100) | 15.252(100) | SYN | du Pont | |
| 2003 Mar 04 | 52702.5 | 15.720(024) | 15.244(012) | DAO | du Pont | ||
| 2003 Mar 04 | 52702.5 | 15.803(100) | 15.077(100) | 14.930(100) | SYN | du Pont | |
| 2003 Mar 12 | 52710.5 | 14.692(017) | 14.380(023) | 14.062(028) | DAO | du Pont | |
| 2003 Mar 12 | 52710.6 | 14.735(100) | 14.204(100) | 14.041(100) | SYN | du Pont | |
| 2003 Apr 04 | 52733.5 | 15.751(012) | 14.756(018) | DAO | du Pont | ||
| 2003 Apr 04 | 52733.5 | 16.071(100) | 14.382(100) | 14.277(100) | SYN | du Pont | |
| 2003 Apr 09 | 52738.5 | 16.132(028) | 15.033(025) | 14.082(031) | DAO | du Pont | |
| 2003 Apr 09 | 52738.5 | 16.061(100) | 14.523(100) | 14.179(100) | SYN | du Pont | |
| 2003 Apr 10 | 52739.5 | 16.059(100) | 14.614(100) | 14.508(100) | SYN | Clay | |
| 2003 Apr 15 | 52744.5 | 16.418(016) | 15.312(014) | 14.282(014) | DAO | CTIO 0.9-m | |
| 2003 Apr 16 | 52745.5 | 15.315(014) | 14.292(014) | DAO | CTIO 0.9-m | ||
| 2003 Apr 16 | 52745.5 | 16.445(016) | 15.322(014) | 14.287(014) | DAO | Swope | |
| 2003 Apr 17 | 52746.5 | 16.590(040) | 15.389(014) | 14.320(014) | DAO | CTIO 0.9-m | |
| 2003 Apr 25 | 52754.5 | 16.679(016) | 15.563(014) | 14.481(014) | DAO | Swope | |
| 2003 Jul 23 | 52843.9 | 16.888(014) | DAO | Swope | |||
| 2003 Jul 25 | 52845.9 | 17.730(017) | 16.914(014) | 16.319(015) | 15.800(014) | DAO | Swope |
| 2003 Aug 19 | 52870.9 | 18.098(016) | 17.276(016) | 16.611(018) | 16.184(014) | DAO | Swope |
| 2003 Aug 20 | 52871.9 | 17.287(025) | DAO | du Pont | |||
| 2003 Aug 20 | 52871.9 | 18.121(100) | 16.691(100) | 16.191(100) | SYN | du Pont | |
| 2003 Sep 23 | 52905.9 | 18.700(016) | 17.918(015) | 17.097(022) | 16.846(016) | DAO | Swope |
| 2003 Nov 08 | 52951.8 | 19.409(041) | 18.737(030) | 17.643(018) | 17.571(023) | DAO | Swope |
| 2003 Nov 16 | 52959.7 | 18.911(044) | DAO | Swope | |||
| 2003 Nov 16 | 52959.7 | 19.695(100) | 17.960(100) | 17.901(100) | SYN | Clay | |
| 2003 Nov 23 | 52966.9 | 19.623(107) | DAO | Swope | |||
| 2003 Nov 29 | 52972.7 | 18.309(100) | 18.121(100) | SYN | du Pont | ||
| 2003 Dec 15 | 52988.8 | 20.509(057) | 19.835(052) | 18.809(024) | 18.647(040) | DAO | Swope |
| 2003 Dec 16 | 52989.8 | 20.062(076) | 18.648(044) | DAO | du Pont | ||
| 2003 Dec 16 | 52989.8 | 20.803(100) | 18.976(100) | 18.758(100) | SYN | du Pont | |
| 2003 Dec 22 | 52995.7 | 20.890(061) | 20.307(060) | 19.054(028) | 19.075(058) | DAO | Swope |
| 2003 Dec 23 | 52996.7 | 20.262(049) | DAO | du Pont | |||
| 2003 Dec 23 | 52996.7 | 21.030(100) | 19.179(100) | 19.009(100) | SYN | du Pont | |
| 2003 Dec 27 | 53000.6 | 20.894(060) | 20.361(056) | 19.198(025) | 19.122(044) | DAO | Swope |
| 2003 Dec 28 | 53001.7 | 21.023(048) | 20.567(064) | 19.214(032) | 19.472(068) | DAO | Swope |
| 2004 Jan 15 | 53019.7 | 21.652(079) | 21.036(070) | 19.750(020) | 19.876(048) | DAO | Swope |
Note. — DAO and SYN mean PSF and synthetic photometry, respectively; uncertainties are given in parentheses in thousandths of a magnitude.
| Date (UT) | JD2,400,000 | (mag) | (mag) | (mag) | Telescope |
|---|---|---|---|---|---|
| 2003 Mar 13 | 52711.56 | 13.936(023) | 13.827(030) | 13.622(045) | du Pont |
| 2003 Mar 20 | 52718.59 | 13.609(029) | 13.474(033) | du Pont | |
| 2003 Mar 22 | 52720.53 | 13.584(023) | 13.477(033) | 13.301(043) | du Pont |
| 2003 Mar 23 | 52721.55 | 13.565(025) | 13.520(039) | 13.312(042) | du Pont |
| 2003 Apr 02 | 52731.55 | 13.601(026) | 13.510(051) | Swope | |
| 2003 Apr 03 | 52732.52 | 13.650(028) | 13.592(044) | 13.588(089) | Swope |
| 2003 Apr 05 | 52734.52 | 13.638(025) | 13.451(039) | Swope | |
| 2003 Apr 06 | 52735.52 | 13.641(023) | 13.471(104) | Swope | |
| 2003 Apr 07 | 52736.52 | 13.679(025) | 13.557(046) | Swope | |
| 2003 Apr 09 | 52738.50 | 13.724(024) | 13.573(036) | 13.603(083) | Swope |
| 2003 Apr 20 | 52749.50 | 14.025(026) | 13.812(034) | 13.623(057) | du Pont |
| 2003 Apr 22 | 52751.48 | 14.141(029) | 13.812(040) | 13.603(059) | du Pont |
| 2003 Aug 19 | 52870.92 | 16.850(036) | 16.346(040) | 16.443(110) | du Pont |
| 2003 Sep 10 | 52892.90 | 16.768(047) | 16.736(092) | du Pont | |
| 2003 Sep 11 | 52893.82 | 17.302(028) | du Pont |
Note. — Uncertainties given in parentheses in thousandths of a magnitude.
| Date (UT) | JD | aaTime of explosion assumed to be on JD 2,452,695.5. | Instrument | Wavelength | Resolution | Exposure |
|---|---|---|---|---|---|---|
| 2,400,000 | (days) | Range (Å) | (Å) | (s) | ||
| 2003 Feb 28 | 52698.83 | 3.3 | LRIS | 3200–9420 | 6 | 180 |
| 2003 Mar 02 | 52700.58 | 5.0 | WFCCD | 3800–9330 | 6 | 1200 |
| 2003 Mar 04 | 52702.54 | 7.0 | WFCCD | 3800–9330 | 6 | 1200 |
| 2003 Mar 12 | 52710.55 | 15.1 | WFCCD | 3800–9330 | 6 | 1200 |
| 2003 Mar 31 | 52729.53 | 34.0 | Mod. Spec. | 3780–7280 | 7 | 600 |
| 2003 Apr 04 | 52733.54 | 38.0 | WFCCD | 3800–9330 | 6 | 600 |
| 2003 Apr 09 | 52738.53 | 43.0 | WFCCD | 3800–9330 | 6 | 300 |
| 2003 Apr 10 | 52739.49 | 44.0 | LDSS-2 | 3600–9000 | 14 | 300 |
| 2003 Aug 20 | 52871.89 | 176.4 | WFCCD | 3800–9330 | 6 | 900 |
| 2003 Sep 18 | 52900.90 | 205.4 | Mod. Spec. | 3780–7280 | 7 | 900 |
| 2003 Nov 16 | 52959.74 | 264.2 | LDSS-2 | 3600–9000 | 14 | 900 |
| 2003 Nov 29 | 52972.73 | 277.2 | WFCCD | 4040–9330 | 6 | 1800 |
| 2003 Dec 16 | 52989.79 | 294.3 | WFCCD | 3800–9330 | 6 | 1800 |
| 2003 Dec 23 | 52996.72 | 301.2 | WFCCD | 3800–9330 | 6 | 1800 |
| Bolometric | Error | Middle of Upper | Error | |
|---|---|---|---|---|
| (days) | Magnitude | & Lower Limit | ||
| 5.05 | 15.78 | 0.16 | ||
| 6.94 | 16.07 | 0.16 | ||
| 14.91 | 17.01 | 0.05 | ||
| 37.80 | 16.85 | 0.06 | ||
| 42.78 | 16.66 | 0.04 | ||
| 53.70 | 16.30 | 0.04 | ||
| 55.70 | 16.25 | 0.05 | ||
| 149.69 | 14.71 | 0.03 | ||
| 174.58 | 14.34 | 0.02 | ||
| 209.42 | 13.73 | 0.03 | ||
| 255.11 | 13.17 | 0.12 | ||
| 262.98 | 12.99 | 0.22 | ||
| 291.94 | 12.43 | 0.49 | ||
| 298.81 | 12.21 | 0.64 | ||
| 303.69 | 12.15 | 0.66 | ||
| 304.79 | 12.08 | 0.73 | ||
| 322.70 | 11.73 | 0.89 |
Note. — Adopted values:
mag, mag;
Mpc;
JD 2,452,695.5.