Hadron Production in Heavy Ion Collisions
Helmut Oeschler
Institut für Kernphysik
Darmstadt University of Technology
64289 Darmstadt, Germany
Hans Georg Ritter and Nu Xu
Nuclear Science Division
Lawrence Berkeley National Laboratory
Berkeley, Ca 94720, USA
1 Introduction
Heavy ion collisions are an ideal tool to explore the QCD phase diagram. The goal is to study the equation of state (EOS) and to search for possible in-medium modifications of hadrons. By varying the collision energy a variety of regimes with their specific physics interest can be studied. At energies of a few GeV per nucleon, the regime where experiments were performed first at the Berkeley Bevalac and later at the Schwer-Ionen-Synchrotron (SIS) at GSI in Darmstadt, we study the equation of state of dense nuclear matter and try to identify in-medium modifications of hadrons. Towards higher energies, the regime of the Alternating Gradient Synchrotron (AGS) at the Brookhaven National Laboratory (BNL), the Super-Proton Synchrotron (SPS) at CERN, and the Relativistic Heavy Ion Collider (RHIC) at BNL, we expect to produce a new state of matter, the Quark-Gluon Plasma (QGP). The physics goal is to identify the QGP and to study its properties.
By varying the energy, different forms of matter are produced. At low energies we study dense nuclear matter, similar to the type of matter neutron stars are made of. As the energy is increased the main constituents of the matter will change. Baryon excitations will become more prevalent (resonance matter). Eventually we produce deconfined partonic matter that is thought to be in the core of neutron stars and that existed in the early universe.
At low energies a great variety of collective effects is observed and a rather good understanding of the particle production has been achieved, especially that of the most abundantly produced pions and kaons. Many observations can be interpreted as time-ordered emission of various particle species. It is possible to determine, albeit model dependent, the equation of state of nuclear matter. We also have seen indications, that the kaon mass, especially the mass of the K+, might be modified by the medium created in heavy ion collisions.
At AGS energies and above, emphasis shifts towards different aspects. Lattice QCD calculations [1, 2] predict the transition between a Quark-Gluon Plasma and a hadronic state at a critical temperature, , of about 150 to 190 MeV at vanishing baryon density. The energy density at the transition point is about GeV/fm3. It is generally assumed that chiral symmetry restoration happens simultaneously [1].
In the high-energy regime, especially at RHIC, a rich field of phenomena [3] has revealed itself. Hot and dense matter with very strong collectivity has been created. There are indications that collectivity develops at the parton level, i.e. at a very early stage of the collision, when the constituents are partons rather than hadrons. Signs of pressure driven collective effects are our main tool for the study of the EOS. There are also strong indications that in the presence of a medium hadronization occurs through the process of quark coalescence and not through quark fragmentation, the process dominant for high-energy p+p reactions.
We limit this report to the study of hadrons emitted in heavy ion reactions. The report is divided into two parts. The first part describes the phenomena observed from hadrons produced at low energies, whereas the second part concentrates on the search for signs of a partonic state at high energies.
2 Hadron Production below 2 A GeV
In the discussion of particle production in heavy ion collisions below 2 GeV we focus on the most abundantly produced particles, pions and kaons. Pion production is the dominant channel for particle emission, while kaon emission is a rare process. Kaons are produced during the high-density phase. Therefore, kaons are considered as ideal probes for the hot and dense fireball.
In fixed-target p+p collisions the threshold for pion production is 0.29 GeV, for K+ it is 1.58 GeV and for K- it is 2.5 GeV. The threshold for K+ is lower than that for K-, because the energy balance has only to account for the excitation of a nucleon to a in the case of K+, whereas together with the K- a K+ has to be produced to conserve strangeness.
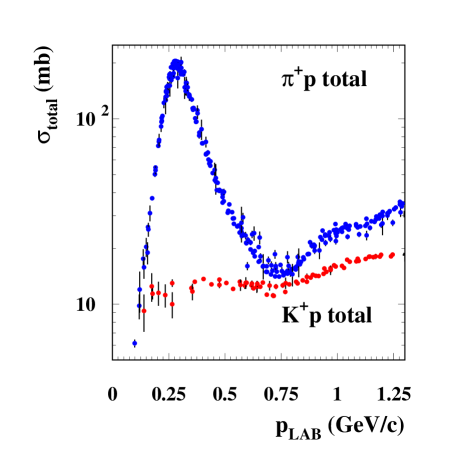
The reaction dynamics of pions and kaons is quite different. The pion-nucleon cross section, shown in Figure 1, is large and thus pions are continuously absorbed through the -resonance and re-emitted by its decay. This creation and disappearance can occur during the entire time evolution of the collision. The K+-nucleon interaction cross section, also shown in Figure 1, on the other hand, is small due to strangeness and energy conservation. There are no partners to react with and only elastic scattering and charge exchange can occur. Therefore, K+ mesons are expected to leave the interaction zone early. These facts have led to the suggestion of time-ordered emission of these two species [4]. The creation of K- requires even higher energies. The dominant production mechanism is strangeness exchange. The interaction probability of K- with nuclear matter is much higher than that of K+ and the mean free path much lower. As a consequence, K- cannot leave the reaction zone undisturbed and they are emitted later.
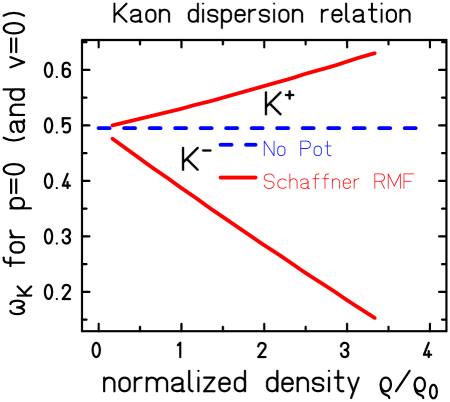
The properties of kaons are expected to be changed inside the nuclear medium [6, 7]. The scalar part of the KN potential of both kaon species is slightly attractive while the vector part acts in opposite direction. Thus, the K+ N potential is slightly repulsive and the K- N potential is strongly attractive. Potentials increase with density as shown in Figure 2. Kaons emitted in heavy ion collisions are an ideal tool to study this hypothesis.
Kaons are also used to extract key parameters of the nuclear equation of state, like the nuclear compressibility. A large fraction of the work to extract the parameters of the EOS has been carried out through flow studies of the nucleons. A separate report in this Volume [8] describes these efforts in detail.
Pion distributions were measured at the Bevalac in light symmetric systems () and in asymmetric systems [10, 11, 12, 13] and later also in the La+La system [14]. In these early measurements the slope of the high- part of the spectra was taken as a measure for the freeze-out temperature, . This is a good approximation since in the blast-wave formalism [15] the radial expansion does not strongly modify the spectrum due to the low mass of the pions. The pion multiplicity as a function of beam energy was measured by the Streamer Chamber Collaboration [16]. The difference between the measured pion yield and the yield predicted by cascade calculations [17] has been taken as an early attempt to determine the equation of state of nuclear matter [18].
Positive kaons were measured early in the Bevalac program [19, 20, 21]. However, the statistics and systematics were not good enough to reconstruct a complete emission pattern the way it was done for pions. At Bevalac energies the production of negatively charged kaons is sub-threshold. The early measurements lack good statistics [21, 22], which adds to the problem to explain the observed phenomena close to the threshold where the production cross section varies rapidly with energy. Lambda and antiproton production [22, 23, 24] suffers from similar problems. A detailed overview of hadron production in high-energy nucleus-nucleus collisions at the Bevalac can be found in a review paper [25].
Systematic, high-statistics measurements of pion and kaon production became feasible with the advent of the SIS accelerator at GSI. Two experiments, KaoS [26], a dedicated experiment for the measurement of mesons, and FOPI [27], a large acceptance, multi-purpose detector, produced a solid body of beautiful results. References [28] and [29] give a detailed summary of pion and kaon production at SIS.
Cascade codes are an ideal tool for the study of the mechanism of hadron production. At the Bevalac, pion production [17] and kaon production [30] was implemented in some models. Theory evolution not being part of this review, we limit ourselves to studying the production mechanism with the help (by means) of one particular model, the Isospin Quantum Molecular Dynamics (IQMD) model [9, 31]. Reference [32] reviews the theory development mainly concentrating on the nuclear equation of state. We focus on reviewing multiplicities and spectral distributions.
2.1 Multiplicities
Pions are the most abundantly produced particles. They are created in individual nucleon-nucleon collisions via the -resonance through the reaction . Pions interact strongly with nuclear matter by forming baryonic resonances, e.g. N. The resonances themselves decay mainly by pion emission. Therefore, pions are expected to leave the collision zone over a long time span, mainly at a late stage of the collision when the system has expanded and cooled. For an experimental study of -production we refer to Reference [33].
The pion multiplicity increases slowly as a function of the collision energy as shown in Figure 3 for inclusive collisions of a light (C+C) and a heavy (Au+Au) system. The ordinate , the multiplicity per mass number of one collision partner, accounts for the system size. The yield is higher for the lighter system. This reflects absorption of pions and holds only at these low energies. The kinematical conditions for and are the same, the only difference is given by the ratio of the interacting nuclei. This effect is avoided here by plotting the sum of all three pion species.
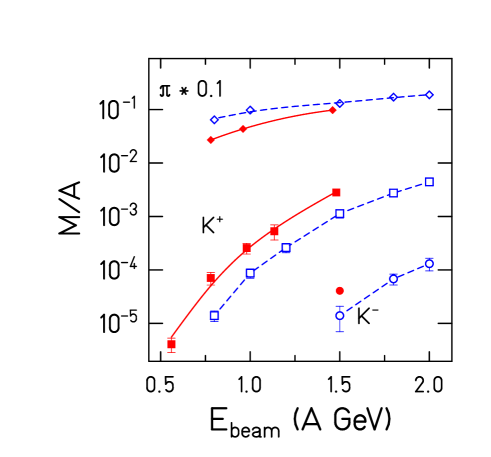
Figure 3 also shows the K+ and K- production yields for the two systems. As expected, the K+ multiplicity is higher than the K- multiplicity. The pion multiplicity is higher in the lighter system while for K+ production the inverse observation is made.
In central Au+Au collisions, densities of two to three times normal nuclear matter density may be reached [9, 31, 32]. A sensitive probe to test such conditions is the production of strange hadrons at or below the production threshold.
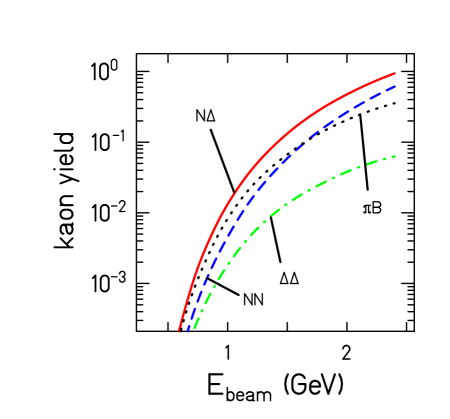
The key mechanism for K+ production close to the threshold is a multi-step process where the energy necessary for production is accumulated in intermediate resonances. Higher density increases the number of these collisions. Especially second generation collisions with sufficiently high relative momentum to create a K+ occur most frequently during the high-density phase. Figure 4 shows the contribution of different production channels to the kaon yield in central Au+Au collisions according to IQMD calculations [9]. collisions dominate even above the corresponding NN threshold.
The K- production process is quite different from K+ and the production threshold is much higher. The strangeness-exchange reaction , with Y being or , represents an additional production possibility, as suggested by Ko [35] and demonstrated in References [36, 37, 38]. It has a large cross section. The inverse channel causes the produced K- to be absorbed [38]. As in the pion case, the succession of absorption and creation causes the K- emission to be mainly in the late stage of the reaction.
The ratio reflects the ratio of the colliding system. Assuming production via the -resonance, the ratio is 1.95 (isobar value) for Au+Au collisions. The left panel of Figure 5 shows the ratio as a function of beam energy. The ratio increases with decreasing energy, exceeding even the isobar value. IQMD calculations [9] reproduce the trend but fail to describe the strong rise at very low incident energies. At very high energies the value reaches unity due to charge conservation [39].
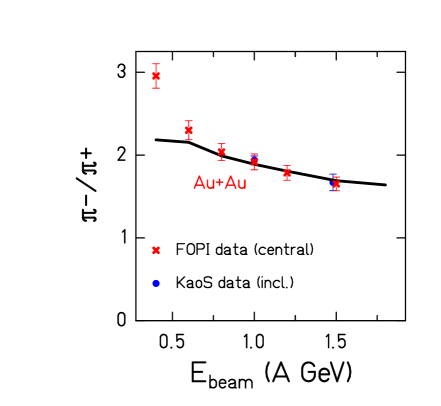
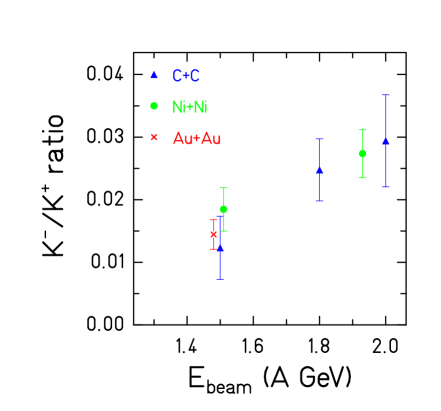
The K-/K+ ratio, shown in the right panel of Figure 5, rises strongly with increasing energy. This reflects the different production thresholds and kinematics for the two particles. The three systems studied here show quite similar values. The fact that different densities are reached in the different systems apparently does not matter. This trend is well described by transport models where strangeness exchange is the dominant channel and by statistical models [40]. Again, at very high energies the value reaches unity [41].
In the following we study the multiplicities of pions and kaons as a function of the mass of the collision system, , for inclusive reactions and as a function of the number of participants, , for impact parameter selected reactions.
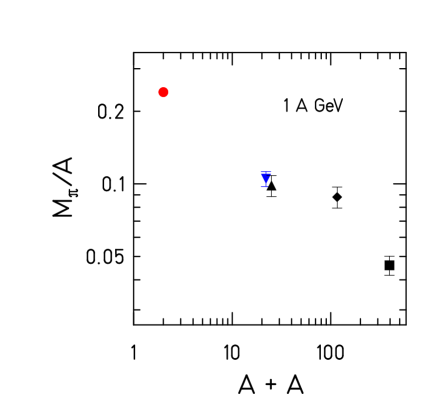
Figure 6 shows the inclusive multiplicity per mass number, , for pions as a function of at 1 GeV incident energy. The pion multiplicity per decreases strongly with . This is in strong contrast to the behavior of K+ production, shown in Figure 7. At 1 GeV, the normalized kaon yield rises by a factor of about 3. Figure 7 also shows the variation of multiplicities of K+ mesons per with incident energy as well as those of K- mesons at 1.5 GeV. The lines are functions fitted to the data with the resulting values for given in the figure. For K+ production the extracted values of decrease with incident energy. This reflects the decreasing influence of intermediate energy storage via as less multiple collisions are needed. Considering the much higher threshold for K- production, one would expect at the same incident energy a much stronger rise. However, at 1.5 GeV the values of for K+ and for K- production are about equal, demonstrating that K- production and K+ production are strongly correlated.
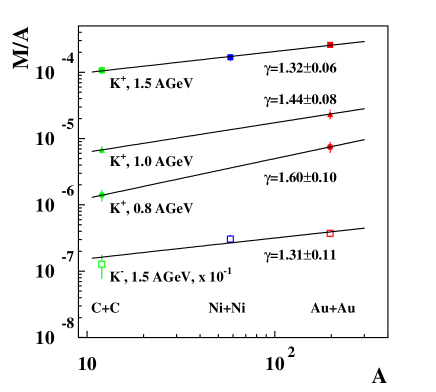
Figure 8 shows for Ni+Ni and Au+Au collisions at 1.5 GeV as a function of . It demonstrates that the multiplicities of both kaon species exhibit the same rise with the number of participating nucleons despite the fact that the thresholds for the production of the two particle species are very different. This observation again confirms that K+ and K- productions are correlated. As is also shown in Figure 8, the pion multiplicity per as a function of is rather flat. This observation has been made at several incident energies [16, 44, 45].
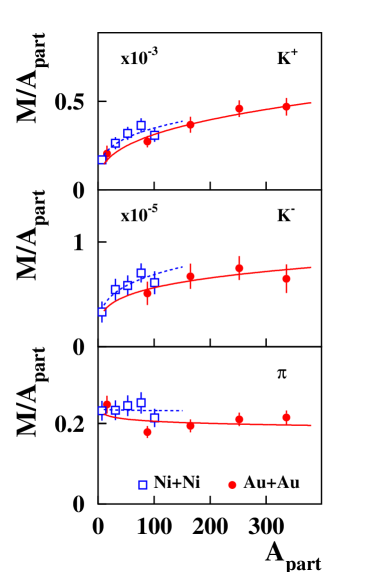
It is important to distinguish the trends observed in the quantity for inclusive reactions and studied for different centralities. While for kaons these trends are quite similar as demonstrated in Figures 7 and 8, it is not the case for pions. While is flat, decreases when comparing different systems (see Figure 6). Consequently, for different systems gives different values. Results from inclusive and from centrality-selected studies can not easily be compared.
The similar rise of both, K+ and K-, as a function of the collision centrality shown in Figure 8 and as a function of the system size in Figure 7, suggests that the production mechanisms of the two kaon species is correlated. The K- in heavy ion collisions at SIS energies are mainly produced via strangeness-exchange. On the other hand, strangeness has to be conserved when producing these hyperons and the energetically most favorable way is to produce them together with K+ (or K0) mesons. Thus the production of K+ and of K- mesons is coupled via the strangeness-exchange reaction and the K- inherits the same dependence on the system size and on the collision centrality. In Reference [46] it is argued that the strangeness-exchange channel reaches chemical equilibrium. Thus the K-/K+ ratio is proportional to the pion density, both at SIS and AGS energies.
As a consequence of Figure 8, the ratio K-/K+ as a function of is constant and it is the same for Au+Au and for Ni+Ni. Transport models having strangeness exchange as dominant production channel for K-, describe this trend fairly well [38]. The statistical model reproduces the measured values using nominal masses for all particles [40]. This model predicts a value independent of centrality and of system size. At these low incident energies, a canonical treatment is required leading to multiplicities of strange particles depending on the size of the fireball (correlation volume). In this approach the size dependence of both, K+ and K-, is the same and a constant K-/K+ ratio results.
2.2 Spectra
The spectral distributions of the different particles in general contain information about the freeze-out condition and about the collective expansion of the system created in heavy ion collisions.
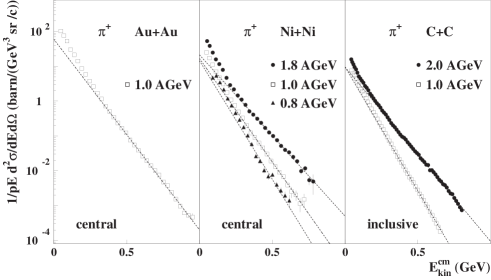
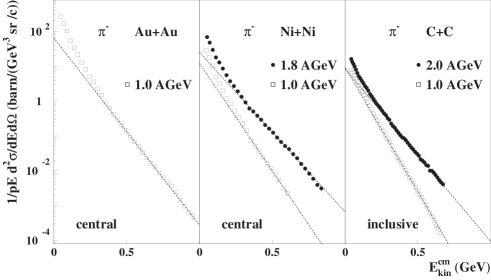
The invariant cross sections for pion production in three different systems are shown in Figure 9 as a function of the center-of-mass kinetic energy. Above 0.4 GeV kinetic energy in the c.m. system all spectra can be described by a Boltzmann distribution (exponential function in the given presentation). The spectra also exhibit an enhancement at the low-energy end if an exponential function is fitted in the high-enery part. This excess is stronger for heavy systems. There are different possible explanations for this enhancement. Late time pion emission from -resonance decay [13] and continuous pion emission [48] have been proposed. The most detailed investigation to date has been done by Weinhold et al. [49].

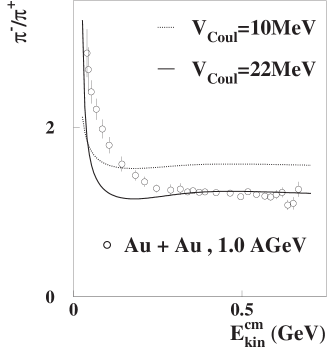
As mentioned earlier, the ratio of the and multiplicities reflect the N/Z ratio of the colliding nuclei and the opposite Coulomb force. Figure 10 shows the double differential cross sections of negatively and positively charged pions from central collisions of Au+Au nuclei at an incident beam energy of 1 GeV. The yield of is higher due to the neutron excess. The different shapes demonstrate the boost caused by the Coulomb force. Similar observations have been made at the Bevalac when studying forward emission of pions [50]. The right panel of Figure 10 compares the ratio as a function of the kinetic energy of the pions with calculations using a static Coulomb potential [47] which is not able to describe the dynamics of pion emission. For pions with lower kinetic energy a weaker Coulomb force seems to act. This can be understood by the time sequence of pion emission; high-energy pions are emitted earlier than low-energy pions.
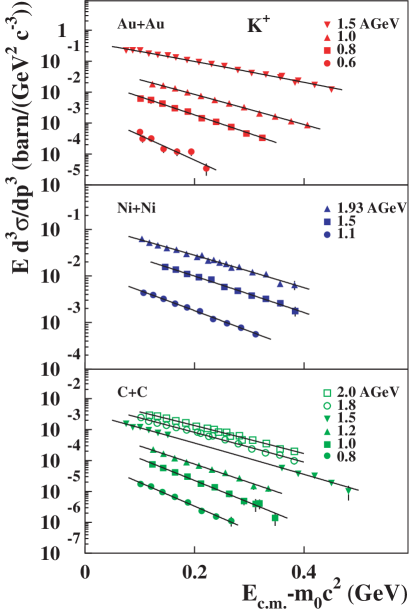
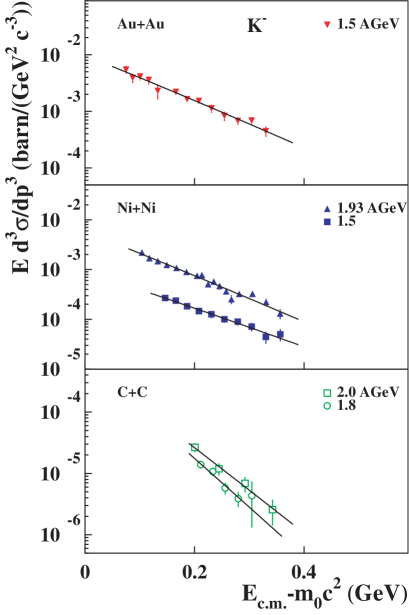
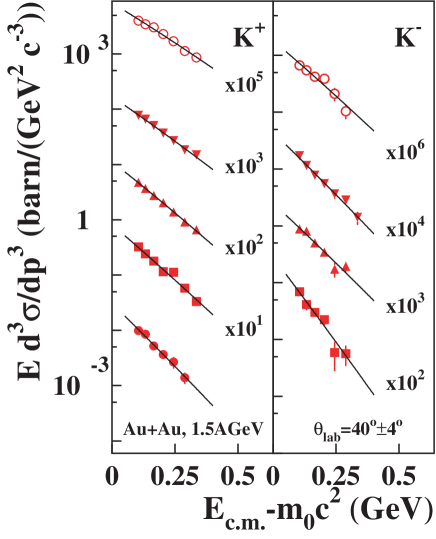
Both K+ and K- are produced in a complicated sequence of interactions. Figure 11 shows K+ and K- spectra at mid-rapidity as a function of the kinetic energy for three different systems and various beam energies [29]. The spectra have a Boltzmann shape to a very good approximation. The inverse slope parameters of the K+ are always higher than those of the K- [51, 52, 53, 29]. Heavy systems exhibit shallower inverse slopes than lighter ones.
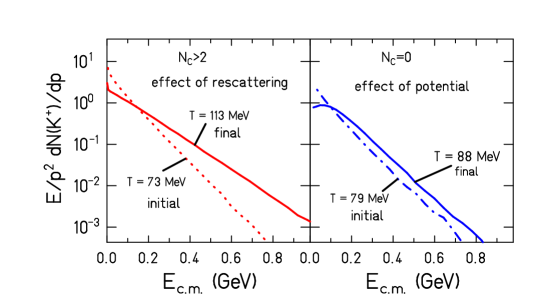
It is interesting to study the different effects contributing to the K+ slope in an IQMD study. Initially, the energy available for K+ production is low and the slope of the spectrum at creation is therefore quite steep. Figure 12 shows the effect of re-scattering and of a possible kaon potential on the final slope of K+. Re-scattering makes the slope shallower. This effect increases as the beam energy increases and as the mass of the system increases as there is more scattering in heavier systems. The predicted repulsive K+ potential would increase the production threshold. When leaving the system, the K+ has to acquire its nominal mass and the excess energy serves to accelerate it. This effect, however, is small and only visible at low momenta. For experimental reasons low-momentum kaons can be studied best with neutral K0 mesons. The corresponding experiments are still ongoing [54, 55].
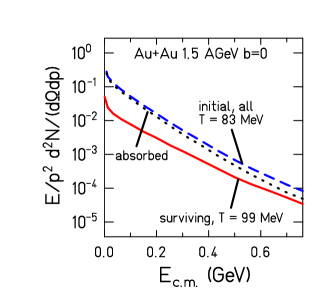
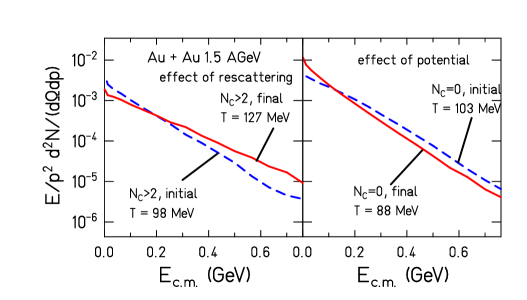
Re-scattering has a strong influence on the K+ spectra. The spectral shape of the K- mesons is also influenced by scattering. However, K- are mainly absorbed when interacting with nuclei and absorption will change the slope in a momentum-dependent way. The low-momentum K- undergo stronger absorption which leads to an increase in the apparent temperature. The various influences on the shape, resulting from re-scattering, absorption, and the attractive KN potential are demonstrated in Figure 13.
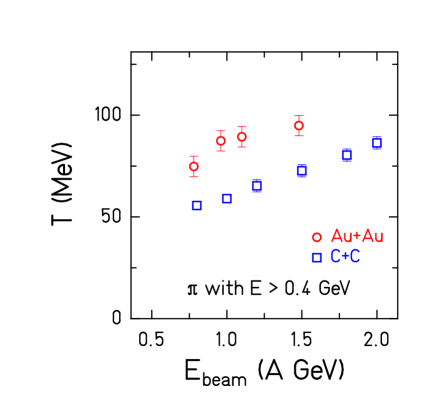
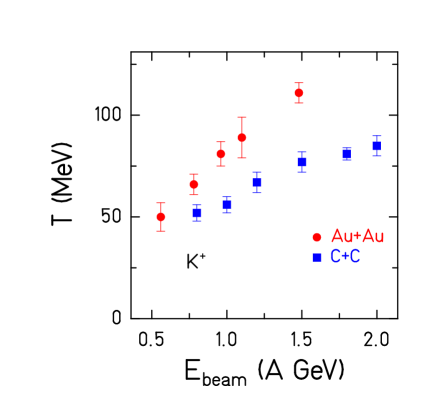
Figure 14 gives a compilation of the measured inverse slopes of inclusive (only high-energy part) and inclusive K+ for C+C and Au+Au collisions as a function of collision energy, clearly showing the trends discussed before. The inverse slopes increase with beam energy and at the same energy those of the heavier systems are higher. It is interesting to note that the values of the slopes of the high-energy pions and of the K+ agree. They seem to reflect the temperature of the environment, if this term can be used at all as a global equilibrium is not achieved. Those of K- deviate as already shown in Figure 11.
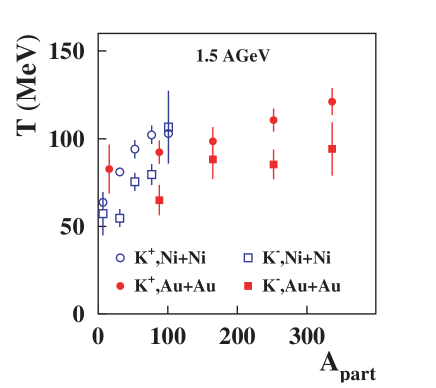
Finally, we investigate the impact parameter dependence of the kaon spectra. Figure 15 (left panel) shows the spectra measured by the KaoS Collaboration for Au+Au reactions at GeV for different centralities for K+ and K-. The inverse slope parameters, , are evaluated as a function of centrality or . This demonstrates that the slope parameters are weakly depending on centrality and that the slope of K- is always about 20 MeV lower than that of K+.
2.3 Conclusions
Heavy ion collisions at 1 to 2 GeV incident energy probe nuclear matter at about two to three times its normal density. The production and emission of K+ and of K- exhibits distinct differences. The key points are summarized in a model study showing the emission time of the two kaon species and the corresponding density profiles of the medium within the IQMD approach [9].
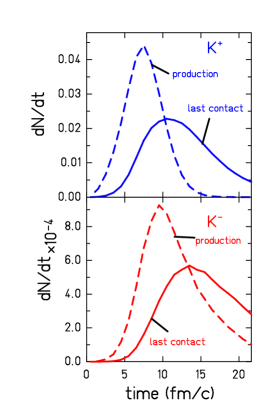
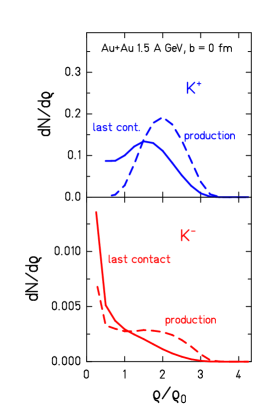
The left panel of Figure 16 shows the time distributions at production and at last interaction. K- are produced later than K+ and they also leave the system later. The right panel of Figure 16 shows the density of the medium at production and at last contact. The bulk of the K+ is produced when the density is twice nuclear matter density. K+ are emitted predominantly at a density of = . Their yield cannot be changed between production and emission due to strangeness conservation. Therefore, the K+ yield carries information from the high-density phase. As K+ production is at or below the NN threshold, its yield is very sensitive to the dynamics in the fireball. K+ production serves as an ideal tool to extract information on the nuclear EOS. In order to avoid uncertainties both experimentally and theoretically, it is useful to study ratios of K+ multiplicities [34], e.g. the ratio of multiplicities from Au+Au and C+C collisions. From this ratio a rather soft EOS with a compression modulus of around 200 MeV has been extracted [56, 57]. This is in agreement with results from flow studies [8, 58].
The observed K- mesons are predominantly produced and emitted late and from a region of density below nuclear matter density, whereas the K+ are produced at twice nuclear matter density. It is obvious that heavy ion reactions in this energy range are well suited to study K+ potential effects. This is not the case for K- production, since the effects are expected to be small. Other observables, like the azimuthal emission pattern, also show sensitivity to in-medium interactions [59, 60].
3 Hadron Production from AGS to RHIC
In this section we discuss the evolution of spectra of identified hadrons as the center-of-mass energy is increased from AGS to RHIC. For AGS and SPS we will summarize the spectra in terms of inverse slope parameters, , and show how radial flow develops as a function of energy. At RHIC energies we will use the wealth of precise data on radial and elliptic flow to argue that collectivity develops at the partonic level.
We start with a discussion of the transverse momentum spectra and the way they are analyzed and important dynamical parameters are extracted using the example of spectra from RHIC experiments. The methods developed are applicable to all energies discussed here.
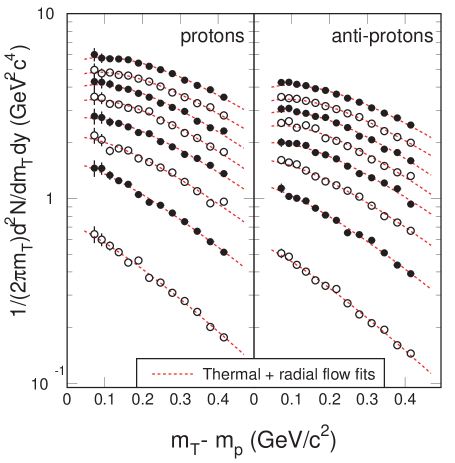
Figure 17 shows mid-rapidity proton and antiproton transverse mass distributions for several centrality bins. The data are from Au+Au collisions at = 130 GeV [61]. The transverse mass, , is given by , with the rest mass of the proton (antiproton). It is evident that the distributions become more convex as centrality increases. The change in shape is an indication for strong radial flow. In the presence of collective flow the transverse mass distributions, especially for heavy mass particles, will not have a simple exponential shape at low transverse mass [15]. This effect becomes particularly strong when the temperature is low compared to the collective velocity. Two-parameter fits [62] of the freeze-out temperature, , and the collective velocity, , motivated by hydrodynamics, are useful to separate the collective motion from random thermal motion in the measured spectra. Here we apply blast wave fits from Reference [63]. These fits simultaneously describe experimental spectra of charged pions [64], kaons [65], protons and antiprotons. A velocity profile is used in the fit, where and are the radius and the surface velocity of the source, respectively. The fit-results are shown as dashed lines in Figure 17. The collective velocity parameter increases from about 0.41 to 0.55 for the most central collisions.
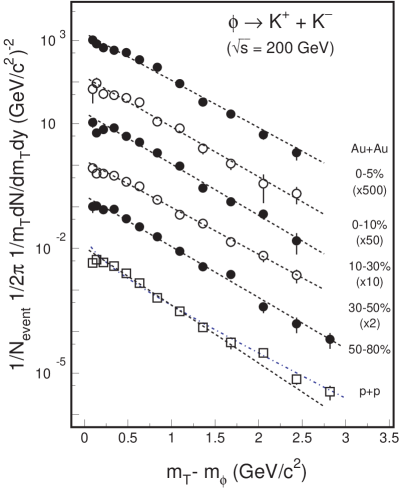
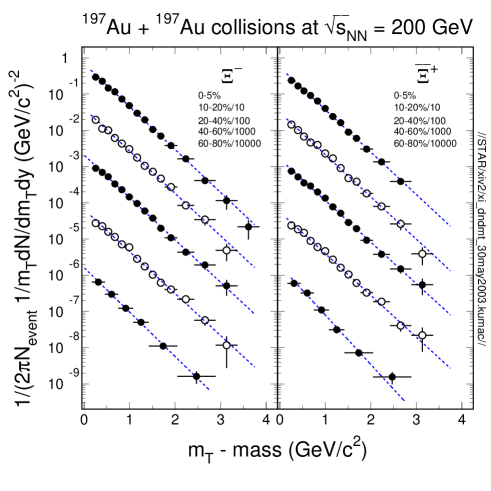
Figure 18 shows meson and hyperon transverse mass distributions from 200 GeV Au+Au and p+p collisions. The spectral shapes are quite different from the ones shown in Figure 17. All spectra with the exception of the mesons emitted in p+p collisions have an exponential form:
| (1) |
where and are the normalization constant and inverse slope parameter, respectively. The dashed lines in the figure represent exponential fits. In the case of mesons emitted in p+p collisions, a power-law fit gives better results:
| (2) |
Here is the normalization constant and and are free parameters that describe the shape of the distribution. The dash-dotted line represents the fit. In general, mesons emitted from p+p collisions are following a power-law type distribution with a of about 12 GeV/c and a of six, while the baryons are closer to an exponential function [67].
3.1 Systematics of Spectra and Slopes at AGS and SPS
The AGS program has yielded a large body of emission spectra mainly for pions, kaons, and protons. At the SPS there is an even larger wealth of data. Rather than reviewing the data in detail, we will concentrate on summarizing the emission spectra in terms of inverse slope parameters or apparent temperatures.
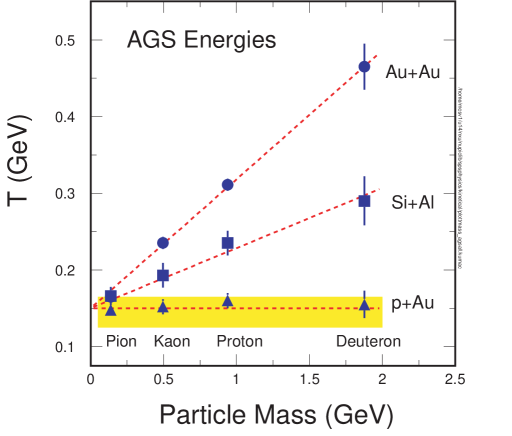
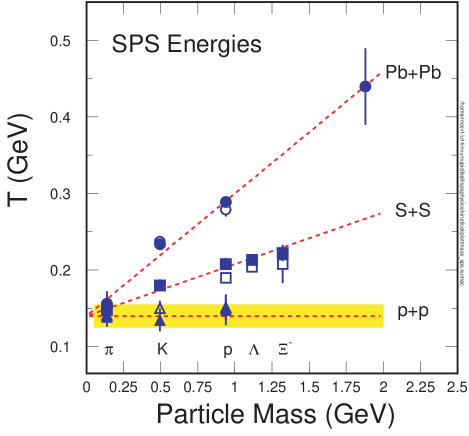
Figure 19 shows the systematics of the extracted inverse slope parameters as a function of the mass of the emitted particles at AGS energies for three systems with different total mass. The data are taken from the E802 experiment [68]. Figure 20 gives the corresponding systematics for SPS energies. Here the data are taken from the NA44 experiment [62]. At both energies a clear trend emerges: a linear relationship between inverse slope parameter and particle mass. This dependence can be parameterized as a freeze-out temperature plus a linear term in particle mass with a coefficient that is related to the flow velocity. The p+p and the p+nucleus systems do not show any dependence on mass. Thus, in this approach, they do not show collective expansion. For the heavier systems we observe a collective expansion velocity that increases with the mass of the system. A freeze-out temperature of 140 to 150 MeV has been extracted. The systematics observed in Figure 19 and in Figure 20 has been taken as a strong indication of the existence of collective radial expansion in heavy ion collisions in this energy range [69, 70].
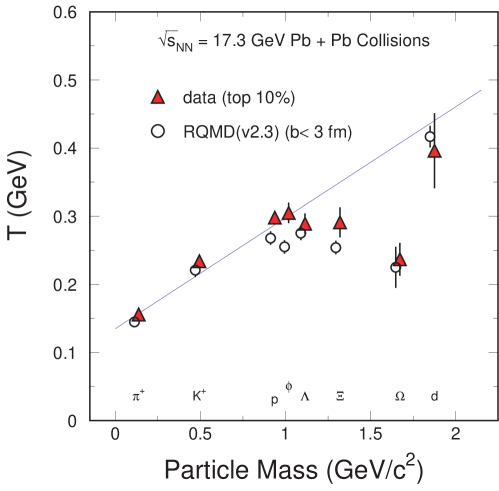
Figure 21 shows in more detail again the inverse slope parameter as a function of particle mass for central Pb+Pb collisions at 158 GeV with data from NA44 [62], NA49 [71], and WA97 [72]. The linear increase from pions to deuterons is indicated by the solid line. The inverse slope parameters for multi-strange baryons and for mesons clearly deviate from this general trend. Those particles do not acquire the flow velocity appropriate to their mass during the expansion. They interact weakly with the expanding system since their hadronic cross sections are reduced compared to non-strange hadrons [73]. The observed trend is confirmed by RQMD calculations [74], also shown in Figure 21. In RQMD, the interactions are modelled by hadronic scattering alone. The consistency between the model and experimental data clearly indicates that this trend is due to scattering in the hadronic phase.
For light hadrons, the bigger their mass the higher the value of the inverse slope parameter. The multi-strange hadrons like Xi and Omega, on the other hand, do not follow this trend. Their inverse slope appears to decrease. As discussed in Reference [73], this different behavior may be caused by the small hadronic cross sections of the multi-strange hadrons. They decouple early from the system and do not acquire the degree of collectivity characteristic for the abundantly produced light hadrons. As we will see later, the situation will change when the beam energy is increased at RHIC.
3.2 Spectra and Radial Flow at RHIC
In the previous Section, we compared the systematic results from AGS and SPS with predictions from transport models. In case of the transport approach, the driving force is rescattering. No assumption is made regarding the equation of state and the nature of thermalization. A sufficient number of rescatterings will naturally lead to collectivity and eventually to local equilibrium. We can also look at the collisions from the point of view of hydrodynamics. In Figure 22 we compare the data with hydrodynamic model calculations [75]. In the following, we will assume that we can identify bulk properties by measuring the most abundantly produced particles, like pions, kaons, and protons.
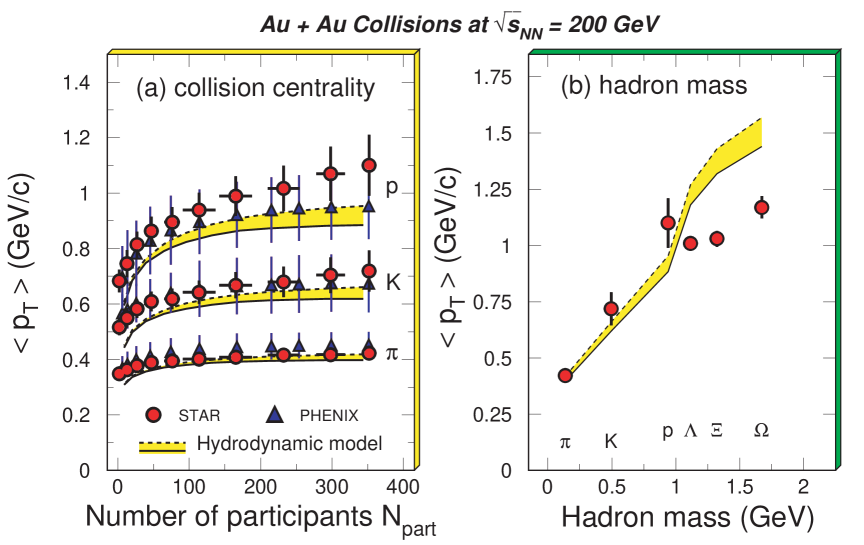
The values of the mean transverse momentum of bulk particles, from PHENIX [76] (triangles) and STAR [3] are shown in the left panel of Figure 22 as a function of collision centrality. Also shown in the plot are the hydrodynamic model calculations where the bands indicate the uncertainties caused by the initial conditions. Within error bars, the data for bulk particles are well reproduced by the model calculations, implying the validity of the application of hydrodynamic approach for bulk productions in high-energy nuclear collisions. In the right panel of Figure 22 we compare the of hadrons as a function of hadron mass for pions, kaons, protons, , , and from central Au+Au collisions. In the mass region below 1 GeV the hydrodynamic calculations can account for the measured results reasonably well. In the mass region above 1 GeV the measured mean transverse momenta are below model predictions. In this region most of the produced hadrons contain one or more strange quarks. The interaction cross sections of strange (or multi-strange) hadrons are smaller than those of non-strange hadrons [73]. As a result, they decouple from the system relatively early. Therefore the values of the are lower than those from hydrodynamic model calculations which can reproduce the mean transverse momentum for bulk particles, but over-predict for multi-strange hadrons.
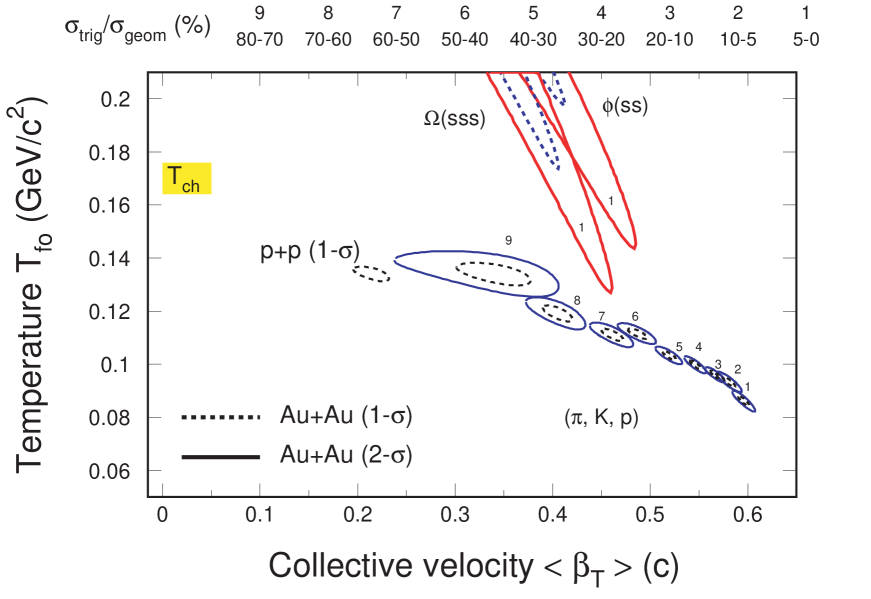
Figure 23 shows contours in the temperature versus collective velocity plane. Dashed and solid lines represent 1- and 2- contours, respectively, extracted from blast wave fits [63]. Numbers on the top indicate the centrality selection. For bulk particles 9 centrality bins are presented. For and only the results from the most central collisions are shown. Contours from p+p collisions [77] are also shown.
With increasing centrality the bulk temperature decreases and the collective velocity increases. The velocity becomes as high as 60% of the speed of light for the most central collisions. In contrast, the multi-strange hadrons, and , emitted in central collisions have a temperature of T 180 MeV and an average velocity of . From Figure 18 we also know that their temperature and expansion velocity is not sensitive to the collision centrality.
The thermal freeze-out temperature for the bulk is about 100 MeV. For the multi-strange hadrons it is about 170 MeV, the same as the bulk chemical freeze-out temperature [70, 78, 79, 80, 81]. This temperature is close to the value of the expected phase transition temperature [2]. Again, we can conclude that the multi-strange hadrons do not participate in the full development of the expansion, they decouple from the system near the hadronization point, MeV and . A mechanism that could lead to early freeze-out is the effect that the hadronic cross sections for strange and especially multi-strange hadrons are reduced [73], as explained earlier.
An alternative scenario has been proposed by Broniowski and Florkowski [82]. They assume a single freeze-out and explain the apparently low freeze-out temperature and the large collective velocity for the bulk as an effect of resonance decay. However, it is not clear that this model can also explain the data on resonance production [83].
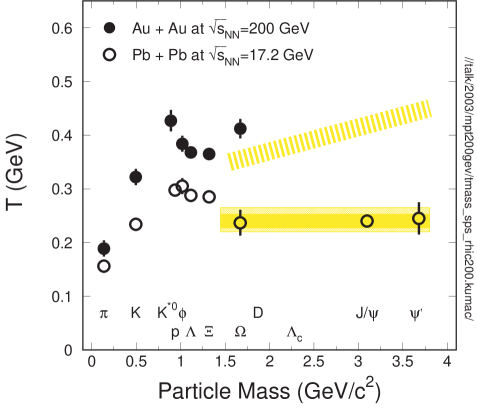
Figure 24 shows the inverse slope parameters of identified hadrons as a function of particle mass. At SPS energies the multi-strange and charm hadrons do not show an increase as mass increases. This is indicated by the solid band. At RHIC energy, however, the inverse slope parameters for and seem to increase with mass, indicating that the collectivity developed already in the partonic phase [70]. The hatched band indicates where future data points would have to fall for this assumption to be correct.
3.3 Partonic Collectivity at RHIC
More conclusive evidence for flow at the parton level can be derived from elliptic flow measurements. Elliptic flow is described in a separate article of this Volume [84]. We will only present a limited set of data here.
The left panel of Figure 25 shows the measured elliptic flow, , from Au+Au collisions at = 200 GeV for , K, , and from PHENIX [85] and STAR [3]. From top to bottom the dashed lines represent the elliptic flow of , K, p, , , and from hydrodynamic calculations [86]. At low , the hydrodynamic calculations can well reproduce the measurements. At higher , becomes saturated and hydrodynamic results over-predict the data. The baryons saturate above 3 GeV/c with 0.2. The mesons saturate at lower values of . When scaling the values of and with the number of constituent quarks (NCQ) of the corresponding hadrons, all particles should fall on a single curve, as demonstrated in the right panel of Figure 25. This was predicted by coalescence models [87].
Scaling with the number of constituent quarks or with the number of valence quarks has been taken as strong empirical evidence that the constituents that acquire collectivity in the expansion are partons (quarks) and not hadrons.
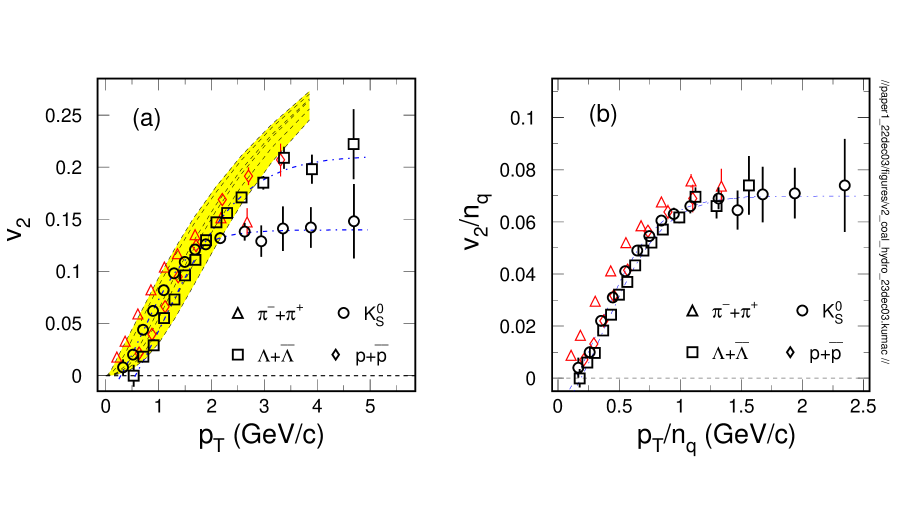
The values in Figure 25 are fitted with an empirical functional form. The fit results for K and are shown as dot-dashed lines in both panels of Figure 25. For kaon, proton, and lambda the scaling works well for small transverse momenta ( GeV/c). Pions do not follow the scaling. A large fraction of pions from heavy systems is not produced directly, but comes from the decay of resonances [83, 88]. At mid-rapidity as much as 80% of pions are from resonance decays. The dominant sources for pion production are , K∗, K and baryon resonances like . When taking resonance decays into account, the pion follows the scaling with the number of constituent quarks [89].
The scaling of the transverse momentum dependence of with the number of constituent quarks of the produced hadrons is a powerful indication that the constituents that acquire flow are not the hadrons, but partons at an early stage of the collision. This is the strongest indication so far for deconfinement and a hint for the existence of a Quark-Gluon Plasma.
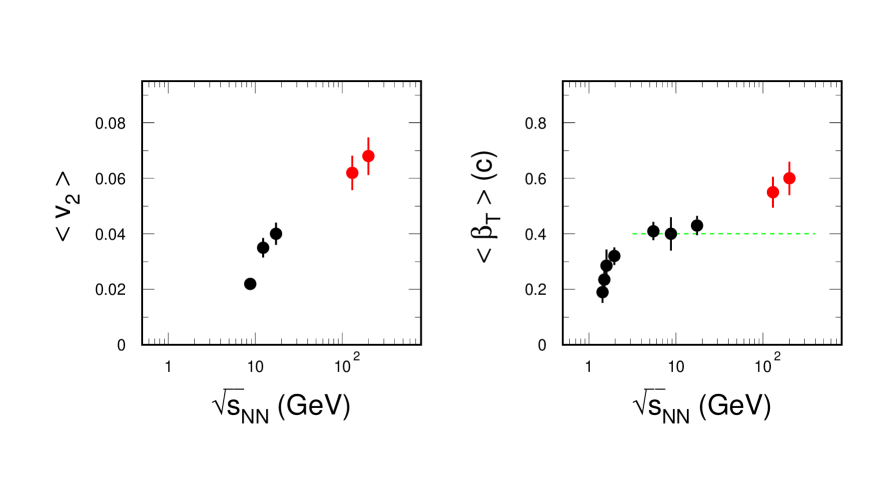
Let us close this section by showing the energy dependence of the collective flow observables in Figure 26. The elliptic flow , and the radial flow parameters, , increase as a function of collision energy. Above 6 GeV increases monotonically implying that more and more early flow develops as the collision energy increases. Assuming that hadronic rescattering effects have already been maximized at SPS energies ( 17 GeV), the net increase in the transverse velocity at RHIC should be due to partonic interactions.
3.4 Outlook
In the near future, it is important to quantify the partonic collective flow with high statistics data of measurements for all hadrons. Elliptic flow of mesons will be important because mesons are produced through quark coalescence and not through the kaon fusion channel [90]. These results will provide direct information on the partonic phase.
Gauging thermalization is an important next step in the quest for the equation of state and for the existence of a Quark-Gluon Plasma. In lattice QCD the QGP temperature at top RHIC energy is of the order of 0.3 to 0.5 GeV [91, 92]. The mass of a charm quark is much heavier than this temperature. This means thermal production of charm quarks is negligible. Charm quarks are produced in first chance collisions. Thermalization of the light quarks might be tested by measuring the elliptic flow of heavy quarks. Heavy quarks can develop flow only if they are dragged along during the expansion by frequent collisions with light quarks [93]. Frequent interactions amongst light quarks will lead to thermalization. The measurement of a finite value for electrons from the semi-leptonic decay of heavy-flavor mesons at high transverse momentum [94] cannot yet be taken as indication of charm quark flow in the hydrodynamic sense.
It is also very important to pursue a temperature measurement with thermal photons and di-leptons. NA60 [95] recently obtained ”temperatures” for di-muons from the continuum that fit well in the mass systematics of Figure 24. Thermalization of matter is a necessary condition for measuring the temperature of the QGP. The temperature is yet another unknown parameter in the determination of the equation of state. Thermalization is an important condition for our ability to explore the QCD phase diagram, for example by searching for the tricritical point [96] in the upcoming energy scan program at RHIC and later at FAIR.
4 Summary
In heavy ion collisions at energies of 1 to 2 GeV densities of two to three times normal nuclear matter density are reached. K+ mesons production is of special interest as K+ are produced close to the NN threshold. Their production yield is very sensitive to the energy balance in the fireball and thus to the properties of the nuclear equation of state. K+ interact only elastically and their yield carries information from the early, high-density stage of the collision. From the comparison of the measured yields with model calculations the stiffness of nuclear matter has been extracted. Pions and K- interact strongly with the medium. They are emitted late in the expansion phase.
Kaon emission close to the threshold is a sensitive tool to identify effects of in-medium KN potentials. Potentials might cause a change of the effective thresholds and of the yields. Presently, experimental data and the understanding of the model parameters are not good enough to distinguish the effects of potentials from other effects, like scattering and absorption. K+ and K0 spectra at very low momenta are expected to be more sensitive. With the upcoming FAIR facility at GSI it will be possible to study potential effects through high statistics measurements by including also charm production.
At the higher energies strong, pressure driven collective effects have been observed. The fact that elliptic flow scales with the number of constituent quarks and that the multi-strange hadrons decouple from the system early have been taken as strong indication that collectivity develops in the partonic stage and that hadronic interactions play a minimal role for the development of elliptic flow. We can conclude that a partonic state has been created.
Deconfinement is not sufficient for the existence of a QGP. Equally important is the concept of thermalization. The heavy flavor program at RHIC and at the LHC will shed new light on this important question.
Acknowledgments
We would like to thank J. Aichelin, M. Bleicher, P. Braun-Munzinger, J. Cleymans, S. Esumi, A. Förster, C. Hartnack, B. Jacak, U. Heinz, I. Kraus, Y. Leifels, C. Müntz, A. Poskanzer, K. Redlich, B. Schlei, E. Shuryak, H. Stöcker, J. Sullivan, S. Voloshin, and H. van Hecke for stimulating discussions and suggestions. This work was supported in part by the U.S. Department of Energy under Contract No. DE-AC03-76SF00098 and by the Bundesministerium für Bildung und Forschung (BMBF).
References
- [1] H. Satz, Nucl. Phys. A715, 3c (2003).
- [2] F. Karsch, Nucl. Phys. A698, 199c (1996).
- [3] J. Adams, et al., STAR Collaboration, Nucl. Phys. A757, 102 (2005).
- [4] S. Nagamiya, Phys. Rev. Lett. 49, 1383 (1982).
- [5] Particle Data Group, Phys. Rev. D 54, 1 (1996).
- [6] D.B. Kaplan and A.E. Nelson, Phys. Lett. B175, 57 (1986).
- [7] J. Schaffner, J. Bondorf, and I.N. Mishustin, Nucl. Phys. A625, 325 (1997).
- [8] J. Aichelin and J. Schaffner-Bielich, this Volume.
- [9] C. Hartnack, Y. Leifels, H. Oeschler, and J. Aichelin, Physics Report, in preparation.
- [10] S. Nagamiya, et al., Phys. Rev. C 24, 971 (1981).
- [11] S. Nagamiya, et al., Phys. Rev. Lett. 48, 1780 (1982).
- [12] K.L. Wolf, et al., Phys. Rev. C 26, 2572 (1982).
- [13] R. Brockmann, et al., Phys. Rev. Lett. 53, 2012 (1984).
- [14] S. Hayashi, et al., Phys. Rev. C 38, 1229 (1988).
- [15] P.J. Siemens and J.O. Rasmussen, Phys. Rev. Lett. 42, 880 (1979).
- [16] J.W. Harris, et al., Phys. Rev. Lett. 58, 463 (1987).
- [17] J. Cugnon, T. Mizutani, and J. Vandermeulen, Nucl. Phys. A352, 505 (1981).
- [18] J.W. Harris, et al., Phys. Lett. 153B, 377 (1985).
- [19] S. Schnetzer, et al., Phys. Rev. Lett. 49, 989 (1982).
- [20] S. Schnetzer, et al., Phys. Rev. C 40, 640 (1989); Erratum-ibid. 41, 1320 (1990).
- [21] A. Shor, et al., Phys. Rev. Lett. 63, 2192 (1989).
- [22] A. Shor, et al., Phys. Rev. Lett. 48, 1597 (1982).
- [23] J.W. Harris, et al., Phys. Rev. Lett. 47, 229 (1981).
- [24] J.B. Carroll, et al., Phys. Rev. Lett. 62, 1829 (1989).
- [25] R. Stock, Phys. Rept. 135, 259 (1986).
- [26] P. Senger, et al., KaoS Collaboration, Nucl. Instr. and Meth. A327, 393 (1993).
- [27] A. Gobbi, et al., FOPI Collaboration, Nucl. Instr. and Meth. A324, 156 (1993).
- [28] W. Reisdorf, et al., FOPI Collaboration, Nucl.Phys. A781, 459 (2007).
- [29] A. Förster, et al., KaoS Collaboration, Phys. Rev. C 75, 024906 (2007).
- [30] J. Randrup and C.M. Ko, Nucl. Phys. A343, 519 (1980); Erratum-ibid. A411, 537 (1983).
- [31] C. Hartnack, et al., Eur. Phys. J. A1, 151 (1998).
- [32] C. Fuchs, Prog. Part. Nucl. Phys. 56, 1 (2006).
- [33] B. Hong, et al., FOPI Collaboration, Phys. Lett. B407, 115 (1997).
- [34] C. Sturm, et al., KaoS Collaboration, Phys. Rev. Lett. 86, 39 (2001).
- [35] C.M. Ko, Phys. Lett. B138, 361 (1984).
- [36] A. Förster, et al., KaoS Collaboration, Phys. Rev. Lett. 91, 152301 (2003).
- [37] H. Oeschler, J. Phys. G 27, 257 (2001).
- [38] C. Hartnack, H. Oeschler, and J. Aichelin, Phys. Rev. Lett. 90, 102302 (2003); Erratum-ibid. 93, 149903 (2004).
- [39] B.I. Abelev, et al., Star Collaboration, e-Print:arXiv0808.2041.
- [40] J. Cleymans, H. Oeschler, and K. Redlich, Phys. Rev. C 59, 1663 (1999); Phys. Lett. B485, 27 (2000).
- [41] J. Adams, et al., STAR Collaboration, Phys. Lett. B567, 167 (2003).
- [42] R. Averbeck, et al., TAPS Collaboration, Phys. Rev. C 67, 024903 (2003).
- [43] C. Sturm, Ph.D. thesis, TU Darmstadt 2001.
- [44] O. Schwalb, et al., Phys. Lett. B321, 20 (1994).
- [45] C. Müntz, et al., KaoS Collaboration, Z. Phys. A352, 175 (1995).
- [46] J. Cleymans, A. Förster, H. Oeschler, K. Redlich, and F. Uhlig, Phys. Lett. B603, 146 (2004).
- [47] A. Wagner, et al., KaoS Collaboration, Phys. Lett. B420, 20 (1998); Phys. Rev. Lett. 85, 18 (2000); A. Wagner, Ph.D. thesis, TU Darmstadt 1996.
- [48] J. Knoll, e-Print: arXiv:0803.2343.
- [49] W. Weinhold, B. Friman, and W. Nörenberg, Phys. Lett. B433, 236 (1998).
- [50] J.P. Sullivan et al., Phys. Rev. C 25, 1499 (1982).
- [51] F. Laue, et al., KaoS Collaboration, Phys. Rev. Lett. 82, 1640 (1999).
- [52] M. Menzel, et al., KaoS Collaboration, Phys. Lett. B495, 26 (2000).
- [53] K. Wisniewski, et al., FOPI Collaboration, Eur. Phys. J. A9, 515 (2000).
- [54] M. Merschmeyer, et al., FOPI Collaboration, Phys. Rev. C 76, 024906 (2007).
- [55] G. Agakishiev, et al., HADES Collaboration, arXiv:0902.3487.
- [56] C. Fuchs, A. Faessler, E. Zabrodin, and Y. M. Zheng, Phys. Rev. Lett. 86, 1974 (2001).
- [57] Ch. Hartnack, H. Oeschler, and J. Aichelin, Phys. Rev. Lett. 96, 012302 (2006).
- [58] W. Reisdorf and H.G. Ritter, Ann. Rev. Nucl. Part. Sci. 47, 663 (1997).
- [59] Y. Shin, et al., KaoS Collaboration, Phys. Rev. Lett. 81, 1576 (1998).
- [60] F. Uhlig, et al., KaoS Collaboration, Phys. Rev. Lett. 95, 012301 (2005).
- [61] J. Adams, et al., STAR Collaboration, Phys. Rev. C 70, 041901 (2004).
- [62] I.G. Bearden, et al., NA44 Collaboration, Phys. Rev. Lett 78, 2080 (1997); M. Kaneta, Ph.D Thesis, Hiroshima University (1999).
- [63] E. Schnedermann, J. Sollfrank, and U. Heinz, Phys. Rev. C 48, 2462 (1993).
- [64] M. Calderón de la Barca Sánchez, et al., STAR Collaboration, Nucl. Phys. A698, 503c (2002).
- [65] C. Adler, et al., STAR Collaboration, Phys. Lett. B595, 143 (2004).
- [66] J. Adams et al., STAR Collaboration, Phys. Rev. Lett. 98, 060301 (2007); B.I. Abelev, et al., STAR Collaboration, Phys. Rev. Lett. 99, 112301 (2007).
- [67] G. Bocquet, et al., UA1 Collaboration, Phys. Lett. B366, 441 (1996).
- [68] L. Ahle, et al., E802 Collaboration, Phys. Rev. C 60, 064901 (1999); Phys. Rev. C 57, 466 (1998).
- [69] N. Xu, et al., NA44 Collaboration, Nucl. Phys. A610, 175c (1996).
- [70] N. Xu and M. Kaneta, Nucl. Phys. A698, 306c (2001).
- [71] G. Roland, et al., NA49 Collaboration, Nucl. Phys. A638, 91c (1998).
- [72] I. Kralik, et al., WA97 Collaboration, Nucl. Phys. A638, 115c (1998).
- [73] H. van Hecke, H. Sorge, and N. Xu, Phys. Rev. Lett. 81, 5764 (1998); Y. Cheng, F. Liu, Z. Liu, K. Schweda, and N. Xu, Phys. Rev. C 68, 034901 (2003).
- [74] H. Sorge, Phys. Rev. C 52, 3291 (1992).
- [75] P. Kolb and R. Rapp, Phys. Rev. C 67, 044903 (2003).
- [76] S.S. Adler, et al., PHENIX Collaboration, Nucl. Phys. A757, 184 (2005).
- [77] J. Adams, et al., STAR Collaboration, Phys. Lett. B616, 8 (2005).
- [78] P. Braun-Munzinger, J. Stachel, J. Wessels, and N. Xu, Phys. Lett. B344, 43 (1995); P. Braun-Munzinger, I. Heppe, and J. Stachel, Phys. Lett. B465, 15 (1999).
- [79] F. Becattini, M. Gazdzicki, and J. Sollfrank, Eur. Phys. J. C5, 143 (1998); F. Becattini, Z. Phys. C69, 485 (1996); F. Becattini and U. Heinz, Z. Phys. C76, 269 (1997).
- [80] J. Cleymans and K. Redlich, Phys. Rev. Lett. 81, 5284 (1998).
- [81] J. Letessier, J. Rafelski, and A. Tounsi, Phys. Lett. B328, 499 (1994); M. Kaneta, et al., NA44 Collaboration, J. Phys. G 23, 1865 (1997).
- [82] W. Broniowski and W. Florkowski, Phys. Rev. C 65, 024905 (2002); Phys. Rev. Lett. 87, 272302 (2001).
- [83] Z. Xu, J. Phys. G 30, S325 (2004).
- [84] S. Voloshin, A.M. Poskanzer, and R. Snellings, this Volume.
- [85] S.S. Adler, et al., PHENIX Collaboration, Phys. Rev. Lett. 91, 182301 (2003).
- [86] P. Huovinen, P. Kolb, U. Heinz, P.V. Ruuskanen, and S. Voloshin, Phys. Lett. B503, 58 (2001).
- [87] Z. Lin and C. Ko, Phys. Rev. Lett. 89, 202302 (2002); R.J. Fries, B. Mueller, C. Nonaka, and S.A. Bass, Phys. Rev. Lett. 90, 202303 (2003); D. Molnar and S. Voloshin, Phys. Rev. Lett. 91, 092301 (2003).
- [88] R.J. Fries, B. Mueller, C. Nonaka, and S.A. Bass, Phys. Rev. C 68, 044902 (2003); C. Nonaka, B. Mueller, M. Asakawa, S.A. Bass, and R.J. Fries, Phys. Rev. C 69, 031902 (2004).
- [89] X. Dong, S. Esumi, P. Sorensen, N. Xu, and Z. Xu, Phys. Lett. B597, 328 (2004).
- [90] J. Adams, et al., STAR Collaboration, Phys. Lett. B612, 181 (2005) and references therein.
- [91] E.V. Shuryak, Phys. Lett. B78, 150 (1978).
- [92] R. Rapp, Phys. Rev. C 63, 054907 (2001).
- [93] X. Zhu, N. Xu, and P. Zhuang, Phys. Rev. Lett. 100, 152301 (2008).
- [94] A. Adare, et al., PHENIX Collaboration, Phys. Rev. Lett. 98, 172301 (2007).
- [95] R. Arnaldi, et al., NA60 Collaboration, Phys. Rev. Lett. 100, 022302 (2007).
- [96] M.A. Stephanov, K. Rajagopal, and E.V. Shuryak, Phys. Rev. Lett. 81, 4816 (1998).