Lyman Break Galaxies at : Rest-Frame UV Spectra. III 111Based on observations obtained at the Gemini Observatory, which is operated by the Association of Universities for Research in Astronomy, Inc., under a cooperative agreement with the NSF on behalf of the Gemini partnership: the National Science Foundation (United States), the Science and Technology Facilities Council (United Kingdom), the National Research Council (Canada), CONICYT (Chile), the Australian Research Council (Australia), Ministério da Ciência e Tecnologia (Brazil) and SECYT (Argentina).
Abstract
We present results of optical spectroscopic observations of candidates of Lyman Break Galaxies (LBGs) at in the region including the GOODS-N and the J0053+1234 region by using GMOS-N and GMOS-S, respectively. Among 25 candidates, five objects are identified to be at (two of them were already identified by an earlier study) and one object very close to the color-selection window turned out to be a foreground galaxy. With this spectroscopically identified sample and those from previous studies, we derived the lower limits on the number density of bright ( mag) LBGs at . These lower limits are comparable to or slightly smaller than the number densities of UV luminosity functions (UVLFs) that show the smaller number density among UVLFs in literature. However, by considering that there remain many LBG candidates without spectroscopic observations, the number density of bright LBGs is expected to increase by a factor of two or more. The evidence for the deficiency of UV luminous LBGs with large Ly equivalent widths was reinforced. We discuss possible causes for the deficiency and prefer the interpretation of dust absorption.
1 INTRODUCTION
In order to understand formation and evolution of galaxies, it is necessary to search and study high-redshift galaxies. Lyman Break Galaxies (LBGs), which are selected by rest-frame UV broad band photometry (e.g., Steidel & Hamilton, 1992; Steidel et al., 1995), make the largest sample of galaxies at among various populations selected through different methods, and their statistical and individual studies have been made extensively. For instance, based on photometric samples, rest-frame UV luminosity functions (UVLFs) of LBGs at are derived (e.g., Steidel et al., 1999; Iwata et al., 2003, 2007; Lehnert & Bremer, 2003; Ouchi et al., 2004; Beckwith et al., 2006; Sawicki & Thompson, 2006; Yoshida et al., 2006; Bouwens et al., 2007) and attempts to measure the LF have been made even at higher redshifts (e.g., Richard et al., 2006, 2008; Stark et al., 2007; Bouwens et al., 2008; Stanway et al., 2008b; Oesch et al., 2008). These studies are revealing the cosmic star formation history; the cosmic star formation rate density rises from to and turns to decline toward (e.g., Hopkins & Beacom, 2006). However two different evolutions of UVLFs are claimed. One is that from to the number density of UV faint galaxies increases while that of bright galaxies remains almost constant (Sawicki & Thompson, 2006; Iwata et al., 2007). The other is that while the number density of UV faint galaxies remains constant, that of bright galaxies increase (Yoshida et al., 2006; Bouwens et al., 2007). The number density of UVLF in bright part is key to understand the galaxy evolution at these redshifts.
Follow-up optical spectroscopic surveys have also been made (e.g., Steidel et al., 1996a, b, 1999). Shapley et al. (2003) studied spectra of LBGs and classified them into 4 categories according to their rest-frame Ly equivalent widths (EWs). They made a composite spectrum of each category and found that LBGs with smaller Ly EW tend to show larger EWs of low-ionization interstellar (LIS) absorption lines, larger velocity difference between Ly and LIS absorption, and redder rest-frame UV continua. Follow-up spectroscopic observations have been made for LBGs at (e.g., Lehnert & Bremer, 2003; Stanway et al., 2003, 2004, 2007; Ando et al., 2004, 2007; Dow-Hygelund et al., 2005, 2007). As redshift increases, the targets become fainter and the characteristic spectral features move into the wavelength region where night sky emissions are severe, thus detailed spectroscopic studies of LBGs are still not easy. Hence the sample size of spectroscopically identified LBGs is still very small. In addition, the spectroscopic studies have so far been relying on the Ly emission, and the features seen in the continuum are still not clear except for rare bright objects such as gravitationally lensed LBGs (Frye et al., 2002; Swinbank et al., 2007). Thus a larger deep spectroscopic sample of LBGs at is required to reveal spectroscopic properties of LBGs.
We have constructed a large sample of LBGs at based on Subaru/Suprime-Cam observations (Iwata et al., 2003, 2007), and we are conducting spectroscopic observations of selected targets from the photometric sample. The target fields are the region including the GOODS-N and the J0053+1234 region. The total area of the survey fields is 1290 arcmin2 and 228 objects are obtained with mag i.e. in the UVLF of LBGs (Iwata et al., 2007). Results of our follow-up spectroscopy with Faint Object Camera And Spectrograph (FOCAS) on Subaru Telescope were reported by Ando et al. (2004, 2007), and the number of bright ( mag) LBGs with spectroscopic identification was nine and that of faint ( mag) LBGs was two. Combining the data with those from literature, Ando et al. (2006) claimed the deficiency of bright LBGs with large EWs of Ly emissions at and . However, the sample size of our spectroscopically confirmed LBGs at was still very small. Thus we intended to increase the size of the spectroscopic sample.
In this paper we present the results of spectroscopic observations of LBGs in the region including the GOODS-N and the J0053+1234 region with Gemini Multi-Object Spectrograph North (GMOS-N) and South (GMOS-S), respectively. Gemini/GMOS spectrographs have nod-and-shuffle capability, which enables us to subtract sky emission more clearly and helps the detection of continuum features. In section 2, we describe our sample selection, observations, and data reduction. The results and obtained spectra are presented in section 3. In section 4, we discuss distributions of redshifts and colors, an implication to the UVLF of LBGs at , and rest-frame EWs of Ly emission, combining present results with previous data by Ando et al. (2004, 2007) and by others. Throughout this paper, we used a flat cosmology; , , and km s-1 Mpc-1. All magnitudes are given in the AB system (Oke & Gunn, 1983).
2 TARGET SELECTION, OBSERVATIONS, AND DATA REDUCTION
The photometric sample of LBGs at was obtained in the region including the GOODS-N and the J0053+1234 region, based on -, -, and -band images taken with Subaru/Suprime-Cam (Iwata et al., 2003, 2007). The color criteria for LBGs are
| (1) |
and
| (2) |
The sample size is objects ( mag) in the region including the GOODS-N and objects ( mag) in the J0053+1234 region. More details of the imaging observations and the color selection are described by Iwata et al. (2007). We selected bright ( mag) LBG candidates as main spectroscopic targets, aiming at detecting the continuum and absorption features. Because the entire survey field is too wide to obtain the spectra of all LBG candidates in the survey field, we selected multi-object spectroscopy (MOS) fields to cover as many main targets as possible. When two slits in the mask design were in conflict, we chose the slit of the object with higher surface brightness. We filled the unused parts of the masks with as many faint ( mag) targets as possible. We designed 3 masks in the GOODS-N, its flanking field, and the J0053+1234 region. The numbers of bright LBGs in the masks are 7, 5, and 10, respectively, and the numbers of faint objects are 1, 2, and 0, respectively. In the J0053+1234 region, we also observed five objects outside, but near the border of, our color selection criteria, in order to examine our color selection criteria.
Preference to the higher surface brightness mentioned above may introduce a bias to the spectroscopic sample. Thus we examined average surface brightness within (50% light encircled radius from SExtractor) as well as concentration parameter ( log of the spectroscopic sample among the whole photometric sample in the GOODS-N region including the samples by Ando et al. (2004, 2007). It is found that in mag the spectroscopic sample is fairly chosen from the whole sample, while in the spectroscopic sample tends to bias to LBGs with the higher average surface brightness and the higher concentration.
Optical spectroscopy was made by using the nod-and-shuffle (micro-shuffle) mode of GMOS (Hook et al., 2004) attached to the 8m Gemini Telescope North and South. All of the observations were executed in queue mode during May to June 2007 for the GOODS-N region (Gemini programs GN2007A-Q018-02, GN2007A-Q018-04) and from October 2007 to January 2008 for the J0053+1234 region (Gemini program GS2007B-Q206-01). We used the R400 grating blazed at 7640 Å with the order cut filter of OG515. Slits of 1′′ width and lengths were used and the spectral resolution was Å measured from night sky emission lines. Each spectrum covers the wavelength range of Å depending on the slit position on the mask. The exposure time for individual frame was 1800 s, and total exposure times were 10, 8, and 15.5 hours for the GOODS-N, its flanking field, and the J0053+1234 region, respectively. Nod interval for each position was s for all observations, and the nod distances were , , and for the GOODS-N, its flanking field, and the J0053+1234 region, respectively. Seeing sizes were typically about 0.7′′ for both GMOS-N and GMOS-S. Details of observations for each field are listed in Table 1 and Table 2.
The data were reduced with the Gemini IRAF777Image Reduction and Analysis Facility, distributed by National Optical Astronomical Observatories (NOAO), which are operated by the Association of Universities for Research in Astronomy (AURA), Inc., under cooperative agreement with the National Science Foundation. package, standard IRAF packages, and custom code using the FITSIO package. First, bias subtraction was made with combined bias frame. Next we shifted the images with the shuffle distance along the slit and subtracted them from the images before shifting to remove the night-sky emissions. The resultant images were flat-fielded using the dome flat images taken at the time closest to the time when the object images were taken. Then the images were combined after correcting a small offset of the spectra in each exposure. Wavelength calibration was made by using the night sky emission lines. An accuracy estimated from night sky emission lines was Å. One dimensional positive and negative spectra were extracted with our custom code, with the aperture determined by eye. We combined the positive and negative spectra and applied sensitivity correction to them using the spectra of standard stars (Feige 66 for GMOS-N and LTT 9239 for GMOS-S). We did not make a flux calibration. The final spectra were obtained by binning the pixels along the wavelength direction to improve the S/N. The numbers of pixels binned are 5 and 10 for spectra obtained by GMOS-N and GMOS-S, respectively, to have an identical wavelength bin size (Å).
3 RESULTS
3.1 LBGs Identified to be
Among 22 bright LBG candidates, we identified four objects to be LBGs at . We also identified one object as a LBG among three faint targets based on its Ly emission. The resultant spectra of the LBGs identified are shown in Figure 1.
N106944 shows a clear continuum depression and some LIS absorption lines (Si II 1260, O I+Si II 1303, and C II 1335), hence we can securely conclude that it is at . The redshift determined from the LIS absorption lines is . N127245, S101900, and S103759 show a single emission line and a continuum depression in a wavelength region shortward of the emission line, hence their identifications are also secure. The redshifts of N127245, S101900, and S103759 determined from the Ly emission line are , , and , respectively888Two identified LBGs in the J0053+1234 region, S101900 () and S103759 (), had been previously identified by Steidel et al. (1999) in their survey, where they were found to be at the upper end of their redshift selection window.. The other identified LBG, N141368 that is chosen from the faint LBG sample ( mag), shows a single emission line at 7478Å. If the emission line is [O III]5007 or H, its redshift is 0.49 or 0.54, respectively. In this case, a strong H emission line is expected to come to 9803Å or 10097Å, respectively. However, no significant emission is seen at this wavelength, though the signal-to-noise ratio (S/N) in such a red region is very low. If the emission line is [O III]5007, the [O III]4959 should be seen at 7406Å with a 1/3 flux, which is not seen. Another possibility is an identification of [O II]3727. If this is the case, an H emission line should come to 9754Å. Again no significant emission line is seen. Since the continuum feature longward of the emission line is slightly seen in the wavelength regions where the sky emission is weak and there seems to be a break around at 7460Å, we identified this emission line as Ly. The redshift determined from the Ly emission is . The properties of the LBGs identified are summarized in Table 3.
Among 18 remaining bright LBG candidates, we concluded one object (N111905) is a foreground contamination as described in section 3.2. The remaining objects were not identified because of low S/N in their spectra or no spectral feature in the observed wavelength coverage. Combining with our previous results by Ando et al. (2004, 2007), the total number of our spectroscopic LBG sample is 16.
We examined the identification rates of the spectroscopic sample including the results by Ando et al. (2004, 2007). Targets with the higher average surface brightness tend to be identified efficiently; in mag, among targets with average surface brightness higher than 29.8 mag arcsec-2 the identification rate is %, while it is % among targets with fainter average surface brightness. Among targets with mag, highly concentrated objects tend to be identified; % are identified among objects with , while only % for those with . These trends, however, can not be seen among targets with mag; identification rate is higher in more extended objects, though the subsample size is smaller. It should be worth mentioning that the identified LBGs with mag show strong Ly emission, while most of the identified LBGS with mag show no or very weak Ly emission. The trend that luminous LBGs do not show strong Ly emission prevents us from achieving a high identification rate even in bright LBG sample. The trend and its physical cause will be discussed in .
3.2 Foreground Objects
We identified three foreground objects; one is in our color criteria and the others are outside of the criteria. The former (N111905) shows an emission line at 8209Å and the continuum is seen shortward of the emission line. Thus this object should be a foreground object. If the emission line at 8209Å is [O II]3727, its redshift is , and no other major emission lines seen in star-forming galaxies come into the observed wavelength coverage. If the emission line is one of H, [O III]4959, or [O III]5007, other lines should appear around the emission line, but no other emission lines can be seen. Hence probably the object is a foreground object at . However, its color is somewhat redder than the expected color for a star-forming galaxy at . It is worth noting that the object is located quite close to the selection criteria (see Section 4.1). The contamination rate in our spectroscopic sample with -band magnitude from to in the GOODS-N region is 1/9 (including those from Ando et al., 2004, 2007), which is not larger than the estimated value of 17 % (Iwata et al., 2007).
One of the five targets outside of the color selection window is identified to be a Galactic M star. Its and colors are consistent with typical colors of Galactic M stars (see Section 4.1). Another object outside of the color selection window is identified to be an elliptical galaxy at . Its spectrum clearly shows a Mgb absorption, 4000Å break, and Ca H and K absorptions. No emission lines are seen. However, its and colors are somewhat bluer than the expected colors for an early-type galaxy at . The remaining objects were not identified because of low S/N in their spectra or no spectral feature in the observed wavelength coverage.
4 DISCUSSION
4.1 Redshift and Color Distribution of LBGs
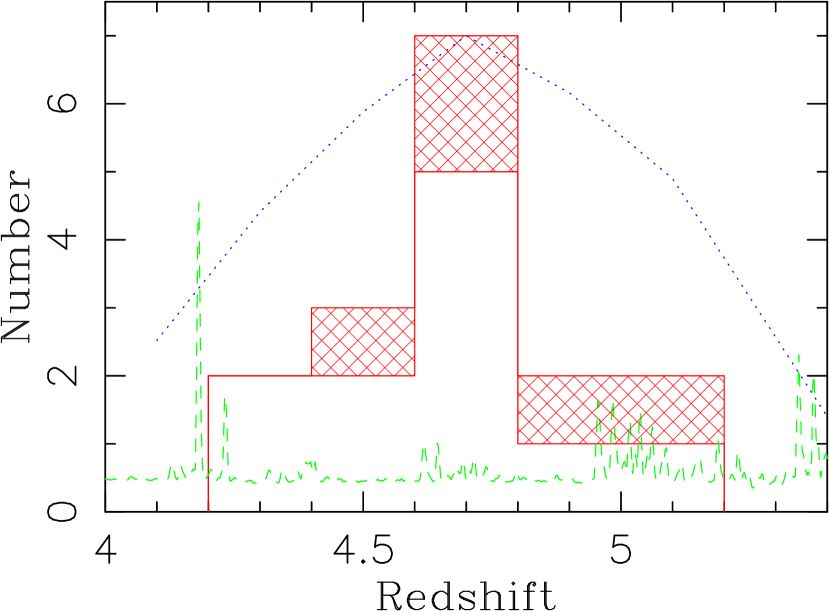
Figure 2 shows the redshift distribution of spectroscopically confirmed LBGs in this study and that by Ando et al. (2004, 2007). Hatched and white histograms show LBGs from the present results and from the FOCAS sample by Ando et al. (2004, 2007), respectively. We show the expected redshift distribution of our sample of LBGs as a dotted line normalized at . The expected distribution was calculated based on the detection rates of the LBGs against the apparent magnitude and the redshift for each survey field by considering the survey volume and reached depth in UVLF at each redshift bin (Ando et al., 2007). We also plotted the intensity of night sky emission at the wavelength corresponding to the redshifted Ly. Although the observed redshift distribution seems to be concentrated at , it is consistent with the expected distribution within the statistical uncertainty.
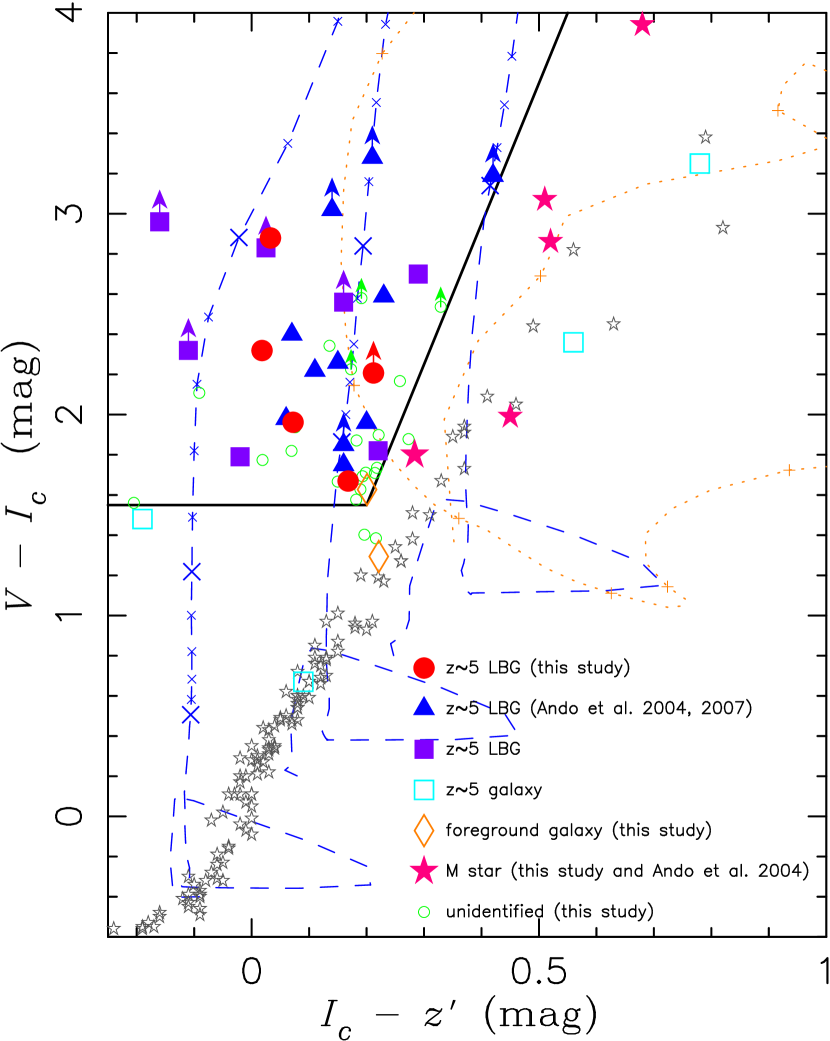
Figure 3 shows the positions of the observed LBGs in the two-color ( and ) diagram. A solid line shows our color selection criteria represented by eq. (1) and (2) (Iwata et al., 2007). Filled circles and filled triangles show the LBGs observed in this study and those by Ando et al. (2004, 2007), respectively. Open diamonds show the foreground galaxies found in this study. Filled stars show the Galactic stars in this study and those by Ando et al. (2004). Small open circles show LBG candidates unidentified in this study. Three dashed tracks show model colors of star-forming galaxies. The model spectrum of a star-forming galaxy is calculated with PÈGASE version 2 (Fioc & Rocca-Volmerange, 1997), by assuming constant star-formation history with an age of Myr, Salpeter initial mass function (IMF; Salpeter, 1955) with upper mass of 120 and lower mass of 0.1 , and the dust extinction curve by Calzetti et al. (2000). Average IGM attenuation is calculated based on a prescription by Inoue et al. (2005). Three tracks represent models of of 0.0, 0.4, and 0.8 mag. A dotted line represents a color track of an early-type galaxy (Coleman et al., 1980). As mentioned in section 3.2, one foreground galaxy resides in the color selection window, but it is very close to a boundary of the window. While majority of the spectroscopically confirmed LBGs lie away from the boundary, unidentified objects are close to it.
In Figure 3, galaxies spectroscopically identified by other studies in the survey fields (Tables 3 and 4 by Iwata et al., 2007; Barger et al., 2008) are also plotted . Filled and open squares show the identified objects in the color-selection window and those outside of it, respectively. Properties of all spectroscopically identified objects at are listed in Tables 4 and 5. Among them, one object shows peculiar colors of mag and mag. Iwata et al. (2007) suggest that this object may be a foreground object because the original identification was based on a single emission line. Other two objects with red colors may be dust reddened star-forming galaxies. However, if the redness of these objects is really due to the dust extinction, the extinction at rest-frame 1600 Å corresponds to 8 mag or more and the intrinsic luminosity is huge, if we assume the Calzetti extinction curve. In addition, their colors are not consistent with their redshifts; colors are too blue to be at . These may imply that the spectral models we adopt do not cover the whole real spectra of galaxies. Since we did not take spectra of objects outside of the color criteria extensively, further studies on such galaxies are desirable to know their nature and fraction.
4.2 Implications to the UV Luminosity Function of LBGs at
Using the photometric sample, Iwata et al. (2007) derived the UV luminosity function (UVLF) of LBGs at in the region including the GOODS-N and the J0053+1234 region. They found that there is a significant population of bright ( mag) LBGs at comparable to that of , while the faint ( mag) end of their UVLF shows a gradual increase from to (Sawicki & Thompson, 2006). So Iwata et al. (2007) suggest luminosity dependent evolution of LBGs at these redshifts. However, different results are derived from other studies of UVLF of LBGs at . The UVLFs in Subaru Deep Field and Subaru XMM-Newton Deep Field derived by Ouchi et al. (2004) and by Yoshida et al. (2006) show a smaller number density of bright LBGs than that found by Iwata et al. (2003, 2007), and suggest an evolution of the number density in the bright part of the UVLF from to . The UVLFs by Beckwith et al. (2006) and Bouwens et al. (2007) also show a similar trend to those by Ouchi et al. (2004) and Yoshida et al. (2006). The difference between the number density of bright ( mag) LBGs of Iwata et al. (2003, 2007) and that of Ouchi et al. (2004) and Yoshida et al. (2006) is dex.
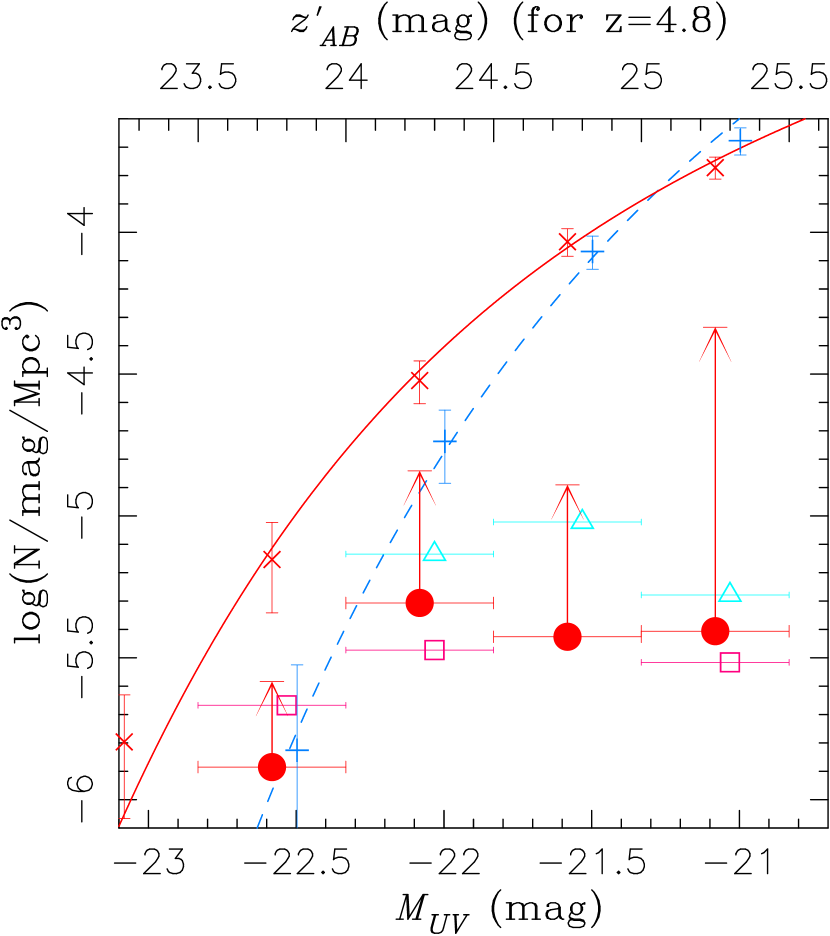
The cause of the divergence of UVLFs is still unknown. Field-to-field variance may exist. Or different filter sets used in various LBG surveys may cause the difference (Stanway et al., 2008a). The spectroscopic sample helps to constrain the UVLF. We derived the lower limit of the number density of LBGs at in the GOODS-N region and the J0053+1234 region, using the spectroscopically confirmed LBGs including the spectroscopy from the literature (Dawson et al., 2001, 2002; Fernández-Soto et al., 2001; Spinrad et al., 1998; Steidel et al., 1999; Barger et al., 2008), but not including galaxies outside of the color selection window. We derived the lower limits for each field by dividing the numbers of spectroscopically confirmed LBGs by the effective volume in each magnitude bin from Iwata et al. (2007). Then we averaged the lower limits of two fields weighting with their survey areas. When we calculate the UV absolute magnitude of the spectroscopic sample, we used the fixed redshift of for consistency with the estimation of the effective volume. The difference of the UV absolute magnitude by this assumption and that from spectroscopic redshift is mag.
Figure 4 shows the derived lower limits on the number density of LBGs at in the GOODS-N region, the J0053+1234 region, and their average. The solid and the dashed line shows the Schechter function fit to the UVLF of Iwata et al. (2007) and Yoshida et al. (2006), respectively with the data points (small crosses and pluses, respectively). The conservative estimation of the lower limits by using only the spectroscopic sample gives the number density of LBGs comparable to that by Yoshida et al. (2006) in the magnitude range of mag, and a slightly smaller value in mag. The fractions of spectroscopically confirmed LBGs to the total photometric sample in the magnitude range of mag, mag, mag, and mag are 0/5, 5/35, 6/72, and 3/126, respectively in the GOODS-N, and 2/10, 3/22, 0/79, and 2/122, respectively in the J0053+1234 region. Considering that more than half of the photometric sample by Iwata et al. (2007) are not observed yet, the number density of LBGs in each magnitude bin is expected to be larger than this lower limit by a factor two or more, and to approach toward the values by Iwata et al. (2007). We estimated the expected number densities if the full photometric sample were spectroscopically observed, by multiplying the number of the photometric sample by success rate of spectroscopy in each magnitude bin, and by dividing it by the effective volume from Iwata et al. (2007). Results are shown with arrows in Figure 4. The expected number densities of bright ( mag) LBGs are comparable to or slightly larger than those by Yoshida et al. (2006). Since we regarded all unidentified objects as foreground objects in this estimation, true number densities are probably larger than these estimations. Thus the number densities in the bright part from spectroscopic sample are still consistent with those from Iwata et al. (2003, 2007).
4.3 Rest-frame UV Luminosity and Ly EW
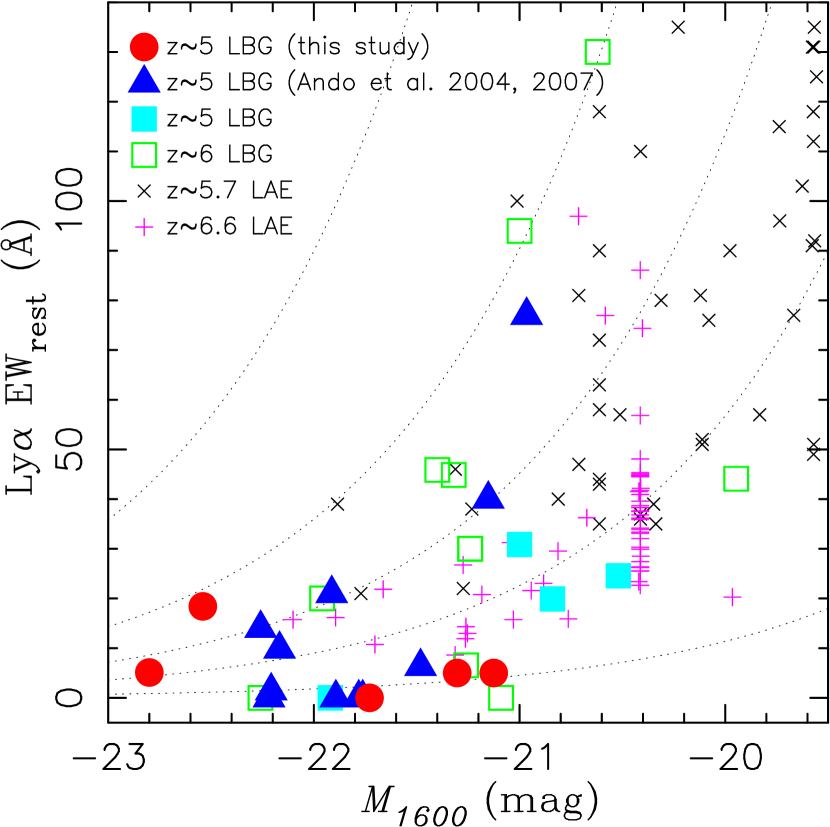
Ando et al. (2006) reported the absence of rest-frame UV luminous LBGs with large EW of Ly emission at . Combining recent results by Stanway et al. (2007) and Dow-Hygelund et al. (2007), we update the plot of rest-frame Ly EW against rest-frame UV absolute magnitude and show it in Figure 5. Rest-frame UV absolute magnitudes of the LBGs and LAEs were calculated from their -band magnitudes. We chose UV absolute magnitude at 1600Å () to minimize the effect of uncertainty of continuum slope. We selected () as a typical value for young starburst. The value of is consistent with the observed colors of spectroscopically confirmed LBGs. The uncertainty of due to the assumption of () is about mag. If the continuum flux densities at longward of Ly line are listed in the literature, we used them to derive the rest-frame UV absolute magnitudes to mitigate the influence by strong Ly emission and IGM attenuation in the band (Nagao et al., 2004, 2005; Taniguchi et al., 2005). Filled circles and filled triangles show spectroscopically confirmed LBGs in this study and that by Ando et al. (2004, 2007), respectively. Other symbols show LBGs and LAEs from the literature. Filled squares, open squares, crosses, and pluses represent LBGs (Lehnert & Bremer, 2003; Stanway et al., 2007), LBGs (Lehnert & Bremer, 2003; Stanway et al., 2003, 2004, 2007; Nagao et al., 2004, 2005; Dow-Hygelund et al., 2005, 2007), LAEs (Ajiki et al., 2003; Shimasaku et al., 2006), and LAEs (Taniguchi et al., 2005), respectively.
The deficiency of UV luminous LBGs with large Ly EW is seen in our revised plot. There are no luminous ( mag) LBGs with large (Å) EW Ly emission. Although we may miss the faint LBGs with small Ly EW, we can detect luminous LBGs with large Ly EW. Thus the deficiency must be real. Such distribution is also seen among LBGs, LAEs, and LAEs. The threshold UV magnitude seems to lie around mag mag, and this value is close to of our LBG sample ( mag; Iwata et al., 2007). A similar trend can be seen among LBGs (Shapley et al., 2003); a composite spectrum of UV luminous LBGs shows smaller Ly EW than that of UV faint ones.
The deficiency of UV luminous LBGs with large Ly EW may reflect the deficiency of LBGs (and LAEs) with large Ly luminosity. Dotted lines in Figure 5 represent constant Ly luminosities of , , , and ergs s-1 from top-left to bottom-right. It appears that very few objects show Ly luminosity larger than ergs s-1. Since the number density of galaxies with such large Ly luminosity is small, the deficiency may be due to poor statistics (e.g., Nilsson et al. 2009). Meanwhile, galaxies under constant star formation with ages of Myr are expected to show EWs of Å intrinsically. (We used the PÈGASE version 2 (Fioc & Rocca-Volmerange, 1997), with Salpeter IMF (Salpeter, 1955) with an upper-mass limit of 120 , and assumed the case B recombination and all Lyman continuum photons ionize neutral hydrogen.) Thus, the deficiency of large Ly EWs among UV luminous () galaxies is still mysterious. Possible causes of small EWs in UV luminous LBGs (except for the poor statistics) are (i) difference of escape fraction of Ly emission; Ly emission is selectively quenched by dust extinction and/or scattering by neutral hydrogen in more UV luminous galaxies, (ii) difference of time scale of star formation; the UV continuum is the probe of star-formation with longer time scale than the nebular emission lines, and star-formation age is larger in more UV luminous galaxies, and (iii) difference of IMF in the galaxies; deficiency of massive stars in more UV luminous galaxies.
The escape of Ly emission is a complex problem, and it is thought to depend on the geometry, dynamics, column density, and dust content of neutral hydrogen in/around the star-forming regions. In nearby starburst galaxies, the existence or absence of outflow of neutral hydrogen largely affects the escape fraction, and the effect of dust content is small (e.g. Kunth et al., 1998; Mas-Hesse et al., 2003; Atek et al., 2008). These authors showed that starburst galaxies with static interstellar media show Ly as absorption, whereas galaxies showing velocity offset between interstellar absorption lines and Ly show Ly as emission lines. In high redshift galaxies, on the other hand, LBGs with larger velocity offset between interstellar absorption and Ly tend to show smaller Ly EW (Shapley et al., 2003). In addition, LBGs with a large Ly EW show bluer UV continua (Shapley et al., 2003; Tapken et al., 2007), suggesting that the dust extinction is the main cause for the Ly quench. At , although the correlation between the EW and color is not clear, the LBGs with large Ly EW (Å) in our sample and that by Ando et al. (2004, 2007) (combined sample) show relatively blue observed colors ( mag and mag). The LBG with the largest EW in the combined sample shows a weak or no LIS absorption lines in its UV continuum. We roughly estimated the metallicity of nine LBGs which show LIS absorption lines in the combined sample, using the empirical relation between the metallicity and the EWs of LIS absorption lines (Heckman et al., 1998). The average value is (Z⊙, Allende Prieto et al., 2001), suggesting that LBGs at are chemically evolved to some extent and expected to contain dust. These prefer the dust extinction as the major cause for the Ly quench. If more UV luminous LBGs are more chemically evolved than UV faint ones on average, it suggests that UV luminous LBGs formed earlier (Ando et al., 2006; Iwata et al., 2007). It should be mentioned, however, that color excesses of a part of the photometric LBG sample (Iwata et al., 2007) are derived by SED fitting by covering rest-frame UV to optical wavelength (Yabe et al. (2009); they assumed the constant star formation history, the Calzetti extinction curve, and 0.2 solar abundance as a fiducial model), and no clear correlation is seen between the derived color excesses and Ly EWs. However, the number of LBGs for which both color excesses and spectra are obtained is only five, and the range of the EW is very limited (up to only 5Å). We further examined a relation between the magnitude and the color excess obtained by SED fitting by Yabe et al. (2009), but found no clear trend.
The age of a galaxy also affects the EW of Ly. Young starbursts are expected to show large Ly EW, while old galaxies show small EW. Ages of a part of our LBG sample are also obtained by SED fitting (Yabe et al., 2009); no clear relation between the age and the Ly EW can be seen (the sample size is five as mentioned above). We further examined the distribution of ages against magnitude by using results of the SED fitting (Yabe et al., 2009). The derived ages range from a few Myr to a few 100 Myr with a median of 25 Myr under constant star formation, and an absence of young ages ( Myr) is seen among bright LBGs ( mag). However, with the supposed IMF (Salpeter IMF with an upper-mass limit of ) in the SED fitting, the Ly EW is Å at ages from 10 Myr to 1 Gyr, thus the age is unlikely to be a primary cause for the small Ly EW. If we assume an exponentially decaying star formation history, the EW decreases more rapidly. Since Yabe et al. (2009) also studied the exponentially decaying models with Myr, 10 Myr, 100 Myr, and 1 Gyr, we examined the cases using their data and found that the UV bright LBGs show relatively young ages of 1 Myr to 10 Myr with a median of Myr. With these ages, the exponentially decaying model with Myr shows Ly EWs larger than Å, again suggesting that the age is not the primary cause for the deficiency of large Ly EWs. It is worth noting here that for the LBGs Shapley et al. (2003) claim that the composite spectrum of old LBGs ( 1 Gyr) shows larger EW of Ly emission than young LBGs ( Myr). Shapley et al. (2003) interpret that dust extinction in old LBGs is smaller than in young LBGs that are under active star formation.
A top-heavy IMF produces a large Ly EW; in less UV luminous galaxies this may occur especially in LAEs. The Salpeter IMF with an upper-mass limit of 120 produces more than Å of Ly EW in a young phase ( Myr) under constant star formation and Case B assumptions as described before. To reduce the EW in the young phase to less than Å by changing an upper-mass limit, it should be smaller. If the upper-mass limit is , the EW is smaller than Å at ages larger than 1 Myr. Although this seems to be unlikely for most UV-luminous class active star-forming galaxies at high redshifts, we cannot rule out this possibility completely.
5 Summary
We presented results of optical spectroscopic observations of LBGs. The observations were made in the GOODS-N and its flanking field with GMOS-N and in the J0053+1234 region with GMOS-S. The number of bright ( mag) LBG candidates observed is 22 and the total number of observed LBG candidates is 25. We identified four LBGs among 22 bright targets (2 LBGs identified in the J0053+1234 region were already spectroscopically identified by Steidel et al., 1999) and one LBG among three faint targets. The redshift distribution of identified LBGs is consistent with the expected redshift distribution. One target turned out to be a foreground galaxy is located almost at the boundary of the color selection window in the two-color diagram. The foreground contamination fraction is consistent with model expectations based on simulations (Iwata et al., 2007). At the same time two objects just outside of the color selection window are identified to be foreground objects; one is an M-type star, and the other is an elliptical galaxy at .
Using the full spectroscopically confirmed sample, we derived the raw lower limits on the number density of bright ( mag) LBGs at . The lower limits are comparable to or slightly smaller than the number densities derived by Yoshida et al. (2006). However, considering that there remains a number of LBG candidates without spectroscopic observations, the number density of spectroscopically derived bright LBGs is expected to increase by a factor of two or more.
We confirmed the deficiency of rest-UV luminous () LBGs with large rest-frame EW (Å) of Ly emission (Ando et al., 2006). We discussed possible causes for the deficiency and prefer the interpretation of dust absorption rather than gas outflow, age difference, and IMF difference.
We would like to thank staff members at Gemini observatory for carrying out our observations. Especially, we are grateful to support scientists Atsuko Nitta and Bryan Miller for their helpful comments during preparation. This work was partly made based on Gemini-Subaru machine time exchange program. This work is supported by Grant-in-Aid for Scientific Research on Priority Area (19047003) from Ministry of Education, Culture, Sports, Science, and Technology of Japan, and in part supported by funding from the Natural Sciences and Engineering Research Council of Canada and by the Canadian Space Agency.
References
- Ajiki et al. (2003) Ajiki, M., et al. 2003, AJ, 126, 2091
- Ando et al. (2004) Ando, M., Ohta, K., Iwata, I., Watanabe, C., Tamura, N., Akiyama, M., & Aoki, K. 2004, ApJ, 610, 635
- Ando et al. (2006) Ando, M., Ohta, K., Iwata, I., Akiyama, M., Aoki, K. & Tamura, N. 2006, ApJ, 645, L9
- Ando et al. (2007) Ando, M., Ohta, K., Iwata, I., Akiyama, M., Aoki, K., & Tamura, N. 2007, PASJ, 59, 717
- Allende Prieto et al. (2001) Allende Prieto, C., Lambert, D. L., & Asplund, M. 2001, ApJ, 556, L63
- Atek et al. (2008) Atek, H., Kunth, D., Hayes, M., Ö-Stlin, G., & Mas-Hesse, J. M. 2008, A&A, 488, 491
- Barger et al. (2008) Barger, A. J., Cowie, L. L., & Wang, W.-H. 2008, ApJ, 689, 687
- Beckwith et al. (2006) Beckwith, S. V. M., et al. 2006, AJ, 132,1729
- Bouwens et al. (2007) Bouwens, R. J., Illingworth, G. D., Franx, M., & Ford, H. 2007, ApJ, 670, 928
- Bouwens et al. (2008) Bouwens, R. J., Illingworth, G. D., Franx, M., & Ford, H. 2008, ApJ, 686, 230
- Calzetti et al. (2000) Calzetti, D., Armus, L., Bohlin, R. C., Kinney, A. L., Koornneef, J., & Storchi-Bergmann, T. 2000, ApJ, 533, 682
- Coleman et al. (1980) Coleman, G. D., Wu, C.-C., & Weedmann, D. W. 1980, ApJS, 43, 393
- Cowie et al. (2004) Cowie, L. L., Barger, A. J., Hu, E. M., Capak, P., & Songaila, A. 2004, AJ, 127, 3137
- Dawson et al. (2001) Dawson, S., Stern, D., Bunker, A. J., Spinrad, H., & Dey, A. 2001, AJ, 122, 598
- Dawson et al. (2002) Dawson, S., Spinrad, H., Stern, D., Dey A., van Breugel W., de Vries, W., & Reuland, M. 2002, ApJ, 570, 92
- Dow-Hygelund et al. (2005) Dow-Hygelund, C. C., et al. 2005, ApJ, 630, L137
- Dow-Hygelund et al. (2007) Dow-Hygelund, C. C., et al. 2007, ApJ, 660, 47
- Fernández-Soto et al. (2001) Fernández-Soto, A., Lanzetta, K. M., Chen, H.-W., Pascarelle, S. M., & Yahata, N. 2001, ApJS, 135, 41
- Fioc & Rocca-Volmerange (1997) Fioc, M., & Rocca-Volmerange, B. 1997, A&A, 326, 950
- Frye et al. (2002) Frye, B., Broadhurst, T., & Benitez, N. 2002, ApJ, 568, 558
- Heckman et al. (1998) Heckman, T. M., Robert, C., Leitherer, C., Garnett, D. R., & van der Rydt, F. 1998, ApJ, 503, 646
- Hook et al. (2004) Hook, I. M., Jorgensen, I., Allington-Smith, J. R., Davies, R. L., Metcalfe, N., Murowinski, R. G., & Crampton, D. 2004, PASP, 116, 425
- Hopkins & Beacom (2006) Hopkins, A. M., & Beacom, J. F. 2006, ApJ, 651, 142
- Inoue et al. (2005) Inoue, A. K., Iwata, I., Deharveng, J.-M., Buat, V., & Burgarella, D. 2005, A&A, 435, 471
- Iwata et al. (2003) Iwata, I., Ohta, K., Tamura, N., Ando, M., Wada, S., Watanabe, C., Akiyama, M., & Aoki, K. 2003, PASJ, 55, 415
- Iwata et al. (2007) Iwata, I., Ohta, K., Tamura, N., Akiyama, M., Aoki, K., Ando, M., Kiuchi, G., & Sawicki, M. 2007, MNRAS, 376, 1557
- Kunth et al. (1998) Kunth, D., Mas-Hesse, J.M., Terlevich, E., Terlevich, R., Lequeux, J., & Fall, S. M. 1998, A&A, 334, 11
- Lehnert & Bremer (2003) Lehnert, M. D., & Bremer, M. 2003, ApJ, 593, L630
- Mas-Hesse et al. (2003) Mas-Hesse, J. M., Kunth, D., Tenorio-Tagle, G., Leitherer, C., Terlevich, R. J., & Terlevich, E. 2003, ApJ, 598, 858
- Nagao et al. (2004) Nagao, T., et al. 2004, ApJ, 613, L9
- Nagao et al. (2005) Nagao, T., et al. 2005, ApJ, 634, 142
- Nilsson et al. (2009) Nilsson, K.K., Möller-Nilsson, O., Møller, P., Fynbo, J.P.U., Shapley, A.E. 2009, MNRAS, in press (arXiv:0907.3733)
- Oesch et al. (2008) Oesch, P. A., et al. 2008, ApJ, in press (arXiv: 0804.4874)
- Oke & Gunn (1983) Oke, J. B., & Gunn, J. E. 1983, ApJ, 266, 713
- Ouchi et al. (2004) Ouchi, M., et al. 2004, ApJ, 611, 660
- Pickles (1998) Pickles, A. J. 1998, PASP, 110, 863
- Richard et al. (2006) Richard, J., Pelló, R., Schaerer, D., Le Borgne, J.-F., & Kneib, J.-P. 2006, A&A, 456, 861
- Richard et al. (2008) Richard, J., Stark, D. P., Ellis, R. S., George, M. R., Egami, E., Kneib, J.-P., & Smith, G. P. 2008, ApJ, 685, 705
- Salpeter (1955) Salpeter, E. E. 1955, ApJ, 121, 161
- Sawicki & Thompson (2006) Sawicki, M., & Thompson, D. 2006, ApJ, 642, 653
- Shapley et al. (2003) Shapley, A. E., Steidel, C. C., Pettini, M., & Adelberger, K. L. 2003, ApJ, 588, 65
- Shimasaku et al. (2006) Shimasaku, K., et al. 2006, PASJ, 58, 313
- Spinrad et al. (1998) Spinrad H., Stern D., Bunker A. J., Dey, A., Lanzetta, K., Yahil, A., Pascarelle, S., & Fernandez-Soto, A. 1998, AJ, 116, 2617
- Stanway et al. (2003) Stanway, E. R., Bunker, A. J., & McMahon, R. G. 2003, MNRAS, 342,439
- Stanway et al. (2004) Stanway. E. R., Bunker, A. J., McMahon, R. G., Ellis, R. S., Treu, T., & McCarthy, P. J. 2004, ApJ, 607, 704
- Stanway et al. (2007) Stanway, E. R., et al. 2007, MNRAS, 376, 727
- Stanway et al. (2008a) Stanway, E. R., Bremer, M. N., & Lehnert, M. D. 2008a, MNRAS, 385, 493
- Stanway et al. (2008b) Stanway, E. R., Bremer, M. N., Squitieri, V., Douglas, L. S., & Lehnert, M. D. 2008b, MNRAS, 386, 370
- Stark et al. (2007) Stark, D. P., Ellis, R. S., Richard, J., Kneib, J.-P., Smith, G. P., & Santos, M. R. 2007, ApJ, 663, 10
- Steidel & Hamilton (1992) Steidel, C. C., & Hamilton, D 1992, AJ, 104, 941
- Steidel et al. (1995) Steidel, C. C., Pettini, M., & Hamilton, D. 1995, AJ, 110, 2519
- Steidel et al. (1996a) Steidel, C. C., Giavalisco, M., Dickinson, M., & Adelberger, K. L. 1996a, AJ, 112, 352
- Steidel et al. (1996b) Steidel, C. C., Giavalisco, M., Pettini, M., Dickinson, M., & Adelberger, K. L. 1996b, ApJ, 462, L17
- Steidel et al. (1999) Steidel, C. C., Adelberger, K. L., Giavalisco, M., Dickinson, M., & Pettini, M. 1999, ApJ, 519, 1
- Stern & Spinrad (1999) Stern, D., & Spinrad, H. 1999, PASP, 111, 1475
- Swinbank et al. (2007) Swinbank, A. M., Bower, R. G., Smith, G. P., Wilman, R. J., Smail, I., Ellis, R. S., Morris, S. L., & Kneib, J.-P. 2007, MNRAS, 376, 479
- Taniguchi et al. (2005) Taniguchi, Y., et al. 2005, PASJ, 57, 165
- Tapken et al. (2007) Tapken, C., Appenzeller, I., Noll, S., Richling, S., Heidt, J., Meinkohn, E., & Mehlert, D. 2007, A&A, 467, 63
- Yabe et al. (2009) Yabe, K., Ohta, K., Iwata, I., Sawicki, M., Tamura, N., Akiyama, M., & Aoki, K. 2009, ApJ, 693, 507
- Yoshida et al. (2006) Yoshida, M., et al. 2006, ApJ, 653, 988
| Gemini ID | Field | Center of Mask | (J2000.0) | Instrument | Observation | Exposure Time |
|---|---|---|---|---|---|---|
| R.A. | Decl. | Period | (s) | |||
| GN2007A-Q018-02 | GOODS-N | 12:36:20.680 | 62:14:13.00 | GMOS-N | 2007 May 25 | |
| to 2007 Jun 10 | ||||||
| GN2007A-Q018-04 | flanking field | 12:37:51.830 | 62:08:44.00 | GMOS-N | 2007 Jun 17 | |
| of GOODS-N | to 2007 Jun 24 | |||||
| GS2007B-Q206-01 | J0053+1234 | 00:53:26.930 | 12:31:45.00 | GMOS-S | 2007 Oct 5 | |
| to 2008 Jan 6 |
| Gemini ID | Grating | Filter | Slit Size | Pixel Scale |
|---|---|---|---|---|
| (arcsec arcsec) | Å arcsec | |||
| GN2007A-Q018-02 | R400+_G5305 | OG515_G0306 | ||
| GN2007A-Q018-04 | R400+_G5305 | OG515_G0306 | ||
| GS2007B-Q206-01 | R400+_G5325 | OG515_G0330 |
| ID | R.A. | Decl. | Redshift | Ly EW | ||||
|---|---|---|---|---|---|---|---|---|
| (J2000.0) | (J2000.0) | (mag) | (mag) | (mag) | (mag) | (Å) | ||
| N106944 | 12:37:58.12 | 62:09:51.3 | ||||||
| N127245 | 12:36:35.49 | 62:13:50.3 | ||||||
| N141368 | 12:36:14.21 | 62:16:43.3 | ||||||
| S101900 | 00:53:35.57 | 12:31:44.1 | ||||||
| S103759 | 00:53:33.21 | 12:32:07.3 |
| ID | R.A. | Decl. | Redshift | Referencea | |||
|---|---|---|---|---|---|---|---|
| (J2000.0) | (J2000.0) | (mag) | (mag) | (mag) | |||
| N146624(F36279-1750) | 12:36:27.74 | +62:17:47.8 | 1 | ||||
| N119188(HDF 3-951.0) | 12:37:00.23 | +62:12:19.8 | 2 | ||||
| N116886(HDF 4-625.0) | 12:36:44.65 | +62:11:50.7 | 3 | ||||
| N136110(ES1) | 12:36:49.23 | +62:15:38.8 | 4 | ||||
| N135557 | 12:36:55.48 | +62:15:32.9 | 5 | ||||
| N139345 | 12:38:06.84 | +62:16:20.4 | 5 | ||||
| N104268(A04-1) | 12:38:11.32 | +62:09:19.4 | 6 | ||||
| N144200(A04-2) | 12:37:57.49 | +62:17:19.0 | 6 | ||||
| N95819(A04-4) | 12:37:05.68 | +62:07:43.3 | 6 | ||||
| N139294(A04-5) | 12:38:28.96 | +62:16:18.8 | 6 | ||||
| N149472(A04-6) | 12:38:25.52 | +62:18:19.7 | 6 | ||||
| N129178(A04-7) | 12:38:04.36 | +62:14:19.7 | 6 | ||||
| N148198(A04-8) | 12:38:16.63 | +62:18:05.3 | 6 | ||||
| N106944 | 12:37:58.13 | +62:09:51.3 | 7 | ||||
| N127245 | 12:36:35.49 | +62:13:50.3 | 7 | ||||
| N141368 | 12:36:14.21 | +62:16:43.3 | 7 | ||||
| S64032(CDFb-G05) | 00:53:51.28 | +12:24:21.3 | 8 | ||||
| S106426(A06-1) | 00:52:21.34 | +12:32:35.3 | 6 | ||||
| S104115(A06-2) | 00:52:43.27 | +12:32:08.2 | 6 | ||||
| S091813(A06-3) | 00:52:39.88 | +12:29:44.1 | 6 | ||||
| S093014(A06-4) | 00:52:37.37 | +12:29:58.7 | 6 | ||||
| S101900(CDFa-GD7) | 00:53:35.57 | +12:31:44.1 | 7 | ||||
| S103759(CDFa-G1) | 00:53:33.21 | +12:32:07.3 | 7 |
| ID | R.A. | Decl. | Redshift | Referencea | |||
|---|---|---|---|---|---|---|---|
| (J2000.0) | (J2000.0) | (mag) | (mag) | (mag) | |||
| F36219-1516 | 12:36:21.88 | +62:15:17.0 | 1 | ||||
| F36376-1453 | 12:36:37.62 | +62:14:53.8 | 1 | ||||
| HDF 4-439.0 | 12:36:43.84 | +62:12:41.7 | 2 | ||||
| GOODS J123721.03+621502.1 | 12:37:21.00 | +62:15:02.1 | 3 |