Mid-Cycle Changes in Eta Carinae11affiliation: This research was supported by grants no. GO-10844 and 11291 from the Space Telescope Science Institute. The HST is operated by the Association of Universities for Research in Astronomy, Inc., under NASA contract NAS5-26555. 22affiliation: Some of the data presented in this paper were obtained from the Multi-mission Archive at the Space Telescope Science Institute (MAST). STScI is operated by the Association of Universities for Research in Astronomy, Inc., under NASA contract NAS5-26555. Support for MAST for non-HST data is provided by the NASA Office of Space Science via grant NAG5-7584 and by other grants and contracts. 33affiliation: Based on observations obtained at the Gemini Observatory (acquired through the Gemini Science Archive), which is operated by the Association of Universities for Research in Astronomy, Inc., under a cooperative agreement with the NSF on behalf of the Gemini partnership: the National Science Foundation (United States), the Science and Technology Facilities Council (United Kingdom), the National Research Council (Canada), CONICYT (Chile), the Australian Research Council (Australia), MinistB.rio da CiB0ncia e Tecnologia (Brazil) and SECYT (Argentina). 44affiliation: Uses data from observations made with ESO Telescopes at the La Silla Paranal Observatory under programme ID 077.D-0618(A) 55affiliation: Uses data from the AAVSO International Database.
Abstract
In late 2006, ground-based photometry of Car plus the Homunculus showed an unexpected decrease in its integrated apparent brightness, an apparent reversal of its long-term brightening. Subsequent HST/WFPC2 photometry of the central star in the near-UV showed that this was not a simple reversal. This multi-wavelength photometry did not support increased extinction by dust as the explanation for the decrease in brightness. A spectrum obtained with GMOS on the Gemini-South telescope, revealed subtle changes mid-way in Car’s 5.5 yr spectroscopic cycle when compared with HST/STIS spectra at the same phase in the cycle. At mid-cycle the secondary star is 20–30 AU from the primary. We suggest that the spectroscopic changes are consistent with fluctuations in the density and velocity of the primary star’s wind, unrelated to the 5.5 yr cycle but possibly related to its latitude-dependent morphology. We also discuss subtle effects that must be taken into account when comparing ground-based and HST/STIS spectra.
1 Introduction
Eta Carinae has a peculiar habit of settling into a photometric trend and spectroscopic state long enough for observers to grow accustomed to it, and then abruptly changing. Dramatic transitions occurred around 1840, 1890, and 1945, see Humphreys et al. (2008) and refs. therein; and there are hints that another may have begun in the late 1990’s. For almost 50 years after the 1940-1950 change, the star plus ejecta brightened at an average rate of 0.025 visual magnitude per year (O’Connell, 1956; Feinstein, 1967; Feinstein & Marraco, 1974; Mattei & Foster, 1998; Davidson et al., 1999a; Martin, 2005), largely due to expansion of the dusty Homunculus nebula which had been ejected around 1840. Essentially a bipolar reflection or scattering nebula, the Homunculus dominated Car’s total brightness throughout the 20th century. After 1997, however, observations with the Hubble Space Telescope (HST) revealed that the central star was now brightening far more rapidly (Davidson et al., 1999a; Martin & Koppelman, 2004; Martin et al., 2006b). Despite brief declines during the 1998.0 and 2003.5 spectroscopic events, its average rate from 1998 to 2006 was about 0.15 mag/yr. This was a recent development, since earlier speckle data (Weigelt & Ebersberger, 1986; Hofmann & Weigelt, 1988) show that the star had not brightened that quickly in the fifteen years before 1997. Ground-based photometry of the Homunculus after 1997 showed an increase that was less dramatic, but which exceeded any of the fluctuations seen between 1955 and 1995 (Sterken et al., 1999; Davidson et al., 1999a; Fernandez-Lajus et al., 2003; Whitelock et al., 2004; Martin & Koppelman, 2004). Most likely the circumstellar extinction began to decrease rapidly in the mid-1990’s; perhaps the rate of dust formation near the star had decreased, or dust was being destroyed, or both. Either case requires some undiagnosed change in the dense stellar wind (Martin et al., 2006b).
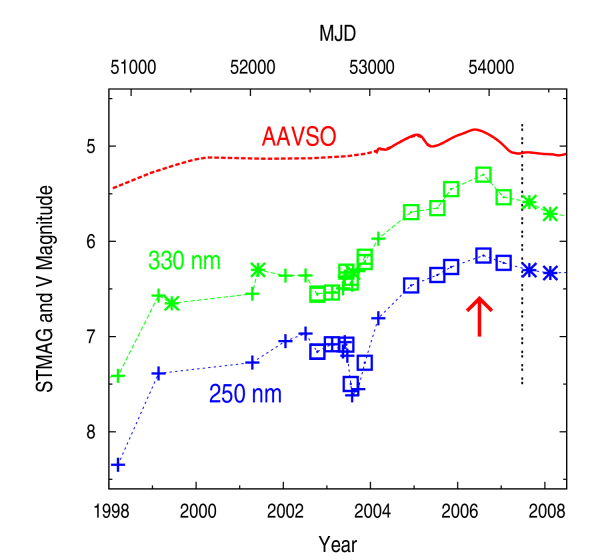
Thus, suspecting that another “change of state” was underway, we were surprised when ground-based photometry of Car plus the Homunculus showed a 0.3-magnitude decrease in brightness between August 2006 and March 2007 (DiScala & Jones, 2008; Fernandez-Lajus et al., 2009).111 See the CCD photometry by Georgio DiScala (Australia) and by Raymond W. Jones (South Africa) in the AAVSO International Database, http://www.aavso.org/ and the photometric record from La Plata Observatory (Argentina), http://etacar.fcaglp.unlp.edu.ar/. In our Figure 1, note that the decline may have begun in the season that is unfavorable for observing Car. It may have started as early as August or as late as December of 2006. The change occurred at all BVRI wavelengths and initially resembled the behavior seen during a spectroscopic event (Fig. 1). This was the largest decline in Car’s groundbased light curve event in at least the past 50 years, see van Genderen et al. (1999), Davidson et al. (1999a), and refs. therein. The integrated photometry of the Homunculus and central star vary in parallel (van Genderen & Sterken, 2004). Therefore, if this change proved to be a reversal of the previous several years’ behavior, then one might expect the central star to have faded by more than half a magnitude in 2006–2007, largely invalidating our conjectures about the future trend (Martin et al., 2006b). Thus it was important to obtain fresh HST photometry of the central star. Fortunately this was already a goal of a small existing program outlined in Section 2 below.
As usual in Car research, the results differ from any scenario proposed beforehand. The photometric decline soon leveled off, but our HST photometry strongly suggests that it was not merely a temporary reversal of the previous brightening trend (§3). Suspecting that the photometric reversal might signal unforeseen spectroscopic changes in the stellar wind, we obtained data with the Gemini Multi-Object Spectrometer (GMOS) in 2007 which can be compared with earlier data from the HST’s Space Telescope Imaging Spectrograph (STIS) in 1998–2004, and with VLT/UVES spectra from 2006 prior to the photometric decline. The spectroscopy revealed only subtle changes halfway through Car’s 5.5-year spectroscopic cycle, possibly related to the latitude-dependent morphology of the stellar wind.
Any interpretation of Car’s recent behavior must take into account its 5.54-year spectroscopic cycle; for general information see Humphreys & Stanek (2005), Martin et al. (2006a), and many references cited therein. Most authors agree that the 1998.0, 2003.5, and 2009.0 “spectroscopic events” probably occurred at periastron passages of a hypothetical companion star in a highly eccentric orbit. At times more than 7 months from such an event, the two stars are 15 to 30 AU apart – seemingly too distant for the secondary star to significantly influence the appearance of the primary wind in the observations discussed here. Although Kashi & Soker (2008a) have suggested that even at apastron the ionizing radiation from the secondary may not be negligible. At least in most scenarios proposed so far, one expects the 2006–2007 changes to signify structural effects in the primary wind more than wind–wind interactions.
In the next section we describe the photometric and spectroscopic observations including a description of the differences between ground-based and HST/STIS spectra and the complications that must be accounted for when comparing them. In §3 we discuss the observed variations in Car in 2006–2007, mid way in its 5.5 yr spectroscopic cycle, and compare them with spectra from the same phase in the previous cycle (2000–2002). The last section summarizes the observations with a brief discussion of their possible origin.
2 Observations
2.1 HST Photometry
Normal ground-based images of Car do not consistently separate the star from the inner parts of the Homunculus nebula, which has structure on all scales from 0.1″ to 10″. Until recently the Homunculus appeared brighter than the star, though the ejecta-to-star brightness ratio has evolved substantially in the past 20 years (Martin et al., 2006b). Precise ground-based photometry generally includes the entire Homunculus plus the star. HST images, however, have good enough spatial resolution to show the brightness of the star itself with only minor contamination by the ejecta located at . In recent years we have obtained a number of images of this type, to monitor the central star’s brightness and detect changes in the surrounding ejecta.
We obtained Hubble Space Telescope ACS/HRC images of Car in the F250W and F330W filters on 2006 August 4 (MJD 53951.1), near peak brightness, and 2007 January 20 (MJD 54120.4), during the unexpected decline. The central wavelengths of these broad-band filters are near 250 and 330 nm respectively. All of the images were reduced, measured, and calibrated as described in Martin et al. (2006b). For brightness measurements we used a weighted virtual aperture centered on the star, with diameter 0.3″ (about 10.7 ACS/HRC pixels). The aperture weighting function was with = 0.15″.222 In Martin et al. (2006b) we wrongly quoted = 0.3″, which was really the diameter . Martin & Koppelman (2004) stated this detail correctly. See also Smith et al. (2004) for aperture size effects in ACS images of Car.
Shortly after our January 2007 observations the ACS electronics failed. We then used the older HST/WFPC2 camera on 2007 August 23 (MJD 54335.1) and 2008 February 14 (MJD 54510.8), with filters F255W and F336W which are comparable to the ACS/HRC filters. These images were reduced using the standard STScI data reduction pipeline. A correction factor of 0.9915 was applied to the raw counts to compensate for geometric pixel distortion (Biretta et al., 1996), and the PHOTFLAM keyword induced a pipeline conversion from raw counts to flux values.
We measured the brightness of the central star in the WFPC2 data, using the same 0.3″ weighted virtual aperture ( 6.6 PC2 pixels) as for the ACS/HRC data. We estimated the aperture correction based on two 12th-magnitude stars in the images, well separated from the Homunculus, by comparing their fluxes in the virtual aperture to those in a standard 1″ measurement aperture corrected to infinite size (Holtzman et al., 1995). The resulting geometrical transmission factors are listed in Table 1.
To assess the effect of a known “red leak” in the WFPC2 F336W filter transmission curve, we convolved an HST/STIS spectrum of Car with the response function for the Planetary Camera with this filter. The flux at nm contributed only 0.94% of the counts, negligible for our purposes.
The STMAG photometric system is calibrated for direct comparison of fluxes measured with similar filters in different instruments (Sirianni et al., 2005). We tested the calibration by convolving the instrument and filter response functions with HST/STIS spectra of Car and comparing the results for the ACS/HRC F250W and F330W filters to those for the WFPC2 F255W and F336W filters. The computed values agreed to four significant digits, giving us confidence that comparisons between our ACS/HRC and WFPC2 results are valid. Our experience with the large existing HST data set for Car, 1991–2009, has never contradicted this assessment to a serious degree, despite the spectral forest of emission lines and strong UV absorption.
2.2 Spectroscopy
We obtained ground-based slit spectroscopy of Car with the Gemini Multi-Object Spectrograph (GMOS) on the Gemini South telescope in late June and early July 2007, just after the decrease in brightness. The parameters of these observations and subsequent GMOS observations in February and July 2008 are listed in Table 3. The parameters of the spectrograph are given in Table 4. We prepared 2-D spectrograms with the standard GMOS data reduction pipeline in the Gemini IRAF package and extracted 1-D spectra via a routine developed earlier for use with HST/STIS (Martin et al., 2006a) (Figure 2). At each wavelength our software integrates the counts along a line perpendicular to the dispersion, weighted by a mesa-shaped function centered on the local spectral trace. For these data we used a mesa function with base-width = 11 pixels and top-width = 7 pixels, about 0.8″ and 0.5″ respectively. The seeing was roughly 1.0″, so each GMOS spectrum discussed in §3 below represents a region about 1″ across.
HST/STIS spectra of Car had been obtained in October 2001 and January 2002, at approximately the same phase in its 5.54-year spectroscopic cycle (Davidson, 2004). We reduced them using a modified version of the Goddard CALSTIS reduction pipeline described in Martin et al. (2006a). The spectra are listed in Table 3 and the instrument parameters are given in Table 4. The January 2002 data most closely match the spectroscopic phase of July 2007.333 STIS and GMOS spectra used in this paper can be downloaded at http://etacar.umn.edu/.
Of course the spatial resolution of Gemini, limited by atmospheric seeing, is greatly inferior to HST/STIS and the inner ejecta are unavoidably mixed with the spectrum of the star. In particular our GMOS spectra include the “Weigelt knots” 0.3″ northwest of the star. Fortunately, by 2007 the star had become substantially brighter than the nearby ejecta – unlike the case 10 or 20 years earlier (Martin et al., 2006a). The 1-D STIS spectra used in this paper were prepared with an extraction width of 0.20″, which excludes most of the narrow emission from the inner ejecta; see important comments in subsection 2.3.
Moreover, the slow-moving inner ejecta produce narrow emission lines which are distinguishable from the broad stellar wind lines; typical widths are of the order of 20 and 400 km s-1 respectively. In the wavelength range of interest, the spectral resolution of GMOS is roughly 75 km s-1 while STIS provided about 40 km s-1. The narrow lines are therefore more blurred in the Gemini data while the broad stellar wind features and their P-Cygni absorption components are well resolved by both instruments. We have smoothed the STIS data plotted in Section 3 to match the resolution of GMOS.
H emission is so bright in Car that it saturates the detector pixels in even the shortest GMOS exposures centered on the star. We attempted to use a narrower slit, offset from the star by 0.6″ to sample the wings of the star’s p.s.f. This technique produced an unsaturated H profile, but it is probably too contaminated by surrounding ejecta to be trusted; see Subsection 2.3.
Unfortunately Car was not observed with Gemini/GMOS in 2005–2006 before the photometric fading. The ESO Science Archive does have spectra obtained with the VLT/UVES instrument in 2006444 The 2006 UVES observations were obtained at ESO’s Paranal Observatory under program ID 077.D-0618(A) by Weis et al. VLT/UVES observations of Car from 2002 to 2005 are available at http://etacar.umn.edu/. The UVES spectral sequence is also described by Nielsen et al (2009), but they did not note the potential problems with the later UVES spectra.. We reduced the 2006 spectra with the standard UVES pipeline available from ESO. The spectra were extracted using a mesa function 3 by 2 pixels wide, about 0.75 by 0.5. The seeing was 0.8 to 0.9 so this extraction corresponds to about 1 on the sky. None of the 2006 spectra are concurrent with the decrease. The closest in time is from June 2006 but internal clues suggest that the slit was not centered on the star. The spectra do not closely resemble earlier UVES observations (2002 - 2004) which were definitely centered on the star; the stellar-wind features are weaker and the narrow emission lines are much weaker than what one expects to see in a ground-based spectrum. The published position and acquisition image for the June 2006 spectrum also suggest that the slit might be offset from the star. The June 2006 UVES spectrum thus appears unsuitable for our purposes here. The narrow emission lines are also weaker than expected in the two spectra from 2005 and the April 2006 spectrum and weaker than in the 2007 GMOS spectra. This may also be due to pointing differences with respect to the earlier UVES spectra and the GMOS spectra. Although the April 2006 spectrum is referenced in the later discussion, it is used here with reservations for this reason.
2.3 An unsolved puzzle: The effect of spatial resolution on spectroscopy of Car
Provided the extraction size is less than 0.3″, an HST spectrum of Car shows the stellar wind with only slight contamination. Ground-based spectroscopy, on the other hand, with seeing of the order of 1″, also includes the spectrum reflected by dust at 0.15″ to 1″, plus narrow emission lines created in that region. Since reflection usually has little effect on the strengths of spectral features relative to the continuum, one might expect a ground-based spectrum of Car (i.e., central object plus reflected spectrum plus narrow-line emission) to closely resemble an HST spectrum, supplemented by the narrow lines. In fact, however, the earliest HST spectra showed that this is not the case (Davidson et al., 1995). Ground-based data show paradoxically weaker Balmer emission lines.
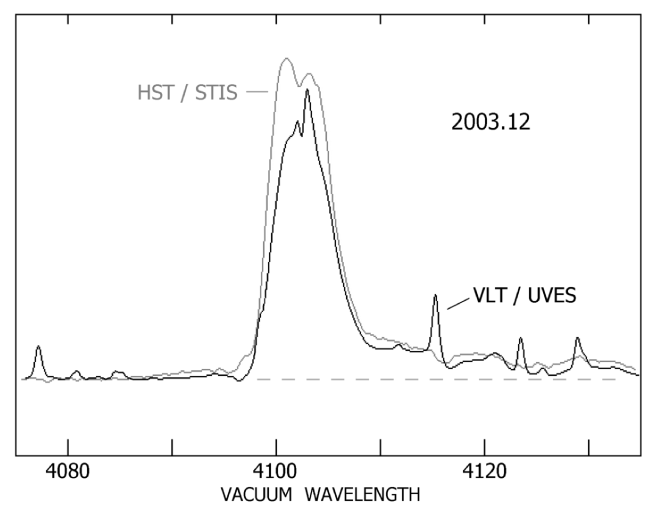
Fig. 3 shows how conspicuous this effect is. Here we use VLT/UVES to exemplify a modern ground-based instrument, because Car was observed with STIS and UVES on 2003 February 12 and 14 respectively, only 1.2 days apart. We show the H feature because it plays a leading role in §3.2. H emission in the UVES data has equivalent width 26 Å compared to 33 Å in the STIS spectrum (measured the same way in both data sets, with no correction for narrow lines). Old HST/FOS results and various ground-based data suggest that this difference is real, not merely an instrumental peculiarity of either STIS or UVES (Davidson et al., 1995).
Why does the difference occur? Wavelength-dependent Balmer absorption within the reflecting dust-gas mixture seems implausible, because each stellar-wind emission line is much broader than the velocity dispersion in the relevant material. A more appealing explanation is that the spectrum “seen by” the dust intrinsically differs from what we see directly – in other words, the stellar wind spectrum depends on the direction from which it is viewed. Smith et al. (2003) explored this idea via observations farther out in the Homunculus Nebula, and concluded that Car’s wind is strongly latitude-dependent. Note that the dusty “Weigelt knots,” which contribute strongly to any ground-based spectrum of the central object, are thought to be near the equatorial plane while our direct viewpoint is around 45∘ latitude e.g. Davidson et al (2001).
This explanation is not entirely satisfying. It implies that the equivalent widths of Balmer lines are substantially smaller at equatorial latitudes, whereas Smith et al. (2003) and Hillier & Allen (1992) suggested the same for polar directions. Apparently HST’s high-spatial-resolution direct view of the stellar wind gives larger equivalent widths than we find in the reflected spectrum anywhere in the ejecta. (This statement probably applies to broad emission features in general, not just Balmer lines.) Furthermore, the UVES vs. STIS comparison mentioned above seems to require a surprisingly large latitude variation in the H equivalent width, almost a factor of two. Thus we fear that some other, more subtle process may be altering the reflected spectra. This problem merits further study.
Independent of what causes the discrepancies, for this paper the practical implication is that one must be very careful when comparing ground-based spectra of Car to the HST/STIS data. In particular we cannot directly compare the equivalent widths. Moreover, the offset H observations mentioned in §2.2 are not useful here because they are most likely affected by reflection and emission in their spatial locales. In §4 below we compare recent Gemini/GMOS observations to earlier HST/STIS results, because neither data set spans two spectroscopic cycles; nor is any other existing data set suitable for this problem. In those comparisons, we exercise the necessary caution and caveats.
3 Mid-Cycle Activity
In recent years relatively little attention has been given to Car’s behavior between spectroscopic events. At such times the companion star must be located 15–35 AU from the primary. Mid-cycle changes at UV-to-red wavelengths are therefore significant for at least one of two reasons: (1) Proposed explanations for the 5.54-year cycle generally do not predict irregular or short-term effects more than a few months from an event. If they do occur and are related to the cycle, then some new factor must be taken into account. (2) If, on the other hand, such effects are not related to the cycle, then they may represent phenomena in the primary wind. Observations in 1999–2002 and 2005–2007 therefore merit attention. Here we are concentrating on 2006–2007, supplemented by a few data from 2000–2002 for comparison purposes.
To avoid misunderstandings, note that continuous systematic changes occur in mid-cycle, not directly related to the primary star. Mehner et al. (2010) have shown that some quasi-nebular spectral lines emitted close to our line of sight to the star gradually brighten to a maximum near mid-cycle and then fade. Damineli et al. (2008) earlier found a similar result for one line of this type in an unresolved set of emission regions. The spectral features in question ([Ne III], [Ar III], [Fe III], etc.) probably indicate photoionization by the hot secondary star, and their behavior in the Mehner et al. analysis may represent the cyclic variation of column density between us and the orbiting secondary star. The most popular class of orbit-and-wind models can probably be adjusted to match this effect. Fluctuations described below, however, differ in several respects. They directly concern the spectrum of the primary stellar wind rather than nearby ejecta; they don’t have a smooth obvious correlation with phase in the 5.5-year cycle; and each of them occurred in only one of two observed cycles.
3.1 Photometry in 2006–2007
The HST images confirm that the central star became fainter during 2006–2007 (Fig. 1), but not as much as the ground-based photometry had led us to expect. From 1997 to 2006 the star’s apparent magnitude had brightened three times faster than the surrounding Homunculus, but its relative fading in 2006 was only about the same as for the Homunculus. Whatever the explanation is, this detail indicates that the change in 2006–2007 was not a simple reversal of the 1998–2006 trend. Moreover, the decline stopped and the upward brightening trend resumed after the 2009 spectroscopic event, leaving more or less intact our earlier speculations about secular changes (Martin et al., 2006b; Davidson et al., 2005).
The F330W filter showed a much steeper decline than F250W. This is interesting because the former samples Balmer continuum emission plus other continuum, whereas F250W includes many strong Fe II absorption features. During a spectroscopic event such as 1998.0 or 2003.5, these absorption lines strengthen so much that the star becomes faint in the 230–290 nm wavelength range (Cassatella, Giangrande, & Viotti, 1979; Altamore et al., 1986; Viotti et al., 1989; Davidson et al., 1999b). This is why Fig. 1 shows a substantial temporary decrease in F250W during the 2003.5 event, with scarcely any corresponding effect in F330W. Evidently the 2006-2007 fading was quite different. The same figure suggests two possibilities: (1) The increased F250W/F330W flux ratio in 2007 does not favor an explanation based on increased extinction by circumstellar dust. (2) Perhaps the Balmer continuum emission intrinsically weakened in 2006.
The ground-based B, V, R, and I magnitudes all faded by about in 2006–2007 (DiScala & Jones, 2008). While Car’s B and R values are strongly influenced by the very bright H and H emission lines, V almost entirely measures continuum brightness. Unfortunately the central star could not be measured with HST/WFPC2 at these wavelengths, because every WFPC2 filter redward of 400 nm either saturates the central pixels in the shortest allowed exposure time, or else is affected by some particular emission line.
3.2 Spectroscopy: 2007 vs. 2000–2002
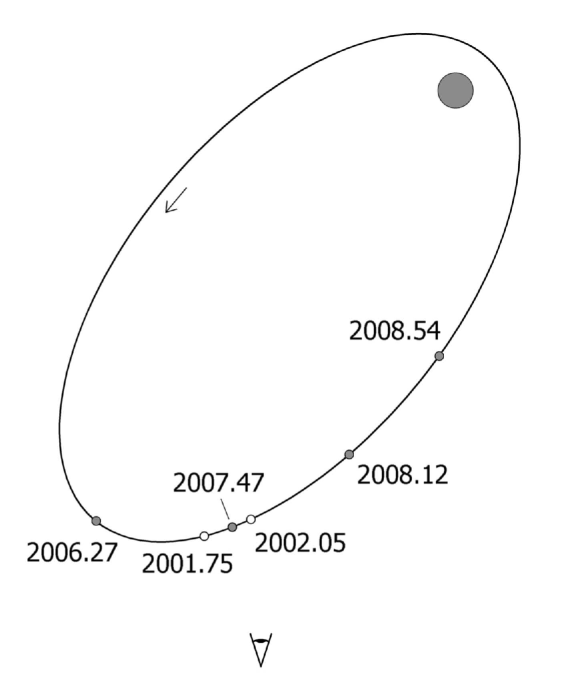
Motivated by the visual decline, its duration, and the peculiar UV photometry from HST/WFPC2, we obtained the Gemini/GMOS data described in §2.2 to learn whether the spectrum had changed during the brightness decrease. Unfortunately no truly suitable earlier ground-based spectra are available for comparison – particularly none from 2005 or 2006. Instead, therefore, we used STIS observations made in October 2001 and January 2002, at approximately the same phase of Car’s 5.54-year spectroscopic cycle as the GMOS data. There is no a priori reason to think that the 2006 photometric change was related to the cycle, but on the other hand it would be imprudent to use observations at much different phases as comparisons. If, as usually assumed, the cycle is modulated by a hot companion star in an eccentric orbit, then Fig. 4 shows the approximate orbital location of the secondary star when our spectra were obtained.555 Most of the orbital parameters are extremely uncertain, but Fig. 4 is qualitatively valid for nearly all models that have been proposed. See Humphreys & Stanek (2005); Ishibashi (2001); Okazaki et al. (2008) and refs. therein. In this part of the orbit the two stars are more than 20 AU apart and their motion is slow.
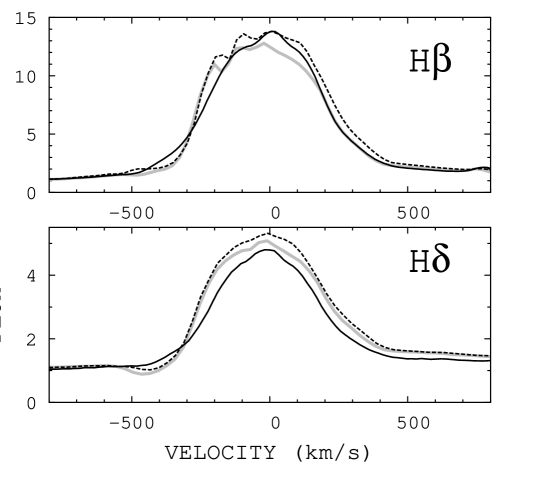
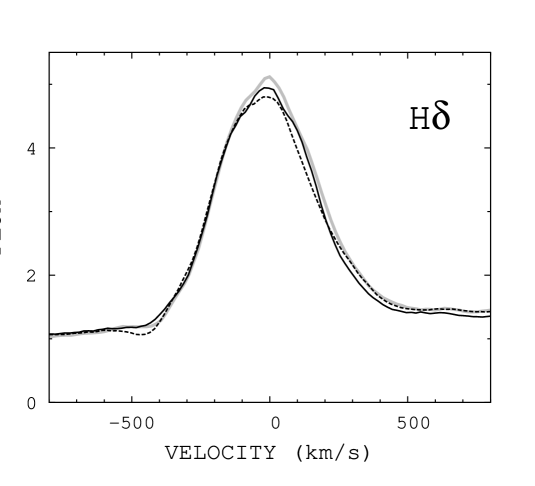
The most conspicuous spectral features in 2007 (Fig. 2) closely resembled the 2001–2002 data. Consider for instance the brightest Balmer lines. Since H is overexposed in the GMOS data and H is confused with other features in this object, in Fig. 5 we show H and H. The measured equivalent widths for H turn out to be like those mentioned in §2.3: 26 Å in the 2007 GMOS spectrum and 33 Å in the 2001–2002 STIS data. Unlike the earlier examples, however, these values have been corrected for weak superimposed narrow lines. The internal uncertainties – chiefly systematic rather than statistical – are probably less than 2 Å.666 Since the continuum of Car is hard to define and weaker additional emission lines contribute to the fluxes, these results depend on the measurement protocol. We measured “continuum” fluxes near 4080 and 4160 Å and we integrated the net H flux from 4082 to 4116 Å (vac). The correction for unrelated emission on the long-wavelength wing is small, about Å in the GMOS data and less for STIS. In the last STIS data in early 2004 the equivalent width for H was only about 29 Å, but lingering effects of the 2003.5 spectroscopic event may have reduced it below “normal” (Davidson et al., 2005). Regarding earlier epochs, the first HST spectra gave an E.W. of 35 Å for H in 1991 (Davidson et al., 1995), or probably about 33 Å if we could apply the corrections mentioned above. If we make allowances for the effect described in §2.3, evidently H was essentially as strong in 2007 (relative to the continuum) as it had been 5.5 years earlier 777Following the same protocol, the equivalent widths for H in the February and July 2008 GMOS spectra are 25 Å each and 26 Å in the April 2006 UVES spectrum.. The H equivalent width was about 163, 175, and 156 Å, respectively, in the 2001 and 2002 STIS data and the 2007 GMOS data; this line may be less accurate than H because its very large line/continuum flux ratio is disadvantageous for the measurements.
But the H profile does show one potentially significant difference: Weak P-Cygni absorption was present near km s-1 in 2001–2002 and in the April 2006 UVES spectrum, but not in 2007. This is not merely a result of different spectral resolutions, because the STIS data in Fig. 5 have been smoothed to match the GMOS resolution. The difference in spatial resolution is probably not responsible either, since the STIS vs. UVES comparison in Fig. 3 shows at most a very weak P-Cygni feature in the ground-based data rather than STIS. (For reasons why that might occur, see Smith et al. (2003) along with §2.3 above.) The GMOS spectrum and H profile from February 2008 is essentially identical to the 2007 spectrum, while its July 2008 spectrum shows the reappearance of weak P Cygni absorption in H prior to the onset of the 2009 event (Figure 6). Although the spectroscopic analysis by Hillier et al. (2001) pertained to the HST/STIS spectrum only one year after the 1998.0 event, they showed that the hydrogen emission originates predominantly in the outer wind of the primary star. Altogether, then, the P-Cygni difference is a real effect, meaning that the column density of excited hydrogen atoms along our line of sight was less after the photometric decline.
A parallel, but more dramatic, difference occurred in some of the helium features. Helium lines whose lower levels are 1s2s 1S, 1s2s 3S, or 1s2p 3Po show prominent P-Cygni absorption in Car’s mid-cycle spectrum; good examples are the triplet features at 4026,4472,4713. Qualitatively, one expects such absorption to occur in a dense photoionized He+ zone where recombination strongly populates the metastable 1s2s levels (Osterbrock & Ferland, 2006). Such a zone is thought to exist in those parts of Car’s primary wind that are closest to the hot secondary star before encountering the wind-wind shocks; see Section 6 of Humphreys et al. (2008) and refs. therein. If Fig. 4 is more or less valid, that zone was situated between us and the primary wind in 2001-2002 and 2007; so P-Cygni absorption is unsurprising. For our purposes here, the interesting point is that the helium P-Cygni velocities differed between those two cycles.
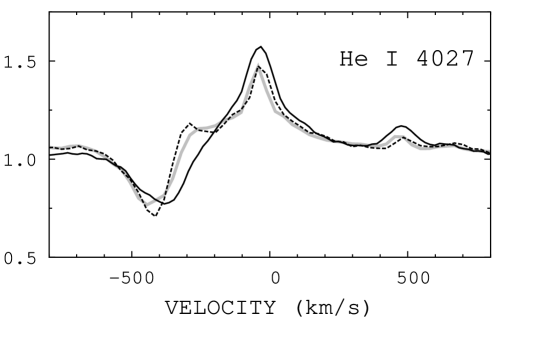
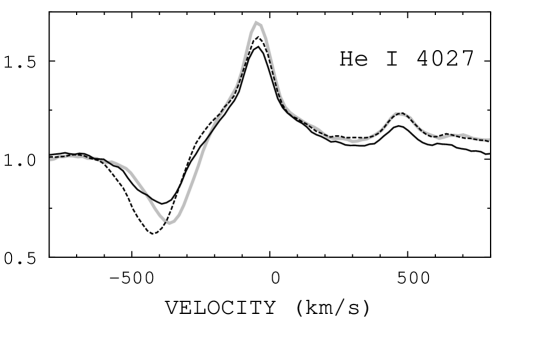
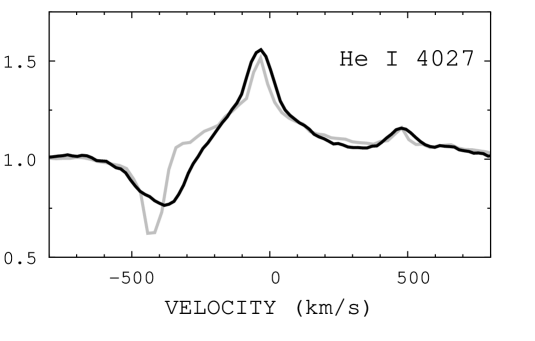
Fig. 7a shows He I 4027. In 2001–2002 its P-Cygni feature was centered at km s-1 like that of H, but in 2007 the absorption had broadened and shifted by about 100 km s-1 to smaller (i.e., less negative) average velocities. This most likely indicates a quantitative change in the primary wind structure. Similar effects occurred in the other helium lines. The P Cygni absorption is also stronger in this line than the corresponding emission. We also note that the He I profile has continued to shift to even lower velocities in the February 2008 GMOS spectrum, but it has shifted bluewards, back to km s-1, in the July 2008 spectrum (Fig 7b). Interestingly, the He I 4027 P Cygni profile in the April 2006 UVES high resolution spectrum appears to have two absorption components centered at velocities of and km s-1 (Fig 7c). It is uncertain however, if the UVES slit is centered on the star or intercepting the same scattered and reflected light from the surrounding ejecta as the GMOS spectra. We plan to model the behavior of the He I lines during Car’s spectroscopic cycle, but this is beyond the scope of this paper.
By now it is clear that Car is not a simple 5.54-year clock-like mechanism. HST/STIS data show a partially different set of changes in the previous mid-cycle interval, 2000–2001 (Martin et al., 2006c). For example, P Cygni absorption in H, usually absent in a mid-cycle spectrum of the star (Smith et al., 2003), showed a marked increase in absorption between March 2000, when there was no detectable P Cygni absorption, and October 2000. Its appearance was brief since it was gone by January 2001. Unfortunately the October 2000 STIS data only covered H so we could not compare the profiles of any of the other Balmer features or He I triplet lines. At the same time, there was a significant increase in the strength of the narrow -140 km s-1 absorption feature in H. The lower spectroscopic resolution of GMOS makes it difficult to determine if the narrow km s-1 feature was present in 2007.
The variable emission feature near 6307 Å reaches its maximum strength mid-cycle, in 2001–2002 and again in 2005 (Martin et al., 2006c). In the VLT/UVES spectra from 2005 it had an equivalent width more than twice that previously observed. It is also present in the April 2006 UVES spectrum and June 2007 GMOS spectrum at 0.2 – 0.3Å equivalent width888 As outlined in (Martin et al., 2006c) this line blends with an adjacent emission feature so it is difficult to accurately measure its strength without a more in depth analysis including spectra taken during a spectroscopic event., equal to its typical strength reported 1999–2002 between spectroscopic events. It is slightly stronger in the April 2006 spectrum relative to the June 2007 spectrum. We note that an increase in the UV flux from the central star occurs in 2001–2002 and 2005–2006 and corresponds with the maximum strength of the 6307Å line.
There was at least one episode of mid-cycle activity in each of the last two spectroscopic cycles. Each episode was different and each occurred at a different phase relative to the spectroscopic events. In the next section we summarize the mid-cycle variability and discuss probable variations in the primary star’s wind that would account for these changes.
4 Discussion
The mid-cycle variability in 2006-2007 described in §3 occurred when the secondary star was at its greatest distance from the primary and most likely reveals basic fluctuations of Car’s primary stellar wind, independent of the companion star and the 5.5-year cycle. This is the simplest view for reasons outlined below, and it makes sense in relation to several known or probable facts. For the first time in 160 years, the central star now strongly and directly affects ground-based photometry. The Homunculus nebula dominated the total apparent brightness throughout the 20th century, see refs. in Martin et al. (2006b); but since 1998 the star has been brightening rapidly and now accounts for half or more of the integrated light. This development may explain why ground-based magnitudes (i.e., Homunculus plus star) have recently been fluctuating with greater amplitude than in the 1953–1995 record. See for example, the recent light curve at http://etacar.fcaglp.unlp.edu.ar . Apparently our direct view of the star shows stronger variability than does the average of many viewpoints reflected in the Homunculus, though other factors should not be ignored.
Since Car’s spectroscopic events have attracted attention in recent years, there is a natural tendency to ascribe observed variability to the 5.5-year cycle, the wind-wind interaction, and the influence of the companion star. But in this case there are good arguments against that response. According to nearly all proposed models for the orbit, in 2006–2007 the wind-wind interaction should have been minimal because the companion star was then located far from the primary. During a 3-year interval around apastron, the separation is more than 20 AU (Fig. 4). This implies the following points for conventional models:
-
1.
Tidal effects are weaker than those at periastron by a factor of order 500.
-
2.
If the primary mass loss rate and line-of-sight wind speed are roughly yr-1 and wind speeds along the line of sight typically 500–600 km s-1, then the optical depth for Thomson scattering at AU is small, of the order of 0.1.
-
3.
Optical depths for continuum absorption are expected to be even smaller. A detailed model is beyond the scope of this paper, but this assertion is based on two generalities: Standard processes give at the likely densities and temperatures, and one can also judge the matter from the sizes of photospheres that produce suitable continua. The visual and near-UV photosphere in the primary wind cannot be very much larger than the circle for the primary in Fig. 4, AU; otherwise its emergent continuum would be too cool. Therefore the optical depth for continuum absorption must be quite small at AU. In conventional models the broad-emission-line spectrum originates mostly within AU (Hillier et al., 2001; Davidson et al., 1995), where the secondary star and wind-wind interaction can have at most only a minor indirect influence.
-
4.
The radiation density is too high for appreciable circumstellar dust in this region. Likely grain formation distances are 150–300 AU (Davidson & Humphreys, 1997). Kashi & Soker (2008b) have suggested that dust can form close to the star, but also note that more than 170 days from periastron dust can form only at large distances. In any case as explained earlier dust, formation cannot explain the photometric decline.
-
5.
Along relevant photon paths (see point 6 below), optical depths through the fast, hot, low-density secondary wind are even smaller than those in the primary wind.
-
6.
The radiation density is too high for appreciable circumstellar dust in this region. Likely grain formation distances are 150–300 AU (Davidson & Humphreys, 1997).
-
7.
When viewing Fig. 4, it is important to bear in mind the 45° inclination of the orbit plane. At 2008.54, for instance, our line of sight to the primary star did not pass close to the secondary star even though the figure might give that impression. Between 2005.5 and 2008.0 our projected view of the system would have changed slowly and continuously – at least in conventional models. The same statement applies to expected line-of-sight column densities.
-
8.
At visual and near-UV wavelengths, the shocked region between the two winds should be practically transparent for absorption and line formation. Its high temperatures, K, greatly weaken free-free and other absorption opacities at these wavelengths. Figures depicting shock simulations such as Pittard & Corcoran (2002), Okazaki et al. (2008), and Parkin et al. (2009) do not depict the visual appearance; indeed the shocked regions are expected to emit less than 0.01% of Car’s total red-to-near-UV light.
-
9.
Flow simulations show dramatic spiral patterns in the shocked structure around periastron (Okazaki et al., 2008; Parkin et al., 2009; Gull et al., 2009). During most of the orbit, however, the secondary star moves at speeds less than 50 km s-1, much slower than either wind; so the flow structure then approximates an axial symmetry around the the star–star axis, with only a modest tilt angle and negligible spirality.
- 10.
-
11.
The hot secondary star is thought to ionize the pre-shock zones in the primary wind (Davidson, 1997; Humphreys et al., 2008; Mehner et al., 2010). This probably affects the He I P Cyg features described in §3, but it doesn’t explain why the column densities and speeds should differ between two cycles. At most visual and near-UV wavelengths, continuum emission from this photoionized zone should be about two orders of magnitude weaker than that of the primary wind. In the Balmer continuum it might account for almost 10% of the total, but this contribution should be quite steady, and insensitive to local gas densities etc.
In summary, the above points plus the persistence of the spectroscopic changes supports variations in the primary’s wind as opposed to a wind-wind interaction interpretation of the mid-cycle irregularities. We cannot absolutely rule out an explanation of that type, but the obvious alternative is far simpler – i.e., that the observations indicate fluctuations in the primary wind. Similar arguments apply to unconventional models wherein the secondary star plays the leading role, e.g. see Soker (2007) and Kashi and Soker (2009a).
The decline in apparent brightness in 2006–2007 was temporary. The flux at all wavelengths subsequently leveled off and HST/WFPC2 photometry after the 2009 event (to be discussed in a forthcoming paper on the 2009 event) shows that the central star resumed its decades long increase in brightness. Furthermore the multi-wavelength visual photometry, and the near-UV flux ratio (Fig. 1) show that increased extinction by dust cannot explain the decline. Allowable explanations for the observed decrease in brightness are thus limited. One feasible possibility is a decrease in the Balmer continuum emission which could be due a change in the stellar wind, assuming a simple dependence of the continuum on the wind density.
The decrease in the H P Cygni absorption between 2001 and 2007 suggests a decrease in density of the primary star’s wind between the two cycles at about the same phase in the orbit. If the density of an opaque wind decreases, then its photosphere tends to move inward. At constant luminosity (generally assumed for Car), this raises the characteristic temperature Tc of the emergent radiation. Since Tc is well above 10000 K, in this case, the brightness therefore tends to decrease at wavelengths greater than 300nm as the radiation shifts further in the UV. This is consistent with the observed photometric decrease in 2006–2007. Crude estimates suggest that a density decrease on the order of 20% would suffice. The change in the He I profiles also show a corresponding decrease in the wind speed. The primary’s wind thus became both slower and less dense mid-cycle. The Balmer and He I profiles show little change between the GMOS mid 2007 spectrum and the spectrum from early 2008. The primary’s wind thus stayed in this slower, less dense state up until the time of the spectrum from mid 2008, just prior to the onset of the 2009 event.
A possible explanation for these mid-cycle changes in the stellar wind may be related to Car’s aspherical wind, confirmed with near-infrared interferometry (Weigelt et al, 2007). Our line of sight to Car is at an angle midway between its fast, dense polar outflow and its slower, lower density wind in the equatorial region (Smith et al., 2003). A small shift in Car’s latitude-dependent wind could thus account for the observed spectroscopic changes with our line of sight intercepting more of the lower latitude wind from mid 2006 to mid 2008. The He I double P Cygni absorption profile in the 2006 UVES spectrum is intriguing in this connection, but with doubts about the slit position, its interpretation is uncertain.
Kashi & Soker (2009b) have suggested that small changes in the primary’s wind can explain the short term variations observed in the X-ray light curve (Corcoran, 2005) at apastron and propose that larger variations may have been responsible for the much shorter X-ray minimum during the recent 2009 event (Pian et al., 2009). However we note that there were no large fluctuations in the X-ray flux during the time of the photometric decline and our observed spectral changes from late 2006 to at least early 2008, although the observed 20% change in the wind velocity may result in only a 7% decrease in the X-ray flux (Kashi & Soker, 2009b).
We also noted mid-cycle changes in 2000-2002 although they were somewhat different and did not occur at the same phase in the orbit. These small mid-cycle fluctuations may be part of a longer term secular trend perhaps related to the star’s rapid brightening in the past decade as it recovers from the giant eruption. Most recent work on Car has focused on its spectroscopic events, but mid-cycle observations merit more attention. Mid-cycle variability can provide important information on the primary star’s intrinsic instability that the spectroscopic events do not.
We thank Jean-Rene Roy, Deputy Director and Head of Science Operations of the Gemini Observatory, for granting us director’s discretionary time on short notice to obtain spectra of Car in 2007. We also thank the staff and observers of the Gemini South observatory in La Serena for their help and support in putting together a successful observing program. We are also acknowledge use of the AAVSO International Database.
References
- Altamore et al. (1986) Altamore, A., Baratta, G. B., Cassatella, A., Rossi, L., & Viotti, R. 1986, New Insights in Astrophysics: Eight Years of UV Astronomy with IUE, 303
- Biretta et al. (1996) Biretta, J. A., et al. 1996, WFPC2 Instrument Handbook, Version 4.0 (Baltimore: STScI)
- Cassatella, Giangrande, & Viotti (1979) Cassatella, A., Giangrande, A., & Viotti, R. 1979, A&A, 71, L9
- Corcoran (2005) Corcoran, M. F., 2005, AJ, 129, 2018
- Damineli et al. (1997) Damineli, A., Conti, P.S., & Lopes, D.F. 1997, New Astronomy, 2, 107
- Damineli et al. (2008) Damineli, A., Hillier, D. J., Corcoran, M. F., et al. 2008, MNRAS, 386, 2330
- Davidson et al. (1995) Davidson, K., Ebbets, D., Weigelt, G., Humphreys, R.M., Hajian, A.R., Walborn, N.R., & Rosa, M. 1995, AJ, 109, 1784
- Davidson (1997) Davidson, K. 1997, New Astronomy, 2, 387
- Davidson & Humphreys (1997) Davidson, K., & Humphreys, R.M. 1997, ARA&A, 35, 1
- Davidson et al. (1999a) Davidson, K., et al. 1999a, AJ, 118, 1777
- Davidson et al. (1999b) Davidson, K., Ishibashi, K., Gull, T.R., & Humphreys, R.M. 1999b, Eta Carinae at the Millenium, ASP Conf. Ser. 179 (ed. J.A. Morse, R.M. Humphreys, & A. Damineli), 227
- Davidston et al. (2001) Davidson, K., Smith, N., Gull, T. R., Ishibashi, K., & Hillier, D. J. 2001, AJ, 121, 1569
- Davidson (2004) Davidson, K. 2004, STScI Newsletter, Spring 2004, 1
- Davidson et al. (2005) Davidson, K., et al. 2005, AJ, 129, 900
- DiScala & Jones (2008) DiScala, G., & Jones, R. W. 2008, Observations from the AAVSO International database, private communication.
- Feinstein & Marraco (1974) Feinstein, A., & Marraco, H. G. 1974, A&A, 30, 271
- Feinstein (1967) Feinstein, A. 1967, The Observatory, 87, 287
- Fernandez-Lajus et al. (2003) Fernandez-Lajus, E., Gamen, R., Schwartz, M., Salerno, N., Llinares, C., Farina, C., Amorín, R., & Niemela, V. 2003, Information Bulletin on Variable Stars, 5477, 1
- Fernandez-Lajus et al. (2009) Fernández-Lajús, E., Fariña, C., Torres, A. F., Schwartz, M. A., Salerno, N., Calderón, J. P., von Essen, C., Calcaferro, L. M., Giudici, F., Llinares, C., & Niemela, V., 2009, A&A, 493, 1093
- Gull et al. (2009) Gull, T. R., et al. 2009, MNRAS, 396, 1308
- Hillier & Allen (1992) Hillier, D.J., & Allen, D.A. 1992, A&A, 262, 153
- Hillier et al. (2001) Hillier, D.J., Davidson, K., Ishibashi, K., & Gull, T. R. 2001, ApJ, 553, 837
- Hillier et al. (2006) Hillier, D.J., Gull, T., Nielsen, K., et al. 2006, ApJ,, 642, 1098
- Hofmann & Weigelt (1988) Hofmann, K.-H., & Weigelt, G. 1988, A&A, 203, L21
- Holtzman et al. (1995) Holtzman, J. A., et al. 1995, PASP, 107, 156
- Humphreys & Stanek (2005) Humphreys, R. M., & Stanek, K. (eds.) 2005, ASP Conf. Ser. 332, The Fate of the Most Massive Stars
- Humphreys et al. (2008) Humphreys, R. M., Davidson, K., & Koppelman, M. 2008, AJ, 135, 1249
- Ishibashi (2001) Ishibashi, K., Eta Carinae and Other Mysterious Stars, ASP Conf. Ser. 242 (ed. T.R. Gull, S. Johansson, & K. Davidson), 53
- Kashi & Soker (2008a) Kashi, A. & Soker, N. 2008a MNRAS, 390, 1751
- Kashi & Soker (2008b) Kashi, A. & Soker, N. 2008b New Astronomy, 13, 569
- Kashi & Soker (2009a) Kashi, A. & Soker, N. 2009a New Astronomy, 14, 11
- Kashi & Soker (2009b) Kashi, A. & Soker, N. 2009b ApJ, 701, L59
- Koornneef et al. (1986) Koornneef, J., Bohlin, R., Buser, R., Horne, K., & Turhshek, D. 1986, Highlights Astron., 7, 833
- Martin (2005) Martin, J. C. 2005, The Fate of the Most Massive Stars, ASP Conf. Ser. 332, 111
- Martin & Koppelman (2004) Martin, J. C., & Koppelman, M. D. 2004, AJ, 127, 2352
- Martin et al. (2006a) Martin, J. C., Davidson, K., Humphreys, R. M., Hillier, D. J., & Ishibashi, K. 2006a, ApJ, 640, 474
- Martin et al. (2006b) Martin, J. C., Davidson, K., & Koppelman, M. D. 2006b, AJ, 132, 2717
- Martin et al. (2006c) Martin, J. C., Davidson, K., Hamann, F., Stahl, O., & Weis, K. 2006c, PASP, 118, 697
- Mattei & Foster (1998) Mattei, A., & Foster, G. 1998, International Amateur-Professional Photoelectric Photometry Communications, 72, 53
- Mehner et al. (2010) Mehner, A., Davidson, K., Ferland, G. J., & Humphreys, R. M. 2010, ApJ, in press
- Nielsen et al (2009) Nielsen, K. E., Kober, G. Vieira, Weis, K., Gull, T. R., Stahl, O., & Bomans, D. J. 2009 ApJS, 181, 473
- O’Connell (1956) O’Connell, D. J. K. 1956, Vistas in Astronomy, 2, 1165
- Okazaki et al. (2008) Okazaki, A.T., Owocki, S.P., Russell, C.M.P., & Corcoran, M.F. 2008, MNRAS, 388, L39
- Osterbrock & Ferland (2006) Osterbrock, D.E., & Ferland, G.J. 2006, Astrophysics of Gaseous Nebulae and Active Galactic Nebulae
- Parkin et al. (2009) Parkin, E. R., Pittard, J. M., Corcoran, M. F., Hamaguchi, K. & Stevens, I. R. 2009, MNRAS, 394, 1758
- Pian et al. (2009) Pian, E., Campana, S., Chincarini, G., Corcoran, M. F., Hamaguchi, K., Gull, T., Mazzali, P. A., Thoene, C. C., Morris, D., & Gehrels, N. 2009, arXiv:0908.2819
- Pittard & Corcoran (2002) Pittard, J.M., & Corcoran, M.F. 2002, A&A, 383, 636
- Sirianni et al. (2005) Sirianni, M., et al. 2005, PASP, 117, 1049
- Smith et al. (2003) Smith, N., Davidson, K., Gull, T. R., Ishibashi, K., & Hillier, D. J. 2003, ApJ, 586, 432
- Smith et al. (2004) Smith, N. et al, 2004, ApJ, 605, 405
- Soker (2007) Soker, N. 2007, ApJ, 661, 490
- Sterken et al. (1999) Sterken, C., Freyhammer, L., Arentoft, T., & van Genderen, A. M. 1999, A&A, 346, L33
- van Genderen et al. (1999) van Genderen, A. M., Sterken, C., de Groot, M., & Burki, G. 1999, A&A, 343, 847
- van Genderen & Sterken (2004) van Genderen, A. M. & Sterken, C, 2004, A&A, 423, L1
- Viotti et al. (1989) Viotti, R., Rossi, L., Cassatella, A., Altamore, A., & Baratta, G. B. 1989, ApJS, 71, 983
- Weigelt & Ebersberger (1986) Weigelt, G., & Ebersberger, J. 1986, A&A, 163, L5
- Weigelt et al (2007) Weigelt, G., Kraus, T. Driebe, T. et al 2007, A&A, 464, 87
- Whitelock et al. (2004) Whitelock, P. A., Feast, M. W., Marang, F., & Breedt, E. 2004, MNRAS, 352, 447
- Zanella et al. (1984) Zanella, R., Wolf, B., & Stahl, O. 1984, A&A, 137, 79
| HST camera | F250W, F255W | F330W, F336W |
|---|---|---|
| ACS (HRC)bb Martin et al. (2006b) | 0.594 0.013 | 0.625 0.010 |
| WFPC2 (PC)cc The r.m.s. errors quoted here are relevant to comparisons between ACS and WFPC2 data, but maybe pessimistic regarding brightness variations with a given filter. | 0.567 0.030 | 0.669 0.048 |
.
| Exp Time | Flux | |||||
|---|---|---|---|---|---|---|
| Dataset | MJD | Year | (sec) | DensityccSTMAG flux units are 10-11 erg/cm2/s/Å. | MagnitudeaaMagnitude on the STMAG system. | AveragebbThe average and sigma of individual measurements in a set of exposures taken within a day of each other. |
| ACS HRC/F250W Filter | ||||||
| j9p603onq | 54120.426 | 2007.055 | 1.2 | 1.189 | 6.212 | 6.2260.010 |
| j9p603opq | 54120.426 | 2007.055 | 1.2 | 1.159 | 6.239 | |
| j9p603orq | 54120.430 | 2007.055 | 1.2 | 1.174 | 6.225 | |
| j9p603otq | 54120.430 | 2007.055 | 1.2 | 1.172 | 6.228 | |
| WFPC2 HRC/F255W Filter | ||||||
| ua140109m | 54335.188 | 2007.643 | 0.6 | 1.094 | 6.302 | 6.302 |
| ua140209m | 54510.797 | 2008.124 | 0.6 | 1.064 | 6.333 | 6.333 |
| ACS HRC/F330W Filter | ||||||
| j9p603obq | 54120.410 | 2007.055 | 0.4 | 1.336 | 6.085 | 6.0870.003 |
| j9p603odq | 54120.410 | 2007.055 | 0.4 | 1.338 | 6.084 | |
| j9p603ofq | 54120.414 | 2007.055 | 0.4 | 1.329 | 6.091 | |
| j9p603ohq | 54120.414 | 2007.055 | 0.4 | 1.334 | 6.087 | |
| WFPC2 HRC/F336W Filter | ||||||
| ua140101m | 54335.121 | 2007.643 | 0.1 | 1.273 | 6.138 | 6.1380.020 |
| ua140102m | 54335.125 | 2007.643 | 0.1 | 1.312 | 6.105 | |
| ua140103m | 54335.121 | 2007.643 | 0.1 | 1.253 | 6.155 | |
| ua140104m | 54335.125 | 2007.643 | 0.1 | 1.254 | 6.154 | |
| ua140201m | 54510.770 | 2008.124 | 0.1 | 1.154 | 6.245 | 6.2620.019 |
| ua140202m | 54510.773 | 2008.124 | 0.1 | 1.135 | 6.263 | |
| ua140203m | 54510.773 | 2008.124 | 0.1 | 1.151 | 6.247 | |
| ua140204m | 54510.777 | 2008.124 | 0.1 | 1.105 | 6.292 | |
| Root | Exp Length | ||
|---|---|---|---|
| Name | Year | Grating | (sec) |
| Gemini South GMOS | |||
| S20070616S0045 | 2007.45 | B1200 | 5.5 |
| S20070616S0046 | 2007.45 | B1200 | 5.5 |
| S20070618S0011 | 2007.45 | B1200 | 5.5 |
| S20070618S0012 | 2007.45 | B1200 | 5.5 |
| S20070630S0026 | 2007.49 | R831 | 3.5 |
| S20070630S0035 | 2007.49 | R831 | 1.5 |
| S20070630S0040 | 2007.49 | R831 | 4.5 |
| S20080211S0087 | 2008.11 | B1200 | 5.5 |
| S20080211S0088 | 2008.11 | B1200 | 5.5 |
| S20080718S0068 | 2008.54 | B1200 | 5.5 |
| S20080718S0069 | 2008.54 | B1200 | 5.5 |
| HST STIS | |||
| o6ex03010 | 2001.75 | G750M | 6.0 |
| o6ex03020 | 2001.75 | G750M | 0.6 |
| o6ex03060 | 2001.75 | G430M | 36.0 |
| o6ex030e0 | 2001.75 | G430M | 36.0 |
| o6ex030f0 | 2001.75 | G430M | 3.0 |
| o6ex02010 | 2002.05 | G750M | 6.0 |
| o6ex02020 | 2002.05 | G750M | 0.4 |
| o6ex02030 | 2002.05 | G430M | 18.0 |
| o6ex020u0 | 2002.05 | G430M | 8.0 |
| o6ex020v0 | 2002.05 | G430M | 36.0 |
| VLT UVES | |||
| UVES.2006-04-09 | 2006.27 | CD#2 | 60.0 |
| T02:41:56.828 | |||
| Slit Width | Slit AngleaaThe slit angle is measured from north through east. All slits are targeted on the central star. | Spectral | |
|---|---|---|---|
| (arcseconds) | (deg) | R = | |
| Gemini South | 0.50 | +160 | 3744bbR for spectra blueward of 500 nm. |
| GMOS | 4396ccR for spectra redward of 500 nm. | ||
| HST STIS | 0.10 | +165ddSlit orientation was +165 degrees in October 2001 and -82 degrees in January 2002. | 15350bbR for spectra blueward of 500 nm. |
| -82ddSlit orientation was +165 degrees in October 2001 and -82 degrees in January 2002. | 13400ccR for spectra redward of 500 nm. | ||
| VLT UVES | 0.40 | +160 | 80000bbR for spectra blueward of 500 nm. |