Dry mergers and the formation of early-type galaxies: constraints from lensing and dynamics
Abstract
Dissipationless (gas-free or “dry”) mergers have been suggested to play a major role in the formation and evolution of early-type galaxies, particularly in growing their mass and size without altering their stellar populations. We perform a new test of the dry merger hypothesis by comparing N-body simulations of realistic systems to empirical constraints provided by recent studies of lens early-type galaxies. We find that major and minor dry mergers: i) preserve the nearly isothermal structure () of early-type galaxies within the observed scatter; ii) do not change more than the observed scatter the ratio between total mass and “virial” mass (where is the half-light radius and the projected velocity dispersion); iii) increase strongly galaxy sizes () and weakly velocity dispersions () with mass, thus moving galaxies away from the local observed - and - relations; iv) introduce substantial scatter in the - and - relations. Our findings imply that —unless there is a high degree of fine tuning of the mix of progenitors and types of interactions— present-day massive early-type galaxies cannot have assembled more than of their mass, and increased their size by more than a factor , via dry merging.
Subject headings:
galaxies: elliptical and lenticular, cD – galaxies: formation – galaxies: kinematics and dynamics – galaxies: structure – gravitational lensing1. Introduction
Although early-type galaxies appear to be relatively simple in terms of their internal structure and stellar populations, their formation and evolution are still poorly understood. In the hierarchical model of structure formation, galaxy mergers play a central role in the formation and evolution of early-type galaxies. Many pieces of evidence are consistent with the merging hypothesis (see e.g., van Dokkum, 2005, and references therein). However, other observational facts appear hard to reconcile with substantial amounts of merging. Among the facts that have been traditionally used to argue against the central role of mergers are the high observed central density of early-type galaxies (Ostriker, 1980; Carlberg, 1986); the small scatter in empirical scaling laws such as the color magnitude relation (Bower, Lucey & Ellis, 1992), the Fundamental Plane (hereafter FP; Dressler et al., 1987; Djorgovsky & Davis, 1987), and the relation between black hole mass and host galaxy mass or central stellar velocity dispersion (Ferrarese & Merritt, 2000; Gebhardt et al., 2000; Marconi & Hunt, 2003; Häring & Rix, 2004); and the correlation between abundance ratios and host galaxy properties (e.g., Pipino & Matteucci, 2008).
Theoretical and observational studies (e.g., Bender, Burstein & Faber, 1992; Ciotti & van Albada, 2001; Robertson et al., 2006; Ciotti, Lanzoni & Volonteri, 2007; Scarlata et al., 2007; Faber et al., 2007) have argued that a combination of dissipative and dissipationless processes is needed to match the observed properties of early-type galaxies. Dissipation is needed for example to create the high density regions and close to isothermal density profiles, while dissipationless (or “dry”) mergers are needed to grow the most massive galaxies while preserving the uniformly old stellar populations and the structural properties of present-day galaxies (e.g. Naab et al., 2007). In particular, both theories and observations have suggested that a large fraction of the immediate progenitors of today’s massive red galaxies could be spheroidal galaxies themselves (e.g., van Dokkum et al., 1999; Khochfar & Burkert, 2003; Naab, Khochfar, & Burkert, 2006; Bell et al., 2006; Faber et al., 2007). Thus, even though mergers may not be the only process at work (e.g., Bundy, Treu & Ellis, 2007), dry mergers might play an important role, especially at relatively recent times, i.e. below redshift , after the bulk of star formation is completed for massive early-type galaxies in the local Universe (e.g., Trager et al., 2000; Treu et al., 2005; Renzini, 2006).
In this paper, we take advantage of a new set of constraints provided by strong gravitational lensing studies to test the viability of the dry-merger scenario via a set of numerical simulations. In practice, we first construct realistic models of early-type galaxies so that they obey known scaling relations between their structural and kinematic properties, and then study how these properties change as a result of dissipationless mergers.
Our approach is similar to that followed by Nipoti, Londrillo & Ciotti (2003a), González-García & van Albada (2003) and Boylan-Kolchin, Ma & Quataert (2006, see also Kazantzidis et al. 2005, Robertson et al. 2006 and Johansson, Naab, & Burkert, 2009a for studies that include dissipation), who tested how the FP, its projections and the - relation are affected by mergers. The bottom line of these studies is that dry merging between progenitor spheroidal galaxies that lie on the FP, Kormendy (1977) and Faber & Jackson (1976) relations produce spheroidal galaxies that are close to the edge-on FP, but deviate from the Kormendy and Faber-Jackson relations, because they have too large effective radius and too low central velocity dispersion.
Taking a step further, we focus here on lensing-derived properties, testing the results of our simulations against: i) isothermality of the total mass density profile; ii) the correlations between lensing mass and size or stellar velocity dispersion; iii) the Mass Plane, i.e. the correlation between surface mass density, effective radius and velocity dispersion discovered by strong lensing studies. As discussed by Bolton et al. (2007, 2008b), the lensing constraints add a qualitatively new piece of information—an accurate aperture mass for each galaxy—that helps circumvent some of the problems inherent to previous studies. The comparison of N-body simulation with traditional scaling relations is not straightforward, because it relies on assumptions on the mass-to-light ratio to convert luminosity, which enters the observed correlations, into mass. Moreover, among the quantities involved in the traditional empirical correlations (e.g., galaxy luminosity, size, and velocity dispersion), only velocity dispersion is affected by the galaxy dark matter (hereafter DM) content and distribution. Information coming from gravitational lensing, and thus constraining the total galaxy mass distribution, effectively solves this problem.
The paper is organized as follows. First, in § 2 we review the lensing constraints on the structure of early-type galaxies. Then, in § 3, we describe the seed-galaxy models, initial orbital configurations, and numerical methods that we use to simulate the dry-merging process. In § 4 and § 5 we present the results of comparisons between our merger simulations and observations in terms of the effect of dry mergers on density profiles, central DM fractions and scaling relations of galaxies throughout the merging hierarchies. In § 6 we discuss our results in the context of the redshift evolution of early-type galaxies. Finally, § 7 presents our conclusions.

2. Lensing constraints on the structure of early-type galaxies
The properties of massive early-type galaxies are strongly constrained by the combination of kinematic and strong gravitational lensing observations. In particular, there is growing evidence that these systems have total mass density profile close to isothermal over a large radial interval (Gavazzi et al., 2007), with an intrinsic scatter in logarithmic slope of less than % (Koopmans et al., 2006; Koopmans et al., 2009).
In addition, Bolton et al. (2007, 2008b), using a sample of strong gravitational lenses, have shown that early-type galaxies lie on a Mass Plane (MP)
| (1) |
where is the projected velocity dispersion within an aperture radius and is the surface mass density within , with , and RMS orthogonal scatter of 1.24 when normalized by the observational errors. The MP is the gravitational lensing analogue of the traditional FP.
The fact that are consistent with and that the scatter is small can be expressed in terms of structural and dynamical homology of the lenses, by defining the dimensionless structure parameter
| (2) |
where is the total projected mass within . For their sample of lens early-type galaxies from the Sloan Lens ACS (SLACS) Survey, Bolton et al. (2008b) find on average
| (3) |
We note that the observed scatter on is 0.08, but here we consider the estimated intrinsic scatter 0.057 (see Bolton et al., 2008b). Importantly, Bolton et al. (2008b) find that has no systematic variation with galaxy mass: this is the sense in which the lens galaxies form a homologous family.
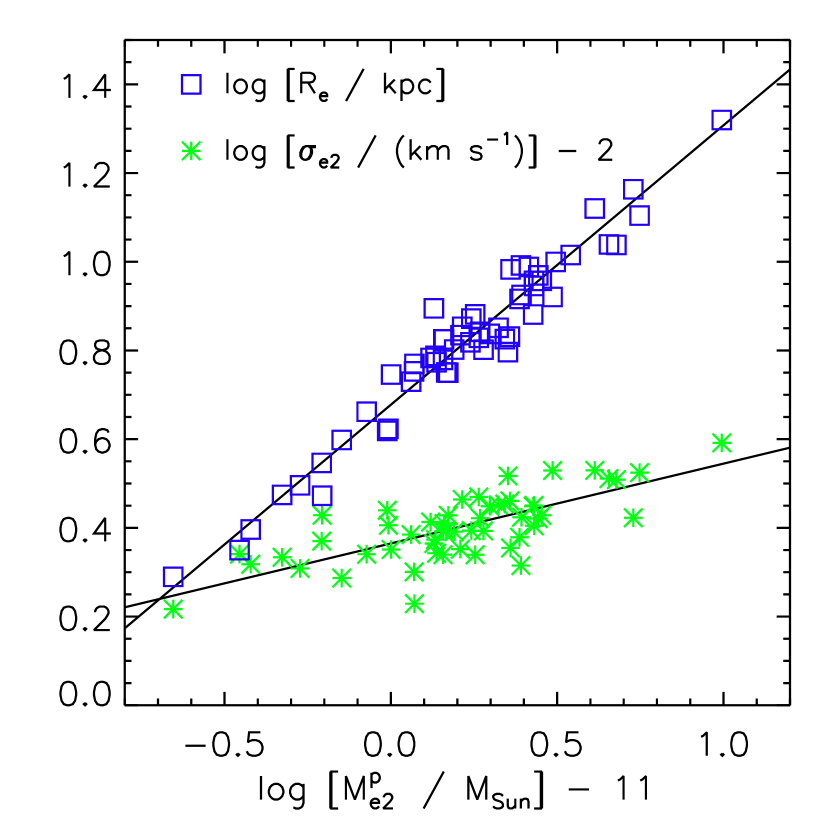
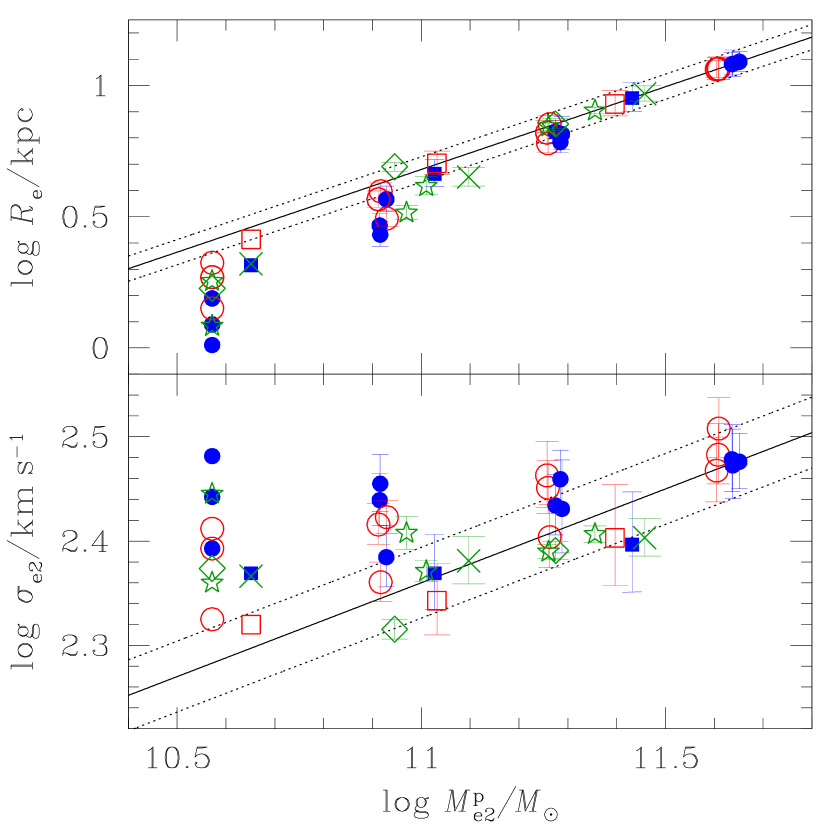
In the present paper we also consider the analogues of the traditional luminosity–size (Kormendy, 1977) and luminosity–velocity-dispersion (Faber & Jackson, 1976) relations, by deriving the projected-mass–size and the projected-mass–velocity-dispersion relation for the SLACS sample of lenses.
To derive total-mass versions of the Kormendy and Faber-Jackson relations, we use the velocity-dispersion, half-light radius, and lensing-mass measurements for the SLACS strong-lens sample as published in Bolton et al. (2008a). We restrict our attention to the 57 lens systems wherein the lens galaxy has early-type morphology and single multiplicity. For the mass–velocity dispersion relation, we further restrict ourselves to the 53 systems for which the Sloan Digital Sky Survey (SDSS) spectroscopy is of sufficient signal-to-noise to permit a velocity-dispersion measurement. Bolton et al. (2008a) provide lensing measurements using both singular isothermal ellipsoid (SIE) and light-traces-mass (LTM) models for the mass density of the foreground lensing galaxies, which can be used to gauge the dependence of results upon the radial mass-density profile used to extract the strong-lensing aperture masses.
Taking the SIE aperture masses as our reference values, and fitting for the relation that minimizes the orthogonal scatter in logarithmic space, we find a mass–size relationship given by
| (4) | |||||
The observed scatter in at fixed mass is 0.051, which is reduced to 0.048 by subtracting in quadrature the error in as estimated by Bolton et al. (2008a) to obtain an estimate of the intrinsic scatter in this quantity. We note that there will be a degree of covariance between the axes of this relation, since the measured is used to evaluate the aperture-mass of the SIE model at to obtain . Fitting similarly for the mass–velocity-dispersion relation, we find
| (5) | |||||
This has an observed scatter in at fixed mass of 0.045, implying an intrinsic scatter of 0.034. Errors in all coefficients are computed from the RMS scatter in fits to 1000 bootstrap-resampling draws of 57 or 53 galaxies apiece. Using LTM lensing aperture masses instead of those from SIE models, the coefficients of both relations change only insignificantly. These relations are shown in Fig. 1.
As discussed in several papers (Bolton et al., 2006; Treu et al., 2006; Bolton et al., 2008a; Treu et al., 2009) the SLACS lenses are found to be indistinguishable from control samples of SDSS galaxies with the same stellar velocity dispersion and size, in terms of luminosity/surface brightness, location on the FP, and distribution of environments. We will thus assume that, within the range of observational errors, results found for the lens sample, including the MP, are generic properties of the overall class of massive early-type galaxies.
3. Dissipationless merging simulations
We ran N-body simulations of dissipationless galaxy merging, exploring both major and minor mergers. In the case of major mergers we simulate two colliding systems, which are equal-mass, identical galaxy models with stellar and DM components, and no gas. In major-merger hierarchies, galaxies grow in mass by subsequent binary equal-mass mergers, up to an increase in stellar mass of a factor of . In the first step of a hierarchy the seed galaxies are spherically symmetric and non-rotating. In the second step of a hierarchy the end-product of the first step is replicated, and two such galaxies encounter one another. At this stage, the systems are no longer spherically symmetric, thus each of them is initially randomly rotated around its center of mass. The setup of the initial conditions of the third step are obtained in the same way, starting from the remnant of the second step.
In the case of minor mergers, we simulate the accretion of several smaller satellites onto a more massive system (the mass ratio between each satellite and the massive galaxy is either or ). For a galaxy to grow significantly on reasonably short timescales through minor mergers, more than one satellite is expected to interact with the galaxy at the same time. For this reason, we considered hierarchies of minor mergers in which each step is represented by a multiple merger, so the initial conditions represent a massive galaxy surrounded by five or ten infalling satellites. Each galaxy collision is followed up to the virialization of the resulting stellar system. A fraction of the particles is unbound at the end of the simulation: we define the merging end-product as the system composed by the bound stellar and DM particles. We note that in the case of minor-merger hierarchies not all the satellites present in the initial conditions must necessarily merge with the central galaxy. In some cases one or two of the satellites are found on an unbound orbit when all the other systems have already merged and the merger remnant relaxed. When this happens, the satellites are considered escaped and the merging is thus characterized by a significant stellar and DM mass loss.
Altogether we simulated 12 merging hierarchies: 6 major-merger hierarchies of 3 steps each, 2 major-merger hierarchies of 2 steps each, and 4 minor-merger hierarchies of 2 steps each.
3.1. Seed galaxy models
The seed galaxy models are spherically symmetric equilibrium two-component systems, with stellar and DM components. The stellar density distribution of the seed galaxies is represented by a model (Dehnen, 1993; Tremaine et al., 1994):
| (6) |
where is the total stellar mass. We assume , thus our models are centrally steeper than Hernquist (1990) models () and shallower than Jaffe (1983) models (). We use and to define time and velocity units and . The DM halo is described by a Navarro, Frenk & White (1996, NFW) model, so the DM density distribution is
| (7) |
where is the scale radius, is a reference mass and we adopt an exponential cut-off to truncate the distribution smoothly at the virial radius , so the total DM mass is finite. We assume Osipkov-Merritt (Osipkov, 1979; Merritt, 1985) anisotropy in the velocity distribution of the stellar component, whose distribution function is then given by
| (8) |
where
| (9) |
The variable is defined as , where the relative (positive) energy is given by , is the modulus of the velocity vector, the relative (positive) total potential is ( and are, respectively, the relative potentials of the stellar and DM components), is the angular momentum modulus per unit mass, and for . The quantity is the so–called anisotropy radius: for the velocity dispersion tensor is mainly radially anisotropic, while for the tensor is nearly isotropic. In the limit , and the velocity dispersion tensor becomes globally isotropic.
The orbital distribution of the DM halo is assumed isotropic, so the distribution function of the DM component is given by equation (8) where and substitutes . The total (stars plus DM) density profile is and is the total mass within . This family of plus NFW models have four free parameters: concentration , the stellar mass fraction , the ratio and the anisotropy radius . We consider different choices of these parameters for the seed galaxies of our hierarchies. In what we refer to as model A (see Table 1), we assume , , , so that the resulting total mass profile is close to isothermal () in the radial range (see thin solid curve in Fig. 2), where is the radius of the sphere containing half of the stellar mass, and , so it lies exactly on the MP (). We also consider models with , , , but different values of : an isotropic model (; model B) and a more radially anisotropic model (; model C). In other hierarchies the seed galaxy is more DM dominated (model D): a plus NFW model with , , and so that also this model has close-to-isothermal total density profile and has .
Our seed galaxy models are primarily constructed to reproduce the total density distribution and structural parameter of massive () local early-type galaxies, as constrained by strong gravitational lensing and kinematics; we did not attempt a full exploration of the space of parameters , and , but we adopted values that are expected to bracket the ranges expected on the basis of theoretical investigations (see Nipoti, Treu & Bolton, 2008, and references therein). Additional observational constraints on the DM content of present-day early-type galaxies come from weak gravitational lensing surveys (Mandelbaum et al., 2006; Gavazzi et al., 2007). According to the weak-lensing results of Mandelbaum et al. (2006) the stellar mass fraction of early-type galaxies are of the order of (if uncertainties on the Initial Mass Function are taken into account), so the values of of our seed galaxy models bracket the observationally estimated range of for systems of this mass. However, estimated from weak-lensing tend to decrease with stellar mass above (Mandelbaum et al., 2006), so the more DM dominated model D () should be considered more realistic than model A to represent more massive systems.
To address the question of whether density profiles are preserved by merging we also ran an equal-mass merger simulation in which each seed galaxy is a one-component system with total density profile
| (10) |
where is a reference density. The density distribution in the equation above is that of a singular isothermal sphere (SIS), smoothly truncated at a radius so that the total mass is finite. This truncated SIS model is assumed isotropic.
3.2. Major-merging simulations
In the case of major-merging hierarchies, in each step we follow the evolution of a binary galaxy encounter, characterized by the properties of the colliding systems and of their mutual orbit, which we parametrize with the standard two-body approximation. For an encounter between two galaxies of total masses and we define the orbital energy per unit mass
| (11) |
and the orbital angular momentum per unit mass , where and are the relative separation and velocity vectors of the centers of mass of the two colliding systems at the initial time of the simulation. We ran simulations of parabolic (), elliptic () and hyperbolic () orbits, and we explored both head-on encounters () and off-center encounters (). In the case of encounters between two equal-mass, identical galaxies it is useful to define the dimensionless orbital energy and angular momentum modulus , where is the virial velocity dispersion and is the angle-averaged half-mass radius of the total density distribution of the isolated systems (Binney & Tremaine, 1987). We consider six different major merging hierarchies, with seed galaxy model A, in which the orbital parameters and are the same in each step of the hierarchy. Only in the last step (run 8A1ho) of the off-center hyperbolic major-merger hierarchy and are smaller than in the previous steps, in order to avoid a too long merging timescale. In addition we explore two parabolic hierarchies having as seed galaxy model D (one with , the other with ). The parameters of the simulations are summarized in Tables 1 and 2.
3.3. Minor-merging simulations
We present four minor-merging hierarchies, each consisting of two steps of (multiple) minor-merging simulations. Let us focus first on the hierarchy represented by the two simulations 2A1m10x and 4A1m10x: in the first step of this hierarchy the initial conditions consist of a central galaxy model A, of stellar mass and scale radius , surrounded by ten identical satellites, also represented by model A, but with stellar mass and scale radius . The satellites are randomly distributed around the central galaxy with relative distance between each satellite and the central galaxy in the range and with velocity directed towards the center of mass of the central galaxy. The relative speed between each satellite and the central galaxy is such that the orbit would be parabolic in the absence of the other satellites. The end-product of run 2A1m10x is used as central galaxy of the initial conditions in the second step of the hierarchy, in which it is surrounded by ten identical satellites of mass and scale radius with distribution analogous to run 2A1m10x, but now with relative distance with respect to the central galaxy in the range . Though each satellite would be on a radial parabolic orbit in the absence of the other satellites, the latter act as perturbers, so the orbits are actually neither strictly radial nor strictly parabolic.
The set-up of the other minor-merging hierarchies are similar to the one described above. The hierarchy (2A1m10y, 4A1m10y) is just another realization of the same set-up: the initial conditions differ just in the relative distribution in phase space of the centers of mass of the satellites. In the hierarchy (2A1m5, 4A1m5) we adopt five satellites per step instead of ten, with stellar mass () and scale radius () in the first (second) step. In the hierarchy (2D1m10, 4D1m10) the initial central galaxy and the ten satellites are represented by model D, with same scale radii and masses as (2A1m10x, 4A1m10x), but relative distance between each satellite and the central galaxy in the range (first step) and (second step), on account of the more extended DM distributions.
3.4. Numerical methods
For the simulations we used the parallel N-body code FVFPS (Fortran Version of a Fast Poisson Solver; Londrillo, Nipoti, Ciotti, 2003; Nipoti, Londrillo & Ciotti, 2003a), based on Dehnen (2002) scheme. We adopt the following values for the code parameters: minimum value of the opening parameter and softening parameter in units of (depending on the number of particles and on the size of the merging systems). The time-step , which is the same for all particles, is allowed to vary adaptively in time as a function of the maximum particle density : in particular, we adopted .
Numerically, the initial distribution of the seed galaxy particles in phase space is realized as described in Nipoti, Londrillo & Ciotti (2002). While the gravitational potential is analytic, is computed by numerical integration, given the spherically symmetric density distribution (7). We verified that the seed galaxy models are in equilibrium by evolving them in isolation for several dynamical times. As a rule, in the first step of each merging hierarchy we use stellar particles and (when ) or (when ; halo and stellar particles have the same mass). Clearly, the number of particles increases with the hierarchy steps, up to in the last steps considered.
The intrinsic and projected properties of the merger remnants are determined following Nipoti, Londrillo & Ciotti (2002, 2006). In particular, we measure the axis ratios and of the inertia ellipsoid (where , and are the major, intermediate and minor axis), and the angle-averaged density distribution of the stellar and DM components. We also measure the angle-averaged half-mass radius of the stellar density distribution () and of the total density distribution (). For each end-product, in order to estimate the importance of projection effects, we consider 50 random projections and we use them to compute average projected quantities and associated - scatter. For each projection we measure the ellipticity , the circularized projected density profile and the circularized effective radius (where and are the major and minor semi-axis of the effective isodensity ellipse). In addition, we measure the central projected velocity dispersion , obtained by averaging the projected velocity dispersion over the circularized surface density profile within an aperture of . The projected mass is computed by counting stellar and DM particles within the same projected elliptical aperture with circularized radius .
As a convergence test, we reran three of the simulations at higher resolution (with five times more particles), finding good agreement with the lower-resolution cases. In particular, the runs 2A5ph, 2A5po and 2A5m10x differ from the runs 2A1ph, 2A1po and 2A1m10x, respectively, just for the number of particles of the seed galaxies (see Tables 1 and 2): the quantities , and , which are crucial for the present study, are indistinguishable in lower and higher resolution simulations.

4. Effect of dry mergers on the mass density distribution
4.1. Total density profiles
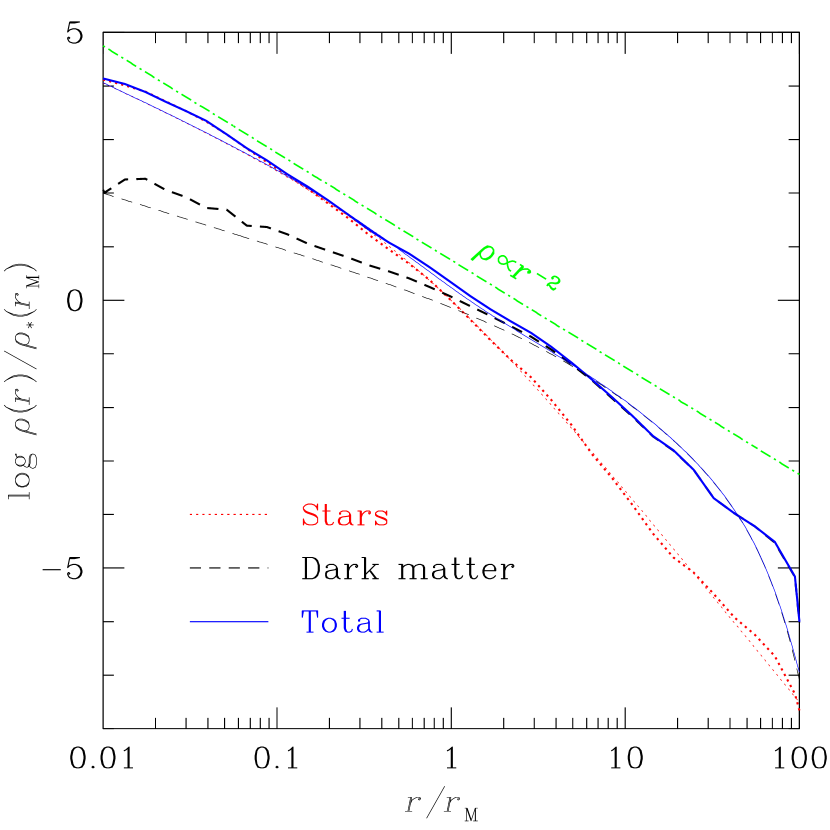
From lensing studies we know that the total density profiles of early-type galaxies are close to isothermal over a large radial range. Here we address the question of whether such a feature is preserved by dry major and minor merging. As a first experiment we consider the merging between two identical truncated SISs with total density distribution (10). In this simple case each seed galaxy model is one-component, so we do not distinguish between DM and baryons. Figure 3 plots the total density profiles of the seed models and of the merger remnant of this run. By construction, the seed model has density profile within and steeper at larger radii because of the exponential truncation. The density profile of the merging end-product is very similar to that of the seed galaxy: fitting it with a power law in the radial range we get a best-fitting index . The finding that the inner density cusp is preserved by dissipationless merging is consistent with theoretical expectations (Dehnen, 2005) and previous numerical experiments (Fulton & Barnes, 2001; Kazantzidis, Zentner & Kravtsov, 2006). Our simulation shows that the density profile is preserved by dry major merging not only in the central regions, but throughout the system.
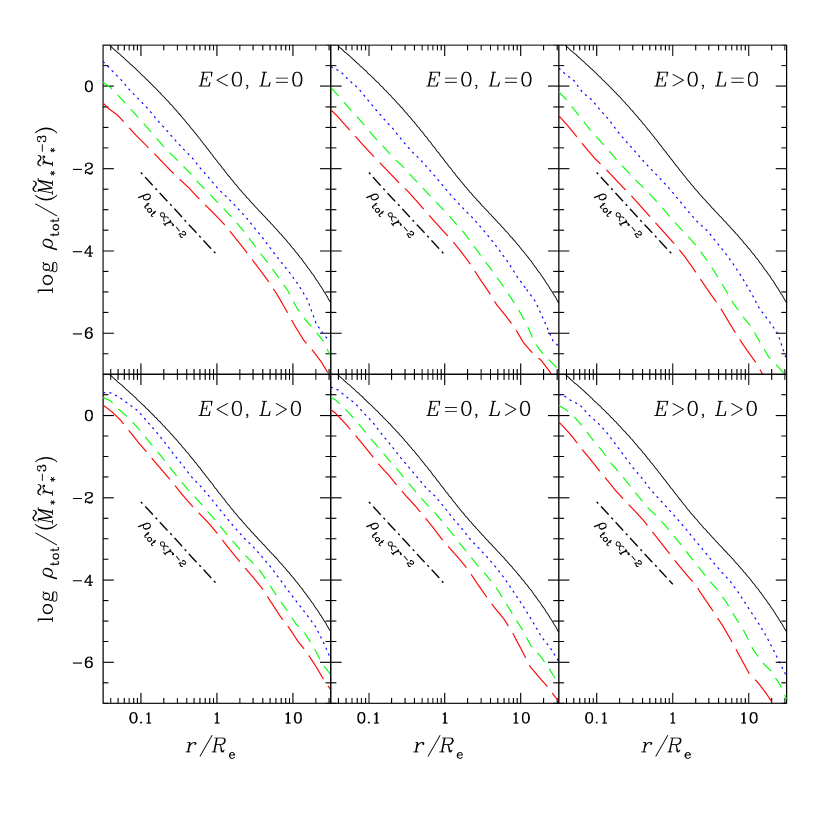
Let us now consider how the total density profile is affected by merging more realistic (two-component) stellar systems. Figure 4 plots, as a function of radius, the (angle-averaged) total density distributions of our six reference major merging hierarchies, having as seed galaxy model A and differing for the orbital parameters of the galaxy encounters. From the diagrams it is apparent that the merging process affects significantly the normalization of the density profile (producing systems of lower density at the half-light radius; see also § 5), but it roughly preserves its shape. To quantify the effect of dry merging on the shape of the total mass density distribution we fit the total intrinsic density profiles of our models with a power law over the radial range , where is the average of the circularized half-light radius over 50 random projections. By construction our seed galaxy models have close-to-isothermal total density profile: in the radial range model A and model D are best fitted with and , respectively. Figure 5 shows the distribution of the best-fitting for the end-products of all steps of our merging hierarchies (30 steps altogether). It is apparent that dry merging can make slightly steeper or shallower the total density profile, depending on the characteristics of the galaxy encounters. The distribution has mean and standard deviation (). This is comparable with the observationally determined values and standard deviation (Koopmans et al., 2009), suggesting that if a population of early-type galaxies has initially close-to-isothermal total density profile, dry merging tends to maintain this property, but adds non-negligible scatter.
The best-fitting values of for the single simulations are reported in Table 2 together with the other simulation parameters: off-axis major mergers tend to produce steeper density profiles than head-on encounters, while there is no evidence of a dependence of on the orbital energy. Minor and major merging involving more DM dominated galaxies (model D) tend to decrease .
We focused on the slope of the total density profile over the radial range , which is approximately the range probed in combined strong-lensing and stellar kinematics observations. However, we note that the total density profiles of our seed models and merger remnants are well represented by a power-law over a much larger radial range, though the power-law index is rather sensitive to the radial interval. For instance, seed models A and D are fitted over the larger radial range111Larger radial ranges are interesting for comparison with weak-lensing observations of early-type galaxies (Gavazzi et al., 2007). with and , respectively. Also fitting over this larger radial range, the end-products are found to have slightly larger or smaller best-fitting than the seed galaxy of their hierarchy.
4.2. Central dark-matter fractions
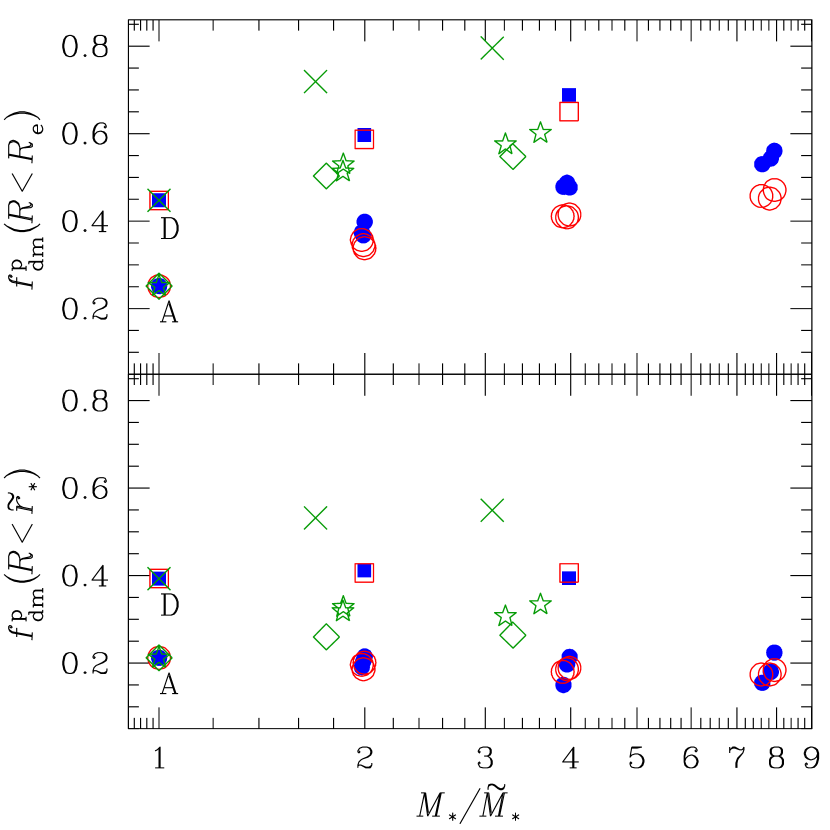
We have seen that dry merging tends to preserve the slope of the total density profile. We also found that the shape of the density distributions of stars and DM is not dramatically affected by dry mergers (see Fig. 2), though there is redistribution between DM and stars that leads to a systematic increase with merging of the projected DM-to-total mass ratio within . This is apparent from the upper panel Fig. 6, plotting as a function of for our major and minor merging hierarchies. The seed galaxy models have (model A) and (model D), while the merger remnants have DM fractions in the range . In all cases increases with the stellar mass along the merging hierarchy. Taken by itself this effect might be interpreted as quite naturally explaining the “tilt” seen in the luminosity-based FP relation in terms of a systematic increase in the central DM fraction with increasing mass. If more luminous and massive galaxies represent a later stage in the merging hierarchy, this increased central DM fraction will lead to a larger dynamical mass per unit luminosity as compared to less massive (and less merged) galaxies. However, the increase of with mass during the merging hierarchy is mainly driven by a strong increase in the effective radius produced by dry merging, which might be considered an argument against the relevance of dry mergers in the assembly of elliptical galaxies (see § 5). In fact, the trend is quite different if one considers as measured within a small aperture of fixed radius, independent of the galaxy’s half-light radius. For instance, in the lower panel of Fig. 6 we show the results obtained by measuring the projected DM fraction within and aperture of radius . We note that ranges from for the seed galaxies, to for the most extended remnant. We find that the remnants have close the value measured in the seed galaxy of their hierarchy, indicating that the central projected DM fraction, measured within a region of fixed size in physical units, is not substantially affected by dry merging. Interestingly, minor mergers (stars, diamonds and crosses in the diagrams) tend to produce systems with higher values of than major mergers (circles and squares in the diagrams), indicating that dynamical-friction heating (El-Zant et al., 2004; Nipoti et al., 2004; Romano-Díaz et al., 2008; Johansson, Naab, & Ostriker, 2009b) is effectively balanced by accretion of DM in the central regions (see Nipoti et al., 2004, for a discussion).
5. Effect of dry mergers on the lensing scaling relations
We address here the question of whether the lensing scaling relations are preserved by major and minor dry merging. For this reason we consider seed galaxy models that lie on the observed correlations and we investigate whether the merger remnants are consistent with the same relations within their intrinsic scatter. Nipoti, Londrillo & Ciotti (2003a) pointed out that, when comparing merging simulations with the standard (luminosity based) scaling relations of early-type galaxies, it is crucial to consider not only the edge-on FP, but also the Faber-Jackson and the Kormendy relation, because a system may well lie on the FP while deviating significantly from the other relations. Similarly, the fact that a galaxy model lies on the MP does not mean that it satisfies also the the observed lensing mass-size and mass-velocity dispersion relations, because —for fixed — anomalous values of both and can conspire to give a value of perfectly consistent with observations. For this reason we will study how our merger hierarchies behave with respect to all three lensing scaling laws.
5.1. Placing the seed galaxies on the observed scaling relations
As discussed extensively in Nipoti, Treu & Bolton (2008), for a spherical galaxy model the dimensionless quantity is fully determined by the stellar and DM density profiles, and by the distribution of the orbital velocity of stars. Of course, purely dynamical systems such as our seed galaxy models can be rescaled arbitrarily by choosing their mass scale and length scale in physical units. While the value of is independent of this choice, in order to place a model on the observed mass-size and mass-velocity dispersion relations, mass and length scales must be chosen consistently.
Given that the MP relation has no tilt and that the observed mass-size and mass-velocity dispersion relations are consistent with power laws over the range covered by the lensing data (equations [1], [4] and [5]), we would not need to specify the mass of the seed galaxy in order to address the question of the effect of dry merging. It is sufficient to check whether the merging end-products have values consistent with the MP and the relative change of , and are consistent with the observed mass-size and mass-velocity dispersion relations. However, just for clarity and without loss of generality, we fix , so all our seed galaxies have total stellar mass . The projected mass for galaxy model A and for galaxy model D. We then fix kpc for model A and kpc for model D, so that they lie on the relation (and, as a consequence, on the relation, because they lie on the MP by construction). The satellites in the minor-merger hierarchies have masses and characteristic radii proportionally smaller than those of the central galaxy (see § 3.3), but such that they also satisfy the scaling laws. Clearly, and are kept fixed throughout each hierarchy, so masses, sizes and velocities of all remnants are now known in physical units.
5.2. Comparing the merger remnants with the observed scaling relations
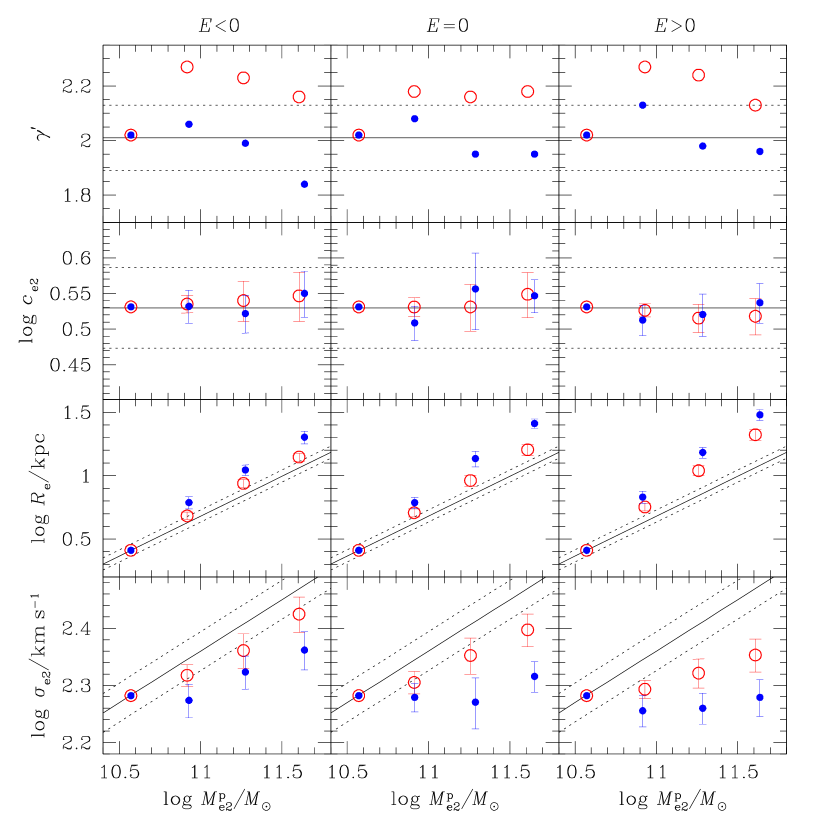
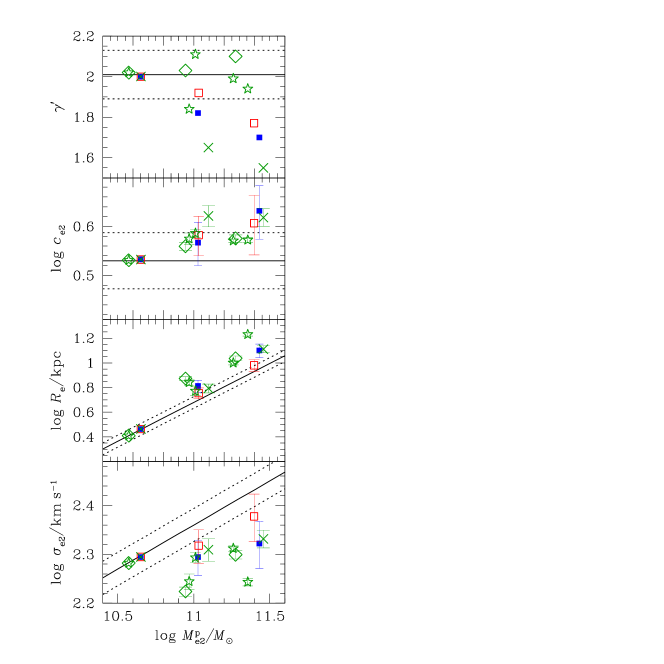
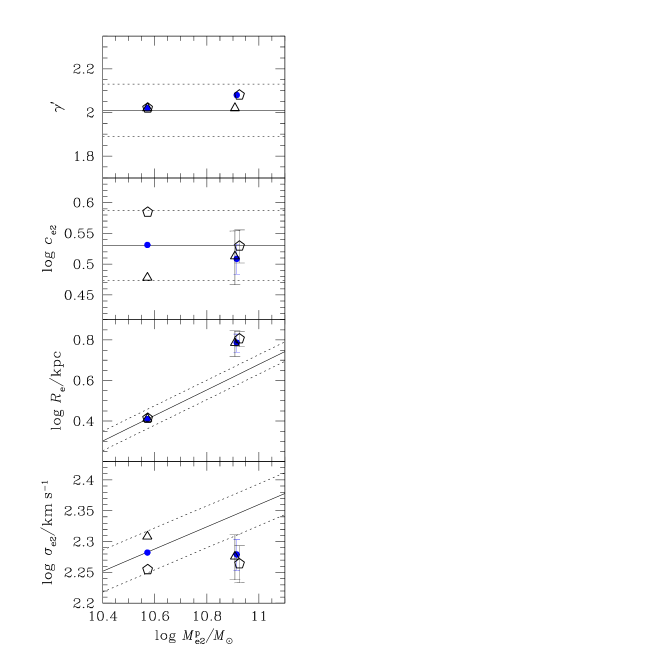
The location of the merger remnants with respect to the observed scaling laws is shown in Figs. 7, 8 and 9. We note that the total projected mass within increases with dry merging more than the stellar mass or the total mass integrated over the entire system. This can be seen, for instance, in Fig. 7: in three merging steps increases by more than a factor of ten, while the stellar or total mass, integrated over the entire system, can increase at most by a factor of eight (in fact less, as a consequence of mass loss). This finding indicates that dry merging redistributes matter so that the fraction of mass found in a cylinder of radius increases significantly.
Let us focus now on the behavior of the merger hierarchies with respect to the MP, which is illustrated in the second row of panels of Fig. 7, 8 and 9. In general, the intermediate and final remnants of all our merger hierarchies are found to be very close to the MP. Actually, all the remnants of model-A merging hierarchies have values of within the observed scatter of the MP, while the end-products of the model-D merger hierarchies (squares and crosses in Fig. 8) have slightly higher values of , and are only marginally consistent with the MP. This result implies that is a robust parameter, since its value is essentially preserved under a wide range of dry-merging histories. In a scenario in which early-type galaxies grow significantly by dry merging, the characteristic value of must therefore be established by the dissipative (“wet”) formation processes of the primordial progenitor galaxies. The implications of the observed value of for galaxy structure (as opposed to evolution) are the subject of Nipoti, Treu & Bolton (2008). Remarkably, dry merging appears also to wash out the effect of orbital anisotropy on : the end-products of mergers whose seed galaxies differ only in the velocity distribution of their stars (and thus have different values of ; see Nipoti, Treu & Bolton, 2008) are indistinguishable in the space of the parameters , and (see Fig. 9).
As anticipated above, the fact the MP is “closed” with respect to dry merging does not mean that the same must be true also for the mass–velocity-dispersion and mass–size relations. In fact, as might be expected from previous explorations of the effect of dry merging on the Faber-Jackson and Kormendy relations (Nipoti, Londrillo & Ciotti, 2003a; Boylan-Kolchin, Ma & Quataert, 2006), the end-products of all the merger hierarchies are found to deviate significantly from the - and - relations, because they have too large and too low for their mass (see third and fourth rows of panels in Fig. 7, 8 and 9). It turns out that the too large and too low compensate, giving values of very close to the observed one (we recall that and appear in the definition of just in the product ; see equation [2]). Some of the minor-merger hierarchies lead to strong deviations from the observed scaling relations (see right-most stars in Fig. 8): in some steps increases with more than linearly, and decreases with , consistent with recent results by Naab, Johansson, & Ostriker (2009). In other cases the increase in size is significantly smaller, suggesting that the structural effect of minor merging is quite dependent on the details of the interaction, such as DM distribution and orbits of the satellites. In the merging hierarchies having as seed galaxy model D, whose end-products are found slightly off the MP, the deviations from the mass-size and mass-velocity dispersion relation are in general relatively small (squares and crosses in Fig. 8), and marginally consistent with the observed relations in the case of off-axis major mergers (open squares in Fig. 8). In these cases low values of are not compensated by large enough .
In the top panels of Fig. 7, 8 and 9 the total-density slope (see § 4) is plotted as a function of mass for the seed galaxies and the remnants. The behavior on the - plane is not strictly correlated to that in the -, - and - planes, though we note that models that deviate more from the - and - correlations tend to have steeper total density profiles (i.e. higher values of ), while systems with higher values of have shallower total density profiles.
5.3. Mass dependence of , and for merger remnants
The growth of galaxies by dry merging of smaller systems can be quantified by approximating the dependence of the structural parameters on mass with power-law functions: , and . For each step of a hierarchy the power-law indices are given by , and , where indicates variation between the remnant and the progenitor [e.g. ]. We can obtain an estimate of the expected global effect of a general dry-merging hierarchy by considering the average values (, , ) and the associated standard deviations (, , ) of these values for our major and minor merging hierarchies (30 steps altogether). These values must be compared with the slope of the observed scaling laws (equations [3], [4] and [5]), which correspond to , and , consistent with our statement that the MP is roughly preserved by dry mergers, but the mass–size and mass–velocity-dispersion relations are not.
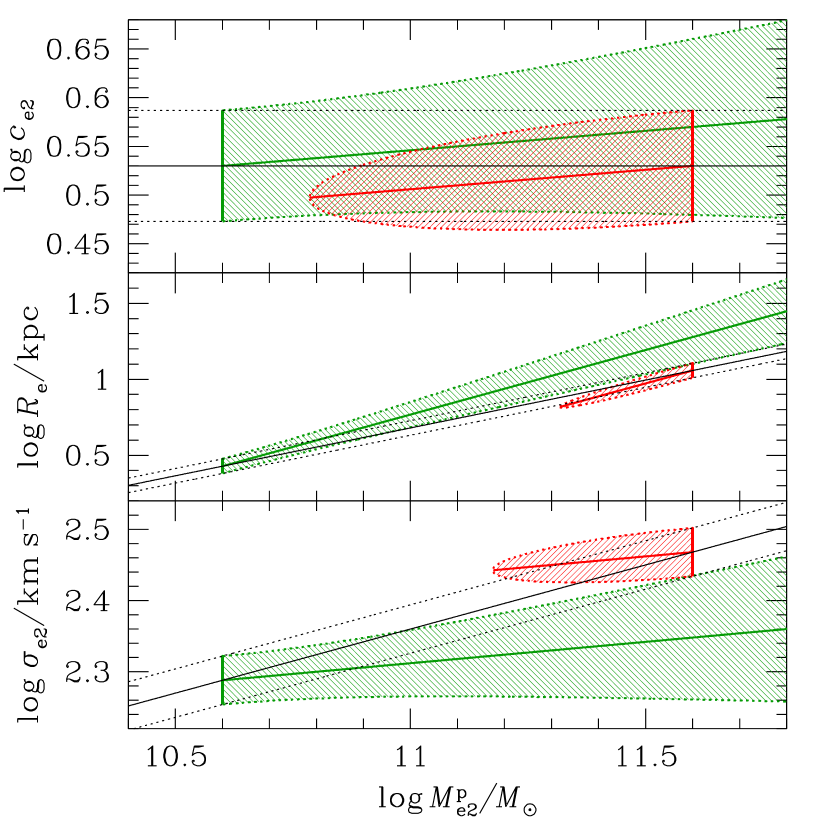
Remarkably, the distributions of , and for our N-body experiments are characterized by a substantial scatter, which is quantified by the quoted values of the standard deviations. Such a broad distribution around the average slope is an additional problem for the dry-merging scenario, because it implies that dry mergers bf would introduce a lot of dispersion in the scaling relations. To quantify this, let us consider a population of galaxies, all with and , that evolve through dry merging with an unspecified merging history made of both minor and major mergers (we are not assuming that these seed galaxies merge just among themselves): under the hypothesis that is distributed normally, the merger remnants of mass are expected to have normally distributed with average and standard deviation . Thus, in this simple example, the predicted scatter in the relation at a given increases for increasing , and —for fixed — increases for increasing , suggesting that a large enough mass growth by dry merging would produce a spread in at given inconsistent with the tight observed correlation. The importance of this effect can be appreciated by looking at the green shaded area in the central panel of Fig. 10, corresponding to the expected distribution, within 1 , of the merger remnants of a population of galaxies all with the same projected mass (green vertical bar in the diagram), but now with a more realistic distribution of : we assume that is normally distributed with average satisfying the observed - correlation (equation [4]) and standard deviation equal to its intrinsic scatter ( dex). Similar considerations apply to and (green shaded areas in the top and bottom panels of Fig. 10). It is apparent that the scatter in and for the remnant population rapidly increases with mass above the observed scatter, while the effect is weaker in the - plane. The exact shapes of the green shaded areas depend on the set of merging hierarchies considered. For instance, in the -, we find a weaker deviation from the observed correlation if we consider only model-D hierarchies, and a stronger deviation if we consider only minor-merging hierarchies (as a consequence of the specific behavior of these models; see § 5.2): in any case regions of the diagrams out of the observed strip are quickly populated.
Summarizing, we showed that the lensing mass–size and mass–velocity-dispersion relations are effectively destroyed by dry mergers, which produce systems with too large half-light radii and too low velocity dispersions, and introduce substantial scatter in and at given mass. We conclude that present-day early-type galaxies did not form by dry merging of high- early-type galaxies obeying the local () lensing scaling relations.
6. Dry mergers and redshift evolution of early-type galaxies
In the previous section we explored the effect of dry mergers on galaxies lying on the lensing scaling relations observed locally. However, higher- early-type galaxies must not necessarily obey the lensing scaling laws. In fact, though the lensing scaling relations at higher redshift are not available, measures of the effective radii and the stellar masses of high-redshift () early-type galaxies suggest that these objects may be remarkably more compact than their local counterparts (e.g., Daddi et al., 2005; Trujillo et al., 2006; Zirm et al., 2007; Cimatti et al., 2008; van Dokkum et al., 2008; van der Wel et al., 2008). As shown by our current results, as well as previous work (Nipoti, Londrillo & Ciotti, 2003a; Boylan-Kolchin, Ma & Quataert, 2006), dry merging has the effect of making galaxies less compact, so it has been proposed that evolution of early-type galaxies through such a mechanism might be consistent with the recent observational finding that higher- galaxies are more compact (e.g., Khochfar & Silk, 2006; Hopkins et al., 2009; van der Wel et al., 2009). Even allowing for the possibility that the candidate dry-merging progenitors of present-day early-type galaxies do not obey the local lensing scaling laws, the tightness of these correlations can be used to constrain the contribution of dry mergers in the assembly history of early-type galaxies.
For this purpose it is useful to consider the following question: under the hypothesis that local early-type galaxies (satisfying the lensing scaling laws) formed by dry merging, what are the expected properties of their (high-redshift) progenitors? To address this question we assume that the remnants of the last steps of all our simulated merging hierarchies satisfy the local relation. We then fix , and we choose a different value of for each hierarchy (in all cases smaller than the values of adopted in § 5), so , and are given in physical units for all models. The location of the models with respect to the observed lensing correlations is shown in Fig. 11: the most massive systems lie (by construction) on the observed relation (upper panel) and approximately also on the relation (lower panel), consistent with the fact that is not significantly affected by dry merging; less massive systems lie systematically below the relation and above the relation. In this picture the lowest-mass systems in the diagrams in Fig. 11 (those with , all having by construction ) would represent the high- progenitors of local ellipticals. Given the idealized nature of our experiments, which are not set in a full cosmological context, we cannot define precisely the redshift of these progenitors. However, a lower limit to their redshift can be obtained by noting that the time to complete our merging hierarchies is in the range Gyr, with median Gyr. A realistic merging hierarchy is expected to be a mixture of steps of the explored hierarchies, so we take as reference time the median, which is the look-back time to . Therefore, in the present context, our seed galaxy models should be compared with early-type galaxies with stellar mass . The diagrams in Fig. 11 show that the candidate progenitors are predicted to be compact, with effective radii up to a factor of smaller and velocity dispersions up to a factor of higher than local galaxies with similar mass, and are characterized by a significant spread in both and . We recall that the candidate progenitors have values of consistent with those observed in present-day galaxies, because our seed galaxies lie on the MP by construction. Though one cannot assume a priori that high-z progenitors lie on the MP, this assumption is justified as far as we are assuming —as working hypothesis— that local early-type galaxies formed by dry merging, because we have shown that dry mergers tend to preserve the MP.
The average properties of the candidate progenitors are qualitatively consistent with those of early-type galaxies (see Cimatti et al., 2008; Cappellari et al., 2009), so one might be tempted to conclude that a dry-merging scenario is compatible with observations. This is not necessarily the case, because the tightness of the local relations must be reproduced as well. In fact, as we are going to show, the tightness of the local relations sets the strongest constraints on dry merging, requiring a remarkable degree of fine tuning of the mix of progenitors and types of interaction.
This can be seen from the example shown in Fig. 10, where we focus, without loss of generality, on local early-type galaxies with projected mass (red vertical bars in the diagrams), and we constrain the properties of their progenitors in a dry-merging scenario. We have seen in § 5.3 that progenitors of given , and would produce through dry merging a population of galaxies with a range of values of , and for given mass, depending on the expected distributions of , and , which are constrained by our N-body simulations. Here we take the opposite approach and impose that our reference present-day galaxies with have , and with average values and intrinsic scatter consistent with observations. This procedure delivers constraints on , , and in the form of “allowed” regions in the diagrams of Fig. 10 (red shaded areas). For instance, let us focus on the plane (central panel): at a given mass , the upper and lower limits of the red shaded areas bracket the distribution within of of a normally distributed population of galaxies of mass that can produce via dry merging our population of galaxies with lensing mass . The same considerations apply to the - and - planes. It is clear that the smaller the shaded area, the higher the fine tuning necessary to obtain the local distributions.
While the constraints in the plane are weak (because is roughly preserved by dry merging), those in the and plane are quite strong and indicate that an uncomfortable degree of fine tuning is required in a dry merging scenario. Note, in particular, that a growth in via dry merging by more than a factor of (and in size by more than a factor of is excluded (see the red shaded area in the - plane). Though our results constrain the projected mass measured within , the upper limits on the mass growth can be extended to the total mass, because in our simulations increases with dry merging faster than the total mass (integrated over the entire system; see § 5.2). Therefore, our results indicate that present-day, massive early-type galaxies did not assembled more than of their total (dark plus luminous) mass through dry merging.
One important caveat is that the allowed amount of mass growth depends on and , and thus on the considered merging histories. Our set of simulations is biased in favour of major mergers and our exploration of the orbital parameter space is limited, especially in the case of the more DM dominated (model D, ) galaxies. For instance, if we consider only our minor-merger hierarchies the upper limit to the mass fraction goes down to , while this figure is if we consider only model-D hierarchies. In any case, a certain amount of fine tuning is required. Larger sets of numerical experiments, based on more realistic merging histories, are needed to quantify whether the amount of fine tuning required is consistent with hierarchical growth in a cosmological context.
From Fig. 10 it is also apparent that even an increase in mass by a factor smaller than 2 requires a lot of fine tuning, in the sense that the progenitors must have tighter mass–size and mass–velocity-dispersion correlations than local galaxies. This cannot be excluded, because there is no information so far on the lensing scaling relations beyond the redshift range covered by the SLACS sample ().
7. Conclusions
We explored the effect of minor and major dry mergers on the lensing scaling relations of early-type galaxies. Our main findings can be summarized as follows. Major and minor dry mergers:
-
1.
Preserve the nearly isothermal structure () of early-type galaxies, adding a scatter of to the logarithmic slope (for an increase in stellar mass of up to a factor of ), consistent with the observed value of 10%.
-
2.
Do not change the ratio between total (lensing) mass and “virial” mass () more than the observed scatter of 0.057 dex. In other words, they move galaxies along the MP.
-
3.
Move galaxies away from the observed correlations between total (lensing) mass and size or velocity dispersion. Specifically, dry mergers increase the radius more rapidly than the scaling relation with mass would predict, while they do not increase velocity dispersion rapidly enough.
-
4.
Add substantial scatter in the lensing mass-size and mass–velocity-dispersion relations.
The first two findings indicate that two important properties of early-type galaxies —the isothermal total mass profile and the MP— are quite robust against dry merging. If these regular structural and kinematic properties are established —presumably at , in order to satisfy constraints on the old age of their stellar populations (e.g., Treu et al., 2005) and of the lack of evolution of the logarithmic slope of the total mass density profile (Koopmans et al., 2006; Koopmans et al., 2009)— further growth via dry merging would not spoil this structural and kinematic homology of early-type galaxies.
The third and fourth findings pose a significant problem for a scenario where early-type galaxies grow significantly in mass via dry mergers. The non-conservation of the mass–size and mass–velocity-dispersion relation shows that the progenitors of present day early-type galaxies cannot be obeying the same scaling relations. On average, they will have to be smaller in size for a given velocity dispersion or total mass, qualitatively in line with some recent observational results (van der Wel et al., 2008). However, and most importantly, dry mergers add substantial scatter to the scaling relations. A few random generations of dry mergers would be sufficient to produce a scatter much larger than observed. In particular, our results exclude that present-day massive early-type galaxies assembled more than of their total (luminous plus dark) mass and increased their size by more than a factor via dry merging. Quantitatively, the amount of dispersion introduced in the scaling laws by dry merging depends on the detailed properties of the merging history, such as DM content of the progenitors and mass-ratio and orbital parameters of the galaxy encounters. A high degree of fine tuning - where the properties of the progenitor correlate with the peculiarities of the mergers process – would be needed to reconcile dry mergers with the tight observed lensing scaling relations.
In the present work we considered only gas-free mergers, so our results do not apply if mergers occur in the presence of significant amounts of gas. It is well known that dissipative processes might help reconcile merging with the standard scaling relations (e.g. Robertson et al., 2006; Ciotti, Lanzoni & Volonteri, 2007; Johansson, Naab, & Burkert, 2009a), so it is reasonable that the same can happen for the lensing scaling relations. However, the role of wet (gas-rich) mergers in the formation of early-type galaxies, though not strongly constrained by the scaling relations, is limited by other considerations: if these systems experienced a significant amount of mergers in relatively recent times, most of these mergers must have been dry, because the old stellar populations of early-type galaxies (e.g. Thomas et al., 2005) are inconsistent with substantial recent star formation. It is also the case that in very massive galaxies most accreted cold gas is likely to be eliminated by evaporation from the hot interstellar medium before it can form stars (Nipoti & Binney, 2007).
We emphasize that our constraints on the dry-merging history apply to massive early-type galaxies, of which the SLACS sample is representative, and are not in conflict with the hypothesis that exceptionally luminous, brightest cluster galaxies (BCGs) formed via multiple dissipationless mergers, the so-called galactic cannibalism scenario (Ostriker & Tremaine, 1975; Hausman & Ostriker, 1978). In fact, numerical simulations of dynamical-friction driven galactic cannibalism predict that brightest cluster galaxies must be more extended than expected from the extrapolation of the size-luminosity correlation of smaller galaxies (Nipoti et al., 2003b; Ruszkowski & Springel, 2009), as observed (e.g., Oegerle & Hoessel, 1991; Bernardi, 2009). In this respect, it will be very interesting to perform a systematic exploration of the behavior of brightest cluster galaxies with respect to the lensing scaling relations explored here. Larger numbers of BCGs with lensing features and stellar kinematics than those currently available (e.g., Sand et al., 2008) are needed to carry out this study.
In conclusion, we can see three main ways to make progress and determine whether the tightness of the lensing scaling relations is fatal to the idea of substantial growth of normal (i.e. non-BCG) early-type galaxies by dry mergers. From a theoretical point of view, fully cosmological simulations are needed to correlate properties of the progenitors with the details of the merging process and verify whether the required extraordinary amount of fine tuning does indeed occur. Also, future studies need to incorporate stellar mass as a fundamental variable that can also be directly linked to observations. From an observational point of view, large and homogeneous samples of lenses at higher- than SLACS are needed to determine how the lensing scaling relations evolve with redshift.
References
- Bell et al. (2006) Bell, E.F. et al., 2006, ApJ, 640, 241
- Bender, Burstein & Faber (1992) Bender, R., Burstein, D., & Faber, S.M. 1992, ApJ, 399, 462
- Bernardi (2009) Bernardi, M. 2009, MNRAS, 395, 1491
- Binney & Tremaine (1987) Binney, J., & Tremaine, S. 1987, Galactic Dynamics, Princeton University Press, Princeton
- Bolton et al. (2006) Bolton, A.S., Burles, S., Koopmans, L.V.E., Treu, T., & Moustakas, L.A. 2006, ApJ, 638, 703
- Bolton et al. (2007) Bolton, A.S., Burles, S., Treu, T., Koopmans, L.V.E., & Moustakas, L.A. 2007, ApJ, 665, L105
- Bolton et al. (2008a) Bolton, A.S. et al., 2008a, ApJ, 682, 964
- Bolton et al. (2008b) Bolton, A.S. et al., 2008b, ApJ, 684, 248
- Bower, Lucey & Ellis (1992) Bower, R.G., Lucey, J.R., & Ellis, R.S. 1992, MNRAS, 254, 601
- Boylan-Kolchin, Ma & Quataert (2006) Boylan-Kolchin, M., Ma, C.-P., & Quataert, E. 2006, MNRAS, 369, 1081
- Bundy, Treu & Ellis (2007) Bundy, K., Treu, T., & Ellis, R.S. 2007, ApJ, 665, L5
- Cappellari et al. (2009) Cappellari M., et al., 2009, arXiv, arXiv:0906.3648
- Carlberg (1986) Carlberg, R.G. 1986, ApJ, 310, 593
- Cimatti et al. (2008) Cimatti, A. et al., 2008, A&A, 482, 21
- Ciotti & van Albada (2001) Ciotti, L., & van Albada, T.S. 2001, ApJ, 552, L13
- Ciotti, Lanzoni & Volonteri (2007) Ciotti, L., Lanzoni, B., & Volonteri, M. 2007, ApJ, 658, 65
- Daddi et al. (2005) Daddi, E. et al., 2005, ApJ, 626, 680
- Dehnen (1993) Dehnen, W. 1993, MNRAS, 265, 250
- Dehnen (2002) Dehnen, W. 2002, Journal of Computational Physics, 179, 27
- Dehnen (2005) Dehnen, W. 2005, MNRAS, 360, 892
- Djorgovsky & Davis (1987) Djorgovsky, S., & Davis, M. 1987, ApJ, 313, 59
- Dressler et al. (1987) Dressler, A., Faber, S.M., Burstein, D., Davies, R.L., Lynden-Bell, D., Terlevich, R.J., & Wegner, G. 1987, ApJ, 313, 37
- El-Zant et al. (2004) El-Zant, A.A., Hoffman, Y., Primack, J., Combes, F., & Shlosman, I. 2004, ApJ, 607, L75
- Faber et al. (2007) Faber, S.M. et al., 2007, ApJ, 665, 265
- Faber & Jackson (1976) Faber, S.M., & Jackson, R.E. 1976, ApJ, 204, 668
- Ferrarese & Merritt (2000) Ferrarese, L., & Merritt, D., 2000 ApJ, 539, L9
- Fulton & Barnes (2001) Fulton, E., & Barnes, J.E. 2001, Ap&SS, 276, 851
- Gavazzi et al. (2007) Gavazzi, R. et al., 2007, ApJ, 667, 176
- Gebhardt et al. (2000) Gebhardt, K. et al., 2000, ApJ, 539, L13
- González-García & van Albada (2003) González-García, A.C., & van Albada, T.S. 2003, MNRAS, 342, L36
- Häring & Rix (2004) Häring, N., & Rix, H.-W. 2004, ApJ, 604, L89
- Hausman & Ostriker (1978) Hausman, M.A., & Ostriker, J.P. 1978, ApJ, 224, 320
- Hernquist (1990) Hernquist, L. 1990, ApJ, 356, 359
- Hopkins et al. (2009) Hopkins, P.F., Hernquist, L., Cox, T.J., Keres, D., & Wuyts, S. 2009, ApJ, 691, 1424
- Jaffe (1983) Jaffe, W. 1983, MNRAS, 202, 995
- Johansson, Naab, & Burkert (2009a) Johansson, P.H., Naab, T., & Burkert, A. 2009a, ApJ, 690, 802
- Johansson, Naab, & Ostriker (2009b) Johansson, P.H., Naab, T., & Ostriker, J.P. 2009b, ApJ, 697, L38
- Kazantzidis et al. (2005) Kazantzidis, S., et al. 2005, ApJ, 623, L67
- Kazantzidis, Zentner & Kravtsov (2006) Kazantzidis, S., Zentner, A.R., & Kravtsov, A.V. 2006, ApJ, 641, 647
- Khochfar & Burkert (2003) Khochfar, S., & Burkert, A. 2003, ApJ, 597, L117
- Khochfar & Silk (2006) Khochfar, S., & Silk, J. 2006, ApJ, 648, L21
- Koopmans et al. (2006) Koopmans, L.V.E., Treu, T., Bolton, A.S., Burles, S., & Moustakas, L.A. 2006, ApJ, 649, 599
- Koopmans et al. (2009) Koopmans, L.V.E., Bolton, A., Treu, T., Czoske, O., Auger, M., Barnabe, M., Vegetti, S., Gavazzi, R., Moustakas, L., & Burles, S. 2009, ApJL, submitted
- Kormendy (1977) Kormendy, J. 1977, ApJ, 218, 333
- Londrillo, Nipoti, Ciotti (2003) Londrillo, P., Nipoti, C., & Ciotti, L. 2003, In “Computational astrophysics in Italy: methods and tools”, Roberto Capuzzo-Dolcetta ed., Mem. S.A.It. Supplement, vol. 1, p. 18
- Mandelbaum et al. (2006) Mandelbaum, R., Seljak, U., Kauffmann, G., Hirata, C.M., & Brinkmann, J. 2006, MNRAS, 368, 715
- Marconi & Hunt (2003) Marconi, A., & Hunt, L.K. 2003, ApJ, 589, L21
- Merritt (1985) Merritt, D. 1985, AJ, 90, 102
- Naab, Khochfar, & Burkert (2006) Naab, T., Khochfar, S., & Burkert, A. 2006, ApJ, 636, L81
- Naab et al. (2007) Naab, T., Johansson, P.H., Ostriker, J.P., & Efstathiou, G. 2007, ApJ, 658, 710
- Naab, Johansson, & Ostriker (2009) Naab, T., Johansson, P.H., & Ostriker, J.P. 2009, arXiv, arXiv:0903.1636
- Navarro, Frenk & White (1996) Navarro, J.F., Frenk, C.S., & White, S.D.M. 1996, ApJ, 462, 563 (NFW)
- Nipoti, Londrillo & Ciotti (2002) Nipoti, C., Londrillo, P., & Ciotti, L. 2002, MNRAS, 332, 901
- Nipoti, Londrillo & Ciotti (2003a) Nipoti, C., Londrillo, P., & Ciotti, L. 2003a, MNRAS, 342, 501
- Nipoti et al. (2003b) Nipoti, C., Stiavelli, M., Ciotti, L., Treu, T., & Rosati P., 2003b, MNRAS, 344, 748
- Nipoti et al. (2004) Nipoti, C., Treu, T., Ciotti, L., & Stiavelli, M. 2004, MNRAS, 355, 1119
- Nipoti, Londrillo & Ciotti (2006) Nipoti, C., Londrillo, P., & Ciotti, L. 2006, MNRAS, 370, 681
- Nipoti & Binney (2007) Nipoti, C., & Binney, J. 2007, MNRAS, 382, 1481
- Nipoti, Treu & Bolton (2008) Nipoti, C., Treu, T., & Bolton, A.S. 2008, MNRAS, 390, 349
- Oegerle & Hoessel (1991) Oegerle, W.R., & Hoessel, J.G. 1991, ApJ, 375, 150
- Osipkov (1979) Osipkov, L.P. 1979, Soviet Astron. Lett., 5, 42
- Ostriker (1980) Ostriker, J.P. 1980, ComAp, 8, 177
- Ostriker & Tremaine (1975) Ostriker, J.P., & Tremaine, S.D. 1975, ApJ, 202, L13
- Pipino & Matteucci (2008) Pipino, A., & Matteucci, F. 2008, A&A, 486, 763
- Renzini (2006) Renzini, A. 2006, ARA&A, 44, 141
- Romano-Díaz et al. (2008) Romano-Díaz, E., Shlosman, I., Hoffman, Y., & Heller, C. 2008, ApJ, 685, L105
- Robertson et al. (2006) Robertson, B., Cox, T.J., Hernquist, L., Franx, M., Hopkins, P.F., Martini, P., & Springel, V. 2006, ApJ, 641, 21
- Ruszkowski & Springel (2009) Ruszkowski M., Springel V., 2009, ApJ, 696, 1094
- Sand et al. (2008) Sand, D.J., Treu, T., Ellis, R.S., Smith, G.P., & Kneib, J.-P. 2008, ApJ, 674, 711
- Scarlata et al. (2007) Scarlata, C., et al. 2007, ApJS, 172, 494
- Thomas et al. (2005) Thomas, D., Maraston, C., Bender, R., & Mendes de Oliveira, C. 2005, ApJ, 621, 673
- Trager et al. (2000) Trager, S.C., Faber, S.M., Worthey G., & González, J.J. 2000, AJ, 120, 165
- Tremaine et al. (1994) Tremaine, S., Richstone, D.O., Yong-Ik, B., Dressler, A., Faber, S.M., Grillmair, C., Kormendy, J., & Laurer, T.R. 1994, AJ, 107, 634
- Treu et al. (2005) Treu, T., Ellis, R.S., Liao, T.X., van Dokkum, P.G., Tozzi, P., Coil, A., Newman, J., Cooper, M.C., & Davis, M. 2005, ApJ, 633, 174
- Treu et al. (2006) Treu, T., Koopmans, L.V.E., Bolton, A.S., Burles, S., & Moustakas, L.A. 2006, ApJ, 640, 662
- Treu et al. (2009) Treu, T., Gavazzi, R., Gorecki, A., Marshall, P.J., Koopmans, L.V.E., Bolton, A.S., Moustakas, L.A., & Burles, S. 2009, ApJ, 690, 670
- Trujillo et al. (2006) Trujillo, I., et al. 2006, ApJ, 650, 18
- van der Wel et al. (2008) van der Wel, A., Holden, B.P., Zirm, A.W., Franx, M., Rettura, A., Illingworth, G.D., & Ford, H.C. 2008, ApJ, 688, 48
- van der Wel et al. (2009) van der Wel, A., Bell, E.F., van den Bosch, F.C., Gallazzi, A., & Rix, H.-W. 2009, arXiv, arXiv:0903.4857
- van Dokkum (2005) van Dokkum, P.G. 2005, AJ, 130, 2647
- van Dokkum et al. (1999) van Dokkum, P.G., Franx, M., Fabricant, D., Kelson, D.D., & Illingworth, G.D. 1999, ApJ, 520, L95
- van Dokkum et al. (2008) van Dokkum, P.G., et al. 2008, ApJ, 677, L5
- Zirm et al. (2007) Zirm, A.W., et al. 2007, ApJ, 656, 66
| Id | Model | ||||||
|---|---|---|---|---|---|---|---|
| A5 | A | 1.4 | 7 | 7.8 | 10 | 2.02 | |
| A1 | A | 1.4 | 7 | 7.8 | 10 | 2.02 | |
| B5 | B | 7 | 7.8 | 10 | 2.02 | ||
| C5 | C | 0.7 | 7 | 7.8 | 10 | 2.02 | |
| D1 | D | 1.0 | 8 | 11.6 | 49 | 2.00 |
Note. — Id: name of the N-body realization. Model: name of the seed galaxy model. : anisotropy radius. : NFW concentration. . : total dark-matter mass. : total stellar mass. : total number of particles in the N-body model (stellar and dark matter particles have the same mass). : logarithmic slope of the best-fit power-law total density profile () over the radial range .
| Id | Prog. | ||||||||||
|---|---|---|---|---|---|---|---|---|---|---|---|
| 2A5ph | A5 | 0 | 0 | 140 | 0.560 | 0 | 1.99 | 18.66 | 0.493 | 40.04 | 2.06 |
| 2A5po | A5 | 0 | 1.78 | 140 | 0.542 | 0.140 | 1.99 | 18.41 | 0.491 | 41.21 | 2.16 |
| 2B5ph | B5 | 0 | 0 | 140 | 0.560 | 0 | 1.99 | 18.99 | 0.486 | 41.22 | 2.08 |
| 2C5ph | C5 | 0 | 0 | 140 | 0.560 | 0 | 1.99 | 19.03 | 0.495 | 39.23 | 2.02 |
| 2A1ph | A1 | 0 | 0 | 140 | 0.560 | 0 | 1.99 | 19.01 | 0.490 | 40.28 | 2.08 |
| 2A1po | A1 | 0 | 1.78 | 140 | 0.542 | 0.140 | 1.99 | 18.76 | 0.492 | 41.17 | 2.18 |
| 2A1eh | A1 | -0.83 | 0 | 140 | 0.336 | 0 | 2.00 | 19.73 | 0.525 | 33.77 | 2.06 |
| 2A1eo | A1 | -0.83 | 1.78 | 140 | 0.305 | 0.140 | 2.00 | 19.62 | 0.535 | 35.65 | 2.27 |
| 2A1hh | A1 | 0.83 | 0 | 140 | 0.716 | 0 | 1.98 | 17.91 | 0.459 | 42.69 | 2.13 |
| 2A1ho | A1 | 0.83 | 1.78 | 140 | 0.702 | 0.140 | 1.98 | 17.59 | 0.467 | 40.98 | 2.27 |
| 2D1ph | D1 | 0 | 0 | 240 | 0.910 | 0 | 1.99 | 92.66 | 0.746 | 72.79 | 1.82 |
| 2D1po | D1 | 0 | 1.78 | 240 | 0.886 | 0.218 | 1.99 | 92.55 | 0.743 | 75.88 | 1.92 |
| 4A1ph | 2A1ph | 0 | 0 | 280 | 0.548 | 0 | 3.95 | 36.52 | 0.526 | 69.49 | 1.95 |
| 4A1po | 2A1po | 0 | 1.78 | 280 | 0.528 | 0.130 | 3.95 | 35.28 | 0.530 | 85.17 | 2.16 |
| 4A1eh | 2A1eh | -0.83 | 0 | 280 | 0.286 | 0 | 3.99 | 38.72 | 0.613 | 55.72 | 1.99 |
| 4A1eo | 2A1eo | -0.83 | 1.78 | 280 | 0.238 | 0.120 | 3.99 | 38.38 | 0.583 | 63.14 | 2.23 |
| 4A1hh | 2A1hh | 0.83 | 0 | 280 | 0.678 | 0 | 3.90 | 32.10 | 0.473 | 90.19 | 1.98 |
| 4A1ho | 2A1ho | 0.83 | 1.78 | 280 | 0.668 | 0.122 | 3.90 | 29.51 | 0.481 | 87.52 | 2.24 |
| 4D1ph | 2D1h | 0 | 0 | 480 | 0.888 | 0 | 3.89 | 176.93 | 0.803 | 134.09 | 1.70 |
| 4D1po | 2D1o | 0 | 1.78 | 480 | 0.864 | 0.208 | 3.98 | 175.23 | 0.804 | 152.65 | 1.77 |
| 8A1ph | 4A1ph | 0 | 0 | 560 | 0.538 | 0 | 7.85 | 70.78 | 0.550 | 160.47 | 1.95 |
| 8A1po | 4A1po | 0 | 1.78 | 560 | 0.509 | 0.144 | 7.82 | 65.83 | 0.528 | 201.62 | 2.18 |
| 8A1eh | 4A1eh | -0.83 | 0 | 560 | 0.066 | 0 | 7.95 | 76.15 | 0.679 | 84.12 | 1.84 |
| 8A1eo | 4A1eo | -0.83 | 1.78 | 560 | 0.086 | 0.114 | 7.95 | 75.46 | 0.660 | 106.01 | 2.16 |
| 8A1hh | 4A1hh | 0.83 | 0 | 560 | 0.666 | 0 | 7.63 | 55.91 | 0.490 | 169.73 | 1.96 |
| 8A1ho | 4A1ho | 0.76 | 0.80 | 560 | 0.640 | 0.060 | 7.60 | 50.44 | 0.491 | 184.16 | 2.13 |
| 2A5m10x | A5 | - | - | - | - | - | 1.86 | 15.81 | 0.587 | 22.64 | 2.11 |
| 2A1m10x | A1 | - | - | - | - | - | 1.86 | 16.09 | 0.585 | 23.02 | 2.11 |
| 2A1m10y | A1 | - | - | - | - | - | 1.86 | 15.66 | 0.554 | 25.28 | 1.84 |
| 2A1m5 | A1 | - | - | - | - | - | 1.76 | 14.67 | 0.550 | 23.87 | 2.03 |
| 2D1m10 | D1 | - | - | - | - | - | 1.69 | 73.13 | 0.896 | 37.74 | 1.65 |
| 4A1m10x | 2A1m10x | - | - | - | - | - | 3.21 | 26.99 | 0.642 | 32.01 | 1.99 |
| 4A1m10y | 2A1m10y | - | - | - | - | - | 3.61 | 30.18 | 0.557 | 48.47 | 1.94 |
| 4A1m5 | 2A1m5 | - | - | - | - | - | 3.29 | 26.69 | 0.597 | 38.83 | 2.10 |
| 4D1m10 | 2D1m10 | - | - | - | - | - | 3.07 | 119.29 | 0.993 | 50.07 | 1.66 |
Note. — Id: name of the run and of the corresponding end-product. Prog.: name of the progenitor. : dimensionless orbital energy. : dimensionless orbital angular momentum modulus. : initial separation. : parallel component of the initial relative velocity. : orthogonal component of the initial relative velocity. : final stellar mass. : final dark matter mass. : virial velocity dispersion of the end-product. : circularized half-mass radius of the total density distribution of the end-product. : logarithmic slope of the best-fit power-law total density profile () over the radial range . Masses, lengths and velocities are in units of , and , respectively. The parameters , , , and are defined only for binary major-merging simulations.