Study of the A(e,e’) Reaction on 1H, 2H, 12C, 27Al, 63Cu and 197Au
Abstract
Cross sections for the p()n process on 1H, 2H, 12C, 27Al, 63Cu and 197Au targets were measured at the Thomas Jefferson National Accelerator Facility (Jefferson Lab) in order to extract the nuclear transparencies. Data were taken for four-momentum transfers ranging from =1.1 to 4.8 GeV2 for a fixed center of mass energy of =2.14 GeV. The ratio of and was extracted from the measured cross sections for 1H, 2H, 12C and 63Cu targets at = 2.15 and 4.0 GeV2 allowing for additional studies of the reaction mechanism. The experimental setup and the analysis of the data are described in detail including systematic studies needed to obtain the results. The results for the nuclear transparency and the differential cross sections as a function of the pion momentum at the different values of are presented. Global features of the data are discussed and the data are compared with the results of model calculations for the p()n reaction from nuclear targets.
pacs:
14.40.Aq,11.55.Jy,13.40.Gp,13.60.Le,25.30.RwI Introduction
A fundamental challenge in nuclear physics is trying to understand the structure of hadrons in terms of their quark-gluon constituents, which are governed by the underlying theory of strong interaction called Quantum Chromodynamics (QCD). Measurements of exclusive processes such as pion electroproduction make it possible to extract meson form factors and study the quark-gluon distributions in the nucleon. However, in order to develop a description of the atomic nucleus based on QCD, one also needs to understand how the properties and interactions of hadrons change in the nuclear medium. Measurements of exclusive processes in the nuclear medium sometimes help one to understand the interactions because QCD has definite predictions for exclusive processes in the medium. One such prediction is the phenomenon of color transparency (CT).
In the study of CT, we can observe the interplay between the creation of quark systems with small transverse size, as we would expect from QCD, and the possible suppression of interactions of such point-like configurations (PLC) with the nuclear medium. A further complication is introduced by the formation time of the final hadron, which limits the lifetime of the PLC. To understand this phenomenon, it is thus important to study the dependencies on the four-momentum transfer squared of the virtual photon, (size of the initial PLC, typically scales as ), hadron momentum (formation length), and target mass (path length through the medium).
Due to the higher probability to form a PLC, a two-quark rather than a three-quark system is preferable, making pion electroproduction a natural choice for an initial study. However, pion electroproduction introduces the assumption of a quasi-free interaction of the photon with a virtual pion in the medium. The plausibility of this assumption can be addressed by comparing the ratio of the longitudinal to transverse cross sections from a nucleus with those obtained using a nucleon target, as differences in the behavior of this ratio would indicate effects of the nuclear medium resulting in the breakdown of the quasi-free assumption.
Nuclear transparency is a natural observable in the quest to identify the onset of color transparency. Nuclear transparency is defined as the ratio of the cross section per nucleon for a process on a bound nucleon inside a nucleus to that from a free nucleon. Since the nuclear medium is not opaque to hadrons, color transparency will lead to an increase in nuclear transparency as a function of momentum transfer, hadron momentum and target mass. This simultaneous increase of nuclear transparency is distinct from those from other conventional processes such as rescattering. Moreover, it illustrates the need for careful experiment design that simultaneously measures the and dependence of nuclear transparency and at the same time tests alternative reaction mechanisms that can produce potential increases in nuclear transparency.
With the availability of high-intensity, continuous electron beams up to 6 GeV at Jefferson Lab it became possible for the first time to determine simultaneously the and dependences of the differential pion cross sections for in the 1-5 GeV2 range. These data were acquired in 2004 for 1H, 2H, 12C, 27Al, 63Cu and 197Au targets. The and dependence of the extracted transparency were published in Clasie .
The purpose of this work is to describe the experiment and analysis and to present and discuss additional results. The article is organized as follows: the next sections describe methods for extracting nuclear transparencies and discuss some earlier data. Section IV introduces the basic cross section formalism of pion electroproduction. In section V the experiment is described including the experimental setup. The data analysis is described in section VI. The determination of the cross sections and the extraction of the nuclear transparencies and their associated uncertainties are described in section VII and section VIII. The results are presented in section IX. The global features of the cross section ratio and the nuclear transparencies are discussed and a comparison is made with results of recent calculations.
II Methods of determining nuclear transparency from data
In a simple picture of pion electroproduction from the nucleus, the electron exchanges a virtual photon with a proton which is moving due to its Fermi momentum. The struck proton turns into a neutron ejecting a positively charged pion (quasi-free approximation). In the quasi-free picture, the ejected pion may interact with the residual nucleons and the fraction of pions which can escape from the nucleus is the nuclear transparency of pions. In reality, the scattering process is more complicated and the deviations from this picture reveal much about the nucleus and their constituents. In the simple quasi-free picture, the ratio of the longitudinal to transverse cross section from a bound proton inside the nucleus is expected to be the same as that from a free proton.
Assuming the dominance of the quasi-free process, one can extract the nuclear transparency of the pions by taking the ratio of the acceptance corrected cross sections from the nuclear target to those from the proton. Nuclear transparency quantifies the interactions of the outgoing pion with the residual nucleons on its way out of the nuclei, and is thus the key observable in searching for CT effects. Color Transparency was first proposed by Brodsky and Mueller BroMue in 1982, and refers to the vanishing of the hadron-nucleon interaction for hadrons produced in exclusive processes. At sufficiently high momentum transfers, where the hadron is produced with small transverse size, BM , the fast-moving hadron also has a compact longitudinal size due to Lorentz contraction. Such a reduced size quark-gluon state is called a point-like configuration (PLC). The formation length, the distance over which the PLC travels before the hadron reaches its final size can be written,
| (1) |
assuming a linear expansion in time, where is the speed of the hadron in the lab frame and is the life time of the PLC in its rest frame.
QCD predicts that the cross section for the interaction of a small dipole is proportional to in the leading order approximation, where is the transverse separation between the and the .
If the dipole remains small (pointlike) over the range of the nuclear system, the nucleus will be transparent to the produced hadron. This can be accomplished at large momentum transfers where the formation length is sufficiently large.
At finite energies, however, the mechanism for the expansion and contraction of the interacting small system is more complex. The quantum diffusion model Farrar assumes that quarks separate in the transverse direction at the speed of light and that their quark separation is proportional to , where is the longitudinal distance from the production point to the position of the particle. The formation length in this model is determined from the average value of the dominant energy denominator.
| (2) |
where and are the momentum and mass of the hadron, respectively, while is the mass of a typical intermediate state of the hadron.
The precise value for is a matter of great uncertainty Farrar ; Larson06ge with estimates between 0.25 and 1.4 GeV2.
The onset of color transparency is expected at lower energies for production of mesons, for instance of pions, than for production of baryons, because the quark-antiquark pair is more likely to form a small size object blattel .
In pion electroproduction, the coherence length, defined as the distance over which the virtual photon fluctuates into a pair, is smaller than the nucleon radius at JLab energies, and for the present experiment it is essentially constant. This removes any coherence length dependence through t-channel exchange, in which the incident electron scatters from a virtual photon bringing it on-shell. Such a coherence length dependence can mimic a CT-like energy dependence.
Color transparency has recently been put into the context of a QCD factorization theorem for longitudinally polarized photons in meson electroproduction. It predicts that for sufficiently high values of , at fixed and fixed momentum transfer to the nucleon, , the amplitude can be expressed in terms of a short-distance (hard) process, a distribution amplitude describing the final state meson, and Generalized Parton Distributions (GPDs) Collins . The latter describe the long-distance (soft) physics.
The factorization theorem has been proven at asymptotically high , but showing its validity at finite, high requires stringent tests of all necessary conditions.
The unambiguous observation of the onset of CT is a critical precondition for the validity of the factorization theorem. This is because where CT applies the outgoing meson retains a small transverse size (inter-quark distance) while soft interactions like multiple gluon exchange between the meson produced from the hard interaction and the baryon are highly suppressed. Factorization is thus rigorously not possible without CT.
III Early extractions of nuclear transparency
The first experiments designed to search for color transparency used the reaction and were performed at Brookhaven National Laboratory (BNL) Carroll ; Mardor ; Leksa . The nuclear transparency was defined as the ratio of the elastic cross section in the nucleus and hydrogen. This ratio initially increased as a function of the beam energy and then decreased, with a peak near 9 GeV. Though this behavior was not predicted by traditional nuclear physics calculations, it is currently not attributed to CT. Instead it is associated with nuclear filtering Ralston ; Pire , which is related to the suppression of the long range components in the wave function, or to the threshold for charm resonance production Stan3 .
The nuclear transparency was also measured using the A() reaction at Stanford Linear Accelerator Center (SLAC) Makins ; Neill and at Jefferson Lab Garrow ; Abbott . In this case, the nuclear transparency was defined as the ratio of the experimental yield and the one obtained from Plane Wave Impulse Approximation. The ratio was found to be energy independent from 2 GeV2 to 8.1 GeV2 for deuterium, carbon, iron, and gold targets, thus indicating no significant CT effect. The absence of the CT effect in this channel has been interpreted as an indication that the proton formation length may only have been as large as internucleonic distances, rather than the size of the nucleus in these experiments Laget .
CT measurements using coherent and incoherent production have been performed at Fermilab Adams and more recently at DESY Airape . The nuclear transparency was defined as . The results from Fermilab were parametrized with a function , and at a first glance, the observed positive slope of as a function of appeared to contradict the flat dependence predicted by the Glauber multiple scattering mechanism. However, the results have since been interpreted as a coherence length effect Acker , in which for kinematics with large coherence length, the virtual pair may undergo interactions with the nucleus before the hard interaction that puts it on-shell. The kinematics of the Fermilab experiment were not at a constant , and thus the variation of with was attributed to a reduction in the initial state interactions rather than to a reduction in final state interactions. The more recent measurements from DESY, ranging between =0.9-3 GeV2 and at constant , showed a rise in nuclear transparency with consistent with theoretical calculations of CT Airape .
The most convincing evidence for the existence of color transparency comes from an experiment performed at Fermilab Aitala . There, the cross section of diffractive dissociation of 500 GeV/ pions into dijets was measured and parametrized with =, where is the cross section in free space. The free parameter, , was fit to the data with the result 1.6. This result was in agreement with calculations assuming 100% color transparency and was very different from the normal cross section, which has a dependence =.
At low energies, hints of CT effects have also been observed from pion photoproduction from helium, , at Jefferson Lab Dutta . CT can be measured in these reactions where =0 by measuring the cross section vs. the four momentum transfer squared, to the hadron system. The data showed 2 deviations from the traditional Glauber calculations and the slope of the data vs. was in better agreement with calculations including CT.
IV Elementary pion electroproduction
IV.1 Kinematics
The kinematics of the pion electroproduction reaction studied here are shown in Figure 1. The incident electron has a three momentum of . The scattered electron has a three momentum and travels at a polar angle in the laboratory frame with respect to the direction of the incident beam. The three momentum vectors of the incoming and outgoing electron define the scattering plane. The corresponding four-momenta are and . The virtual photon carries a four-momentum , which is given by . The reaction plane is defined by the three-momentum and the three-momentum vector of the produced pion and makes an angle with respect to the scattering plane. The angle (in the lab system) between and is .
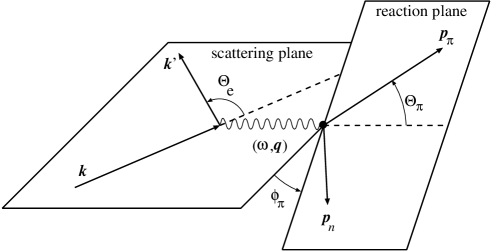
The pion electroproduction reaction can be described using three Lorentz invariants. In addition to , we use the invariant mass of the virtual photon-nucleon system, , which can be expressed as , where is the proton mass, and is the Mandelstam variable.
IV.2 Cross sections
The pion electroproduction cross section from a stationary proton in the one photon-exchange approximation is Nozawa :
| (3) |
where
| (4) |
is the virtual photon flux, where is the fine structure constant. The factor is the equivalent photon energy, and
| (5) |
is the longitudinal polarization of the virtual photon. The two-fold differential cross section for a stationary proton target can be written as
| (6) |
where the solid angle of the pion, is determined in the lab frame, and is the Jacobian for the transformation from to . The two-fold cross section can be separated into four structure functions, which correspond to the polarization states of the virtual photon, a longitudinal (L), a transverse(T), and two interference terms (LT and TT):
| (7) | |||||
The interference terms vanish in parallel kinematics () because of their dependence on sintheta .
The four structure functions can be separated if measurements at different values of and are performed (L/T separation), where and are kept constant. The photon polarization can be varied by changing the electron energy and scattering angle.
| GeV2 | GeV | GeV2 | GeV | deg | GeV | deg | GeV/ | GeV/ | |
|---|---|---|---|---|---|---|---|---|---|
| 1.10 | 2.26 | 0.050 | 4.021 | 27.76 | 1.190 | 10.61 | 2.793 | 0.23 | 0.50 |
| 2.15 | 2.21 | 0.158 | 5.012 | 28.85 | 1.730 | 13.44 | 3.187 | 0.41 | 0.56 |
| 3.00 | 2.14 | 0.289 | 5.012 | 37.77 | 1.430 | 12.74 | 3.418 | 0.56 | 0.45 |
| 3.91 | 2.26 | 0.413 | 5.767 | 40.38 | 1.423 | 11.53 | 4.077 | 0.70 | 0.39 |
| 4.69 | 2.25 | 0.527 | 5.767 | 52.67 | 1.034 | 10.63 | 4.412 | 0.79 | 0.26 |
| 2.16111low setting used for L-T separations | 2.21 | 0.164 | 4.021 | 50.76 | 0.730 | 10.60 | 3.187 | 0.42 | 0.27 |
| 4.01222low setting used for L-T separations | 2.14 | 0.441 | 5.012 | 55.88 | 0.910 | 10.55 | 3.857 | 0.71 | 0.25 |
| 2.16333test point to check the dependence on and | 1.74 | 0.374 | 4.021 | 32.32 | 1.730 | 19.99 | 2.074 | 0.65 | 0.63 |
For nuclei, where there is a new degree of freedom due to the Fermi momentum of the struck nucleon, the differential pion electroproduction cross section is given by,
| (8) |
The three-fold differential cross section, can be separated into longitudinal, transverse and interference terms just as in Eqns. 6,7.
V Experiment and Setup
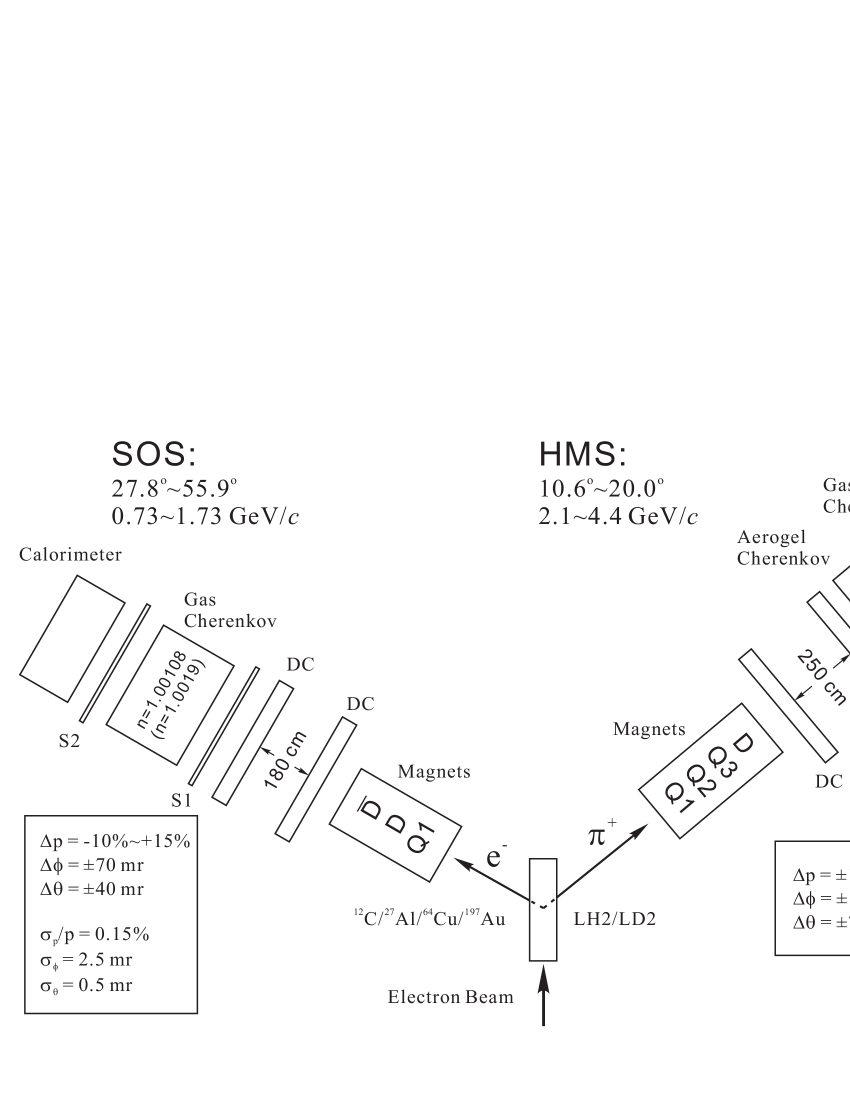
The E01-107 experiment (pionCT) was carried out in Hall C at Jefferson Lab JLab in 2004. A schematic view of the experimental setup is shown in Fig. 2 and the kinematic settings of the measurements are shown in Table 1. The continuous wave (100% duty factor) electron beam from the CEBAF accelerator has a characteristic 2 ns micro-structure that arises from the 1.5GHz rf structure of the accelerator and the 3 hall beam splitting scheme. This 2 ns structure is used in the analysis to identify () coincident events. The electron beam with energies of up to 5.8 GeV was incident on liquid hydrogen and deuterium, and solid foil targets of 12C, 27Al, 63Cu and 197Au. For the cryotargets, a 4.0 cm diameter cylindrical cell with an axis perpendicular to the beam direction was used. The cell walls were made from an aluminum alloy with a thickness of 0.01 cm. The integrated beam current (35-80 A) was measured using a pair of microwave cavities with a DC current transformer to an accuracy of 0.4%. To reduce target density fluctuations in the cryotargets arising from beam heating, the beam was rastered to a 22 mm2 profile. No target density fluctuations were measured to an accuracy of 0.6%.
The scattered electrons were detected in the short orbit spectrometer (SOS). The SOS consists of three non-superconducting magnets, one quadrupole followed by two dipoles, which share a common yoke. The quadrupole focuses in the non-dispersive direction, the first dipole bends particles with the central momentum upwards by 33∘, and the second one bends them downwards by 15∘. The SOS spectrometer design was optimized for detection of unstable and short-lived particles and thus has a flight path of only 10 m. The electroproduced pions were detected in the high momentum spectrometer (HMS). The HMS consists of three superconducting quadrupole magnets followed by a momentum analyzing vertical-bend superconducting dipole used in a point-to-point tune for the central ray. The detector package is mounted near the focal plane of the optical system, which is located inside a concrete shield house. The HMS has a 26 m pathlength and a maximum central momentum of 7.3 GeV/ A detailed description of the spectrometers and the spectrometer hardware is given in arr98 ; dutta03 . Selected properties of the two spectrometers are listed in Table 2.
| Quantity | HMS | SOS |
|---|---|---|
| Max. Central Mom. | 7.3 GeV/444To date, the HMS has been operated to 6.0 GeV/ | 1.74 GeV/ |
| Optical Length | 26.0 m | 7.4 m |
| Momentum Acceptance | 10% | 20% |
| Solid Angle555The solid angle and angular acceptances are given for the large collimators in both the HMS and SOS spectrometers. | 6.7 msr | 7.5 msr |
| In-Plane Ang. Acc.a | 27.5 mrad | 57.5 mrad |
| Out-of-Plane Ang. Acc.a | 70 mrad | 37.5 mrad |
Both spectrometers are equipped with multiwire drift chambers for particle tracking, and segmented scintillator hodoscope arrays for time-of-flight measurements and triggering.
The HMS has a gas Čerenkov and a lead glass calorimeter in the detector stack for / separation. For this experiment, the Čerenkov was filled with gas at 97 kPa. The corresponding index of refraction is 1.00137 resulting in momentum thresholds of 2.65 GeV/ for and 9.4 GeV/ for . An aerogel Čerenkov detector aero was also used in the detector stack. It was used to identify for central momentum settings below 3.1 GeV/c. The aerogel had an index of refraction of 1.015 giving thresholds of 0.8 GeV/ for pions and 2.85 GeV/ for kaons.
The SOS has a combination of a gas Čerenkov and a lead-glass calorimeter for separation. The nominal SOS Čerenkov detector is filled with gas at 101 kPa with an index of refraction of 1.00108. During part of the experiment ( =5.767 GeV) the nominal SOS Čerenkov detector was replaced by one filled with gas at 143 kPa with an index of refraction of 1.0019. The corresponding thresholds for electrons were below 10 MeV/ and those for pions were 3 GeV/ (nominal) or 2.27 GeV/ (new).
VI Data Analysis
The raw data were processed and combined with additional information from the experiment like momentum and angle settings of the spectrometers, detector positions, and beam energy to give the particle trajectories, momenta, velocities, energy deposition, and to perform particle identification.
VI.1 Event Reconstruction
The spectrometer quantities , , and , were deduced from reconstruction of the wire chamber data. These quantities are the vertical and horizontal positions of the track at the midpoint between the wire chambers, and the gradients of that track with respect to the spectrometer central ray. The target quantities , , and were determined from the spectrometer quantities by suitable transformation functions. These quantities are the horizontal position of the event, the horizontal and vertical gradients of the track with respect to the spectrometer central ray and the momentum of the particle given as a percentage above the central momentum setting of the spectrometer, respectively. A special data set, using a series of foils targets placed at well determined positions in the target region was taken to calibrate the transformation matrix.
VI.2 Particle Identification and event selection
Electrons were selected with a SOS gas Čerenkov cut of Nphotoelectrons 1.0 for the nominal or Nphotoelectrons 5.0 for the new detector. The efficiency of the cut was determined, for each of the SOS central momentum settings, using a sample of electrons that was identified using the lead-glass calorimeter. The resulting efficiency was always higher than 99.2% with an uncertainty of 0.2%. The pion rejection ratio was 100:1 for the nominal and 300:1 for the new detector. In the HMS, the aerogel and gas Čerenkov detectors were used to select . The aerogel was used for additional particle identification when the central momentum setting of the HMS, , was less than 3.2 GeV/. The lower limit of the aerogel efficiency was determined using tight cuts on the coincidence time, and was found to be 98.8 0.5% for a threshold cut of N0.7. The rejection ratio for the HMS Aerogel Čerenkov detector was approximately 5:1 at = 2.1 and 2.8 GeV/. A cut on the gas Čerenkov detector varying between N0.7 and N2.0 was used when GeV/. The corresponding cut efficiencies were determined using tight cuts on the coincidence time and the aerogel Čerenkov detector to remove protons, and were found to be 98.20.5% The cut efficiency was parametrized as a function of the HMS fractional momentum, to take into account that pions at negative are closer to the momentum threshold of the detector compared to those at positive . The resulting rejection ratio was 50:1 at =3.2 GeV/c and 300:1 at = 4.4 GeV/c with an uncertainty of 0.2%.
VI.3 Efficiencies
The raw yield was normalized by the beam charge, and the data were corrected for detector efficiencies, computer dead time, correction to target thickness and nuclear absorption in the detection materials.
VI.3.1 Tracking efficiency
The tracking efficiency is the probability of finding a track from experimental signals from the wire chambers when a charged particle passes through them. It depends on the efficiency of the wire chambers and also on the algorithm used to construct a track for a given event. The tracking efficiency was 92% for the HMS and 96% for the SOS, and was calculated run-by-run for this experiment. The uncertainties to the tracking efficiencies are estimated from the stability of the tracking efficiency as a function of the total rate in the spectrometer, and were found to be 1.0 % for the HMS and 0.5% for the SOS. The rate dependence of the tracking efficiency, which is related to the increased probability to have multiple tracks at high rates was taken into account with a tracking efficiency calculation including multiple track events pionfflong ; vladis .
VI.3.2 Trigger Efficiency
The HMS and the SOS spectrometers each contain four layers of scintillators and a requirement for a single-arm trigger is that 3 out of 4 layers must have a hit. The 3-out-of-4 efficiency was found to be above 99.5% for all runs in both spectrometers with an uncertainty of 0.5% for the HMS and 0.5% for the SOS.
VI.3.3 Computer and Electronics dead times
The computer dead time, which are due to the finite time required by the computers to process an event, can be directly calculated from the number of generated pretriggers and the number of accepted triggers. The computer dead time during the pionCT experiment was about 25%. The electronics dead time, due to the finite time required by the electronic modules was estimated from copies of the original pretrigger signal at varying gate widths. The correction due to electronics dead time was less than 1%. The total uncertainty (0.2-0.5%) due to the dead time corrections was dominated by the computer dead time.
VI.3.4 Coincidence Blocking
Coincidence events can be blocked when a non-coincident event arrives in one of the spectrometers just before the coincident event. The “coincidence blocking” events are lost from the data due to the coincidence time cuts in the analysis. The coincidence blocking correction was estimated from the rate dependence of the number of blocked events, and was found to be less than 0.7% with an uncertainty of about 0.2%.
VI.3.5 Pion Absorption
Pions may interact through the strong nuclear force with the nucleus, for instance in the target material, the window of the scattering chamber, or the windows of the spectrometer. These events are lost before reaching the detectors in the HMS detector hut. We account for these events by correcting for pion absorption in the HMS. The transmission for pions in the HMS is about 95% pionfflong and depends weakly on the pion momentum between 2.1 and 4.4 GeV/c. In addition some pions interact with the scintillator material producing events that reconstruct at lower pion velocity () or even and lower coincidence time. Using a 2-dimensional cut on and coincidence time, such events were included in our pion yield. The efficiency of such a cut was studied using tanyathesis and tanyathesis ; derekthesis data. The difference between the 2-dimensional cut and a simple cut on pion velocity that does not include the pion with lower velocity and the 0 events was found to be within the uncertainty associated with the HMS detector efficiency and the uncertainty of the pion absorption correction. The uncertainty in the pion absorption correction was estimated from the difference between the calculated pion transmission and the measured proton transmission, and was found to be 2% in the absolute cross section determination blok08 ; pionfflong . The difference in target thickness leads to an additional dependent uncertainty which is estimated to be 0.5%.
VI.3.6 Backgrounds
The coincidence time was calculated from the time difference between the SOS and HMS triggers, and was used to help identify / coincidences from / coincidences. Corrections to the coincidence time include the path length of the tracks through the magnetic elements of the spectrometer, difference in signal propagation times in cables, pulse height corrections for the signals from the scintillators, and subtraction of the time required for the light to travel in the scintillators from the event position to the PMT. Random coincidences, resulting from an electron and pion from different beam buckets, have a coincidence time that is offset from the in-time by multiples of 2 ns. The in-time / events were selected with a cut on the coincidence time around the central peak. The random background was estimated by averaging over three bunches, that could be readily identified by eye, to the right and three bunches to the left of the in-time peak, and then subtracting it from the in-time yield.
Background from the cryotarget cell walls, less than a few percent, was measured and subtracted using an aluminum target of approximately seven times the thickness of the target cell walls. The contribution of the cell walls was small (less than 5%), and due to the high statistical accuracy of the dummy target data, the contribution of the subtraction was 0.1% to the total uncertainty.
VI.3.7 Missing mass
Once true / coincidences are identified, the missing mass of the recoiling nucleon system was reconstructed from the measured quantities. In the present analysis, a cut in the missing mass was used to ensure that no additional pions were produced in the case of hydrogen, and to minimize the contribution of multi-pion events to less than 5% with an uncertainty of 0.4% (see section VII.1.4 for a more detailed discussion).
VII Determination of the nuclear transparency
To extract cross section information from the data, the measured yields were compared to the results of a Monte Carlo simulation for the actual experimental setup (see section VII.1), which included a realistic model of the pion electroproduction cross section. When the model describes the dependence on , , , and () of the four structure function in equation 7 well, the cross section for any value of and in the acceptance can be determined as
| (9) |
where is the yield over and . The term “data” refers to the measured experimental yield, and the term “mc” refers to the simulated events and yield.
To extract the nuclear transparency, which is defined as the ratio of cross sections extracted from data and from a model of pion electroproduction from the nucleus without final state interactions, simulations were performed as described in the next section.
VII.1 Monte Carlo Simulation
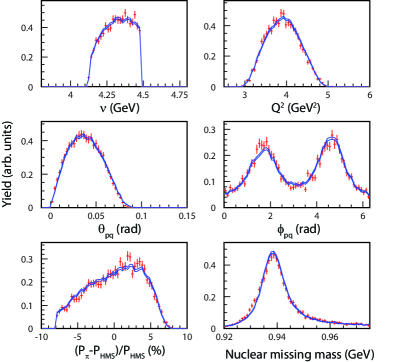
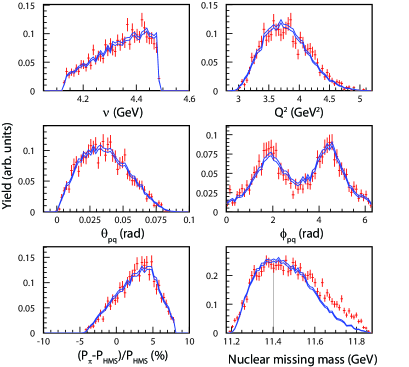
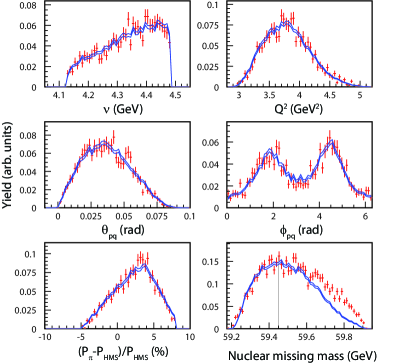
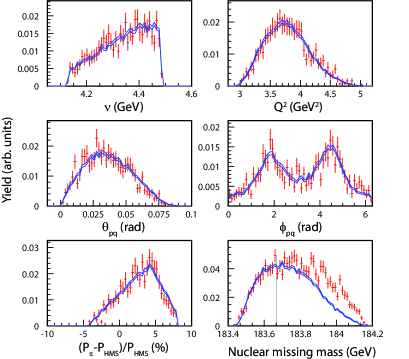
The standard Monte Carlo simulation code for Hall C, SIMC, was used to simulate the experiment. Events were generated in a phase space marginally larger than the acceptance of the spectrometers. After events were generated at the vertex, they were transported through the spectrometer optics using COSY matrix elements determined from a COSY INFINITY cosy model of the spectrometers. Each event was weighted by the relevant model cross section (see section VII.1.2). A comparison between experimental and simulated distributions of reconstructed quantities for a hydrogen target are shown in Fig. 3. If the detector setup and the spectrometer acceptances (including coincidence acceptance) is realistically modeled in a simulation, the boundaries of the distributions should match. Differences in magnitude can be attributed to differences between the actual cross section and the one used in the model.
To describe electroproduction from nuclear targets the quasi-free approximation was used, since the energy of the incoming electron is large compared to the energy associated with the binding of the nucleons. Properties of the nucleons inside the nucleus are assumed to be described by an independent particle shell model, where each nucleon interacts with a mean field exerted by the other nucleons. The probability of finding a nucleon with momentum , and separation energy , in the nucleus is given by a spectral function, . Existing spectral functions were used for deuterium, carbon, gold Makins ; Neill , and aluminum Quint . The copper spectral function was constructed from the iron spectral function described in Ref. Makinsth by increasing the number of protons in the outermost 1 shell from 6 to 9 and changing the central binding energy of this shell using the separation energy for copper. The spectral functions did not include any corrections to account for shifts in their strength to large missing momentum caused by nucleon-nucleon correlations.
Although the momentum of the proton is given by , is not constrained by any of the assumptions in the quasi-free approximation. In the present analysis, the off-shellness was described by,
| (10) |
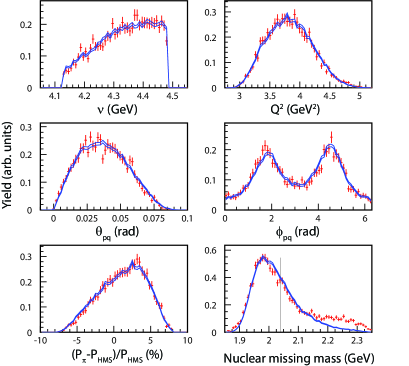
where is the nuclear missing mass, is the mass of the nucleon, is the mass of the spectator nucleons, and is the energy of the struck proton. A comparison between experimental and simulated distributions of reconstructed quantities for nuclear targets is shown in in Figures 4, 5, 6, and 7.
The radiative corrections used in this analysis are based on the formalism of Ref. Mo , which was explicitly modified and improved for () coincidence reactions in Ref. ent . It includes both external and internal radiation. The formalism was further modified for pion electroproduction, where the target particle is assumed to be a stationary proton, while the final pion is assumed to be off-shell. The assumption of off-shellness was tested in the simulation and was found to change the Monte Carlo yield by at most 0.5%. The largest source of uncertainty in the simulation of radiative processes comes from radiation due to the pion as the electron radiation is relatively well known. The simulated yield changed by 2-4% when radiation from the pion was turned off depending on and . For the present analysis. we assume a global uncertainty due to radiative correction of 2%. The uncorrelated uncertainty in the radiative corrections was estimated from the target dependence of the simulated yield when the pion radiation was turned off, and was found to be 1% at low and 2% at high .
SIMC incorporates the effects of the pion decay, multiple scattering and energy loss. For the present analysis, 2.5% (1.4%) of pion decays occur inside a magnet at the lowest (highest) setting. The random uncertainty is about 0.5% and mainly accounts for muons coming from pions normally outside the acceptance. The difference between targets is smaller than 0.1%. The Monte Carlo also takes into account pions which punched through the spectrometer collimators. The simulation is based on the calculation of the pion transmission through materials described in Ref. blok08 .
For the present analysis, SIMC was modified to take into account the effect of Pauli blocking. This correction which is determined using the distribution function calculated by Fantoni and Pandharipande Fantomi is applied as a weight to each event.
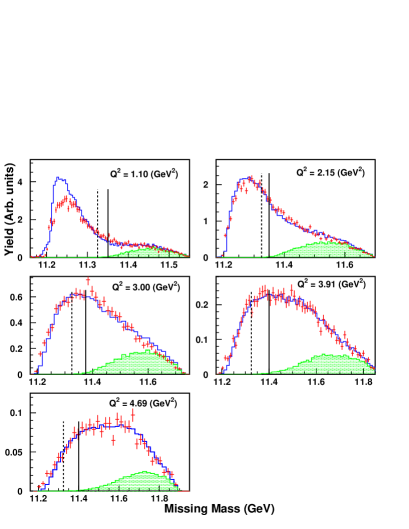
The final state interactions between the knocked-out neutron and the residual nucleons (n-N FSI) can effect the quasi-free cross section and can shift strength in the missing mass spectrum near the single pion production threshold. It is likely to have the strongest effect when the relative momentum between the recoiling neutron and the spectator nucleons is small. An earlier experiment on light nuclei at JLab has shown that the effect of n-N FSI on the quasi-free cross-section reduces with increasing gaskellth . Since this experiment was conducted at relatively high the n-N FSI was not explicitly accounted for in the simulation. One can account for a fraction of the shift in strength in the missing mass spectrum caused by n-N FSI, by setting the missing energy = 0, when calculating the energy of the proton. However, the lack of full accounting of the n-N FSI is most likely to be the cause of the discrepancy in the shape of the missing mass spectrum at the lowest = 1.1 setting, seen in Fig. 8 and 9.
Coulomb corrections to the incoming and scattered electron are applied according to the Effective Momentum Approximation (EMA) approach Aste . This approach includes an improvement over earlier versions of the EMA, using an average potential to account for the focusing of the incoming electron wave function Aste . No Coulomb corrections were applied to hydrogen and deuterium, since this effect is already included in the elementary pion cross section. The corrections for the copper target ranges between 0.2-2%, while the yield correction for the gold target ranges between 0.9-4.4%. We assume that 25% of this correction contributes to the uncorrelated uncertainty.
VII.1.1 Detector acceptances in SIMC
The acceptances for both spectrometers used in this analysis are within the previously determined safe boundaries blok08 . The phase space was studied by comparing distributions for reconstructed quantities like , , and missing mass as shown in Figure 3.
The acceptance uncertainties were estimated using the over constrained H() reaction. These uncertainties arise from the uncertainty in the knowledge of the momentum and angle setting of the spectrometers and the beam energy. The point-to-point yield variation was found to be 1% for different values.
VII.1.2 The model cross section
The Monte Carlo was used to extract the bin-centered experimental cross section by iterating the model cross section until Monte Carlo distributions matched the data. The starting model was based on the previous pion electroproduction data from Hall C blok08 . The model cross section was taken as the product of a global function describing the -dependence times (a sum of) and and dependent functions for the different structure functions. A correction function, which was assumed to factorize,
| (11) |
was determined by iterating the model and comparing it to the hydrogen elementary cross section. These correction functions were assumed to be second order polynomials, with the exception of , which was assumed to be of third order.
VII.1.3 Iteration procedure
For the hydrogen target the bin centered experimental cross section is given by
| (12) |
For nuclear targets, the bin centered experimental cross section is given by
| (13) |
where the subscript, , indicates that the cross section is evaluated at a particular point inside the acceptance. The model cross sections for hydrogen and for the nuclear targets were determined using a point Monte Carlo simulation, which was performed using scattered electron kinematics and pion angles generated randomly within a very narrow phase space volume that corresponds to , and . For nuclear targets, is generated over the whole phase space from which a narrow range was selected in the analysis.
The extracted cross sections depend on the initial cross section model, and thus there are systematic uncertainties associated with it. This uncertainty is obtained by extracting the cross section using a different starting model and was found to be 1.1%. However, this uncertainty will not contribute to nuclear transparency, since nuclear transparency involves the ratio of two Monte Carlo yields.
VII.1.4 Multi pion production in nuclear targets
The quasi-free pion production model is limited to single pion production. The production of more than one pion in a single event (multiple pion production) was suppressed for hydrogen targets during the pionCT experiment due to the relatively high 1 GeV2 and 2.1 GeV being above the resonance region. This suggests that the mechanism for multiple-pion production involves the outgoing pion producing one or more pions from a nucleon in a second process that was incoherent from the production of the first pion. Multiple-pion events can only be produced above a missing mass threshold that is larger than the missing mass threshold for single-pion production, i.e., for a nucleus of mass . Indeed, in the analysis, at first a missing mass cut exactly corresponding to this threshold was used to suppress multiple-pion events. However, this cut resulted in an unacceptable loss of statistics at the highest settings, and thus an alternative cut on the nuclear missing mass above the multi-pion threshold were used.
In order to describe events above the two pion threshold, a multiple-pion production simulation was developed for the present nuclear target analysis. The mechanism for multiple-pion production was assumed to be quasi-free single-pion production from a nucleon followed by a secondary process that was incoherent from the first, where the pion produces one or more pions from a different nucleon. The cross section for the second process was assumed to be uniform over the acceptance of the HMS spectrometer.
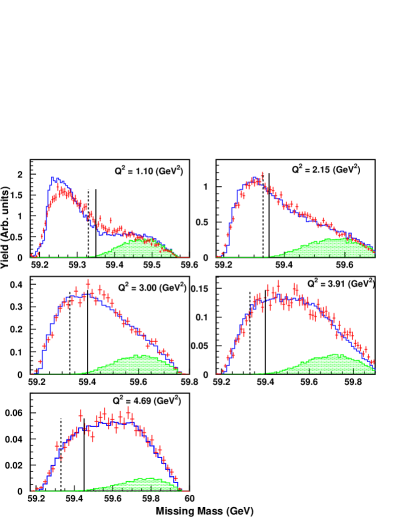
The effect of multi-pion production can be seen in Fig. 8 and 9 for the carbon and copper targets. The agreement between the missing mass distributions obtained from data and simulation improves with increasing . The discrepancy seen at = 1.1 is attributed to the reaction mechanisms missing from the simulation such as final state interactions between the knocked-out neutron and the residual nucleons (nN-FSI) and short range correlations. The effect of these reaction mechanisms reduces with increasing .
These results show that it is safe to increase the double-pion missing mass cut above the threshold with minimal contamination. The double-pion missing mass cut was placed at the position where the systematic uncertainty from the contribution of multiple-pion events was less than 5%. With these cuts, the total uncertainty due to multi-pion contamination is 0.4%. We also noted an interesting smooth dependence in the ratio of the multiple-pion to single-pion yields.
VII.1.5 Test of the quasi-free assumption
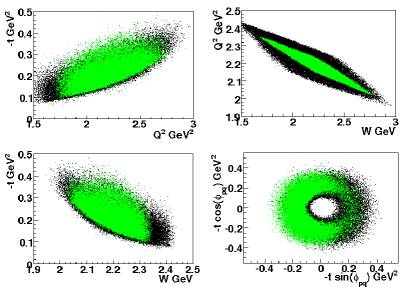
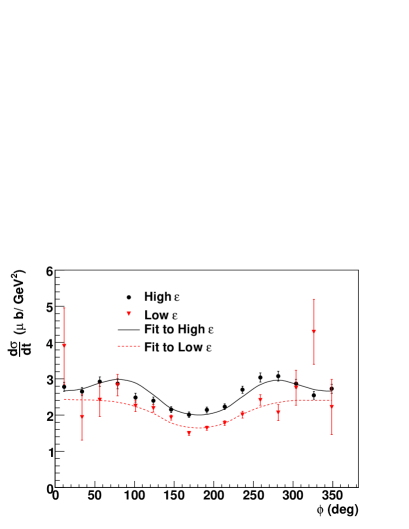
The average cross sections were extracted by integrating over the whole acceptance (, and ). This averaging reduces the systematic uncertainties related to the cross section model in the Monte Carlo by smearing the exact kinematic information of the extracted cross section. We bin the data in by integrating over all other kinematic variables at each setting. The azimuthal angular coverage for the hydrogen target at = 2.15 GeV2 can be found in Fig. 10. Due to the correlation in the kinematics, the central , and values for each bin are different from those obtained by integrating over the entire region. Thus, a Monte Carlo simulation with model cross sections is used to account for the correction between the cross section evaluates at the center of each bin and the one for the entire region. The four structure functions in equation 7 are extracted by fitting the data with respect to for both high and low settings simultaneously. A representative fit for the hydrogen target at = 2.15 GeV2 can be found in Fig. 11. In the analysis, an additional acceptance cut is used to ensure that the kinematic region given by , and is the same at high and low . Such a phase space comparison is shown in Fig. 10.
| Item | Uncorrelated uncertainty | dependent | Correlated uncertainty |
|---|---|---|---|
| () | () | () | |
| HMS Čerenkov | 0.2 | 0.3-0.5 | |
| SOS Čerenkov | 0.2 | 0.3-0.5 | |
| Charge | 0.4-0.9 | 0.4 | |
| Coincidence blocking | 0.2 | ||
| HMS Trigger | 0.5 | ||
| Dead time | 0.2-0.5 | ||
| HMS Tracking | 1.0 | 1.0 | |
| SOS Trigger | 0.5 | ||
| SOS Tracking | 0.5 | 0.5 | |
| Pion decay | 0.1 | 1.0 | |
| Coulomb corrections | 1.0 | ||
| Radiative corrections | 1.0-2.0 | 2.0 | |
| Collimator | 0.5 | 1.0 | |
| Acceptance | 1.0 | 2.0 | |
| Iteration procedure | 1.1 | ||
| Multi-pion contamination | 0.4 | ||
| Target thickness | 0.5 - 1.0 | ||
| Pion absorption | 0.5 | 2.0 | |
| Total | 2.4-3.4 | 0.7-1.1 | 3.9-4.0 |
| model dependence | 3.5-7.6 |
| Item | Uncertainty in | Uncertainty in |
|---|---|---|
| Differential cross section | L-T cross section ratio | |
| () | () | |
| HMS Čerenkov | 0.4-0.5 | |
| SOS Čerenkov | 0.4-0.5 | |
| Charge | 0.6-1.0 | |
| Coincidence blocking | 0.2 | |
| HMS Trigger | 0.3-0.5 | |
| Dead time | 0.2-0.5 | |
| HMS Tracking | 1.1-1.4 | |
| SOS Trigger | 0.3 | |
| SOS Tracking | 0.5 | |
| Pion decay | 1.0 | |
| Coulomb corrections | 1.0 | |
| Radiative corrections | 2.2-2.8 | |
| Collimator | 1.1 | |
| Acceptance | 2.2 | |
| Iteration procedure | 1.3 - 1.5 | 13.0-18.0 |
| Multi-pion contamination | 0.4 | |
| Target thickness | 0.5-1.0 | |
| Pion absorption | 2.1 | |
| Kinematics | 1.5-2.0 | 3.0-16.6 |
| momentum coverage | 12.0 | |
| Total | 4.8-5.7 |
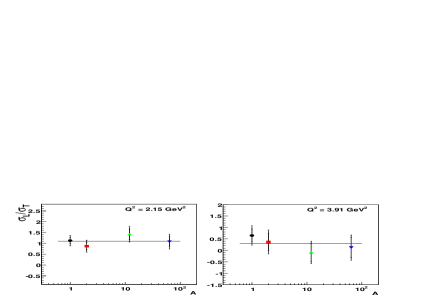
The same fitting procedure described above could be used to obtain the Rosenbluth-separated pion electroproduction cross sections. However, where this separation is relatively straightforward for hydrogen targets, a similar separation for nuclear targets relies on the assumed quasi-free reaction mechanism. This is because beyond the , and dependence, the elementary off-shell pion electroproduction cross section has a dependence in the nuclear medium. Hence the input model for elementary pion electroproduction needs to starting value for the dependence. This quasi-free -dependence is taken into account in the Monte Carlo simulations for the nuclear targets, and the iterative procedure described earlier is followed. This implies that the extracted nuclear cross sections represent the averaged values integrated over a wide kinematic acceptance, rather than the bin centered value. These averaged cross sections are used to obtain the longitudinal to transverse ratio between nuclear and hydrogen targets. The ratio of longitudinal to transverse cross sections at fixed = 2.15 and 3.91 GeV2 for the various targets used in this experiment are shown in Fig. 12. We find no difference, within the experimental uncertainties, between the ratio of longitudinal to transverse cross sections for nuclear and hydrogen targets, this can be viewed as a confirmation of the quasi-free reaction reaction mechanism.
VIII Uncertainty estimates
Table 3 lists the systematic uncertainties in extracting the nuclear transparency. Several sources of these uncertainties have already been discussed in sections VII.1.1-VII.1.4.
The uncertainty in the acceptance is based on extensive single-arm elastic and deep-inelastic measurements from chr04 ; tva04 , and 1H() data, including sieve-slit data on a carbon target, taken to check the optical matrix elements. The influence of the uncertainties in the offsets in the kinematical variables such as beam energy, momenta and angles, were determined by changing their values by their uncertainty and evaluating the resultant changes in the cross sections.


The uncertainty in the target thickness for the solid targets is dominated by the knowledge of their purities and the thicknesses. For the 4 cm liquid targets, the uncertainty is dominated by the target boiling correction and the beam path length since the beam did not pass through the axis of the liquid target cylinder. The uncertainty in the total charge includes a 0.4% uncertainty due to calibration of the beam current monitors.
The largest correlated systematic uncertainties are radiative corrections, and acceptance, resulting in a total correlated uncertainty of 3.9-4.0%. The uncorrelated systematic uncertainty is dominated by contributions from the acceptance, radiative corrections and the iteration procedure, resulting in a total uncorrelated uncertainty of 2.4 - 3.4%. The largest contribution to the “ dependent” uncertainty is the target thickness, resulting in a total uncertainty of 0.7 to 1.1%.
The largest source of uncertainty in the radiative correction procedure comes from pion radiation as the electron radiation is relatively well known. The Monte Carlo equivalent yields changed by 2-4% when pion radiation was turned off (2% at low and 4% for the heavy targets at high ). From this the normalization uncertainty was taken to be 2%. The point-to-point uncertainty in the radiative corrections was estimated from the target dependence of the Monte Carlo equivalent yield when the pion radiation was turned off. This was 1% at the low and 2% at high .
In addition to these uncertainties, a dependent model uncertainty was also determined to be 3.5% -7.6%. This uncertainty is the quadrature sum of the change in dependence of the transparency when using two different spectral functions and two different Fermi distributions in the simulation, and the dependent uncertainty from reactions mechanisms not included in the simulation. The uncertainty from the reaction mechanisms not included in the simulation were estimated by quantifying the difference in shape of the missing-mass spectra from data and simulation.
Table 4 lists the systematic uncertainties in extracting the unseparated cross sections and the uncertainty in extracting the ratio of longitudinal to transverse cross section. These were obtained using the quadrature sum of the correlated, uncorrelated and dependent uncertainties along with two additional sources of uncertainty labeled as “Kinematics” and “momentum coverage.” The “Kinematics” part represents the uncertainties in the knowledge of spectrometer angles and momentum setting. It will not contribute to the nuclear transparency, since the spectrometer settings are exactly the same for different targets. The “momentum coverage” part represents the effect of the wider momentum cut (in order to obtain enough statistics in the low region) used in the Rosenbluth separation than the extraction of nuclear transparency.
IX Results and Discussion
The differential cross sections for hydrogen are shown in Fig. 13 and those for all four nuclear targets (deuterium, carbon, copper and gold) are shown in Fig. 14. All numerical values are tabulated in Appendix A and B. In the following sections, the global dependencies of the hydrogen and nuclear cross sections will be reviewed and the data compared to recent model calculations. The results of the quasi-free reaction mechanism test and the extracted nuclear transparencies are also shown.
IX.1 Global dependencies and model comparison for hydrogen
For the different values of , the differential cross section shows the characteristic fall-off with , which may be due to the pion pole in . The magnitude of the cross section decreases at constant and with increasing , mostly because the value of increases with . In Fig. 13 (bottom right panel) we show the differential cross section vs pion lab momentum (). In this plot each point at a particular , represents the differential cross section averaged over the range shown in the one of the other panels of Fig. 13 that corresponds to the values at that (see Table 1).
The cross sections are compared to predictions of two different models of pion electroproduction, the VGL-Regge model VGL , and the more recent “KGM” model Mosel . The VGL-Regge calculations are in a gauge invariant model incorporating and Regge trajectory exchanges. They significantly underestimate the measured differential cross sections. Most of the discrepancy can likely be attributed to the model underestimating the transverse part of the cross section as shown in Ref. Hornt , while they agree well with . The recent KGM model Mosel , which includes a deep-inelastic scattering (DIS) Ansatz for the transverse part of the cross section, with the longitudinal cross section dominated by hadronic degrees of freedom and the pion electromagnetic form factor, agrees much better with the measured differential cross sections.
IX.2 Global dependencies for nuclear targets
We have extracted the differential cross sections for all four nuclear targets (deuterium, carbon, copper and gold) at the eight different kinematics settings given in Table I. Here, the additional complication introduced due to the added degree of freedom induced by the Fermi-motion (or more general, the nuclear binding) of the struck proton is taken into account by extracting the doubly-differential cross sections , where is the pion momentum in the center-of-mass frame of the virtual photon and the nucleus.
The local variations in the nuclear cross sections as illustrated in Fig. 14 indicate effects due to Fermi motion beyond the central kinematics. These local variations are more pronounced for the deuterium target, because of its narrower Fermi cone. Although the general trend of the nuclear cross section is similar to that of the hydrogen cross section, the fall-off of the nuclear cross sections with is steeper than that found for the hydrogen cross sections.
IX.3 Verification of the quasi-free mechanism
A prerequisite for an interpretation of nuclear transparency as a function of is that the reaction mechanism remains identical over the range. This translates into an important condition in searching for CT using pion electroproduction: the reaction should proceed through a quasi-free mechanism.
There are many mechanisms that could break down the quasi-free assumption, such as:
-
•
Nucleon-nucleon () final-state interactions The amplitude of final-state interactions can interfere with the elementary electro-pion production amplitude, which can change the ratio of the longitudinal and the transverse cross section. For example, the disagreement between the missing mass spectra from data and simulation at = 1.1 (GeV)2 (Figs.8 and 9) is expected to be due to such effects, and other potential reaction mechanism effects not included in the Monte Carlo model. The agreement between data and Monte Carlo at higher values of , however, suggests only a small contribution from such final-state interaction complications.
-
•
Rescattering Rescattering involves the electro-production of a meson followed by a second interaction that produces the detected particle. For example, such rescattering contributions have been shown to dominate the cross section in photo-production for 0.5 (GeV)2 clasrho . In principle, if the rescattering effect dominates, one would expect a modification of both the longitudinal to the transverse cross section ratio, and the cross section dependence on .
-
•
Pion excess Excess pions may be present in a nuclear system due to the long range of meson-exchange currents Friman . If such pion excess effects are significant, one would anticipate a change in the ratio of the measured nuclear cross sections as compered to the hydrogen cross sections. An earlier experiment on light nuclei at low did not find any pion excess gaskell .
-
•
Medium modification of nucleons The European-Muon Collaboration (EMC) discovered EMC that the structure functions for deep inelastic inclusive lepton scattering off nuclear targets differed from deuteron targets. Although the effect remains poorly understood, it is generally accepted that nucleon structure will be modified within a nuclear medium, both due to nuclear binding and to non-nucleonic QCD effects. Such a medium modification of nucleons could also impact the nuclear pion electro-production cross sections, but is generally expected to also lead to a change in the ratio of longitudinal and transverse pion electro-production cross sections, .
-
•
Two-nucleon correlations A series of A() measurements revealed that spectroscopic factors for proton valence shells were quenched by approximately 30-35 as compared to mean-field expectations Frois ; Lapikas . A possible explanation for this discrepancy is that correlations move some of the single-particle strength to orbitals above the Fermi energy. This kind of correlation will change the nucleus spectral function, and thus break down the quasi-free assumption.
The most straightforward verification of the quasi-free mechanism is the equivalence of the longitudinal-transverse character for pion electroproduction from nuclear and hydrogen targets. The ratio of longitudinal to transverse cross sections should, for instance, be independent of the nuclear atomic number . The ratio of longitudinal to transverse cross sections at fixed = 2.15 and 3.91 GeV2 for the various targets in this experiment are shown in Fig. 12.
The -dependence of the ratio agrees with a flat line fit within the experimental uncertainties, and are thus consistent with the quasi-free assumption. However, they cannot rule out non quasi-free reaction mechanism effects that affect the longitudinal and transverse character of pion electroproduction in a similar fashion, for instance, final-state interaction, rescattering, pion excess, or medium modification effects. Note that we have intentionally kept the value of of the measurements low ( 0.5 GeV) to minimize complications due to rescattering or two-nucleon effects. Together with the overall good agreement of data and Monte Carlo simulations (beyond = 1.1 GeV2), we have gained confidence in the validity of the quasi-free reaction mechanism.
IX.4 Nuclear Transparencies
As mentioned earlier, nuclear transparency is defined as the ratio of the cross section per nucleon for a process on a bound nucleon inside a nucleus to that from a free nucleon. The dependence of the nuclear transparencies is shown in Fig. 15. Results are shown for deuterium and carbon (top left), copper (bottom left) and gold (bottom right) and aluminum (top right), which was also used for determining the cell wall background contribution for cryogenic targets.
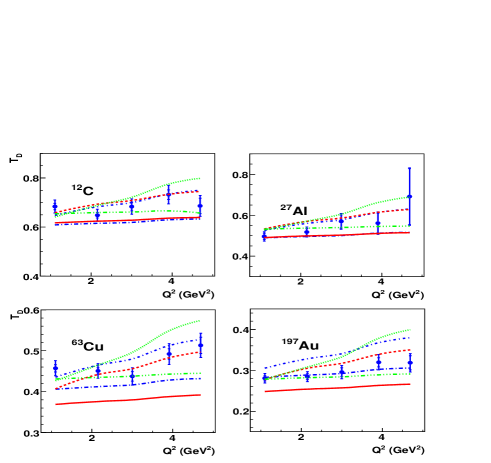
Before we discuss the various model calculations, we first redefine the nuclear transparency () as the cross sections of heavy nuclear targets as compared to those of a deuterium target. This reduces the uncertainty due to both the unknown elementary pionelectroproduction off a neutron and effects due to the procedure to take into account Fermi motion. The results are shown in Fig. 16, where we present the data versus rather than pion momentum Pπ. Of course, the results are not too different, as could be anticipated from the nuclear transparency results of deuterium to be close to unity, as can be seen in top left panel of Fig. 15. We note in addition that the deuteron nuclear transparency results are found to be consistent with a constant-line fit with 81% probability. The nuclear transparency results are listed in Appendix C.
The nuclear transparencies are expected to be near-constants over the pion momentum range of the experiment from traditional nuclear physics point of view glauber , because the hadron-nucleon cross sections are nearly independent of momentum over the range of momenta in Figs. 15 and 16. Instead, the observed pion nuclear transparency results (as compared both to hydrogen and deuterium cross sections) shows a slow but steady rise versus pion momentum for the nuclear ( 2) targets, causing a deviation from calculations without CT.
IX.5 Comparison with model calculations
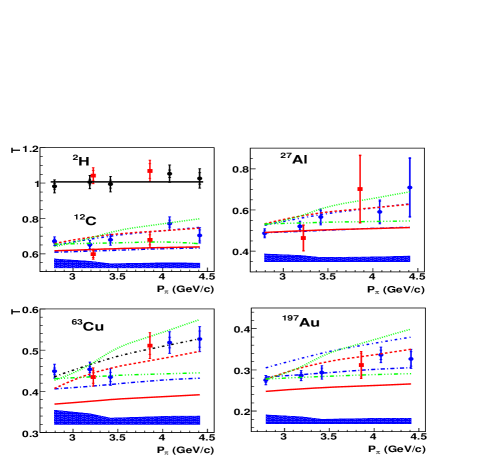
We compare our results with the calculations of Larson, et al. Larson06ge (solid and dashed curves), Cosyn, et al. Cosyn (dot-short dash and dot-long dash curves) and Kaskulov, et al. mosel2 (dotted and dot-dot-dash).
Larson, et al. compute the nuclear transparency at the exact kinematics of the experiment in terms of semi-classical formula based on the eikonal approximation and a parametrization of the effects of final state interactions (FSI) in terms of an effective interaction. This semi-classical formula involves a single integral over the path of the outgoing pion which is suited for situations in which the kinematics of the final pion are known. The nuclear density is taken as a Woods-Saxon form with radius parameter fm and diffuseness fm. The effective interaction is based on the quantum diffusion model of Ref. Farrar , which predicts the interaction of the PLC to be approximately proportional to the propagation distance for The coherence length (or formation length) is parametrized as described earlier in section II. Larson, Miller and Strikman use the following parameters; = 1 fm/c and = 0.7 (GeV/c2)2. In the limit of a PLC is not created and the effective interaction reduces to a Glauber-type calculation with , the cross section for pion momentum obtained from a parametrization by the Particle Data Group (PDG) PDGP .
On the other hand, Cosyn et al. calculate the nuclear transparency as a ratio of the eight fold differential cross section for pion electroproduction in a relativistic multiple-scattering Glauber approximation (RMSGA) integrated over the kinematic range of the experiment to that in a relativistic plane wave impulse approximation (RPWIA). In the RPWIA all particles are taken to be relativistic plane waves, while in the RMSGA, the wave function of the spectator nucleon and the outgoing pion is taken to be a convolution of a relativistic plane wave and a Glauber-type eikonal phase operator that parametrizes the effects of FSI. The parametrization chosen by these authors reflect the diffractive nature of nucleon-nucleon () and pion-nucleon () collisions at intermediate energies. The parameters (total cross section, with as the outgoing pion or nucleon), (slope parameter), and (ratio of real to imaginary part of the scattering amplitude) were obtained by fits to the databases from the PDG PDGP , for . For , the parameters were obtained from fits to PDG PDGP databases, SAID said and Ref. slope . For outgoing nucleons with kinetic energy lower than 300 MeV, the Glauber formalism is no longer applicable and the FSI were parametrized in a relativistic optical model eikonal approximation (ROMEA) romea , with the global (S-V) optical model parametrization of Cooper et al. cooper . CT was incorporated by replacing the total cross section parameter with an effective one based on the quantum diffusion model Farrar , this mirrors the effective interaction parameter of Larson et al., described earlier. The parameters used for were exactly the same for both set of authors. Cosyn et al. also include the effects of short range correlations (SRC) in their calculations. The Glauber phase factor described above is corrected for SRC by replacing the single nucleon density typically used in Glauber-type calculations with an effective density. The effective density modifies the single nucleon density with a Jastrow correlation function and normalization functions which ensure the integral of the effective density is equal to the total number of nucleons.
We have also compared our results to the recent calculations of Kaskulov et al., who calculate nuclear transparency as the ratio of their model differential cross section calculated in the lab frame, with and without FSI, where both types of model cross sections are integrated over the kinematic range of the experiment. Their model is built around a microscopic description Mosel of the elementary process which is divided into a soft hadronic and a hard partonic or deep inelastic scattering production. For the reaction on nuclei, the elementary interaction is kept the same, and standard effects such as Fermi motion, Pauli blocking and nuclear shadowing are accounted for. Finally all produced pre-hadrons and hadrons are propagated through the nuclear medium according to the Boltzmann-Uehling-Uhlenbeck (BUU) transport equation. The DIS contribution to the cross section is determined by the Lund fragmentation model lund and the time development of the interactions of the pre-hadron is determined by the quantum diffusion model Farrar . The production time and the formation time are from a Monte Carlo calculation based on the Lund fragmentation model lund described in Ref. galmc . Only the DIS part of the cross section is effected by this pre-hadronic interaction and thus in this model only the DIS events are responsible for the CT effect.
Our results are in good agreement with the CT calculations of Larson et al., while the calculations of both Cosyn et al. and Kaskulov et al. seem to somewhat overestimate the data. However, whereas one can argue about details of the calculation, it is more important to note that the trend of all calculations including CT in Figs. 15 and 16 are consistent with the trend of the nuclear transparency data versus .
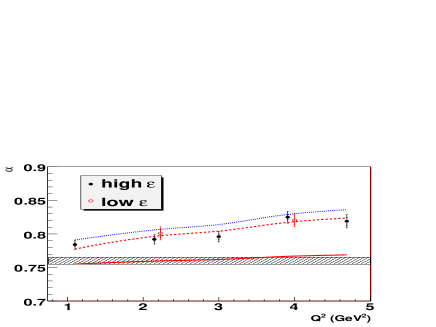
The underlying cause for the rise in nuclear transparency is different for the different model calculations, however. Whereas the dominance of the longitudinal-photon production mechanism in exclusive (e,e) reaction is thought to proceed only at asymptotic , and one would thus anticipate to see the CT effects enter this longitudinal channel, the Kaskulov et al. calculations find the CT effects coming from the transverse-photon production mechanism. Thus, we separately show in Fig. 15, the nuclear transparency results for our low data (but note that the calculations shown in Fig. 16 are for the high kinematics only). Clearly, within the experimental uncertainties, we do not see any obvious difference between the nuclear transparency results measured at high and at low values. Given the uncertainties of the present experiment, we can not distinguish between the suggested mechanisms.
IX.6 Further studies of the CT mechanism
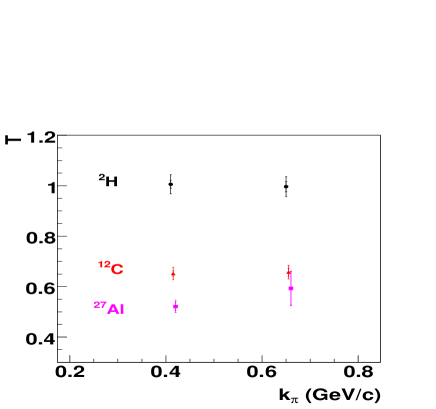
Figs. 15 and 16 show a rise of nuclear transparency with outgoing pion momentum, or alternatively , which deviates from the traditional nuclear physics expectation. However, as can be readily witnessed from Table 1, there exists a strong correlation between the outgoing pion momentum, , and the magnitude of the virtual-pion (three-)momentum, . This poses a potential pitfall in that the observed CT-like behavior could be an artifact due to increased values of (and thus increased probability for reaction mechanisms beyond the quasi-free picture), rather than a dependence on . To investigate this further, we performed measurements at different values of (and thus different ), but at identical (2.15 GeV2).
The results are shown in Fig. 17, and indicate that the nuclear transparency does not show any obvious dependence on . This result rules out the possibility that nuclear transparency only depends on (but does not yet rule out the possibility that nuclear transparency depends on as well as other variables).
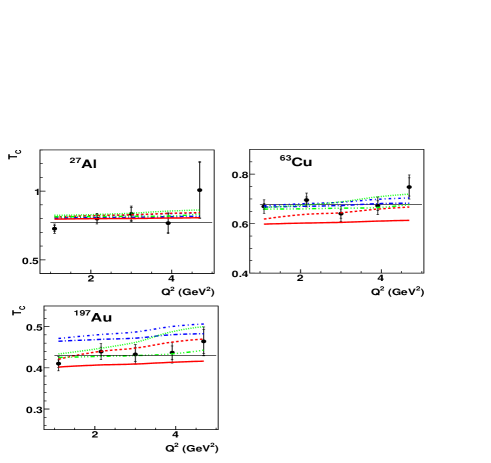
The values of and for this exclusive (e,e) experiment are also strongly correlated. Since is in general terms related to the size of the PLC, and to the formation length of the PLC, the rise in nuclear transparency results can also be a mixed PLC size and formation-length effect. To further study which of these two effects dominates, we formed nuclear transparency ratios of the heavy target nuclei (27Al, 63Cu, and 197Au) with respect to 12C termed as . This ratios should be less sensitive to formation length effects. Here we use the nuclear size as a yardstick to gauge against formation length effects.
The “super ratios” for 27Al (top right panel), 63Cu (bottom left panel), and 197Au (bottom right panel) are shown in Fig. 18. The results are consistent with a flat line, within the (large) experimental uncertainties, with probabilities of 0.32, 0.40, and 0.64, respectively. A plausible explanation is that the pion formation length in our kinematics is already much larger than the nucleus radius (a simple estimate would give a formation length of the order of 10 fm). We also note that a reasonable approximation for the coherence length of the virtual photon () renders a value of about 0.2-0.5 fm, which is much smaller than the size of the nucleus. Thus, we should not be sensitive to any coherence length effects. We conclude that these results seem to favor the explanation that the rise in nuclear transparency measured is due to a small PLC size, rather than a PLC formation length effect.
IX.7 The dependence
The dependence of the nuclear transparency data on the atomic number gives further insight in the proper interpretation of the data in terms of an onset of CT. This goes beyond the or dependence of nuclear transparencies for one single nuclear target described above. Here, the entire nuclear transparency data set was examined using a simple description with an effective parameter (for each value of ). Using only one parameter obviously neglects specific surface effects of the various nuclei, but has proven to be an effective way to describe bulk properties of the nuclear medium. For example, pion-nucleus scattering total cross section data are well described using such a single parameter, as , with the nuclear cross section, the nucleon cross section. and = 0.76 carrol1 . No noticeable dependence on the incident pion energy was measured.
The full nuclear transparency data set from pionCT was fitted as function of (with which equates to the same fit form as above) are shown in Fig. 19. The uncertainties are dominated by systematics, and include contributions from both fitting and model uncertainties. The results indicate a value for the parameter clearly deviating from the total pion-nucleus scattering cross section results, with values 0.76. Furthermore, a noticeable dependence of on , or equivalently the pion kinetic energy, was measured.
We compare the extracted values of , as function of , with the calculations including CT effects of Larson et al. Larson06ge and Cosyn et al. Cosyn . The agreement with the calculations from Ref. Larson06ge is excellent, but the data are systematically below the calculations (including both CT and short-range correlation effects) of Ref. Cosyn . As mentioned above, Kaskulov et al. Mosel recently suggested that the CT effect should only exist in the transverse cross section. For this reason, we have again separately indicated the values for the low and high values of this experiment, where applicable. Within our uncertainties, we see no indication of this prediction. However, we have to warn that the difference between the low- to high- kinematics in terms of contributions from the longitudinal cross sections to the total measured cross sections changes by less than 30% in our kinematics (see Fig. 12 and Table 1). It is thus very well possible that the measured effect is solely due to the transverse contributions.
X Conclusions
The reaction was studied on a variety of nuclear targets: 1H, 2H, 12C, 27Al, Cu, and Au. Data were taken up to a four-momentum transfer squared of = 4.8 GeV2, and analyzed in terms of nuclear transparencies, the escape probability of the positively-charged pion from the nuclear medium. A rise of the nuclear transparency with or pion momentum could signal an onset of Color Transparency, expected to occur at large values of from both perturbative and non-perturbative QCD.
The existence of Color Transparency is well-known. The most convincing evidence is the analysis of Fermilab E791 data on the diffractive dissociation in two jets. However, conclusive proof of the onset of CT is more elusive, although hints of it were recently seen in the analysis of vector meson data at fixed coherence length Airape and photo-production Dutta . Our results show a far more conclusive onset of CT over the relatively large range in pion momentum between 2.5 and 4.5 GeV/c, and the range between 1.1 and 4.8 GeV2, and are in good agreement with model calculations including the CT effect of Larson et al., Cosyn et al., and Kaskulov et al. Larson06ge ; Cosyn ; mosel2 . The latter calculation also agrees excellently with the measured dependence of the differential cross sections, giving further credence to the onset of CT.
Specialized data sets were added to ensure that the noted rise of nuclear transparencies is indeed due to CT. In particular, the cross checks performed are:
-
1.
L/T character of the cross section
Within uncertainties, we find the longitudinal-transverse character of the pion electroproduction cross sections to be similar off protons and heavier nuclei. This supports a quasifree reaction mechanism. -
2.
Virtual-pion momentum
The measured nuclear transparencies do not appear to depend on the virtual-pion (three-)momentum, which could be a signal for increased reaction mechanism effects beyond the quasifree picture. This suggests that reaction mechanism effects beyond the quasifree are suppressed. -
3.
Cross section ratios of medium- to heavy-nuclei
“Super ratios” of the heavier target nuclei (27Al, Cu, Au) with respect to 12C show a similar rise in nuclear transparencies, indicating that the pion formation length in our kinematics is already far longer than the nuclear radius. -
4.
dependence
The dependence of the data can be described by a single parameter, . It was found to be consistently larger than the 0.76 found from pion-nucleus total cross section data, and rising with , consistent with a CT Ansatz.
Furthermore, our results are at nearly-constant and small coherence length ( 0.4 fm), such that possible complications due to exchange terms are minimized.
Our results are consistent with the predicted early onset of CT in mesons compared to baryons, and together with previous meson transparency measurements Airape ; Dutta suggest a gradual transition to meson production with small inter-quark separation. These results put severe constraints on early models of CT which predict a dramatic transition with a threshold-like behavior. The unambiguous observation of the onset of CT uniquely points to the role of color in exclusive high- processes. Furthermore, it is an effective signature of the approach to the factorization regime in meson electroproduction experiments, necessary for the access to Generalized Parton Distributions. These results will be further extended by data to be taken after the Jefferson Lab upgrade to 12 GeV, with planned exclusive measurements up to 10 GeV2 E1206107 .
XI Acknowledgments
The authors would like to acknowledge the outstanding support of Jefferson Lab Hall C technical staffs and Accelerator Division in accomplishing this experiment. This work was supported in part by the U.S. Department of Energy. The Southeastern Universities Research Association (SURA) operates the Thomas Jefferson National Accelerator Facility for the United States Department of Energy under contract DE-AC05-84150. We acknowledge additional research grants from the U.S. National Science Foundation, the Natural Sciences and Engineering Research Council of Canada (NSERC), NATO, FOM (Netherlands), and KOSEF (South Korea).
References
- (1) B. Clasie et al. Phys. Rev. Lett. 99, 242502 (2007).
- (2) A. H. Mueller, in Proceedings of the Seventeenth Recontre de Moriond Conference on Elementary Particle Physics, Les Arcs, France, 1982 edited by J. Tran Thanh Van (Editions Fronriers, Gif-sur-Yvette, France, 1982); S. J. Brodsky, in Proceedings of the Thirteenth International Symposium on Multiparticle Dynamics, Volendam, The Netherlands, 1982, edited by W. Kittel et al. (World Scientific, Singapore, 1983)
- (3) S. J. Brodsky and A. H. Mueller, Phys. Lett. B 206, 685 (1988).
- (4) G. R. Farrar, H. Liu, L. L. Frankfurt, and M. I. Strikman, Phys. Rev. Lett. 61, 686 (1988).
- (5) A. Larson, G. A. Miller and M. Strikman, Phys. Rev. C74, 018201(2006), nucl-th/0604022.
- (6) B. Blattel, G. Baym, L. L. Frankfurt, M. Strikman, Phys. Rev. Lett. 70, 896 (1993).
- (7) J. C. Collins, L. Frankfurt, and M. Strikman, Phys. Rev. D 56, 2982 (1997).
- (8) A. S. Carroll et al., Phys. Rev. Lett. 61, 1698 (1988).
- (9) I. Mardor et al., Phys. Rev. Lett. 81, 5085 (1998).
- (10) A. Leksanov et al., Phys. Rev. Lett. 87, 212301 (2001).
- (11) J. P. Ralston and B. Pire, Phys. Rev. Lett. 65, 2243 (1990).
- (12) J. P. Ralston and B. Pire, Phys. Rev. Lett. 61, 1823 (1988).
- (13) S. J. Brodsky and G. F. de Teramond, Phys. Rev. Lett. 60, 1924 (1988).
- (14) N. Makins et al., Phys. Rev. Lett. 72, 1986 (1994).
- (15) T. O’Neill et al., Phys. Lett. B 351, 87 (1995).
- (16) K. Garrow et al., Phys. Rev. C 66, 044613 (2002).
- (17) D. Abbott et al., Phys. Rev. Lett. 80, 5072 (1998).
- (18) J. M. Laget, Phys. Rev. C 73, 044003 (2006).
- (19) M. R. Adams et al. (E665), Phys. Rev. Lett. 74, 1525 (1995).
- (20) K. Ackerstaff et al. (HERMES), Phys. Re. Lett. 82, 3025 (1999).
- (21) A. Airapetian et al. (HERMES), Phys. Rev. Lett. 90, 052501 (2003).
- (22) E. M. Aitala et al. (E791), Phys. Rev. Lett. 86, 4773 (2001).
- (23) D. Dutta et al. (Jefferson Lab E94-104), Phys. Rev. C 68 021001(R) (2003).
- (24) S. Nozawa and T. S. H. Lee, Nucl. Phys. A 513, 511 (1990).
- (25) A. S. Raskin and T. .W. Donnelly, Annals Phys. 191 (1989) 78; M. Diehl and S. Sapeta, Eur.Phys.J. C 41 (2005) 515.
- (26) T. Horn et al., Phys. Rev. C 78 058201 (2008).
- (27) V. Tvaskis et al., Phys. Rev. Lett. 98 142301 (2007).
- (28) C. W. Leemann, D. R. Douglas, and G. A. Krafft, Ann. Rev. Nucl. Part. Sci. 51, 413 (2001).
- (29) J. R. Arrington, Inclusive Electron Scattering From Nuclei at and High , Ph.D. thesis, California Institute of Technology (1998), unpublished.
- (30) D. Dutta et al., Phys. Rev. C 68, 064603 (2003).
- (31) R. Asaturyan et al., Nucl. Instrum. Methods Phys. Res., Sect. A 548, 364 (2005).
- (32) T. Horn, Ph.D. thesis, University of Maryland (2006).
- (33) D. van Westrum, Ph.D. thesis, University of Colorado (1998).
- (34) H P. Blok, T. Horn, G. Huber et al., Phys. Rev. C 78 045202 (2008).
- (35) COSY INFINITY, Proceedings of the 1991 Particle Accelerator Conference, see also http://bt.nscl.msu.edu/cosy/index.html.
- (36) E. Quint, The proton Spectral Function of 27Al, Tech., rep., NIKHEF internal note (1983).
- (37) N. Makins, Measurement of the nuclear dependence and momentum transfer dependence of quasi-elastic (e,e’p) scattering at large momentum transfer, Ph.D. thesis, Massachusetts Institute of Technology (1994), unpublished.
- (38) L. W. Mo and Y. S. Tsai, Rev. Mod. Phys. 41, 205 (1969).
- (39) R. Ent et al. Phys. Rev. C 64, 054610 (2001).
- (40) S. Fantoni and V. R. Pandharipande, Nucl. Phys. A 427, 473 (1984).
- (41) D. Gaskell, Ph.D. thesis, Oregon State University (2001).
- (42) A. Aste, C. von Arx and D. Trautmann, Z. Phys. A 26, 167 (2005).
- (43) M. E. Christy et al., Phys. Rev. C 70, 015206 (2004).
- (44) V. Tvaskis, Ph.D. Thesis, Vrije Universiteit te Amsterdam (2004).
- (45) M. Vanderhaeghen, M. Guidal and J. M. Laget, Phys. Rev. C 57, 1454 (1998); Nucl. Phys. A 627 645 (1997).
- (46) M. M. Kaskulov, K. Gallmeister and U. Mosel, Phys. Rev. D 78, 114022 (2008); arXiv:0804.1834 (hep-ph).
- (47) T. Horn et al., Phys. Rev. C 78 058201 (2008).
- (48) M. Battaglieri et al., Phys. Rev. Lett 87 172002 (2001).
- (49) D. Gaskell et al., Phys. Rev. Lett 87, 202301 (2001).
- (50) B. L. Friman, V. R. Pandharipande and R. B. Wiringa, Phys. Rev. Lett. 51, 763 (1983).
- (51) J. Gomez et al., Phys. Rev. D 49, 4348 (1994).
- (52) B. Frois and C. N. Papanicolas, Ann. Rev. Nucl. Part. Sci. 37, 133 (1987).
- (53) L. Lapikas, Nucl. Phys. A 553, 297c (1993).
- (54) R. J. Glauber, Lectures in Theoretical Physics, ed. W. E. Brittin et al. (Interscience Publications, New York, 1959), vol I, p 315.
- (55) W. Cosyn, M. C. Martinez, J. Ryckebusch and B. Van Overmeire, Phys. Rev. C74, 062201(R) (2006); W. Cosyn and J. Ryckebusch (private communication).
- (56) M. M. Kaskulov, K. Gallmeister and U. Mosel, Phys. Rev.C 79, 015207 (2009).
- (57) S. Eidelman et al. (Particle Data Group), Phys. Lett. B 591, 1 (2004).
- (58) R. A. Arndt, W. J. Briscoe, I. I. Strakovsky, R. L. Workman, and M. M. Pavan, Phys. Rev. C 69, 035213 (2004).
- (59) T. Lasinski, R. Levi Setti, B. Schwarzschild, and P. Ukleja, Nucl. Phys. B 37, 1 (1972).
- (60) B. Van Overmeire, W. Cosyn, P. Lava, and J. Ryckebusch, Phys. Rev. C 73, 064603 (2006).
- (61) E. D. Cooper, S. Hama, B. C. Clark, and R. L. Mercer, Phys. Rev. C 47, 297 (1993).
- (62) B. Anderson et al., Phys. Rep. 97, 31 (1983).
- (63) K. Gallmeister and T. Falter, Phys. Lett. B 630, 40 (2005).
- (64) A. S. Carroll et al., Phys. Lett. B 80, 319 (1979).
- (65) Jefferson Lab proposal E12-06-107, Spokesperson: D. Dutta and R. Ent.
Appendix A
| Target | W | -t | stat. err. | sys. err. | |||||
|---|---|---|---|---|---|---|---|---|---|
| GeV2 | GeV | GeV2 | GeV/c | GeV/c | |||||
| 1.71 | 2.36 | 0.100 | 3.35 | 0.532 | 0.99 | 3.72 | 0.11 | 0.24 | |
| 1.80 | 2.33 | 0.117 | 3.31 | 0.538 | 0.97 | 3.46 | 0.11 | 0.23 | |
| 1.84 | 2.32 | 0.128 | 3.30 | 0.539 | 0.96 | 3.47 | 0.11 | 0.20 | |
| 1.87 | 2.31 | 0.136 | 3.30 | 0.538 | 0.96 | 3.04 | 0.10 | 0.19 | |
| 1.90 | 2.30 | 0.144 | 3.26 | 0.545 | 0.95 | 3.07 | 0.10 | 0.19 | |
| 1.93 | 2.28 | 0.152 | 3.24 | 0.548 | 0.94 | 2.92 | 0.09 | 0.17 | |
| 1.94 | 2.27 | 0.160 | 3.21 | 0.554 | 0.93 | 2.96 | 0.09 | 0.18 | |
| 1.95 | 2.27 | 0.167 | 3.21 | 0.555 | 0.93 | 2.78 | 0.09 | 0.17 | |
| 2.02 | 2.25 | 0.174 | 3.20 | 0.554 | 0.92 | 2.75 | 0.08 | 0.16 | |
| 2.06 | 2.24 | 0.181 | 3.19 | 0.553 | 0.91 | 2.54 | 0.08 | 0.15 | |
| 2.05 | 2.24 | 0.187 | 3.19 | 0.553 | 0.91 | 2.71 | 0.09 | 0.15 | |
| 2.09 | 2.23 | 0.193 | 3.17 | 0.555 | 0.90 | 2.61 | 0.09 | 0.14 | |
| 2.08 | 2.24 | 0.200 | 3.17 | 0.555 | 0.91 | 2.48 | 0.07 | 0.13 | |
| 2.09 | 2.23 | 0.208 | 3.17 | 0.554 | 0.90 | 2.38 | 0.07 | 0.12 | |
| 2.13 | 2.23 | 0.216 | 3.16 | 0.552 | 0.90 | 2.55 | 0.07 | 0.13 | |
| 2.13 | 2.23 | 0.224 | 3.16 | 0.552 | 0.90 | 2.27 | 0.07 | 0.11 | |
| 2.13 | 2.23 | 0.232 | 3.16 | 0.552 | 0.90 | 2.29 | 0.07 | 0.11 | |
| 2.20 | 2.19 | 0.240 | 3.10 | 0.563 | 0.88 | 2.21 | 0.07 | 0.11 | |
| 2.22 | 2.19 | 0.249 | 3.10 | 0.560 | 0.87 | 2.18 | 0.06 | 0.11 | |
| 2.19 | 2.19 | 0.259 | 3.10 | 0.563 | 0.88 | 2.15 | 0.07 | 0.11 | |
| 2.26 | 2.18 | 0.270 | 3.08 | 0.558 | 0.86 | 2.11 | 0.06 | 0.11 | |
| 2.29 | 2.17 | 0.283 | 3.08 | 0.557 | 0.86 | 2.05 | 0.06 | 0.12 | |
| 2.34 | 2.16 | 0.299 | 3.07 | 0.557 | 0.86 | 1.95 | 0.06 | 0.12 | |
| 2.44 | 2.13 | 0.317 | 3.06 | 0.556 | 0.84 | 2.11 | 0.07 | 0.15 | |
| 2.53 | 2.12 | 0.341 | 3.04 | 0.547 | 0.82 | 1.78 | 0.06 | 0.04 | |
| 2.63 | 2.08 | 0.385 | 3.03 | 0.561 | 0.82 | 1.83 | 0.07 | 0.19 | |
| 3.75 | 2.21 | 0.425 | 3.89 | 0.251 | 0.89 | 0.64 | 0.02 | 0.06 | |
| 4.00 | 2.14 | 0.548 | 3.80 | 0.255 | 0.85 | 0.58 | 0.02 | 0.06 | |
| 4.00 | 2.14 | 0.646 | 3.73 | 0.255 | 0.84 | 0.64 | 0.02 | 0.07 | |
| 4.21 | 2.07 | 0.758 | 3.63 | 0.261 | 0.80 | 0.70 | 0.02 | 0.07 | |
| 2.55 | 2.28 | 0.199 | 3.55 | 0.435 | 0.94 | 1.82 | 0.06 | 0.09 | |
| 2.64 | 2.26 | 0.236 | 3.52 | 0.433 | 0.93 | 1.70 | 0.05 | 0.09 | |
| 2.68 | 2.24 | 0.260 | 3.49 | 0.438 | 0.91 | 1.50 | 0.05 | 0.08 | |
| 2.72 | 2.23 | 0.280 | 3.46 | 0.441 | 0.91 | 1.41 | 0.05 | 0.07 | |
| 2.78 | 2.21 | 0.300 | 3.45 | 0.440 | 0.90 | 1.43 | 0.05 | 0.08 | |
| 2.85 | 2.19 | 0.320 | 3.42 | 0.443 | 0.88 | 1.42 | 0.04 | 0.08 | |
| 2.90 | 2.18 | 0.340 | 3.40 | 0.445 | 0.87 | 1.26 | 0.04 | 0.07 | |
| 2.94 | 2.16 | 0.360 | 3.38 | 0.445 | 0.86 | 1.36 | 0.04 | 0.07 | |
| 2.96 | 2.16 | 0.380 | 3.37 | 0.446 | 0.86 | 1.28 | 0.04 | 0.07 | |
| 3.06 | 2.13 | 0.400 | 3.33 | 0.450 | 0.84 | 1.26 | 0.04 | 0.07 | |
| 3.08 | 2.12 | 0.420 | 3.30 | 0.454 | 0.83 | 1.22 | 0.04 | 0.06 | |
| 3.11 | 2.11 | 0.445 | 3.29 | 0.454 | 0.82 | 1.16 | 0.03 | 0.06 | |
| 3.27 | 2.07 | 0.474 | 3.28 | 0.450 | 0.80 | 1.08 | 0.04 | 0.06 | |
| 3.25 | 2.08 | 0.508 | 3.25 | 0.447 | 0.80 | 1.09 | 0.04 | 0.06 | |
| 3.50 | 1.99 | 0.565 | 3.21 | 0.455 | 0.77 | 1.22 | 0.04 | 0.07 | |
| 0.92 | 2.31 | 0.038 | 2.84 | 0.490 | 0.96 | 10.74 | 0.32 | 0.53 | |
| 0.98 | 2.29 | 0.047 | 2.81 | 0.497 | 0.94 | 9.56 | 0.26 | 0.49 | |
| 1.00 | 2.28 | 0.053 | 2.80 | 0.499 | 0.94 | 8.99 | 0.26 | 0.46 |
| Target | W | -t | stat. err. | sys. err. | |||||
|---|---|---|---|---|---|---|---|---|---|
| GeV2 | GeV | GeV2 | GeV/c | GeV/c | |||||
| 1.04 | 2.27 | 0.058 | 2.79 | 0.501 | 0.93 | 8.15 | 0.22 | 0.42 | |
| 1.03 | 2.27 | 0.062 | 2.78 | 0.501 | 0.93 | 7.87 | 0.23 | 0.42 | |
| 1.10 | 2.26 | 0.066 | 2.79 | 0.497 | 0.92 | 7.90 | 0.22 | 0.42 | |
| 1.07 | 2.26 | 0.070 | 2.76 | 0.504 | 0.92 | 7.35 | 0.21 | 0.39 | |
| 1.10 | 2.25 | 0.074 | 2.77 | 0.502 | 0.92 | 6.73 | 0.19 | 0.35 | |
| 1.10 | 2.25 | 0.078 | 2.76 | 0.501 | 0.92 | 7.06 | 0.19 | 0.37 | |
| 1.12 | 2.24 | 0.082 | 2.75 | 0.503 | 0.91 | 6.71 | 0.19 | 0.34 | |
| 1.13 | 2.24 | 0.086 | 2.74 | 0.506 | 0.91 | 6.52 | 0.19 | 0.33 | |
| 1.16 | 2.23 | 0.090 | 2.74 | 0.504 | 0.91 | 6.34 | 0.17 | 0.32 | |
| 1.16 | 2.24 | 0.095 | 2.73 | 0.503 | 0.91 | 6.00 | 0.17 | 0.30 | |
| 1.19 | 2.22 | 0.100 | 2.71 | 0.510 | 0.89 | 6.58 | 0.19 | 0.33 | |
| 1.20 | 2.22 | 0.105 | 2.72 | 0.505 | 0.90 | 6.01 | 0.19 | 0.31 | |
| 1.21 | 2.22 | 0.110 | 2.71 | 0.505 | 0.89 | 6.50 | 0.20 | 0.33 | |
| 1.18 | 2.23 | 0.116 | 2.70 | 0.506 | 0.90 | 6.18 | 0.19 | 0.32 | |
| 1.16 | 2.24 | 0.123 | 2.71 | 0.501 | 0.90 | 5.51 | 0.18 | 0.30 | |
| 1.17 | 2.23 | 0.133 | 2.69 | 0.505 | 0.89 | 6.15 | 0.18 | 0.37 | |
| 1.21 | 2.22 | 0.154 | 2.67 | 0.502 | 0.88 | 7.21 | 0.20 | 0.59 | |
| 2.06 | 2.24 | 0.165 | 3.21 | 0.268 | 0.91 | 2.52 | 0.08 | 0.12 | |
| 2.16 | 2.21 | 0.209 | 3.17 | 0.269 | 0.90 | 2.01 | 0.07 | 0.10 | |
| 2.26 | 2.18 | 0.248 | 3.12 | 0.274 | 0.88 | 1.95 | 0.06 | 0.10 | |
| 2.27 | 2.18 | 0.290 | 3.07 | 0.276 | 0.86 | 1.97 | 0.06 | 0.10 | |
| 2.28 | 2.18 | 0.326 | 3.02 | 0.274 | 0.85 | 2.04 | 0.07 | 0.13 | |
| 1.81 | 1.86 | 0.241 | 2.21 | 0.634 | 0.68 | 5.74 | 0.19 | 0.43 | |
| 1.86 | 1.84 | 0.276 | 2.17 | 0.634 | 0.67 | 5.01 | 0.16 | 0.33 | |
| 1.93 | 1.82 | 0.305 | 2.15 | 0.633 | 0.65 | 5.10 | 0.15 | 0.31 | |
| 2.00 | 1.79 | 0.330 | 2.12 | 0.636 | 0.63 | 5.20 | 0.18 | 0.31 | |
| 2.08 | 1.76 | 0.355 | 2.09 | 0.638 | 0.62 | 5.59 | 0.15 | 0.32 | |
| 2.14 | 1.74 | 0.385 | 2.07 | 0.637 | 0.60 | 5.61 | 0.15 | 0.32 | |
| 2.19 | 1.74 | 0.414 | 2.07 | 0.629 | 0.60 | 5.73 | 0.16 | 0.33 | |
| 2.25 | 1.71 | 0.444 | 2.04 | 0.630 | 0.58 | 5.58 | 0.18 | 0.30 | |
| 2.30 | 1.70 | 0.479 | 2.02 | 0.628 | 0.57 | 5.61 | 0.19 | 0.30 | |
| 2.40 | 1.67 | 0.548 | 1.98 | 0.622 | 0.55 | 5.58 | 0.17 | 0.29 | |
| 4.39 | 2.32 | 0.469 | 4.49 | 0.259 | 0.96 | 0.45 | 0.02 | 0.02 | |
| 4.71 | 2.24 | 0.621 | 4.37 | 0.265 | 0.91 | 0.41 | 0.01 | 0.02 | |
| 4.82 | 2.21 | 0.765 | 4.28 | 0.269 | 0.90 | 0.41 | 0.01 | 0.02 | |
| 4.98 | 2.17 | 0.914 | 4.17 | 0.267 | 0.86 | 0.43 | 0.01 | 0.02 | |
| 3.45 | 2.38 | 0.280 | 4.24 | 0.381 | 1.00 | 0.75 | 0.02 | 0.04 | |
| 3.55 | 2.36 | 0.340 | 4.20 | 0.381 | 0.99 | 0.71 | 0.02 | 0.04 | |
| 3.69 | 2.32 | 0.380 | 4.17 | 0.383 | 0.97 | 0.67 | 0.02 | 0.04 | |
| 3.78 | 2.30 | 0.420 | 4.12 | 0.386 | 0.95 | 0.68 | 0.02 | 0.04 | |
| 3.84 | 2.28 | 0.460 | 4.09 | 0.386 | 0.93 | 0.62 | 0.02 | 0.03 | |
| 3.91 | 2.26 | 0.499 | 4.05 | 0.388 | 0.92 | 0.59 | 0.02 | 0.03 | |
| 3.92 | 2.25 | 0.540 | 4.00 | 0.393 | 0.91 | 0.62 | 0.02 | 0.03 | |
| 4.00 | 2.23 | 0.579 | 3.97 | 0.395 | 0.90 | 0.63 | 0.02 | 0.03 | |
| 4.10 | 2.21 | 0.619 | 3.93 | 0.395 | 0.88 | 0.61 | 0.02 | 0.03 | |
| 4.30 | 2.15 | 0.663 | 3.91 | 0.394 | 0.85 | 0.66 | 0.02 | 0.03 | |
| 4.40 | 2.12 | 0.741 | 3.87 | 0.398 | 0.84 | 0.63 | 0.02 | 0.03 |
Appendix B
| Target | W | -t | stat. err. | sys. err. | |||||
|---|---|---|---|---|---|---|---|---|---|
| GeV2 | GeV | GeV2 | GeV/c | GeV/c | |||||
| 2.24 | 3.68 | 0.177 | 3.20 | 1.35 | 0.559 | 17.36 | 0.63 | 1.30 | |
| 2.24 | 3.68 | 0.188 | 3.19 | 1.34 | 0.559 | 31.72 | 1.16 | 1.82 | |
| 2.24 | 3.68 | 0.195 | 3.18 | 1.34 | 0.559 | 45.58 | 1.73 | 2.60 | |
| 2.24 | 3.68 | 0.203 | 3.17 | 1.34 | 0.559 | 55.31 | 2.03 | 3.10 | |
| 2.24 | 3.68 | 0.211 | 3.16 | 1.33 | 0.559 | 64.42 | 2.48 | 3.72 | |
| 2.24 | 3.68 | 0.220 | 3.15 | 1.33 | 0.559 | 66.01 | 2.42 | 3.98 | |
| 2.24 | 3.68 | 0.229 | 3.14 | 1.32 | 0.559 | 59.77 | 2.20 | 3.78 | |
| 2.24 | 3.68 | 0.240 | 3.13 | 1.32 | 0.559 | 53.28 | 2.00 | 3.51 | |
| 2.24 | 3.68 | 0.251 | 3.12 | 1.31 | 0.559 | 41.23 | 1.55 | 2.78 | |
| 2.24 | 3.68 | 0.263 | 3.10 | 1.31 | 0.559 | 27.73 | 1.03 | 1.86 | |
| 2.24 | 3.68 | 0.277 | 3.08 | 1.30 | 0.559 | 15.29 | 0.61 | 1.01 | |
| 2.24 | 3.68 | 0.299 | 3.04 | 1.28 | 0.559 | 7.86 | 0.28 | 0.46 | |
| 4.00 | 3.86 | 0.442 | 3.90 | 1.43 | 0.254 | 4.65 | 0.21 | 0.58 | |
| 4.00 | 3.86 | 0.512 | 3.84 | 1.41 | 0.254 | 10.20 | 0.43 | 1.25 | |
| 3.02 | 3.73 | 0.290 | 3.46 | 1.37 | 0.449 | 6.75 | 0.25 | 0.47 | |
| 3.02 | 3.73 | 0.316 | 3.42 | 1.36 | 0.449 | 17.55 | 0.66 | 1.13 | |
| 3.02 | 3.73 | 0.337 | 3.40 | 1.35 | 0.449 | 24.30 | 0.92 | 1.49 | |
| 3.02 | 3.73 | 0.359 | 3.38 | 1.34 | 0.449 | 25.32 | 0.98 | 1.50 | |
| 3.02 | 3.73 | 0.380 | 3.36 | 1.33 | 0.449 | 22.72 | 1.00 | 1.28 | |
| 3.02 | 3.73 | 0.402 | 3.34 | 1.32 | 0.449 | 16.21 | 0.65 | 0.91 | |
| 1.12 | 3.60 | 0.067 | 2.78 | 1.30 | 0.504 | 188.27 | 6.96 | 11.29 | |
| 1.12 | 3.60 | 0.071 | 2.78 | 1.30 | 0.504 | 262.48 | 9.75 | 14.97 | |
| 1.12 | 3.60 | 0.077 | 2.77 | 1.29 | 0.504 | 310.24 | 11.76 | 18.10 | |
| 1.12 | 3.60 | 0.082 | 2.76 | 1.29 | 0.504 | 316.58 | 12.18 | 19.00 | |
| 1.12 | 3.60 | 0.088 | 2.75 | 1.29 | 0.504 | 268.56 | 10.35 | 16.58 | |
| 1.12 | 3.60 | 0.094 | 2.75 | 1.29 | 0.504 | 211.69 | 7.88 | 13.73 | |
| 1.12 | 3.60 | 0.099 | 2.74 | 1.28 | 0.504 | 144.49 | 5.42 | 9.61 | |
| 1.12 | 3.60 | 0.105 | 2.72 | 1.27 | 0.504 | 75.80 | 3.03 | 4.91 | |
| 1.12 | 3.60 | 0.111 | 2.70 | 1.27 | 0.504 | 36.38 | 1.60 | 2.26 | |
| 1.12 | 3.60 | 0.120 | 2.68 | 1.25 | 0.504 | 16.95 | 0.98 | 0.95 | |
| 1.12 | 3.60 | 0.128 | 2.66 | 1.24 | 0.504 | 9.92 | 0.69 | 0.54 | |
| 2.24 | 3.68 | 0.193 | 3.19 | 1.34 | 0.274 | 36.94 | 1.41 | 3.80 | |
| 2.24 | 3.68 | 0.221 | 3.15 | 1.33 | 0.274 | 58.50 | 2.38 | 7.07 | |
| 2.24 | 3.68 | 0.248 | 3.12 | 1.32 | 0.274 | 40.19 | 1.56 | 4.88 | |
| 2.24 | 3.68 | 0.293 | 3.06 | 1.29 | 0.274 | 8.69 | 0.31 | 1.05 | |
| 2.14 | 3.17 | 0.314 | 2.17 | 0.99 | 0.630 | 24.32 | 0.98 | 1.78 | |
| 2.14 | 3.17 | 0.346 | 2.14 | 0.98 | 0.630 | 60.74 | 2.25 | 4.07 | |
| 2.14 | 3.17 | 0.367 | 2.11 | 0.97 | 0.630 | 83.29 | 3.10 | 5.98 | |
| 2.14 | 3.17 | 0.385 | 2.09 | 0.96 | 0.630 | 89.87 | 3.22 | 7.08 | |
| 2.14 | 3.17 | 0.404 | 2.07 | 0.95 | 0.630 | 66.90 | 2.65 | 5.57 | |
| 2.14 | 3.17 | 0.424 | 2.05 | 0.94 | 0.630 | 48.89 | 1.85 | 4.44 | |
| 2.14 | 3.17 | 0.451 | 2.02 | 0.92 | 0.630 | 27.91 | 1.18 | 2.74 | |
| 2.14 | 3.17 | 0.481 | 1.98 | 0.91 | 0.630 | 18.00 | 0.93 | 1.99 | |
| 4.74 | 4.06 | 0.507 | 4.48 | 1.55 | 0.264 | 2.76 | 0.10 | 0.34 | |
| 4.74 | 4.06 | 0.592 | 4.40 | 1.52 | 0.264 | 5.54 | 0.22 | 0.67 | |
| 4.74 | 4.06 | 0.668 | 4.34 | 1.50 | 0.264 | 5.31 | 0.22 | 0.65 | |
| 3.94 | 3.98 | 0.359 | 4.18 | 1.52 | 0.391 | 2.47 | 0.09 | 0.27 | |
| 3.94 | 3.98 | 0.393 | 4.15 | 1.51 | 0.391 | 6.20 | 0.23 | 0.57 | |
| 3.94 | 3.98 | 0.417 | 4.12 | 1.50 | 0.391 | 9.38 | 0.35 | 0.77 | |
| 3.94 | 3.98 | 0.442 | 4.10 | 1.49 | 0.391 | 11.94 | 0.44 | 0.95 | |
| 3.94 | 3.98 | 0.469 | 4.08 | 1.48 | 0.391 | 10.97 | 0.42 | 0.89 | |
| 3.94 | 3.98 | 0.496 | 4.05 | 1.48 | 0.391 | 10.04 | 0.41 | 0.85 | |
| 3.94 | 3.98 | 0.525 | 4.03 | 1.47 | 0.391 | 8.22 | 0.31 | 0.76 |
| Target | W | -t | stat. err. | sys. err. | |||||
|---|---|---|---|---|---|---|---|---|---|
| GeV2 | GeV | GeV2 | GeV/c | GeV/c | |||||
| 2.24 | 14.01 | 0.159 | 3.23 | 2.51 | 0.558 | 26.45 | 1.02 | 2.02 | |
| 2.24 | 14.01 | 0.177 | 3.21 | 2.49 | 0.558 | 41.07 | 1.61 | 2.94 | |
| 2.24 | 14.01 | 0.189 | 3.20 | 2.48 | 0.558 | 50.06 | 1.76 | 3.26 | |
| 2.24 | 14.01 | 0.200 | 3.18 | 2.47 | 0.558 | 54.14 | 2.09 | 3.35 | |
| 2.24 | 14.01 | 0.209 | 3.17 | 2.46 | 0.558 | 49.20 | 1.88 | 3.28 | |
| 2.24 | 14.01 | 0.218 | 3.16 | 2.45 | 0.558 | 57.30 | 2.12 | 3.51 | |
| 2.24 | 14.01 | 0.227 | 3.14 | 2.44 | 0.558 | 53.93 | 2.01 | 3.37 | |
| 2.24 | 14.01 | 0.237 | 3.13 | 2.43 | 0.558 | 56.09 | 2.08 | 3.35 | |
| 2.24 | 14.01 | 0.246 | 3.12 | 2.42 | 0.558 | 51.33 | 1.92 | 3.17 | |
| 2.24 | 14.01 | 0.257 | 3.10 | 2.41 | 0.558 | 47.62 | 1.77 | 2.95 | |
| 2.24 | 14.01 | 0.271 | 3.08 | 2.39 | 0.558 | 42.88 | 1.48 | 2.84 | |
| 4.04 | 14.59 | 0.388 | 3.96 | 2.91 | 0.257 | 4.79 | 0.32 | 0.61 | |
| 4.04 | 14.59 | 0.498 | 3.85 | 2.83 | 0.257 | 7.08 | 0.36 | 0.91 | |
| 3.02 | 14.22 | 0.261 | 3.49 | 2.65 | 0.450 | 14.12 | 0.55 | 1.77 | |
| 3.02 | 14.22 | 0.315 | 3.43 | 2.61 | 0.450 | 20.13 | 0.66 | 2.57 | |
| 3.02 | 14.22 | 0.367 | 3.37 | 2.56 | 0.450 | 22.06 | 0.69 | 2.78 | |
| 1.12 | 13.67 | 0.071 | 2.78 | 2.24 | 0.504 | 95.54 | 3.80 | 9.86 | |
| 1.12 | 13.67 | 0.079 | 2.77 | 2.23 | 0.504 | 231.96 | 8.73 | 25.10 | |
| 1.12 | 13.67 | 0.085 | 2.76 | 2.22 | 0.504 | 253.64 | 9.85 | 29.19 | |
| 1.12 | 13.67 | 0.089 | 2.75 | 2.21 | 0.504 | 264.99 | 9.82 | 31.33 | |
| 1.12 | 13.67 | 0.094 | 2.74 | 2.20 | 0.504 | 256.93 | 10.00 | 30.78 | |
| 1.12 | 13.67 | 0.099 | 2.73 | 2.19 | 0.504 | 248.65 | 9.55 | 30.26 | |
| 1.12 | 13.67 | 0.104 | 2.72 | 2.19 | 0.504 | 229.94 | 9.41 | 26.27 | |
| 1.12 | 13.67 | 0.109 | 2.71 | 2.18 | 0.504 | 184.15 | 8.36 | 20.85 | |
| 1.12 | 13.67 | 0.113 | 2.70 | 2.17 | 0.504 | 172.23 | 8.24 | 16.81 | |
| 1.12 | 13.67 | 0.119 | 2.68 | 2.16 | 0.504 | 145.60 | 6.24 | 14.24 | |
| 1.12 | 13.67 | 0.125 | 2.67 | 2.15 | 0.504 | 129.83 | 6.11 | 10.75 | |
| 1.12 | 13.67 | 0.133 | 2.65 | 2.13 | 0.504 | 99.01 | 4.60 | 7.17 | |
| 2.24 | 14.01 | 0.181 | 3.21 | 2.49 | 0.275 | 37.50 | 1.60 | 3.05 | |
| 2.24 | 14.01 | 0.219 | 3.16 | 2.45 | 0.275 | 44.01 | 1.85 | 3.75 | |
| 2.24 | 14.01 | 0.251 | 3.11 | 2.41 | 0.275 | 45.06 | 1.84 | 3.74 | |
| 2.20 | 13.17 | 0.292 | 2.17 | 1.77 | 0.642 | 27.97 | 1.35 | 3.47 | |
| 2.20 | 13.17 | 0.335 | 2.13 | 1.73 | 0.642 | 45.35 | 1.84 | 5.66 | |
| 2.20 | 13.17 | 0.363 | 2.09 | 1.71 | 0.642 | 55.11 | 2.75 | 6.97 | |
| 2.20 | 13.17 | 0.386 | 2.07 | 1.69 | 0.642 | 56.99 | 2.25 | 7.26 | |
| 4.73 | 15.03 | 0.397 | 4.59 | 3.27 | 0.263 | 2.42 | 0.16 | 0.30 | |
| 4.73 | 15.03 | 0.500 | 4.50 | 3.21 | 0.263 | 4.04 | 0.19 | 0.51 | |
| 3.94 | 14.77 | 0.320 | 4.23 | 3.08 | 0.391 | 5.49 | 0.22 | 0.35 | |
| 3.94 | 14.77 | 0.378 | 4.17 | 3.04 | 0.391 | 8.70 | 0.34 | 0.55 | |
| 3.94 | 14.77 | 0.429 | 4.12 | 3.00 | 0.391 | 10.04 | 0.34 | 0.62 |
| Target | W | -t | stat. err. | sys. err. | |||||
|---|---|---|---|---|---|---|---|---|---|
| GeV2 | GeV | GeV2 | GeV/c | GeV/c | |||||
| 2.24 | 62.36 | 0.161 | 3.23 | 3.05 | 0.558 | 81.49 | 3.06 | 6.15 | |
| 2.24 | 62.36 | 0.183 | 3.21 | 3.03 | 0.558 | 112.51 | 4.20 | 8.81 | |
| 2.24 | 62.36 | 0.197 | 3.19 | 3.01 | 0.558 | 118.28 | 4.48 | 9.30 | |
| 2.24 | 62.36 | 0.208 | 3.17 | 2.99 | 0.558 | 131.91 | 5.07 | 9.97 | |
| 2.24 | 62.36 | 0.219 | 3.16 | 2.98 | 0.558 | 131.81 | 4.85 | 9.93 | |
| 2.24 | 62.36 | 0.230 | 3.14 | 2.96 | 0.558 | 134.78 | 4.92 | 9.81 | |
| 2.24 | 62.36 | 0.241 | 3.12 | 2.95 | 0.558 | 125.55 | 4.81 | 9.23 | |
| 2.24 | 62.36 | 0.253 | 3.11 | 2.93 | 0.558 | 122.13 | 4.47 | 8.79 | |
| 2.24 | 62.36 | 0.265 | 3.09 | 2.91 | 0.558 | 112.68 | 4.25 | 8.12 | |
| 2.24 | 62.36 | 0.278 | 3.07 | 2.90 | 0.558 | 106.16 | 4.28 | 7.61 | |
| 4.04 | 63.12 | 0.364 | 3.98 | 3.71 | 0.257 | 10.98 | 0.86 | 1.51 | |
| 4.04 | 63.12 | 0.465 | 3.89 | 3.62 | 0.257 | 17.60 | 0.81 | 2.37 | |
| 3.02 | 62.64 | 0.250 | 3.51 | 3.29 | 0.450 | 32.07 | 1.37 | 3.98 | |
| 3.02 | 62.64 | 0.305 | 3.45 | 3.24 | 0.450 | 46.62 | 1.40 | 5.01 | |
| 3.02 | 62.64 | 0.363 | 3.38 | 3.17 | 0.450 | 47.83 | 1.61 | 4.74 | |
| 1.12 | 61.93 | 0.070 | 2.79 | 2.66 | 0.503 | 122.69 | 4.62 | 9.51 | |
| 1.12 | 61.93 | 0.083 | 2.76 | 2.63 | 0.503 | 618.86 | 18.04 | 49.79 | |
| 1.12 | 61.93 | 0.091 | 2.75 | 2.62 | 0.503 | 614.14 | 19.83 | 48.08 | |
| 1.12 | 61.93 | 0.098 | 2.73 | 2.60 | 0.503 | 552.29 | 18.40 | 43.14 | |
| 1.12 | 61.93 | 0.105 | 2.71 | 2.58 | 0.503 | 542.30 | 16.21 | 39.69 | |
| 1.12 | 61.93 | 0.115 | 2.69 | 2.56 | 0.503 | 484.09 | 14.21 | 33.64 | |
| 1.12 | 61.93 | 0.126 | 2.67 | 2.54 | 0.503 | 380.04 | 12.93 | 25.42 | |
| 2.24 | 62.35 | 0.186 | 3.19 | 3.01 | 0.282 | 109.18 | 4.45 | 9.03 | |
| 2.24 | 62.35 | 0.241 | 3.11 | 2.94 | 0.282 | 109.87 | 4.09 | 8.17 | |
| 4.73 | 63.70 | 0.468 | 4.53 | 4.18 | 0.264 | 10.76 | 0.38 | 1.40 | |
| 4.73 | 63.70 | 0.647 | 4.36 | 4.02 | 0.264 | 10.77 | 0.64 | 1.42 | |
| 3.94 | 63.34 | 0.314 | 4.24 | 3.93 | 0.391 | 14.16 | 0.62 | 1.77 | |
| 3.94 | 63.34 | 0.385 | 4.17 | 3.87 | 0.391 | 21.61 | 0.74 | 2.00 | |
| 3.94 | 63.34 | 0.450 | 4.10 | 3.80 | 0.391 | 23.31 | 0.75 | 1.94 |
| Target | W | -t | stat. err. | sys. err. | |||||
|---|---|---|---|---|---|---|---|---|---|
| GeV2 | GeV | GeV2 | GeV/c | GeV/c | |||||
| 2.16 | 186.68 | 0.164 | 3.23 | 3.17 | 0.557 | 201.07 | 7.93 | 24.37 | |
| 2.16 | 186.68 | 0.221 | 3.15 | 3.09 | 0.557 | 247.23 | 6.02 | 29.46 | |
| 4.03 | 187.48 | 0.438 | 3.92 | 3.82 | 0.256 | 33.28 | 3.04 | 3.15 | |
| 3.02 | 186.97 | 0.254 | 3.50 | 3.43 | 0.449 | 63.50 | 3.79 | 9.00 | |
| 3.02 | 186.97 | 0.323 | 3.43 | 3.36 | 0.449 | 90.51 | 3.56 | 12.80 | |
| 1.12 | 186.22 | 0.070 | 2.79 | 2.74 | 0.504 | 149.26 | 6.50 | 14.36 | |
| 1.12 | 186.22 | 0.083 | 2.76 | 2.72 | 0.504 | 1052.70 | 37.33 | 104.4 | |
| 1.12 | 186.22 | 0.092 | 2.74 | 2.70 | 0.504 | 1085.12 | 37.20 | 109.3 | |
| 1.12 | 186.22 | 0.101 | 2.72 | 2.68 | 0.504 | 1033.13 | 36.08 | 103.5 | |
| 1.12 | 186.22 | 0.110 | 2.70 | 2.66 | 0.504 | 908.06 | 34.59 | 85.81 | |
| 1.12 | 186.22 | 0.118 | 2.68 | 2.64 | 0.504 | 881.15 | 34.71 | 75.30 | |
| 4.73 | 188.08 | 0.545 | 4.46 | 4.34 | 0.263 | 20.08 | 0.97 | 2.79 | |
| 3.95 | 187.70 | 0.340 | 4.21 | 4.11 | 0.391 | 30.82 | 1.38 | 4.31 | |
| 3.95 | 187.70 | 0.424 | 4.13 | 4.03 | 0.391 | 42.07 | 1.77 | 5.68 |
| Target | W | -t | stat. err. | sys. err. | |||||
|---|---|---|---|---|---|---|---|---|---|
| GeV2 | GeV | GeV2 | GeV/c | GeV/c | |||||
| 2.11 | 28.20 | 0.172 | 3.22 | 2.84 | 0.554 | 100.26 | 4.31 | 11.57 | |
| 2.11 | 28.20 | 0.228 | 3.14 | 2.77 | 0.554 | 82.38 | 3.56 | 7.81 | |
| 3.99 | 28.87 | 0.404 | 3.94 | 3.37 | 0.256 | 12.90 | 3.32 | 1.58 | |
| 2.95 | 28.44 | 0.310 | 3.44 | 2.99 | 0.448 | 38.98 | 2.09 | 5.05 | |
| 1.11 | 27.79 | 0.077 | 2.78 | 2.49 | 0.502 | 401.69 | 15.79 | 53.74 | |
| 1.11 | 27.79 | 0.105 | 2.72 | 2.44 | 0.502 | 312.93 | 11.48 | 27.55 | |
| 2.07 | 28.21 | 0.186 | 3.21 | 2.82 | 0.267 | 82.96 | 10.66 | 10.93 | |
| 2.09 | 27.25 | 0.286 | 2.15 | 1.95 | 0.648 | 81.05 | 9.11 | 10.05 | |
| 4.57 | 29.41 | 0.458 | 4.54 | 3.81 | 0.261 | 9.44 | 1.86 | 1.18 | |
| 3.83 | 29.09 | 0.384 | 4.17 | 3.54 | 0.389 | 15.80 | 1.36 | 2.04 |
Appendix C
| Target | T | stat. | sys. | stat. | sys. | stat. | sys. | ||||||
|---|---|---|---|---|---|---|---|---|---|---|---|---|---|
| GeV2 | GeV/c | GeV/c | |||||||||||
| 1.1 | 2.8 | 0.23 | 0.50 | 0.98 | 0.02 | 0.03 | - | - | - | - | - | - | |
| 2.2 | 3.2 | 0.41 | 0.56 | 1.01 | 0.02 | 0.03 | - | - | - | - | - | - | |
| 3.0 | 3.4 | 0.56 | 0.45 | 0.99 | 0.02 | 0.04 | - | - | - | - | - | - | |
| 3.9 | 4.1 | 0.70 | 0.39 | 1.05 | 0.02 | 0.04 | - | - | - | - | - | - | |
| 4.7 | 4.4 | 0.79 | 0.26 | 1.03 | 0.03 | 0.04 | - | - | - | - | - | - | |
| 2.2 | 3.2 | 0.42 | 0.27 | 1.04 | 0.03 | 0.03 | - | - | - | - | - | - | |
| 4.0 | 3.9 | 0.71 | 0.25 | 1.07 | 0.04 | 0.04 | - | - | - | - | - | - | |
| 2.2 | 2.1 | 0.65 | 0.63 | 1.00 | 0.02 | 0.03 | - | - | - | - | - | - | |
| 1.1 | 2.8 | 0.23 | 0.50 | 0.67 | 0.01 | 0.02 | 0.68 | 0.01 | 0.02 | - | - | - | |
| 2.2 | 3.2 | 0.41 | 0.56 | 0.65 | 0.01 | 0.02 | 0.65 | 0.01 | 0.02 | - | - | - | |
| 3.0 | 3.4 | 0.56 | 0.45 | 0.68 | 0.02 | 0.03 | 0.68 | 0.02 | 0.03 | - | - | - | |
| 3.9 | 4.1 | 0.70 | 0.39 | 0.77 | 0.02 | 0.03 | 0.73 | 0.02 | 0.03 | - | - | - | |
| 4.7 | 4.4 | 0.79 | 0.26 | 0.70 | 0.03 | 0.03 | 0.69 | 0.03 | 0.03 | - | - | - | |
| 2.2 | 3.2 | 0.42 | 0.27 | 0.60 | 0.02 | 0.02 | 0.57 | 0.02 | 0.02 | - | - | - | |
| 4.0 | 3.9 | 0.71 | 0.25 | 0.68 | 0.03 | 0.03 | 0.64 | 0.03 | 0.03 | - | - | - | |
| 2.2 | 2.1 | 0.65 | 0.63 | 0.66 | 0.02 | 0.02 | 0.66 | 0.02 | 0.02 | - | - | - | |
| 1.1 | 2.8 | 0.23 | 0.50 | 0.49 | 0.01 | 0.02 | 0.50 | 0.02 | 0.02 | 0.73 | 0.02 | 0.03 | |
| 2.2 | 3.2 | 0.41 | 0.56 | 0.52 | 0.02 | 0.02 | 0.52 | 0.02 | 0.02 | 0.80 | 0.03 | 0.03 | |
| 3.0 | 3.4 | 0.56 | 0.45 | 0.57 | 0.03 | 0.02 | 0.57 | 0.03 | 0.02 | 0.83 | 0.05 | 0.03 | |
| 3.9 | 4.1 | 0.70 | 0.39 | 0.59 | 0.05 | 0.03 | 0.56 | 0.05 | 0.03 | 0.77 | 0.07 | 0.03 | |
| 4.7 | 4.4 | 0.79 | 0.26 | 0.71 | 0.14 | 0.03 | 0.69 | 0.14 | 0.03 | 1.01 | 0.20 | 0.04 | |
| 2.2 | 3.2 | 0.42 | 0.27 | 0.46 | 0.06 | 0.02 | 0.45 | 0.06 | 0.02 | 0.78 | 0.10 | 0.03 | |
| 4.0 | 3.9 | 0.71 | 0.25 | 0.70 | 0.16 | 0.03 | 0.66 | 0.15 | 0.02 | 1.03 | 0.24 | 0.03 | |
| 2.2 | 2.1 | 0.65 | 0.63 | 0.59 | 0.07 | 0.02 | 0.60 | 0.07 | 0.02 | 0.90 | 0.10 | 0.03 | |
| 1.1 | 2.8 | 0.23 | 0.50 | 0.45 | 0.01 | 0.01 | 0.46 | 0.01 | 0.02 | 0.67 | 0.01 | 0.02 | |
| 2.2 | 3.2 | 0.41 | 0.56 | 0.45 | 0.01 | 0.02 | 0.45 | 0.01 | 0.02 | 0.70 | 0.01 | 0.03 | |
| 3.0 | 3.4 | 0.56 | 0.45 | 0.43 | 0.01 | 0.02 | 0.44 | 0.01 | 0.02 | 0.64 | 0.02 | 0.03 | |
| 3.9 | 4.1 | 0.70 | 0.39 | 0.52 | 0.01 | 0.02 | 0.49 | 0.01 | 0.02 | 0.67 | 0.02 | 0.03 | |
| 4.7 | 4.4 | 0.79 | 0.26 | 0.53 | 0.02 | 0.02 | 0.51 | 0.02 | 0.02 | 0.75 | 0.04 | 0.03 | |
| 2.2 | 3.2 | 0.42 | 0.27 | 0.43 | 0.02 | 0.02 | 0.42 | 0.01 | 0.02 | 0.73 | 0.03 | 0.03 | |
| 4.0 | 3.9 | 0.71 | 0.25 | 0.51 | 0.02 | 0.02 | 0.48 | 0.02 | 0.02 | 0.75 | 0.04 | 0.03 | |
| 1.1 | 2.8 | 0.23 | 0.50 | 0.28 | 0.01 | 0.01 | 0.28 | 0.01 | 0.01 | 0.41 | 0.01 | 0.02 | |
| 2.2 | 3.2 | 0.41 | 0.56 | 0.29 | 0.01 | 0.01 | 0.28 | 0.01 | 0.01 | 0.44 | 0.01 | 0.02 | |
| 3.0 | 3.4 | 0.56 | 0.45 | 0.29 | 0.01 | 0.01 | 0.30 | 0.01 | 0.01 | 0.43 | 0.02 | 0.02 | |
| 3.9 | 4.1 | 0.70 | 0.39 | 0.34 | 0.01 | 0.02 | 0.32 | 0.01 | 0.01 | 0.44 | 0.02 | 0.02 | |
| 4.7 | 4.4 | 0.79 | 0.26 | 0.33 | 0.02 | 0.02 | 0.32 | 0.02 | 0.01 | 0.46 | 0.03 | 0.02 | |
| 4.0 | 3.9 | 0.71 | 0.25 | 0.31 | 0.03 | 0.02 | 0.29 | 0.03 | 0.01 | 0.46 | 0.05 | 0.02 |