CANGAROO-III Observation of TeV Gamma Rays from the vicinity of PSR B170644
Abstract
Observation by the CANGAROO-III stereoscopic system of the Imaging Cherenkov Telescope has detected extended emission of TeV gamma rays in the vicinity of the pulsar PSR B170644. The strength of the signal observed as gamma-ray-like events varies when we apply different ways of emulating background events. The reason for such uncertainties is argued in relevance to gamma-rays embedded in the off-source data”, that is, unknown sources and diffuse emission in the Galactic plane, namely, the existence of a complex structure of TeV gamma-ray emission around PSR B170644.
Subject headings:
gamma rays: observation — pulsar: individual (PSR B1706-44) — diffuse radiation1. Introduction
PSR B170644 is a young pulsar with a high spin-down luminosity, one of the gamma-ray pulsars detected by the EGRET instrument of the Compton Gamma Ray Observatory (Thompson et al.,, 1992). Detection of point-like gamma-ray emission of TeV gamma-rays was reported, using data of the CANGAROO-I telescope, at the position of the pulsar with a flux of cm-2 s-1 for gamma-ray energy 1TeV (Kifune et al., 1995), which was not pulsed in modulation with the pulsar period, and is thus likely, if the detection is valid, to be from a compact pulsar wind nebula associated with PSR B170644, similar to the case of the Crab nebula. This result was followed by the Durham Mark 6 telescope, which detected a flux of cm-2 s-1 at GeV (Chadwick et al., 1998). Observations with the CANGAROO-II telescope preliminarily reported the detection of a gamma-ray signal, which appeared to be somewhat broader than the point-spread function, of the telescope (Kushida et al., 2003).
In order to reduce background events and to improve the accuracy of the arrival direction, stereoscopic observations with a system of multiple Imaging Air Cherenkov Telescopes (IACTs) have now been put into operation as “second generation IACTs”, such as H.E.S.S. and VERITAS, as well as CANGAROO-III, and in addition, the MAGIC telescope of a large aperture of 17m diameter. The sensitivity to TeV gamma rays has been dramatically improved to uncover a number of TeV gamma ray-sources, more than 70 at the time of the 21st International Cosmic Ray Conference in 2007 hinton-rapporteur (Hinton 2007).
However, H.E.S.S. reported a null detection of point-like emission from the vicinity of PSR B170644, setting an upper limit of cm-2 s-1 for GeV (Aharonian et al., 2005a) at the center of the field of view. CANGAROO-III failed to confirm the signal, and obtained an upper limit of cm-2 s-1 for GeV on the point-like emission (Tanimori et al., 2005).
A number of Galactic sources of TeV gamma rays have been discovered through a scan survey of the Galactic disk by the H.E.S.S. Group (Aharonian et al., 2005b), and it is considered that pulsar wind nebulae (PWN) constitute one major class of the sources. A considerable number of those sources are found to exhibit extended emission, with its central position displaced from the pulsar position in some cases. It may also be the case for PSR B170644 that the pulsar is accompanied by a PWN of extended TeV gamma-rays, or that some unknown object of TeV gamma-ray emission exists in its vicinity without having any clear counterpart in other wavelengths, such as X-rays.
We still have a long way to go before the TeV gamma-ray signal from IACT will mature to become completely free from the background of cosmic ray particles, of which intensity outnumbers TeV gamma-rays by orders of magnitude. In order to reveal gamma-ray events as a prominent signal, it is required to subtract background events from the observed data and, for this purpose, to deduce the background events from a dataset which is considered not to contain gamma-ray events.
The H.E.S.S. scan survey of the Galactic disk has shown a broad, diffuse emission in the Galactic plane near the Galactic Center, when integrated over a solid angle of sr, having an intensity as large as the flux from the Crab pulsar nebula with its spectrum as hard as (Aharonian et al., 2006). This fact warns us that TeV gamma-ray emission may exist where no prominent objects are seen, and we have to be careful when we use events from an area in the Galactic disk to estimate the background.
Various ways for inferring the background events as well as for monitoring the variance of the observation conditions are used in different observations. For example, the observations of CANGAROO-I, -II, and -III consist of two kinds of separate observations of ON-source and OFF-source runs. The OFF-source observation, of which direction is selected to be more than 30o away from the source position, is utilized as the dataset for emulating the background in ON-source data. On the other hand, the H.E.S.S. group adopts the method of so-called wobble” and/or ring background”, in which the datasets for emulating background events are taken from off-source” directions of away from the source position within the common field of view of the ON-source observation”.
Presented in this paper is the result of CANGAROO-III observations of PSR B170644, obtained through analysis by utilizing two different methods for estimating the cosmic-ray background by (a) the OFF-source observation”, which is directed away from the Galactic plane, and (b) the wobble” and the ring background” method, which uses, for emulating background, the events coming from the directions along a ring-shaped region within the field of view of the ON-source run that contains the observation target near its center.
2. CANGAROO-III Stereoscopic System
The CANGAROO-III stereoscopic system consists of four IACTs located near Woomera, South Australia (31∘S, 137∘E). Each telescope has a 10-m diameter of a segmented reflector, consisting of 114 spherical mirrors made of FRP, i.e., fiber-reinforced plastic material (Kawachi et al., 2001), each of 80 cm diameter, mounted on a parabolic frame with a focal length of 8 m. The total area for light collection is 57.3 m2. The first telescope, T1, which has been operated as the CANGAROO-II telescope (Enomoto et al., 2002a), is not presently in use because of its smaller field of view than the others and a deterioration of the reflectivity of the plastic mirrors. The second, third, and fourth telescopes (T2, T3, and T4) were used for the observations reported in this paper. The camera and electronics system for T2, T3, and T4 and other details are given in Kabuki et al. (2003). The telescopes are located at the east (T1), west (T2), south (T3) and north (T4) corners of a diamond shape with its sides of 100 m (Enomoto et al., 2002b).
3. Observations
The observations of PSR B170644 were carried out during the period between Jul 11 and 19 in 2004 and between Apr 14 and Jun 15 in 2007. During the ON-source runs in 2004, the center of the field of view of the telescope was set at right ascension =257.4o and declination [J2000], i.e., the position of PSR B170644. In 2007, the wobble mode” (Daum et al., 1997) was adopted, i.e., the pointing position of each telescope was displaced from PSR B170644 in declination by , and was changed every 20 minutes to be set alternatively at or at from . It is noted that we have a merit, in the wobble mode observation, to enlarge the effective field of view of the telescope and to average the response of the photomultiplier camera which fluctuates from pixel to pixel.
Listed in Table 1 are the directions pointed by the telescope during the OFF-source runs as well as the date when each run was conducted.
| Date | Offset | R.A. | |||
|---|---|---|---|---|---|
| YYYY/MM/DD | degree | degree | degree | degree | degree |
| 2004/Jul/11 | 0 | 243.89 | -44.48 | 336.75 | 4.57 |
| 2004/Jul/13 | 0 | 311.14 | -44.48 | 356.17 | -38.35 |
| 2004/Jul/14 | 0 | 334.43 | -44.48 | 353.19 | -54.79 |
| 2004/Jul/17 | 0 | 334.13 | -44.48 | 353.29 | -54.58 |
| 2004/Jul/18 | 0 | 331.53 | -44.48 | 354.10 | -52.79 |
| 2004/Jul/19 | 0 | 334.97 | -44.48 | 353.00 | -55.16 |
| 2007/Apr/14 | +0.5 | 227.69 | -43.98 | 327.79 | 12.06 |
| 2007/Apr/14 | -0.5 | 227.69 | -44.98 | 327.26 | 11.20 |
| 2007/Apr/15 | -0.5 | 213.00 | -44.98 | 317.59 | 15.58 |
| 2007/Apr/15 | +0.5 | 213.00 | -43.98 | 317.92 | 16.53 |
| 2007/Apr/16 | -0.5 | 212.30 | -44.98 | 317.10 | 15.73 |
| 2007/Apr/16 | +0.5 | 212.30 | -43.98 | 317.42 | 16.68 |
| 2007/Apr/17 | -0.5 | 206.97 | -44.98 | 313.31 | 16.74 |
| 2007/Apr/17 | +0.5 | 206.97 | -43.98 | 313.55 | 17.72 |
| 2007/Apr/17 | +0.5 | 204.97 | -43.98 | 312.07 | 18.02 |
| 2007/Apr/17 | -0.5 | 204.97 | -44.98 | 311.87 | 17.04 |
| 2007/Apr/19 | -0.5 | 209.80 | -44.98 | 315.33 | 16.25 |
| 2007/Apr/19 | +0.5 | 209.80 | -43.98 | 315.62 | 17.21 |
| 2007/Apr/21 | +0.5 | 197.26 | -43.98 | 306.29 | 18.77 |
| 2007/Apr/21 | -0.5 | 197.26 | -44.98 | 306.21 | 17.77 |
| 2007/Apr/22 | -0.5 | 202.25 | -44.98 | 309.89 | 17.38 |
| 2007/Apr/22 | +0.5 | 202.25 | -43.98 | 310.05 | 18.36 |
| 2007/May/12 | -0.5 | 237.43 | -44.98 | 332.96 | 7.24 |
| 2007/Mar/12 | +0.5 | 237.43 | -43.98 | 333.60 | 8.02 |
| 2007/May/15 | +0.5 | 197.43 | -43.98 | 306.41 | 18.76 |
| 2007/May/15 | -0.5 | 197.43 | -44.98 | 306.33 | 17.76 |
| 2007/May/16 | -0.5 | 189.93 | -44.98 | 300.76 | 17.84 |
| 2007/May/16 | +0.5 | 189.93 | -43.98 | 300.71 | 18.83 |
| 2007/May/17 | +0.5 | 221.18 | -43.98 | 323.56 | 14.30 |
| 2007/May/17 | -0.5 | 221.18 | -44.98 | 323.12 | 13.40 |
| 2007/May/20 | +0.5 | 214.93 | -43.98 | 319.28 | 16.06 |
| 2007/May/20 | -0.5 | 214.93 | -44.98 | 318.92 | 15.13 |
| 2007/May/20 | +0.5 | 279.93 | -43.98 | 351.48 | -16.50 |
| 2007/May/20 | -0.5 | 279.93 | -44.98 | 350.51 | -16.87 |
| 2007/May/21 | +0.5 | 227.43 | -43.98 | 327.62 | 12.16 |
| 2007/May/21 | -0.5 | 227.43 | -44.98 | 327.10 | 11.30 |
| 2007/May/21 | +0.5 | 282.43 | -43.98 | 352.16 | -18.18 |
| 2007/May/21 | -0.5 | 282.43 | -44.98 | 351.18 | -18.53 |
| 2007/Jun/13 | +0.5 | 219.93 | -43.98 | 322.72 | 14.68 |
| 2007/Jun/13 | -0.5 | 219.93 | -44.98 | 322.29 | 13.78 |
| 2007/Jun/13 | -0.5 | 288.63 | -44.98 | 352.64 | -22.69 |
| 2007/Jun/13 | +0.5 | 288.63 | -43.98 | 353.68 | -22.41 |
| 2007/Jun/14 | -0.5 | 220.08 | -43.98 | 322.83 | 14.64 |
| 2007/Jun/14 | -0.5 | 220.08 | -44.98 | 322.40 | 13.73 |
| 2007/Jun/14 | -0.5 | 288.86 | -44.98 | 352.69 | -22.85 |
| 2007/Jun/14 | +0.5 | 288.86 | -43.98 | 353.73 | -22.57 |
| 2007/Jun/15 | +0.5 | 220.08 | -43.98 | 322.83 | 14.64 |
| 2007/Jun/15 | -0.5 | 220.08 | -44.98 | 322.40 | 13.73 |
| 2007/Jun/15 | -0.5 | 288.86 | -44.98 | 352.69 | -22.85 |
| 2007/Jun/15 | +0.5 | 288.86 | -43.98 | 353.73 | -22.57 |
Each night was divided into two or three series of observation modes, such as ON–OFF”, OFF–ON–OFF”, or OFF–ON” observations. The ON-source run was scheduled to contain the meridian passage of the target, and the OFF-source run to follow the zenith angle distribution of the ON-source observation. On the average, the OFF source region had an offset in the R.A. of more than 30∘ away from the target.
In the 2004 observation, the data of each telescope of T2, T3 and T4 were recorded with GPS time stamps, independently from the other telescope, when more than four photomultiplier (PMT) signals exceeded 7.6 p.e.(photo-electrons) in each telescope. In the stage of offline analysis, the GPS time was used as a token to find coincidence events for the three telescopes. In the 2007 observation, a trigger circuit was employed into the electronics system (Nishijima et al., 2005) so that the events of more than two telescopes in coincidence were selected to be recorded.
The total efficiency of light collection, including the reflectivity of the segmented mirrors, the light guides, and the quantum efficiency of the photomultiplier tubes, was monitored by “muon-ring analysis” of the Cherenkov lights radiated by cosmic-ray muons (Enomoto et al., 2006a), during the period of the observation. The deterioration ratios of the reflectivity relative to the initial value when the mirrors were made were measured to be 0.55, 0.60, and 0.75, for T2, T3, and T4, respectively, in 2004. The telescope T4 was built recently, and show the highest value of reflectivity. The deterioration rate was found to be slightly higher than the 10% level per year. Before the 2007 observation was commenced, mirror cleaning work using water was carried out. The reflectivity was, however, not recovered to the initial value. The reflectivity of T2 became too low to be known as being available from the calibration data of the muon ring. The two-fold coincidence data (i.e., T3 and T4) were used in the 2007 analysis.
We selected those events in which the images of the Cherenkov light consisted of at least five adjacent pixels exceeding the 5 p.e. threshold (called the cluster events”). For the 2004 runs, the frequency of the three-fold coincidence was 810 Hz, giving the rate of the cluster events as 67 Hz. In 2007, the two-fold coincidence between T3 and T4 gave a trigger rate of 1214 Hz, which was reduced to 67 Hz for the cluster events. A cloud in the sky caused a low trigger rate when it blocked the direction of the telescope pointed, and events during the time of such a low-rate trigger were excluded from the analysis. The effective observation times for the 2004 and 2007 observations were 996 (998) and 2187 (2386) minutes, respectively, where the time for an OFF-source run is shown in parentheses. The mean of the zenith angle of the data used for the analysis was 19.8∘ and 18.6∘, respectively.
4. Method of Analysis
Since the ON-source run sees the Galactic plane and the OFF-source direction is away from the plane, as described in Table 1, the amount of night sky background (NSB) light differs between the ON- and OFF-source data. The region of the sky for the ON-source run is brighter than the OFF case. This may cause a spurious effect of having excess events created by star light along the Milky Way, when we subtract the number of OFF-source events from ON-source ones.
The NSB affects the distribution of ADC (Analog to Digital Converter) counts in the electronics circuit, and in turn, the degree of NSB is monitored in each observation run. Darker NSB in an OFF-source observation can be corrected for” to match the NSB in the case of ON-source run, by applying the method of software padding” (Cawley, 1993) to add extra background light onto the photomultiplier tubes of OFF-source data. We applied a somewhat simplified software padding, when compared with the method developed by the Whipple group(Cawley, 1993). Extra background lights of a common shape of Gaussian fluctuation are added to ADC data of all PMTs for all OFF-source data in common. This padding procedure was applied only to the PMTs of having a signal of TDC (Time-to-Digital Converter) hit, since the CANGAROO-III analysis method requires TDC timing information.
The effect that may be caused by adding more NSB as an artifact to the pixels of the photomultiplier tubes was studied by a Monte-Carlo simulation. It was not easy to precisely estimate and correct for the effects. However, the spurious excess events could be made not to be effective by raising the threshold for discriminating the Cherenkov light signal in each pixel of the camera. We applied a threshold of as high as 8 or 10 p.e. for 2004 or 2006 data, respectively, to each photomultiplier pixel of the clustering Cherenkov light image.
The analysis procedures used in this work were basically the same as those described in Kabuki et al. (2007), but with more details to be found in Enomoto et al. (2006a) and Enomoto et al. (2006b). As the first step, the Hillas parameters of a Cherenkov light image (Hillas, 1985) were calculated for three or two telescopes. The arrival direction was determined by the condition of minimizing the sum of the squared widths (; weighted by the photon yield) of the images seen from the assumed arrival position, in addition by putting a constraint on the from the arrival position to the center of image.
As a measure of gamma-ray likeliness of each event, we used the Fisher Discriminant (hereafter called as ) (Fisher, 1936; Enomoto et al., 2006a), which is given by a linear combination of the input parameters, as
The coefficients were chosen to realize the best separation between the gamma-ray and background events, where is a component of vector, or , each of being the energy-corrected or observed with telescopes T2, T3, and T4; for details see a reference (Enomoto et al., 2006a). We excluded from analysis those events in which the photomultiplier pixels in the outermost layer of the camera were hit by photons (edge cut”), because the image of Cherenkov light of the events was deformed, particularly in the distribution of the parameter.
We estimated the response function, , of for gamma-rays from a Monte-Carlo simulation, and obtained the function for background events from the distribution of the OFF-source data. Note that the energy spectrum proportional to was used for gamma-rays in the Monte-Carlo simulation, where is gamma-ray energy and =2.1. Then, the observed distribution, , as a function of for ON-source data was equated to a linear combination of and , as
The number of background and gamma-ray events contained in the ON-source data were designated as and , and were determined by fitting the distribution of the ON-source data to under the condition of , where is the total number of events of the ON-source data. The functions and represent the distribution of the background and gamma-ray events with the total number of and , respectively.
The response function ( and ) depends on its location in the field of view of the telescope, and thus a fitting for ON-source data by the sum of contributions from and was carried out for every arrival direction investigated, within the field of view of the telescope. This way of inferring , the number of gamma-ray events, was adopted when we used the method (a).
The method (a) of inferring by fitting the distribution was applied to the data of CANGAROO-III, to bring about the detection of gamma-ray signals successfully from point-like sources (Sakamoto et al.,, 2007; Nakamori et al,, 2007) as well as from a source of considerable extension (Enomoto et al., 2006b), and also to set upper limits on gamma-rays from other objects (Kabuki et al., 2007; Enomoto et al., 2007). Note that with this method of fitting , it was not required to normalize the number of events by the observation time, in the case that the observation times of ON- and OFF-source runs were different from each other.
A Monte Carlo simulation shows that gamma-ray events are likely to have larger than , which is consistent with the gamma-ray candidate events extracted from the observation data by using method (a), as is presented in the next section. The events of larger than were selected as gamma-ray enriched ones in the case of method (b): the wobble and ring background method.
5. Results with the method of ON and OFF runs: Method (a)
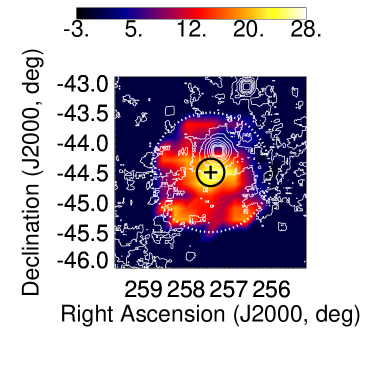
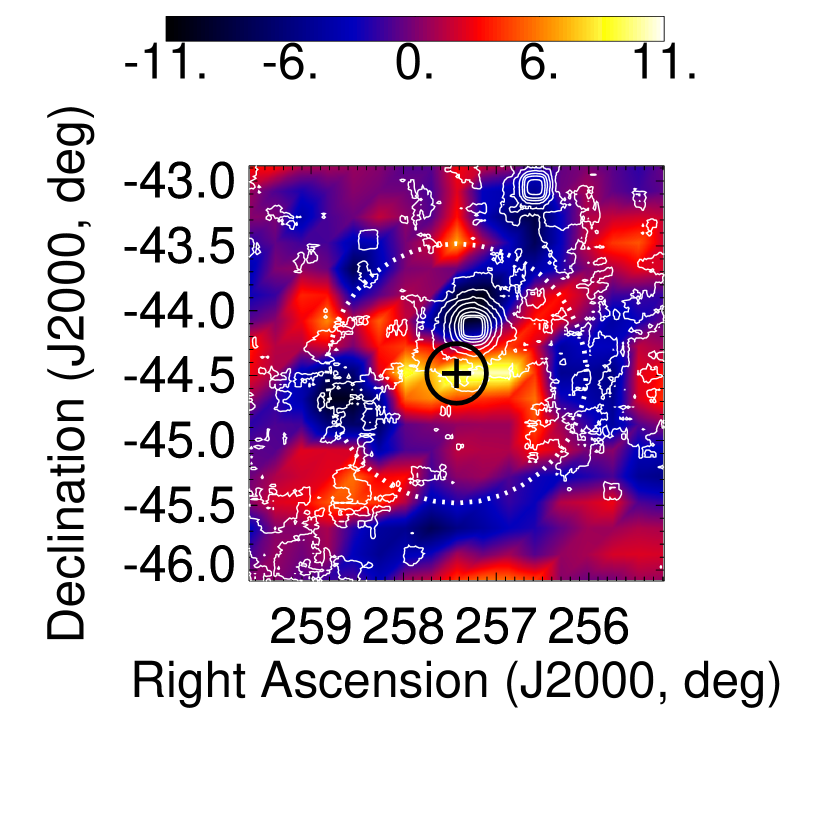
The arrival directions in the equatorial coordinate (J2000) of observed events were sorted into 19 19=361 cells with each having a 0.2o 0.2o size in a field of view of . For each cell of the arrival direction, the distribution of ON- and OFF-source runs was constructed to yield the parameter , i.e. the number of gamma-ray events, giving a map of gamma-ray-like events of the 2004 data, as plotted in Fig. 1.
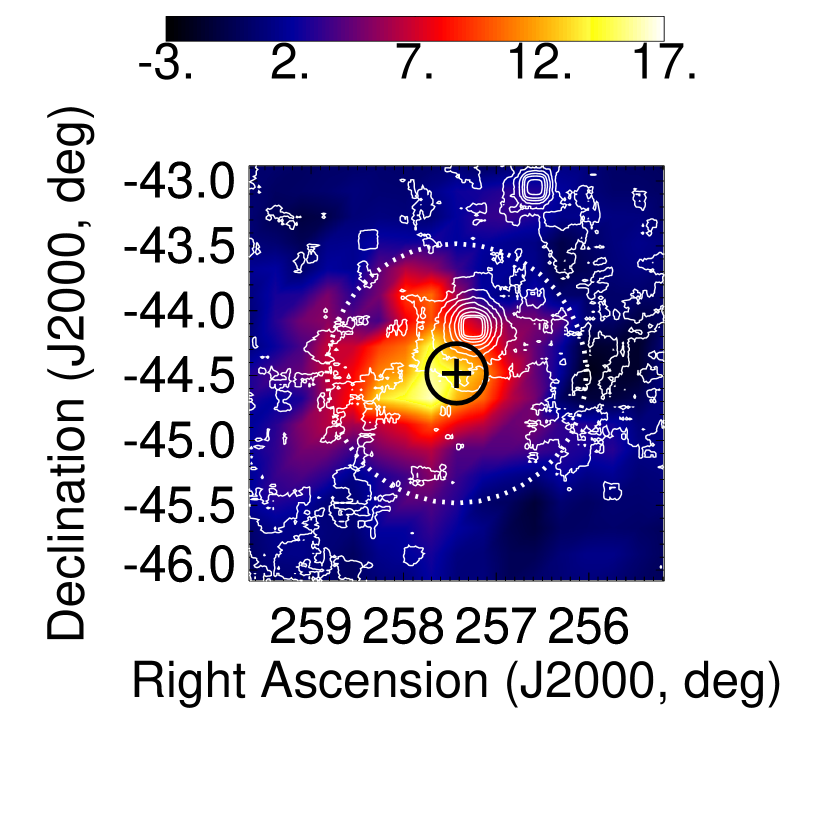
Smoothing of taking the average of the neighboring 3 3 cells was carried out for each investigated direction in the morphology map of the figure. The black cross at the center of the map indicates the position of the pulsar PSR B170644, the radius of the black circle shows the point spread function (PSF) of , and the circle drawn with the white dotted line shows the region within distance from the pulsar. The white contours are the ROSAT hard X-ray map taken from NASA Skyview (NASA, 2007).
The excess, which is much larger than the statistical fluctuation of events per 0.2o 0.2o area, shows a broader distribution than the point spread function. No prominent point-like excess appears either at the position of the pulsar PSR B1706-44 or at any other directions in the vicinity of the pulsar, which is consistent with the H.E.S.S. observation (Aharonian et al., 2005a) of no detection of point-like emission from the pulsar PSR B170644.
The distribution of the observed events within a radius of 1.0o from PSR B170644 is shown in Fig. 2.
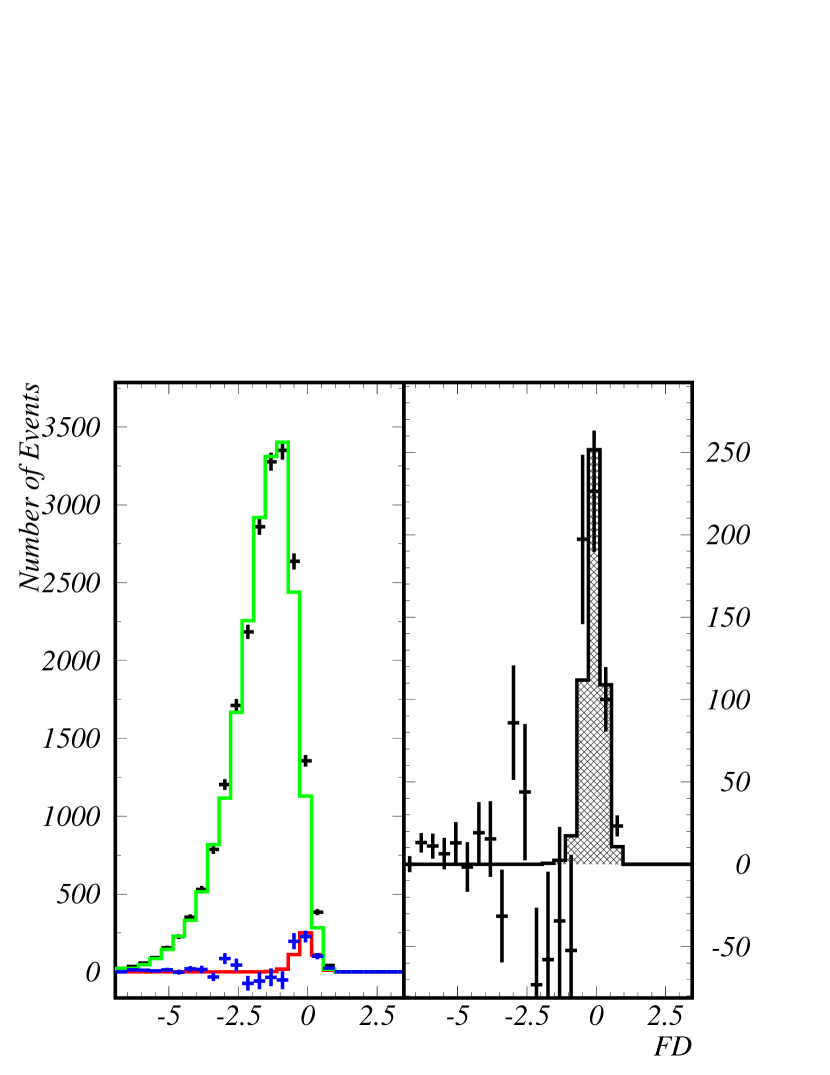
The number of events of the ON-source data (the black cross) exceeds the distribution of the OFF-source events (the green histogram) around . The excess events, , indicated by the blue cross concentrate in to , is consistent with the gamma-ray distribution, , inferred from the Monte-Carlo simulation and shown by the blue histogram. The right panel shows a magnified view of and . The number of excess deduced is 504 82 (6.1 ).
The map of Fig. 1 might give an impression that the angular extent of the extended emission observed can be definitely determined to be as large as . However, we have a difficulty to make a conclusive argument about the angular extent beyond , since the effective” field of view of our observation was limited to within about 1o (half of the camera radius), due to the effect that a Cherenkov light image is deformed when a part of it is located near the outer edge of the camera. In order to estimate the angular extent of the excess events, we plotted in the top panel of Fig. 3 the distribution of gamma-ray-like events versus , where is the angular distance of the arrival direction of each event from the black cross at the center of the map, the position of PSR B170644.

The detection efficiency as a function of the angle from the center of the field of view was estimated by a Monte-Carlo simulation, and also by using the number of gamma-ray-like events of in an OFF-source run. As presented by the plot in the middle panel of Fig. 3, the efficiency decreases with , due mainly to the edge cut”. The acceptance of detection differs slightly between the 2004 and 2007 year observations, as shown by Fig. 4. The acceptance for the 2007 data (the solid line) is wider than

the 2004 one (the dashed line), due to the two-fold analysis for 2007 data when compared with the case of the three-fold analysis for 2004 data.
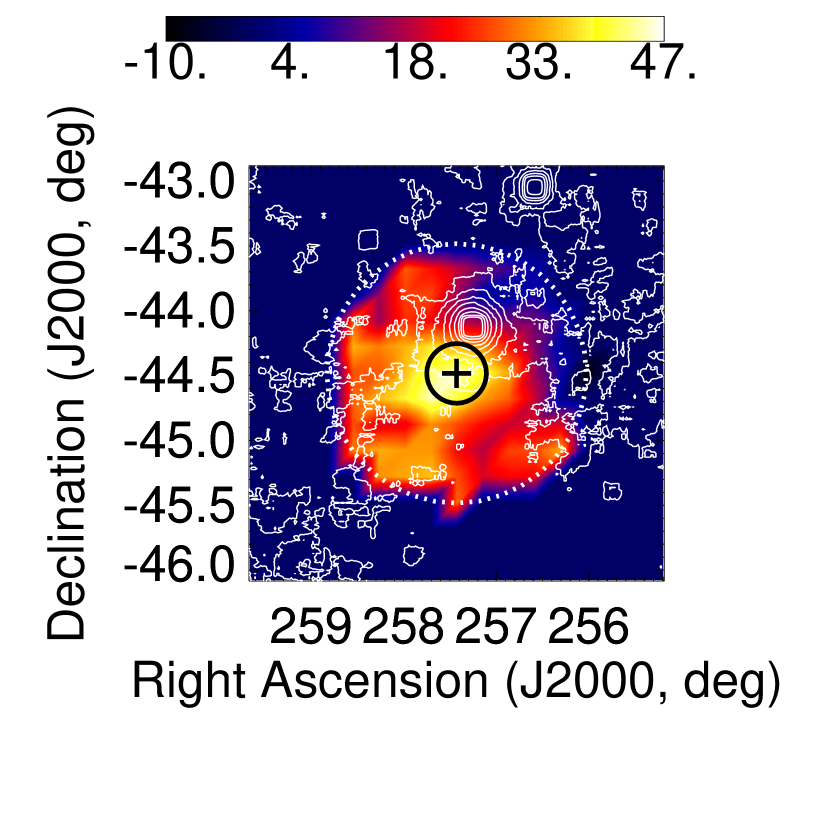
The distribution, after being corrected for the detection efficiency, is shown in the bottom panel of Fig. 3. A correction for the acceptance was also applied to the morphology map of Fig. 1, and is presented in Fig. 5.
We limited the plot of data in this figure to be within a region, less than 1o from PSR B170644. The acceptance decreases with rapidly outside of , and the data seriously suffer from statistical fluctuation and systematical error at
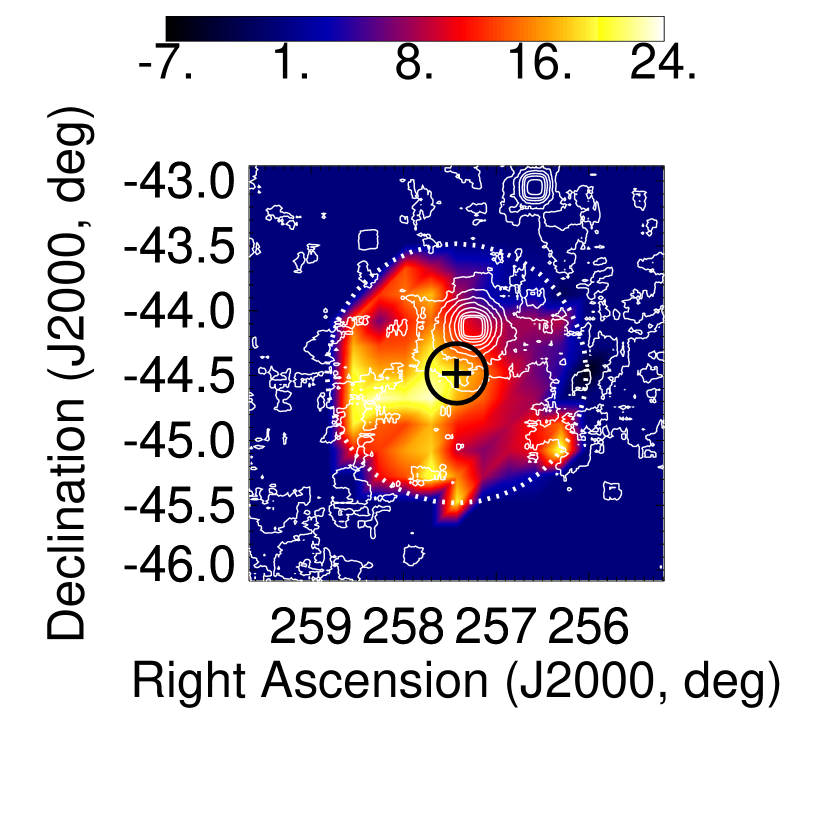
The result from data taken in 2007 is shown in Fig. 6, the distribution is in the left panel and the morphology map of the arrival direction is in the right,
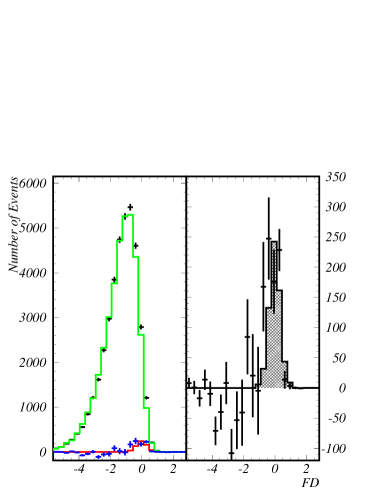
the number of gamma-ray-like events of the ON-source over the OFF-source runs is 627 127 events for the region within (5.1 ).
The plot from the combined data of years 2004 and 2007 after the acceptance correction is shown in Fig. 7.

The /d.o.f value (the chi-square value per degree of freedom) calculated for flat distribution, i.e. the case of constant excess counts against , is 16.8/7. When we fit the distribution by a test function 1-/a from the pulsar position, the best fit for the observed distribution was obtained when with /d.o.f. = 3.7/6. In the case of fitting by a Gaussian function , the /d.o.f value was 4.0/6, with . Fitting was also made for the case of constant value plus Gaussian function”, i.e. , yielding results of , , and with /d.o.f equal to . A morphology map for the combined data of years 2004 and 2007 after the acceptance correction is shown in Fig. 8.
The flux integrated within from PSR B170644 is plotted in Fig. 9 against gamma-ray energy .
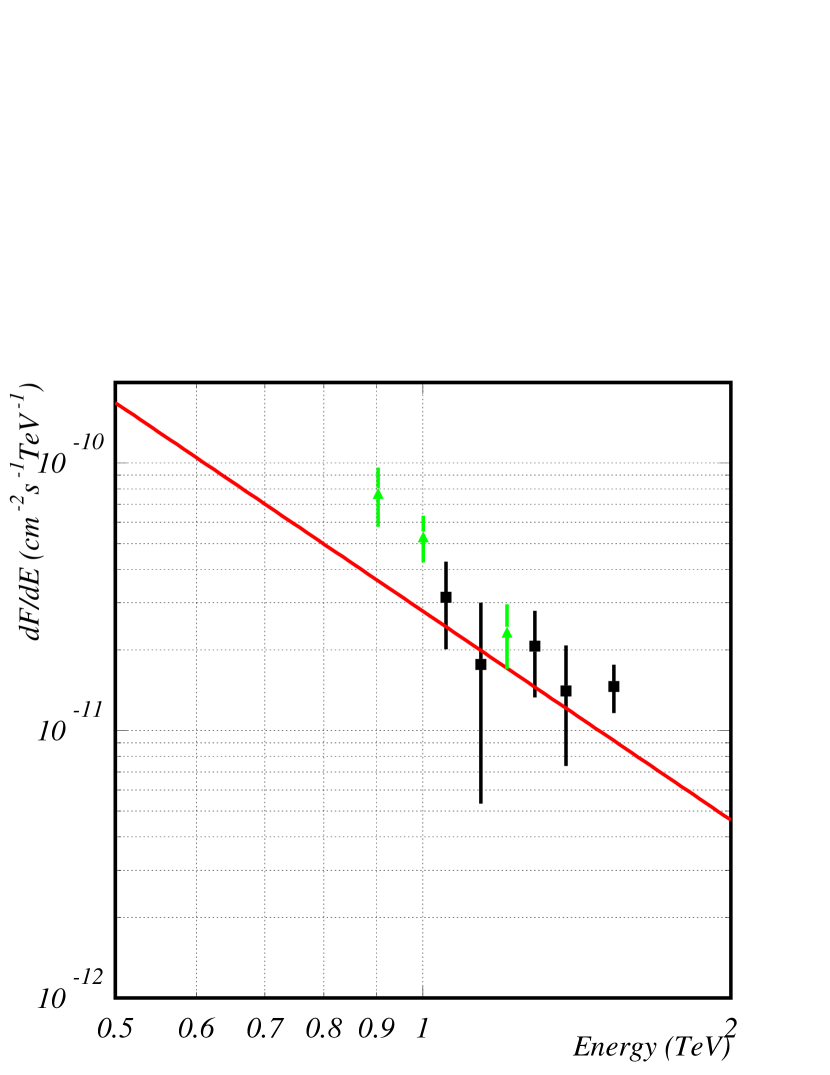
The green points indicate the 2004 data and the black ones the 2007 data, respectively, with the error bars showing the statistical fluctuation. The flux of the Crab Nebula, reported by HEGRA (Aharonian et al., 2000), is shown by the red line for a comparison. The flux is given numerically as a function of in Table 2.
| Epoch | E | dF/dE | (dF/dE) |
|---|---|---|---|
| year | TeV | 10-11cm-2s-1TeV-1 | 10-11cm-2s-1TeV-1 |
| 2004 | 0.904 | 7.7 | 1.9 |
| 1.00 | 5.3 | 1.0 | |
| 1.21 | 2.3 | 0.6 | |
| 2007 | 1.05 | 3.1 | 1.1 |
| 1.14 | 1.8 | 1.2 | |
| 1.29 | 2.1 | 0.7 | |
| 1.38 | 1.4 | 0.7 | |
| 1.54 | 1.5 | 0.3 |
In addition to our standard systematic errors such as on energy determination (photon collection efficiencies), we investigated the possibility of systematic difference of (gamma-ray likeliness) between two data obtained in different pointings. The and (image parameter) have a dependence on the elevation angle. The image becomes smaller in smaller elevation. Without any correction, the response of for background events in the ON observation sometimes differ from that of the OFF. This is mainly due to the difference in the ON/OFF distributions of the elevation angle. After a correction, however, this systematic error is reduced which was proved by the analysis of the off-Galactic-Plane data. The systematic error level is considered to be less than 5%. The bright optical lights along the Galactic plane can deform the image parameters. We checked the responses by increasing NSB in the Monte-Carlo simulations and the OFF data (by software padding). When NSB increases, small sized images which look like gamma-ray images increase. These images can be rejected by increasing the threshold of pixel. This is a reason why we used 10 p.e. threshold while the standard analysis used 5 p.e. We increased NSB amount and/or decrease this pixel threshold and check the differences in the obtained gamma-ray fluxes. We, however, found that the main systematic error are due to NSB. The flat component observed in this analysis still remain to be statistically significant even in the worst case. The fluctuations in the observed flux changes approximately 30% level. Our claim for the flat component is, therefore, marginal. The resulting uncertainties in gamma-ray fluxes is +47, and -37%.
6. Results with Wobble and the Ring Background Method: Method (b)
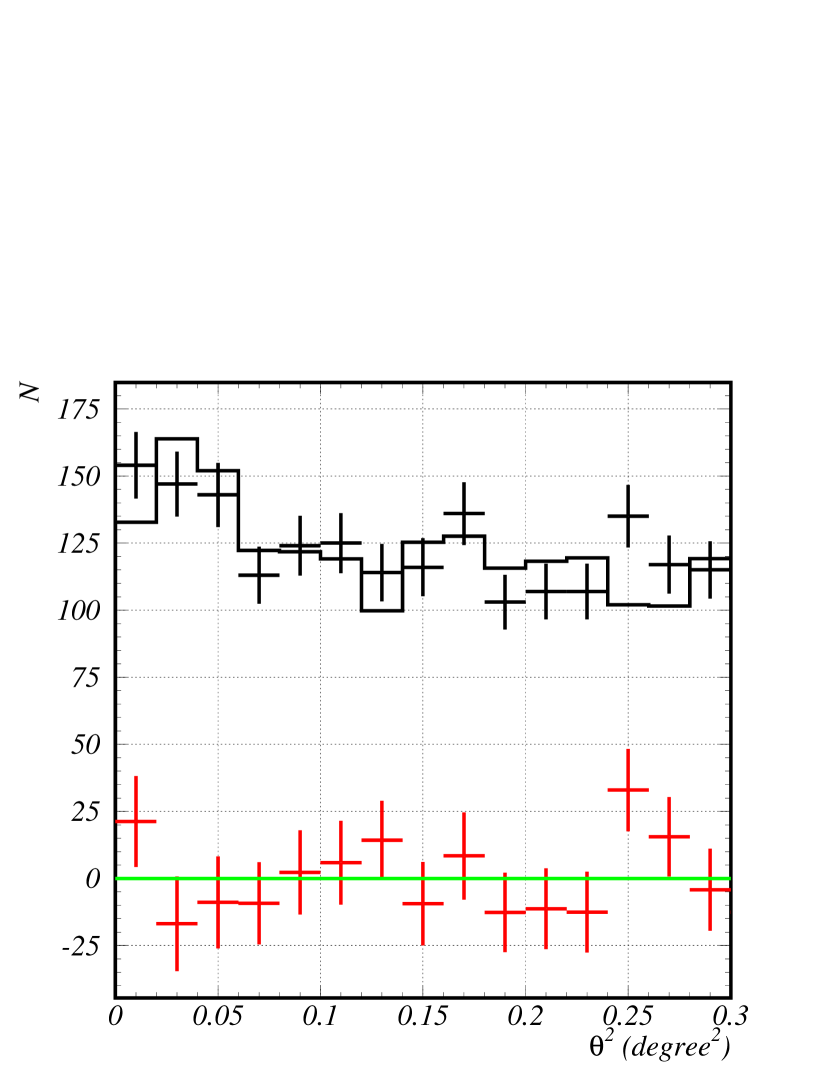
To the 2007 data, which were taken in the wobble mode observation, the wobble” and the ring background method” can be directly applied in a way similar to what is used by the H.E.S.S. Group. The arrival directions along the circumference of its radius equal to from the center of the field of view are guaranteed to have the same, uniform detection efficiency. Along the circle of , six points that are successively at every of the opening angle around the center of the field of view were selected as the central points of for calculating the distribution of Fig. 10, where is the angular distance from PSR B170644. One of the six points corresponds to the center of ON-source” directions, i.e. at the position of PSR B170644. The other five points were utilized as the off-source direction” for emulating background events. The events of having were selected as gamma-rays enriched events, and then the numbers of events from ON-” and off-source” directions were compared for estimating the flux of gamma-rays as a function of . We call this method of using the circle of radius as method (b1).
Fig. 10 shows the distributions from the 2007 data by taking the events of .
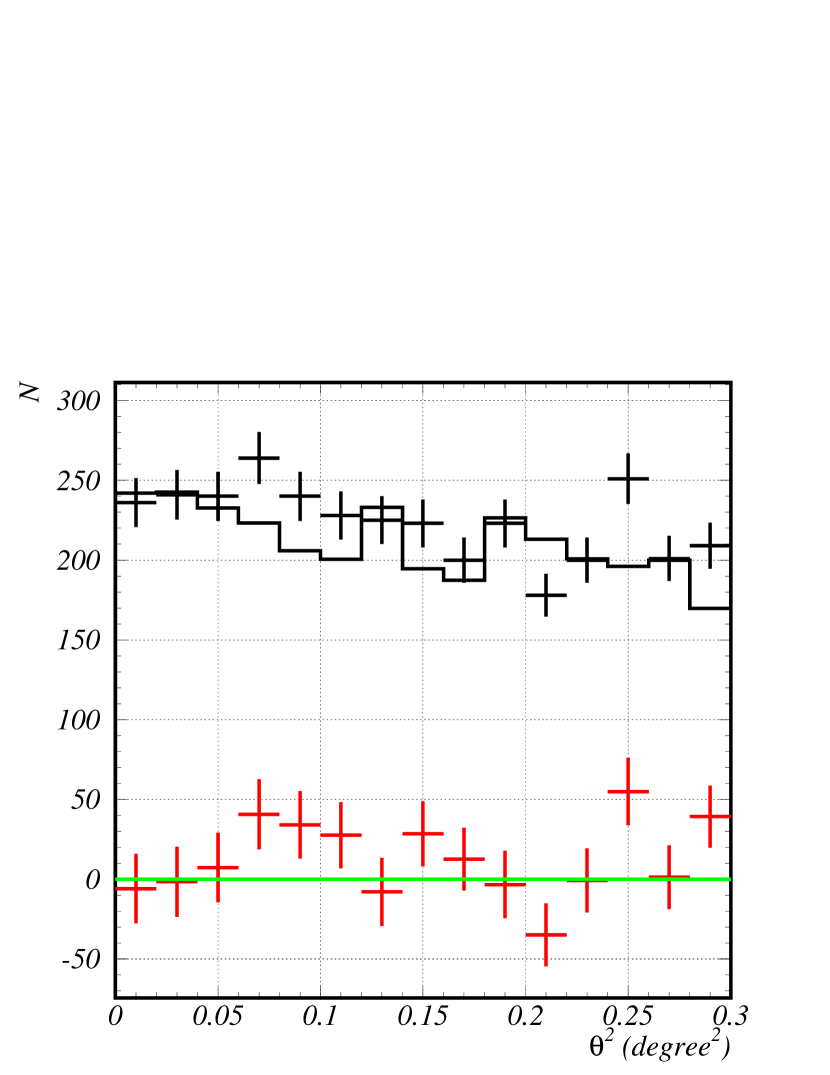
When the cut degree2 was applied to the observed distribution, as matched to the point-spread function, the excess was below 100 events, giving the upper bound of the flux roughly lower than the level of 20% Crab.
To the 2004 data, method (b1) could not be directly applied, because the points along the circumference of radius, on which the direction of PSR B170644 is located, did not have a constant, uniform efficiency of acceptance. It was necessary to correct for the varying acceptance by using a Monte-Carlo simulation. The distribution, after the number of events was corrected for is shown in Fig. 11.
There appears to be no statistically significant evidence of point-like gamma-ray emission. The upper limit was set at the position of the pulsar PSR B170644 to be less than 20% Crab flux.
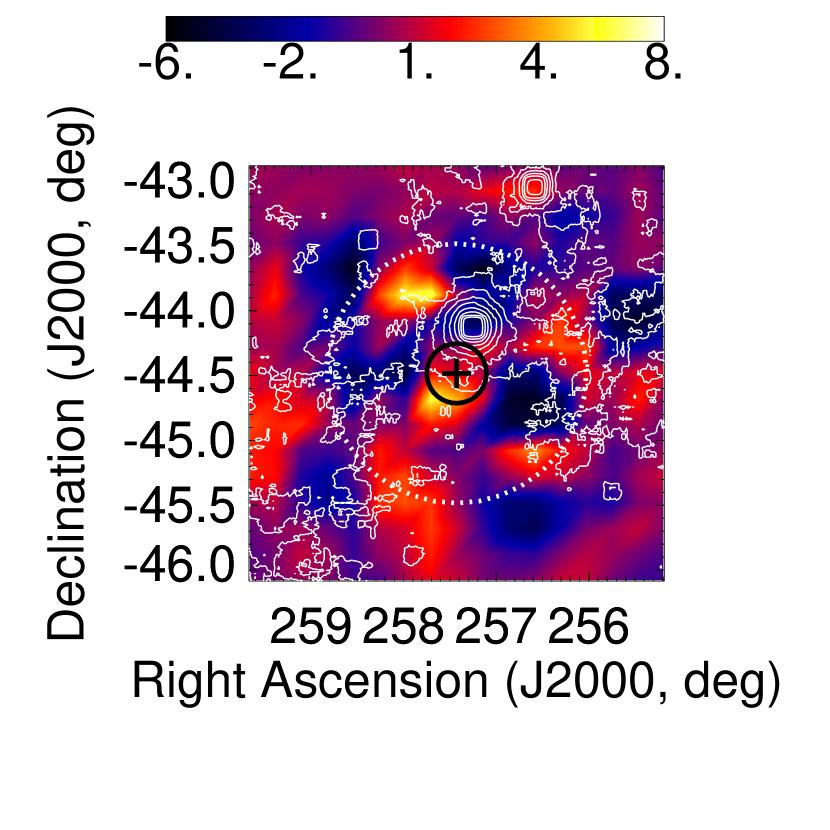
For constructing a morphology map, we used 19 19 histograms of ON-source data, each of which was constructed from the events falling in a 0.2o 0.2o area, within the field of view of . The background was estimated from those events, of which the arrival direction is at distance from the investigated direction, namely within a ring-shaped region between and from the investigated direction. We call this way of estimating background events method (b2) of the ring background. It is noted that this method differs slightly from the H.E.S.S. method”, in using different values for some parameters such as the angular width. Background subtraction was then carried out after an acceptance correction. A map of excess events is plotted in Fig. 12.
The distribution of excess events is consistent with the statistical fluctuation, with no indication of point-like source seen. The result of applying method (b2) to the 2004 data is presented in Fig. 13.
No prominent excess appears beyond the statistical fluctuation in the morphology map around PSR B1706-44.
7. Discussions
The method (a) of having two separate observations of ON- and OFF-source runs has indicated emission of TeV gamma-rays from an extended region around the pulsar PSR B170644. On the other hand, method (b) of either the wobble or the ring background method, which is based on the subtraction of background events by using the neighboring region displaced by an angular distance of , could not confirm the result by method (a). The excess observed from method (b) is consistent with the statistical fluctuation, although arguments could be made about some spatial correlation that may exist in the morphological map of excess counts.
The two differing results obtained through the two methods, both of which were applied to the same ON-source data, can, however, be understood as not in contradiction with each other, if we admit that gamma-ray events are contained in the dataset which is utilized for emulating background events.
As can be seen in Fig. 2, the candidate events for gamma-rays are only 2% of the total number of ON-source events. Such a small ratio of the signal-to-noise demands us to subtract from the ON-source data such events that are emulated from observed data containing presumably no gamma-ray events and are regarded as being equivalent to background events in the ON-source data. However, if a considerable amount of gamma-ray events are included in the dataset for emulating background, the subtraction can diminish and even kill a gamma-ray signal that may exist. Such a chance may be more likely to occur in method (b) than in the case of method (a) of using the data from the region off the Galactic disk.
Diffuse gamma-rays from the Galactic disk should be subtracted to determine the genuine intensity of individual sources, and thus the method (b) might be preferable to measure the flux from a source embedded in the Galactic disk. In fact, the diffuse gamma rays from the Galactic disk is expected to have a flux as large as cm-2s-1TeV-1sr-1 at 1TeV, when extrapolated from the 10 GeV energy region, or taking the case of the Galactic Center region (Aharonian et al., 2006). Our result for the flux within an area of radius is cm-2s-1, as large as the intensity of the Crab nebula. The flux , when integrated over solid angle of a sr, amounts to cm-2s-1TeV-1, which is equivalent to 0.01 0.1 of the flux from the Crab nebula. This intensity is similar to the flux from Galactic sources that the scan survey of the Galactic plane uncovered (Aharonian et al., 2005b).
If the emission from the Galactic disk is adequately uniform, or in other words, if the characteristic angular scale of variance of the disk emission is larger than the angular width, , of the field of view of telescope and the angular size of gamma-ray source, method (a) works to overestimate the flux by an amount of . In this context, method (b) can be trusted to yield the correct” flux, though it tends to be affected by neighboring sources to give a lower flux.
When the wobble and ring background method (b) are utilized, the size of the gamma-ray emission, , is presumed to be less than the radius of the ring. The condition for method (b) being useful can be expressed as . It might be said, in this context, that the angular resolution and the field of view of our observation is not very appropriate, namely, not good or wide enough, to clarify the morphological structure peculiar to the vicinity of PSR B170644 by using method (b).
In principle, and also in actual cases, it is neither easy nor clear to strictly distinguish the emissions of the Galactic disk and the individual objects from each other. The emission from the Galactic disk is likely to have a granular structure”, which is caused by: the spatial distribution of energetic electrons with short lifetime by cooling, an irregular magnetic field of varying strength, complex distribution of the matter density of molecular clouds, the diffusion process of cosmic rays escaping from the acceleration site, and so on. Thus, the structure of the disk emission of gamma-rays is considered to have a variety of spatial scales, varying from place to place, depending on the local environmental conditions of the Galactic disk.
The granular structure” of the disk emission possibly lead us to erroneous conclusions, such as confusion concerning the source position, incorrect estimation of angular size of the extended sources, or spurious detection of point-like sources etc., which are influenced also by the performance of the telescope in use and, in particular, by the scale size of the granularity” . The energy spectrum of the obtained gamma-ray flux can also be affected by the gamma-rays in the background data.
8. Conclusion
Observations for about 50 hours with CANGAROO-III telescope system have given an indication of extended emission of TeV gamma rays around the pulsar PSR B1706-44. The strength of the signal depends on how we estimate angular size of the extended emission. The total flux at 1 TeV is cm-2s-1TeV-1, when integrated for incident angles within a circle of radius. This corresponds to cm-2s-1TeV-1sr-1 in unit of per solid angle”. After integration of the gamma-ray energy, , it is 2.2 10-11 cm-2s-1 for 1TeV, which is as large as the Crab flux of 1.8 10-11 cm-2s-1.
The intensity within the area corresponding to the point spread function, from PSR B170644, is cm-2s-1 for gamma-ray energy 1 TeV. The flux corresponds to % of the Crab flux at 1 TeV, setting constraint on the emission from a compact source, which may underlie below the extended emission. The relative excess of this region compared with that of is % Crab.
On the other hand, a statistically significant result could not be obtained from method (b) of the wobble and ring background analysis. The 2 upper limit on the emission within radius from PSR B170644 is cm-2s-1 at 1 TeV, which corresponds to 10% of the Crab flux at 1 TeV.
The extended emission with method (a), together with the result using method (b), suggests complex structure of TeV gamma-ray emission existing in the vicinity of PSR B170644. A deeper investigation and further efforts for improving the technique of Imaging Air Cherenkov telescope remain to be pursued, in order to resolve and distinguish Galactic sources of TeV gamma-rays against the diffusive emission of the Galactic disk.
References
- Aharonian et al. (2000) Aharonian, F.A., et al., 2000, ApJ, 539, 317
- Aharonian et al. (2005a) Aharonian, F., et al., 2005a, A&A, 432, L9
- Aharonian et al. (2005b) Aharonian, F., et al., 2005b, Science, 307, 1938-1942
- Aharonian et al. (2006) Aharonian, F., et al., 2006, Nature, 439, 695
- Cawley (1993) Cawley, M.F., 1993, Proc. International workshop, Towards a Major Atmospheric Cherenkov detector-II, (Calgary, Canada), 176
- Chadwick et al. (1998) Chadwick, P.M., et al., 1998, Astropart. Phys. 9, 131
- Daum et al. (1997) Daum, A., et al. 1997, Astropart. Phys., 8, 1
- Enomoto et al. (2002a) Enomoto, R., et al. 2002a, Nature, 416, 823
- Enomoto et al. (2002b) Enomoto, R., et al. 2002b, Astropart. Phys., 16, 235
- Enomoto et al. (2006a) Enomoto, R., Tsuchiya, K., Adachi, Y., Kabuki, S., Edwards, P. G., et al. 2006a, ApJ, 638, 397
- Enomoto et al. (2006b) Enomoto, R., Watanabe, S., Tanimori, T., et al. 2006b, ApJ, 652, 1268
- Enomoto et al. (2007) Enomoto, R., et al., 2007, ApJ, 671, 1939
- Fisher (1936) Fisher, R. A. 1936, Annals of Eugenics, 7, 179
- Hillas (1985) Hillas, A. M. Proc. 19th Int. Cosmic Ray Conf. (La Jolla) 3, 445
- (15) Hinton, J., Rapporteur talk at the 30th International Cosmic Ray Conference, Merida, Mexico
- Kabuki et al. (2003) Kabuki, S., et al. 2003, Nucl. Instrum. Meth., A500, 318
- Kabuki et al. (2007) Kabuki, S., Enomoto, R., et al. 2007, ApJ, 668, 968
- Kawachi et al. (2001) Kawachi, A., et al. 2001, Astropart. Phys., 14, 261
- Kifune et al. (1995) Kifune, T., et al., 1995, ApJ, 438, L91
- Kushida et al. (2003) Kushida, J., et al. 2003, Proc. 28th Int. Cosmic Ray Conf. (Tsukuba), OG2.2, 2493
- Nakamori et al, (2007) Nakamori, T., et al., 2007, ApJ, 677, 297
- NASA (2007) NASA, 2007, Skyview, http://skyview.gsfc.nasa.gov/
- Nishijima et al. (2005) Nishijima, K., et al. 2005, Proc. 29th Int. Cosmic Ray Conf. (Pune), OG2.7, 101
- Sakamoto et al., (2007) Sakamoto, Y., et al., 2007, ApJ, 676, 113
- Tanimori et al. (2005) Tanimori, T., et al. 2005, Proc. 29th Int. Cosmic Ray Conf. (Pune), Vol 5, 215
- Thompson et al., (1992) Thompson, D. J., et al. 1992, Nature, 359, 615