Tracing molecular gas mass in extreme extragalactic environments: an observational study
Abstract
We present a new observational study of the 12CO(1–0) line emission as an H2 gas mass tracer under extreme conditions in extragalactic environments. Our approach is to study the full neutral interstellar medium (H2, H I and dust) of two galaxies whose bulk interstellar medium (ISM) resides in environments that mark (and bracket) the excitation extremes of the ISM conditions found in infrared luminous galaxies, the starburst NGC 3310 and the quiescent spiral NGC 157. Our study maintains a robust statistical notion of the so-called factor (i.e. a large ensemble of clouds is involved) while exploring its dependency on the very different average ISM conditions prevailing within these two systems. These are constrained by fully-sampled 12CO(3–2) and 12CO(1–0) observations, at a matched beam resolution of Half Power Beam Width , obtained with the James Clerk Maxwell Telescope (JCMT) on Mauna Kea (Hawaii) and the 45-m telescope of the Nobeyama Radio Observatory (NRO) in Japan, combined with sensitive m and m dust emission and H I interferometric images which allow a complete view of all the neutral ISM components. Complementary 12CO(2–1) observations were obtained with JCMT towards the center of the two galaxies. We found an factor varying by a factor of 5 within the spiral galaxy NGC 157 and about 2 times lower than the Galactic value in NGC 3310. In addition, the dust emission spectrum in NGC 3310 shows a pronounced submm “excess”. We tried to fit this excess by a cold dust component but very low temperatures were required ( K) with a correspondingly low gas-to-dust mass ratio of . We furthermore show that it is not possible to maintain the large quantities of dust required at these low temperatures in this starburst galaxy. Instead, we conclude that the dust properties need to be different from Galactic dust in order to fit the submm “excess”. We show that the dust SED can be fitted by an enhanced abundance of Very Small Grains (VSGs) and discuss different alternatives.
1 Introduction
The use of the 12CO(1–0) line emission as a tracer of H2 gas has become an established technique since its the first detection (Wilson, Jefferts & Penzias 1970), with several large surveys using it to obtain images of its distribution in galaxies across the Hubble sequence (e.g. Young & Scoville 1991; Helfer et al. 2003; Leroy et al. 2005) and examine its relation to star formation (e.g. Wong & Blitz 2002). Several theoretical studies have been published since in order to outline the dependence of the so called factor converting the luminosity of this optically thick tracer to H2 mass under the ambient ISM conditions (e.g. Dickman, Snell, & Schloerb 1986; Wolfire, Hollenbach, & Tielens 1993; Bryant & Scoville 1996). These have now converged towards a view of a fairly robust factor provided that: a) the 12CO(1–0) line is well-excited, b) a large ensemble of CO-bright molecular clouds is involved (so the statistical notion of remains valid), c) the molecular gas observed is reducible to a set of self-gravitating “units” (whose linewidths reflect solely their gas mass), and d) for a given far-ultraviolet (FUV) interstellar radiation field the molecular gas is sufficiently metal-rich to ensure that CO remains abundant throughout the volume of a typical molecular cloud ( for in Habbing units). The latter restriction stems from the fact that unlike H2 the CO molecule, with its much lower relative abundance (), cannot self-shield from the dissociating FUV radiation and its relative extent in molecular clouds is regulated by the absorption of that radiation by dust (Pak et al. 1998).
The strong dependence of the factor on metallicity has been expected from theoretical studies (Maloney & Black 1988; Bolatto, Jackson, & Ingalls 1999), and confirmed by extensive observations of the Magellanic Clouds (Israel 1997, 1999) and the Magellanic irregular IC 10 (Madden et al. 1997). In the high-excitation ISM environments found in the Ultra Luminous Infrared Galaxies (ULIRGs) an unbound molecular gas phase (a result of their violent, merger-induced, kinematic environments, e.g. Aalto et al. 1995) is thought as responsible for a systematic overestimate of the H2 gas mass when a Galactic factor is used (Solomon et al. 1997; Downes & Solomon 1998). Towards the other excitation extreme, a cold and/or diffuse gas phase with very low 12CO(1–0) brightness has been discovered in molecular clouds in the nearby quiescent galaxy M 31 (Allen & Lequeux 1993; Allen et al. 1995; Loinard, Allen, & Lequeux 1995), as well as in the outer Galaxy, leading even to suggestions that cold molecular gas constitutes an important component of the dark matter in spirals (Lequeux, Allen & Guilloteau 1993).
Unlike the relatively well-explored metallicity dependence of the factor, the effects of a highly excited, possibly non self-gravitating, molecular gas phase in starburst environments, and a low-excitation one in quiescent ones harboring low star formation rates, have not been widely studied. For ULIRGs such efforts have been hindered by their compact CO emission regions, the presence of a “standard” ensemble of star-forming molecular clouds mixed with the highly-excited phase, and the current inability to conduct multi-line CO observations at high and beam-matched resolutions. The latter could disentangle the two gas phases present in those systems, and such observations of ULIRGs will be important in the future. In low excitation environments, identified by the presence of cold dust and/or low 12CO(2–1)/12CO(1–0) line ratios (), lack of data constraining the gas excitation allows a degeneracy between a diffuse and a cold gas phase, which translates to large uncertainties in the estimated H2 gas mass (e.g. Israel, Tilanus, & Baas 1998). Moreover, while it can be argued that very cold molecular clouds do exist in a few places in galaxies, it is far from certain that they can be typical for a significant fraction of their total molecular gas mass, even in quiescent environments (e.g. Wilson & Mauersberger 1994; Sodroski et al. 1994).
From the largest CO line ratio survey available (Braine & Combes 1992, BC92 hereafter) we chose two infrared luminous galaxies, NGC 3310 (a starburst) and NGC 157 (a quiescent spiral), whose physical conditions of the bulk of their molecular gas and dust mass best represent the excitation extremes within the IRAS Intermediate Luminosity Sample [] (Tinney et al. 1990). Both have similar far-infrared (FIR) luminosities () but very different “colors” of (NGC 3310) and (NGC 157) while their reported 12CO(2–1)/12CO(1–0) line ratios mirror this with (NGC 3310) (the highest reported such ratio, but see §3.1.1), and (NGC 157) (typical for cold quiescent molecular clouds in the outer Galaxy). We make a comparison study of their ISM properties using the 12CO(3–2) and 12CO(1–0) lines, along with and dust continuum maps and sensitive H I images obtained from the literature. Our main goal is to investigate excitation effects on the H2 gas mass estimates in the extragalactic domain.
The optically thin dust continuum emission at FIR and submillimetre wavelengths can be used to measure the dust column density, and thus provide an alternative way to trace the gas mass in most ISM environments where gas and dust are well mixed. Such an approach is independent of gas excitation and can potentially detect very cold gas in regions where CO is not excited (Bernard et al. 2008), but its use in extreme extragalactic environment is hindered by a large uncertainty in the gas-to-dust (GD) mass ratio. We compute the GD mass ratios in our sample galaxies and explore whether we can assume a Galactic GD ratio to estimate the gas mass from dust continuum emission.
In §2 we describe our observations and data reduction procedures. In §3 we present our results from the molecular line analysis as well as the dust SED modeling, while in §4 we discuss the extreme ISM environments that the two galaxies under study represent. Finally, in §5 we summarize our conclusions. Appendix A shows how the interstellar radiation field for the two galaxies was calculated.
Throughout the paper we assume a Hubble constant of km s-1 Mpc-1. The distances in our calculations are assumed to be 21.3 Mpc for NGC 3310 and 35.0 Mpc for NGC 157 (Stevens et al., 2005).
2 Observations and data reduction
We mapped the 12CO(1–0) emission of both galaxies with the Nobeyama 45-m telescope111The Nobeyama Radio Observatory (NRO) is a division of the National Astronomical Observatory of Japan (NAOJ) under the National Institutes of Natural Sciences (NINS). and the 12CO(3–2) emission with the James Clerk Maxwell Telescope (JCMT)222The JCMT is operated by the Joint Astronomy Center in Hilo, Hawaii, on behalf of the parent organizations Science and Technology Facilities Council in the UK, the National Research Council of Canada, and the Netherlands Organization for Scientific Research.. Given the importance of accurate measurements of the 12CO(3–2)/12CO(1–0) line ratio as a function of position in our present study, we devoted a large amount of our observing time at both telescopes towards pointing checks and observations of spectral line standards. We also used the two telescopes to observe 12CO(3–2) and 12CO(1–0) towards a common position in Orion-KL. The physical conditions of the H2 gas towards this region are constrained by a multitude of molecular line observations reaching as high as 13CO(5–4), with inferred densities of and K (Plume et al. 2000). For such conditions the intrinsic 12CO(3–2)/12CO(1–0) brightness temperature ratio expected is and thus for the similar beams of the JCMT and the Nobeyama 45-m telescope: . Our calibration observations found very good agreement for associated spectra from both telescopes, with an averaged integrated intensity ratio of 0.93. This ensures that there are no serious calibration offsets between the two telescopes.
2.1 CO observations
2.1.1 12CO(3–2) and 12CO(2–1) observations at the JCMT
We used the JCMT during the periods of July 1999, January 2000 and February 2001 to conduct 12CO(3–2) imaging of the starburst galaxy NGC 3310 and then again in June 2002, and May, June and July of 2004 for similar observations of the quiescent spiral NGC 157. In all cases we employed receiver B3 in a dual channel mode, tuned to Single Side Band (SSB) to observe the 12CO(3–2) line at GHz and used the Digital Autocorrelation Spectrometer (DAS) with a bandwidth of 920 MHz (). Both maps were acquired with a sampling, which resulted in the acquisition of spectra in 47 positions for NGC 3310, and 194 positions in NGC 157, covering most of the dust emission detected in our submillimeter (submm) continuum maps of these galaxies. We employed rapid beam-switching at a frequency of 1 Hz and chop throws of (in Az). For the NGC 3310 observations typical system temperatures where K with min of integration time per point (effective time for dual channel operation), while for NGC 157 these figures were K, and min. The pointing was monitored every (45-60) min and from the pointing residuals we estimated an rms pointing uncertainty of .
A position with strong 12CO(3–2) emission was repeatedly observed within each galaxy during our imaging observations to verify proper pointing and consistent line calibration (i.e. by checking line profiles and intensities). These observations along with numerous ones of spectral line standards yielded a spectral line calibration uncertainty of . The latter is the 2nd term contributing to the total uncertainty of line intensities given by
| (1) |
where is the main beam brightness temperature of the line, averaged over a total number of channels , and with a baseline defined over a total number of channels . The second term describes the uncertainties inherent in the calibration of mm/submm lines (e.g. temperature uncertainties of cold/warm loads used in the 3-point calibration) and the 3rd term is the uncertainty associated with the adopted value of the main beam efficiency . The contribution of the pure thermal noise is given by
| (2) |
where is the thermal rms noise across the line-free channels of the spectral line. Repeated observations of Mars and Uranus yielded beam efficiency estimates at 345 GHz of for the NGC 3310, and for the NGC 157 observations. Inspection of the JCMT database333http://www.jach.hawaii.edu/JCMT/spectral_line/Standards/eff_web.html demonstrates a uncertainty for the values. The latter enters the total rms uncertainty (equation 1) of the spectral line strengths in our maps (and thus that of the 12CO(3–2)/12CO(1–0) () line ratios), but is not expected to contribute to the expected rms line strength (and thus line ratio) variations within maps.
We also used receiver A3 tuned to Double Side Band (DSB) to observe the 12CO(2–1) line (230.538 GHz) towards the center of both galaxies. The DAS was used at a 1.8 GHz bandwidth ( km s-1). Observations of Mars, Uranus and Jupiter yielded beam efficiencies of for NGC 3310 and for NGC 157, for a beam of , values that we adopt for our conversion of the to the scale at 230 GHz.
Finally all the spectra per position were inspected individually and we co-added only those found to be consistent within the S/N and after removal of bad channels on a few occasions. Linear baselines were subtracted and the 12CO(3–2) spectra were binned to a resolution of 25 MHz ( km s-1), divided by the appropriate and then added to the grid maps of the galaxies (Figures 1 and 2). The maps were convolved to a final resolution of 15′′ (as to exactly match that of the 45-m) and then inserted into AIPS for further processing and combination with the 12CO(1–0) cubes.
2.1.2 12CO(1–0) observations at the Nobeyama 45-m telescope
The observations with the 45-m telescope of the National Radio Observatory (NRO) of Japan were made in December 2000 and December 2004. We used the Superconductor-Insulator-Superconductor (SIS) receiver S100 as the frontend and an Acousto-Optic Spectrometer (AOS), with a frequency resolution of 250 kHz and the total bandwidth of 250 MHz ( km s-1). The intensity calibration was performed by the two-point chopper-wheel method, yielding the total , which typically was K. The telescope pointing was checked every 30 min by observing SiO maser emission of late type stars at 43 GHz. The rms pointing uncertainty was found to be . We used a position-switching mode with an integration time of 20 sec for on- and off-source. We measured the main beam efficiency using planets and found it to be with an uncertainty of . The half-power beam width was estimated from observations of 3C 279 and is . We finally obtained several spectra of 12CO(1–0) of Orion-KL in order to obtain the line calibration intensity as well as check the relative calibration of the Nobeyama 45-m telescope with respect to the JCMT. The integration time was 10 min for most points, thus the rms is higher in the 12CO(1–0) spectra, and the baseline is also worse than that of the 12CO(3–2) due to position switching, especially for the weak 12CO(1–0) lines.
2.2 Dust continuum submm observations with SCUBA
Our SCUBA observations of NGC 3310 and NGC 157 were carried out on the nights 2000 January 24 and 25, with grade 1 and 2 weather respectively. The SCUBA submm bolometer array (Holland et al. 1999) is an array of 37 bolometers at 850 m and 91 at 450 m covering a region of sky of 2.3 arcmin in diameter. In order to provide fully sampled images, the secondary mirror moves in a 64-step jiggle pattern, with the integration time lasting 1 s at each position. After the 16 steps of jiggle pattern, the telescope nods in order to allow for slowly varying sky gradients.
Additionally to the observations obtained by us, we used SCUBA data from the JCMT archive (see §3.3.1). The data were reduced using the SURF software package (Jenness et al. 1998). We made corrections for the atmospheric absorption using the opacities derived from skydip measurements taken regularly every night. Noisy bolometers were flagged and large spikes were removed. During each night, several calibration sources were mapped in order to flux calibrate our images. Finally, the individual jiggle maps were co-added, after the proper reduction was made, and a final map was created for each galaxy. From the 450 m observations described above, only the ones taken in grade 1 weather conditions had sufficient signal-to-noise ratio and were used in our analysis. Flux calibration of the final maps, in units of Jy beam-1, as well as the corresponding beam profiles were obtained from beam maps of CRL 618 observed with the same chop throw as our galaxy maps. The calibration information is summarized in Table 1.
3 Results
3.1 The CO data
In Tables 2 and 3 we tabulate the integrated intensity of 12CO(1–0), 12CO(3–2) (, ) and the ratios for the different positions within NGC 3310 and NGC 157 respectively. The uncertainty in , is calculated according to equation (1) and the uncertainty for was combined quadratically from that of and . In most cases is higher than for the reasons described in §2.1.2, hence the uncertainty in is mostly from . A pointing error could cause extra uncertainty in when the two telescopes were not observing the same position. The expected error is on average 10-20% for a pointing error of 4′′ at 12CO(1–0) and 3′′ at 12CO(3–2), but could be in principle as high as 50% if both telescopes are mis-pointed in different directions by a full grid cell size of 7′′.
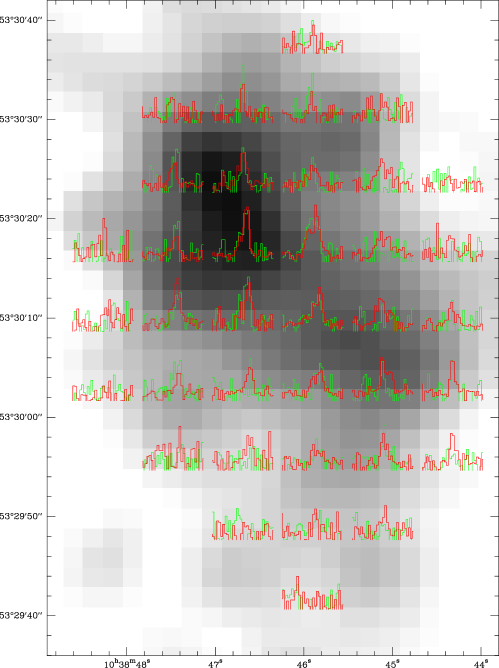
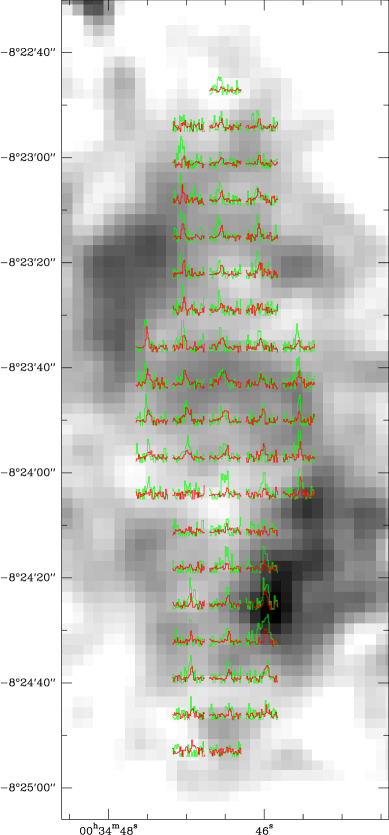
In Figures 1 and 2 we present the 12CO(3–2) (red) and 12CO(1–0) (green) profiles overlaid on a grey scale SCUBA image of the dust emission at 850 m of NGC 3310 and NGC 157 respectively. In all positions where high S/N 12CO(3–2) and 12CO(1–0) spectra exist there is good agreement in their line profiles, demonstrating a good relative pointing on the grid positions by the two telescopes.
3.1.1 NGC 3310: a high excitation case
For NGC 3310, 12CO(1–0) and 12CO(3–2) emission is detected in 33 positions covering a region, corresponding to 4.3 kpc 4.3 kpc in physical scale (see Figure 1 and Table 2). The ratio is slightly higher than unity in most positions, and slightly enhanced mostly in the southwest in comparison to the northeast of the nucleus (though only marginal considering the S/N). The area average is =1.17, while the range of values found within the inner region of NGC 3310 is . This range is still consistent with a constant ratio of = (the average value of the extreme values mentioned above) given the noise variations of this ratio expected within the map. These are very high values, suggesting a highly excited molecular gas phase throughout NGC 3310. For comparison, starburst nuclei show an average ratio of (Devereux et al. 1994; Yao et al. 2003; Narayanan et al. 2005).
In the survey conducted by Braine and Combes (1992) NGC 3310 had the highest reported with = 2.6. This value is high even when compared to the highest values found within individual molecular clouds (molecular line ratios of individual regions within molecular clouds span a much larger range than such ratios over large molecular cloud ensemble averages encompassed by most extragalactic observations). Interestingly ratios have only been observed in the N83/N84 region of the Small Magellanic Cloud (Bolatto et al. 2003), which is part of an expanding molecular shell centered on a supernova remnant (SNR; Haberl et al 2000). For much larger scales such high ratios have been reported also for the nearby archetypical starburst galaxy M 82 (Loiseau et al. 1990), but were not confirmed by subsequent observations (Mao et al. 2000 and references therein). This underscores the need for beam-matched observations (that become progressively more difficult with the higher J-separation of rotational transitions) and good cross-calibration of mm/submm telescopes for accurate line ratio measurements.
Our own 12CO(2–1) measurements (Figure 3a) yield velocity-integrated line intensity of K km s-1 for NGC 3310, in excellent agreement with the value K km s-1 reported by BC92. However for 12CO(1–0) at the (0, 0) position, after convolving to a 21′′ resolution we find K km s-1, which is 1.8 times higher than that reported by BC92. As a result, is at the central 21′′ region, which is significantly lower than the value reported in BC92, but still indicative of the highly excited molecular gas that seems to pervade this galaxy. Convolving the 12CO(3–2) map to a 21′′ resolution yields and for the (0′′,0′′) position. The extreme ISM excitation conditions in NGC 3310 revealed by the 12CO(1–0), 12CO(2–1), and 12CO(3–2) relative line strengths are further corroborated by the warm IRAS “color” ratio of (compared, e.g. with the value of for the quiescent spiral NGC 157).
3.1.2 NGC 157: variations in the gas excitation
For NGC 157, 12CO(1–0) and 12CO(3–2) emission is detected in 64 positions within a region, corresponding to 4.7 kpc 21.4 kpc in physical scale (see Figure 2 and Table 3). The ratios are slightly higher than unity at the nuclear region but drop to less than 0.5 in the two spiral arms, in a remarkably different fashion from the distribution seen in NGC 3310. Indeed, quite unlike the starburst NGC 3310 whose galaxy-wide star-forming activity leaves no discernible gas excitation gradient, NGC 157 is quiescent, with little star formation activity but with a marked change of ISM physical conditions. Maps of 12CO(3–2) line emission in 12 nearby galaxies studied by Dumke et al. (2001) have shown such decreasing ratios outward from the centers of many galaxies but none are as large as those measured in NGC 157.
High ratios are found near the nucleus at offset (,) and (, ), coincident with high SCUBA flux ratios, suggesting a high dust and gas temperature at this position. Low values of on the other hand are found in the northeast (NE) and southwest (SW) disk, near offset (, ) and (-7′′, -42′′) respectively, which host strong 850 m emission with a low flux ratio and thus low dust temperature (see §3.3.3).
For the central of this galaxy Braine et al. (1993) report K km s-1. However, after convolving our 12CO(1–0) data to 23′′, we find K km s-1, which is of their value. We note that our pointing center was offset from that of the IRAM observations by (, ), and Braine et al. (1993) also put a note on the pointing uncertainties in the 12CO(1–0) and 12CO(2–1) data. Since the 12CO(1–0) emission is much stronger in the SW disk, a strong CO line would show up if the telescope was miss pointed toward the SW disk, say at offset (-14,′′ -7′′). Comparing with our 12CO(3–2) and 12CO(1–0) profiles, the IRAM 12CO(1–0) profile published by Braine et al. (1993) is consistent with the profiles in the SW of the nucleus, with the peak shifted to the red side and a broad wing on the blue side. Thus it is possible that the IRAM measurement was actually corresponding to the SW disk rather than the central nuclear region. This may be the reason for the unusually low reported by BC92.
Our JCMT 12CO(2–1) measurements (Figure 3b) yield K km s-1 for NGC 157 at offset (,), with a resolution of 21′′. Convolving the 12CO(1–0) data to 21′′ resolution we get K km s-1 and therefore =1.0 in the central 21′′ region, which is consistent with the high excitation suggested by the ratio towards the same position.
3.2 The physical conditions of the molecular gas: a study of extremes
We employ a large velocity gradient (LVG) model (e.g., Goldreich & Kwan 1974) to constrain the physical parameters and eventually the CO-to-H2 conversion factor in the extreme ISM environments marked by the two galaxies. This model assumes that the systematic motions rather than the local thermal velocities dominate the observed linewidths of the molecular clouds. We use this model to fit the observed line ratios for different combinations of (, , ), where is the kinetic temperature and , with =[12CO/H2] being the fractional abundance of 12CO with respect to H2 and the velocity gradient. The optimum set of parameters is determined by minimizing .
Table 4 lists the input and ratios used for our LVG analysis, and the details of our method are outlined in Zhu et al. (2003; 2007). The factor can be directly derived from the LVG parameters using the formula
| (3) |
where is the radiation temperature for the 12CO(1–0) line transition.
In order to reduce the well-known degeneracies in the deduced properties of molecular gas from radiative transfer modeling of a few line ratios of the (usually) optically thick 12CO lines we use the constraint of (where is derived from FIR and submm data in §3.3). This inequality is driven by FUV-heating of gas and dust (usually not thermally coupled unless cm-3), the turbulent heating of the gas (but not the dust), and the much more efficient dust cooling (via continuum emission) with respect to that of the gas (through spectral line emission). As shown in §3.3, is 32 K for NGC 3310 and 23–28 K for NGC 157 nuclear region. Hence we estimate = 35–50 K for NGC 3310, and 25–40 K for the central region of NGC 157.
A further constraint can be set by adopting only the LVG solutions that correspond to gas motions that yield a restricted range of values where
| (4) |
must be , with corresponding to the virialized motions of fully self-gravitating gas “cells” (Papadopoulos & Seaquist 1999) (, depending on the assumed cloud density profile). From the modeling of molecular line emission from quiescent to star-forming environments (and using several 12CO and 13CO lines) it was found that (e.g. Papadopoulos & Seaquist 1999), which we adopt here as the permitted range of values.
3.2.1 NGC 3310
The high and ratio in this galaxy can only be fitted with a gas phase that corresponds to an optically thin 12CO(1–0) line. Tellingly no fits are possible for 30 K and n 3000 under the constraint . Similar constraints have also been reported by Yao et al. (2003) when modeling equally high ratios found for galaxies in their sample.
The best fits are found in the range of K, , pc [km s-1]-1, which can fit the and ratios within the observational uncertainties (). For this range the factor is cm-2 [K km s-1]-1. If we further require to be minimum, i.e. a velocity gradient not much higher than its virial value, the best fit would then be n=7800 , =50 K and pc [km s-1]-1, with cm-2 [K km s-1]-1(Table 5).
A major uncertainty is associated with the adopted CO abundance , usually in the range (Blake et al. 1987; Hartquist et al. 1998) in star-forming clouds of our Galaxy. In the case of NGC 3310 Pastoriza et al. (1993) found metal abundances 2.5 to 5 times lower than Solar in its circum-nuclear H II regions, and thus the CO abundance could be a factor of 5 lower than the average value of our Galaxy (). For , the factor would be cm-2 [K km s-1]-1(Table 5), which is a factor of 1.5 times lower than the Galactic value cm-2 [K km s-1]-1(e.g. Strong & Mattox 1996), with the excitation bias partial offset by the metallicity effect.
In all the above LVG solutions, the opacity at 12CO(1–0) is , quite unlike in typical Giant Molecular Clouds (GMC) where this line is optically thick (). Interestingly, only molecular gas in the vicinity of an SNR (and NGC 3310 is expected to have lots of them) presents high CO ratios (Bolatto et al. 2003) and optically thin CO emission. Even in extreme starbursts such as (Ultra)Luminous Infrared Galaxies (LIRGs and ULIRGs) as Arp 220 and NGC 6240, and ratios are all (Greve et al. 2009). Thus the molecular gas in NGC 3310 seems to be indeed defining the uppermost envelope of average excitation conditions known for IR luminous galaxies in the local Universe.
3.2.2 NGC 157
The ratios of integrated line intensities for NGC 157 span a wide range, but still within that seen in other galaxies (e.g. Yao et al. 2003), making their LVG fitting more straightforward. At the nuclear region conditions appear to be similar to those of NGC 3310 with K, , and pc [km s-1]-1(Table 5). The range of kinetic temperature is that of the dust since, with limited heating sources in the central region of this galaxy (e.g. not much star formation or AGN activity), we don’t expect the gas temperature to be much higher than that of dust.
Ratios such as that found at the offset (, ) where =0.19, indicates that the gas is either very cold ( K), or of low density (less than 1000 ). For =0.2–0.4 typical LVG fits yield =10–20 K, , pc [km s-1]-1, and = cm-2 [K km s-1]-1, while is in the range of 3–4, i.e. close to the virial value and thus consistent with what is expected for typical ensembles of cold, self-gravitating molecular clouds found in the Galaxy. In general, without internal heating sources, (e.g. no star formation) typical gas temperatures in molecular clouds are K, set by the equilibrium reached between heating by ambient interstellar radiation ( in Habbing units) and comic rays and C+ cooling, while they usually have (to within a factor of a few).
On the other hand, if we were to set = 30 K, the best fit would yield , and pc [km s-1]-1, which gives = cm-2 [K km s-1]-1. In this case, is in the range 9–30, too high for a quiescent galaxy similar to the Milky Way. In §3.3.3, we will see that variations in the SCUBA flux density ratios indicate a variation in the dust temperature, with much higher in the central region than in the outer disk. Moreover the global spectral energy distribution (SED), with more data points available, is best fitted by a two-component dust model with K and K for the warm and the cold dust component respectively. The warm dust component is then expected to be associated with the molecular gas in the nuclear region, while the cold dust with K with the gas in the disk and spiral arms.
3.3 NGC 3310 and NGC 157: The dust continuum emission
3.3.1 Dust temperature and mass: the methods
Using the data obtained from the JCMT archive, Stevens et al. (2005) published the SCUBA maps of 14 galaxies, including NGC 3310 and NGC 157. They fitted their SEDs with a two-temperature dust model. Their results show that NGC 3310 has the largest fraction of cold dust among the 14 sample galaxies. However, there appeared to be a mistake in the SED model of NGC 3310 presented in Figure 17 of Stevens et al. (2005), in which the submm fluxes were set to an order of a magnitude larger than the real ones, and thus their reported dust masses and temperatures are in error.
We re-analyzed the SCUBA maps, using our data obtained in 2000 (§2.2) and also included archival JCMT observations of these galaxies (1999 August 08, 2000 January 19, 2000 April 13 and 2003 May 20; weather grade 2, 3, 1 and 1 respectively). The total fluxes derived (Table 6) are in good agreement with those of Stevens et al. (2005). We then correct for 12CO(3–2) line contamination of the 850 m fluxes using the formula mJy beam-1 (K km s (Zhu et al. 2007). This yields a 15% flux correction for NGC 3310 (central 30′′) and a 8–20% flux correction for NGC 157. We furthermore corrected the fluxes for contamination of, predominantly thermal, radio emission. Radio continuum observations at 5 different frequencies between 57 MHz and 4.85 GHz were available from NED for NGC 3310 and data points at 1.4 and 5 GHz for NGC 157. For NGC 3310 we fitted a combination of a synchrotron and thermal radio spectrum to the observed radio data points by varying the synchrotron spectral index and the synchrotron and thermal flux densities at 1 GHz. The thermal radio emission has a fixed spectral index of . Fits were possible with a synchrotron spectral index between and and yielded extrapolated radio flux densities between 29 and 48 mJy at 850 m and between 25 and 44 mJy at 450 m. We adopted the mean value as a realistic estimate. For NGC 157 a detailed fit of the radio spectrum was not possible. We estimated the range of the radio continuum contaminations by fitting a combined synchrotron and thermal radio spectrum with the steepest () and the flattest () synchrotron spectral index compatible with the radio data points at 1.4 and 5 GHz and found the range to lie between 5 and 28 mJy at 850 m and between 3.5 and 26 mJy at 450 m. As a realistic estimate for the radio continuum contamination we used a synchrotron spectral index of and derived radio flux densities of 18 and 16 mJy at 850 m and 450 m. For both galaxies we found that the conclusions of our study are not affected by the uncertainty in the radio continuum contamination of our 850 m and 450 m flux densities. The observed and corrected fluxes (for 12CO(3–2) and radio contamination) are listed in Table 6.
We then fitted the dust SEDs with two models: (i) a classic two-temperature dust model (hereafter 2T model) similar to that used in Stevens et al. (2005) and (ii) a dust grain model of Desert et al. (1990, hereafter DBP90 model) which contains Large Grains (LG, =2), Very Small Grains (VSG, =1) and Polycyclic Aromatic Hydrocarbons (PAH). The 2T model uses two grey-bodies to account for the warm and cold dust components of temperatures and respectively and, in our case, was applied to the data with wavelengths m. Both components of the 2T model have the same dust emissivity in k (Dunne & Eales 2001). The DBP90 model was previously applied to NGC 1569 (Lisenfeld et al. 2002) and here we use the same fitting procedure. We adopt the values for the size distribution of the different grains for which DBP90 achieved the best-fit for the solar neighbourhood, except for the relative abundance of the various grain components which we leave as a free parameter.
The use of the DBP90 model was motivated by the inability of the typical 2-component grey-body fit to reproduce the submm “excess” observed in NGC 3310 (see §3.3.2) without yielding an unreasonably cold dust temperature and a very large associated dust mass. In Appendix A we show how we derive the interstellar radiation field (ISRF) for both galaxies. The ISRF in NGC 3310 is much stronger than in NGC 157, even higher than for the starbursting dwarf galaxy NGC 1569 where indications for a boosted VSG population have been found (Lisenfeld et al. 2002, Galliano et al. 2003).
The dust mass in the 2T model was calculated as the sum of the warm () and the cold () dust using
| (5) |
where is the reference wavelength for each component taken as 100 m for the warm dust and 850 m for the cold dust and the temperature of the warm and cold component, respectively. is the Planck function at 100 and 850 m, respectively, the flux density at 100 and 850 m (after correcting the flux at 850 m for 12CO(3–2) and radio continuum contamination) and the dust opacity per unit dust mass, assumed to be at 850 m (c.f., James et al. 2002; Dunne & Eales 2001) and at 100 m (Hildebrand 1983). In DBP90, the dust temperature of the LGs was derived by fitting equation (5) to the model. We then derived the mass of LG component from the flux at 850 m using the same equation. The masses of the VSGs and PAHs were derived from the input mass extinction coefficients, obtained by scaling the values in Table 2 of DBP90. The results are presented in Table 7 and Table 8 for the 2T and the DBP90 model respectively.
3.3.2 The dust properties, a study of extremes
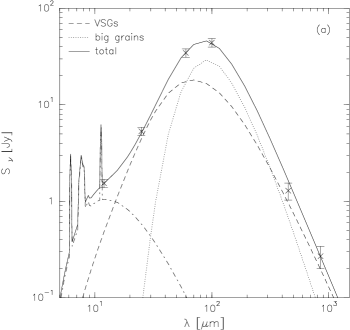
The dust SED of NGC 3310 is very different compared to a typical dust SED of a spiral (see e.g. Dunne & Eales 2001). The unusual aspect of it is an apparent “excess” emission at 850 m (see Figure 4a), which manifests itself as a relatively shallow submm slope ( ), derived from the ratio of 4.9 (after correcting for CO and thermal radio contribution). This is similar to that of the starburst dwarf galaxy NGC 1569, which has a ratio of 4.4 (Lisenfeld et al. 2002). By comparison, NGC 157 has =6.0 (after CO and thermal radio correction), and all the galaxies in the SCUBA Local Universe Galaxy Survey (SLUGS) have (Dunne et al. 2000). The value of for NGC 3310 corresponds to , and constitutes strong evidence of large-scale differences of dust properties in starburst environments. This has been suggested earlier using 1.3 mm imaging (Dumke, Krause, & Wielebinski 2004), and along with the very high molecular gas excitation implied by the high CO line ratios, points to different ISM properties over large scales in starbursts. The latter, apart from being interesting in its own right, can have serious implications for interpreting molecular line and dust continuum data from the numerous starbursts that have now been identified in the distant Universe.
The need for a different dust SED model in NGC 3310 is exemplified by the unlikely results yielded by the classic 2T model (Figure 4a) in which a temperature of K is derived for the cold component which would then contain the bulk of the mass with M⊙(see Table 7), resulting in an unrealistically low GD mass ratio of about 5 within the inner , the region where most of the dust emission originates (see Table 8 for the gas mass). The highest cold dust temperature which is compatible with the error bars of our data is K. In this case the dust mass would be M⊙ and the GD ratio = 43, still a low value. The GD ratio for this likely metal-poor object ought to be higher not lower than the Milky-Way value of about 100–150. In principle, an underestimate of the gas mass could be responsible for the low GD ratio. This has been suggested for the Large Magellanic Clouds (Bernard et al. 2008) where cold HI and/or a low density H2 phase without CO might cause a low GD ratio. We cannot exclude this possibility in NGC 3310, but there are further, stronger arguments against the presence of very cold dust. A first argument is that the extremely low dust temperature is also not consistent with the results of our CO line excitation analysis. Based on the multi-transition CO data, NGC 3310 has a higher gas excitation, and a higher kinetic temperature ( K) in the molecular gas content than NGC 157 ( K). Thus, we would also expect a higher average dust temperature, of the order 30 K or higher, in NGC 3310 than in NGC 157, which is an expected difference in the ISM properties of an intense starbursts such as NGC3310.
A further argument against a very cold dust component is posed by the question where the cold dust could hide. Even though such low dust temperatures can be achieved in very shielded environments, the dust capable of producing this shielding would emit at much higher temperatures. Lisenfeld et al. (2002) estimated that in the case NGC 1569 a considerable amount of (warm) dust is necessary to shield the cold dust, so that an extreme dominance in mass of the cold dust is impossible to happen. Fischera & Dopita (2008) modeled the SED of dust emitted from self-gravitating, spherical, interstellar clouds which allows to base such an estimate on a quantitative foundation. The dust properties that they assumed are consistent with Galactic dust. They showed that massive clouds, close to the collapsing limit, in a high pressure environment reach the highest opacities. Although in such clouds the temperatures of the grains in the inner part can be below 10 K (see their Figure 8), the emission of this cold dust component does not lead to a flat submillimeter spectrum (see their Figures 10 and 11) since the overall emission of the cloud is still dominated by the significant mass of warm grains from the outer regions (needed to shield the inner ones so that their temperature can drop that low). Thus, very cold dust, even when present in the centers of some clouds, is not expected to dominate the dust emission for an ISRF similar or stronger than the Galactic one.
Using the DBP90 model for NGC 3310 on the other hand gives much more reasonable results (see Figure 5a), with a LG dust temperature of 32 K, but with an enhanced VSG abundance (factor 3.2) and a slightly lower PAH abundance (by a factor of 1.4) compared to the Galaxy (see Table 8). The enhancement of VSGs is similar to that found for the dwarf starburst galaxy NGC 1569 (Lisenfeld et al. 2002) which is not unexpected given the fact that both galaxies are low-metallicity starbursts. A submm excess and enhancement of VSG have also been found for other starbursting dwarf galaxies (Galliano et al. 2005). The high abundance of VSGs may be the result of grain fragmentation due to numerous SN-induced shocks taking place in the ISM. The total dust mass estimated with this model is M⊙, with the largest contribution coming from the LG component ( M⊙). The average dust temperature deduced for the LGs is 32 K and is consistent with that of the H2 gas. The GD mass ratio within the central (the region where most of the dust emission emanates from) is 461. This value is times higher than the Galactic value, but within the range expected for the low metallicity reported for NGC 3310 (see §3.4.1).
The good fit to the shallow submm SED of NGC 3310 is partly due to the fact that the stochastically heated VSGs possess a broad temperature distribution going down to very low values. Most importantly, however, the low dependence of the extinction coefficient on the wavelength () of the VSG component in the DBP90 model is responsible for the good fit. The empirical nature of the DBP90 leaves some uncertainty about whether this low value of is correct. In any case, a firm conclusion from the good fit of the DBP90 model together with the impossibility to use a two-temperature model (with is that we need a low value of in order to fit the shallow submm spectrum of NGC 3310.
Low values of are expected for amorphous carbon (Koike et al 1980), aggregates of silicates and graphite in a porous structure (Mathis & Whiffen 1989) as well as for small amorphous grains (Seki & Yamamoto 1989, Tielens & Allamandola 1987). In general, amorphous rather than crystalline structure and increase of the grain size (e.g. Mannings & Emerson 1994) are the main reasons for expecting . Furthermore, laboratory experiments have shown that can be temperature dependent and decreases at very low temperatures (Agladze et al. 1996) which could indicate that dust in the inner parts of dense clouds might show different properties than dust outside. Going into a similar direction, Meny et. al. (2007) proposed a dust model based on physical properties of amorphous solids which exhibits a broad emission spectrum whose detailed properties dependent on temperature and which might explain the submm excess. Thus, an alternative explanation for the flat submm SED could be the change of dust properties with temperature.
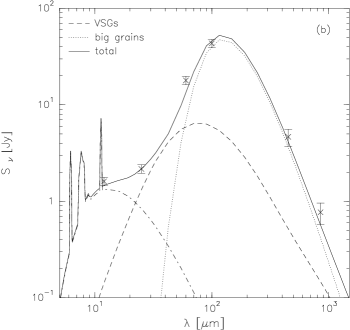
The SED of NGC 157 is similar to that of our Galaxy and both dust SED models can fit the data well, but with a dust mass different by a factor of 3–4. From the 2T model we derived dust temperatures of 28 K and 11 K for the warm and the cold dust component respectively (see Figure 4b and Table 7), in good agreement with the results of Stevens et al. (2005). The dust mass is M⊙, corresponding to a global GD mass ratio of 124, similar to the Galactic value. From the DBP90 model (Figure 5b) the temperature derived for the large grains is 22.5 K, with a total mass of M⊙ (Table 8), and we achieved a good fit for VSGs and PAH abundances similar to those in the Galaxy. This model yields a GD mass ratio of 468, which is 3 times higher than the Galactic value. This is mostly due to fitting the LGs with a single temperature component of 22.5 K. As shown in §3.3.3, the flux density ratios of suggest that the dust temperature indeed varies by a factor of 2 across the disk of NGC 157, thus the two-temperature model may better reflect the dust distribution in normal spiral galaxies such as NGC 157.
3.3.3 The ratio: dust temperature variations, and VSGs versus LGs
Having determined the proper dust model for each galaxy we can now examine whether there are any discernible variations of the dust temperature within these two systems. Such variations have been identified via submm imaging in the starburst/AGN NGC 1068 by Papadopoulos & Seaquist (1999) using the ratio. This ratio can be a good indicator for temperatures of K, which characterize quiescent H2 or H I-rich regions with little ongoing star formation. For a single dominant dust component this ratio can be expressed as
| (6) |
with being the emissivity index (2 in our case). For a quiescent spiral such as NGC 157, the variation reflects a change in the dust temperature. In Figure 6 we show the azimuthally averaged ratio (after smoothing the 450m map to the resolution of the 850m map; Figure 6a) and dust temperature profile as a function of radius (Figure 6b) for both galaxies. We don’t expect that equation (6) can be applied to NGC 3310, given that in this galaxy: a) the large grains have (and thus their submm emission lies in the Rayleigh Jeans domain), and b) the VSG component could be present throughout the compact submm emitting region of this galaxy. To demonstrate this, Figure 6b shows that the “dust temperature” of NGC 3310 derived with equation (6) is unreasonably low, much lower than that of NGC 157. Therefore, the variation of the ratio for NGC 3310 in Figure 6a, may not reflect a simple variation in , but variations of the “effective” submm-deduced , possibly due to a change of the VSG/LG mass ratio, something that our global dust SED fits of this system cannot discern. We will address this issue in a future paper, with detailed analysis of MIPS data from Spitzer.
In NGC 157, the dust temperature changes from 23–28 K in the central region to less than 15 K in the outer disk (Figure 6b). This is consistent with the variation in the CO gas excitation temperature estimated from the ratio, and again suggests that a two-temperature dust model represents a good fit to the global SED in this galaxy.
3.4 CO, H I, and dust distributions: an empirical test of the factor
In this section we study the variation of the GD mass ratio in NGC 3310 and NGC 157 in order to explore whether we can assume a constant GD mass ratio for the H I-dominated and CO/H2-dominated regions to get an independent, empirical test of the factor (for a similar method applied in the Milky Way see Reach et al. 1998). The dust mass is estimated using equation (5) and the H I and H2 mass can be estimated using the following formulae:
| (7) |
| (8) |
where is the distance to the galaxy in Mpc, and is the H I and 12CO(1–0) integrated flux in Jy km . Equation (8) for the estimate is essentially equation (4) in Braine et al. (2001) when using the Galactic factor = (K km or 4.3 M⊙pc-2 (K km (including a 36% mass correction for helium). Our LVG analysis shows that the factor is approximately unity in the disk of NGC 157, but could be 0.65 in NGC 3310 and 0.28 in the nuclear region of NGC 157.
For both galaxies, the 12CO(3–2) maps are more extended than those of 12CO(1–0) and cover the majority of the CO distribution. They have higher S/N ratios and hence we used them to represent the CO distribution, bearing in mind the variation of . Also, we used the uncorrected SCUBA image to get the highest S/N in order to trace the dust emission to the largest extent. The CO contribution is on average about 15% and thus not significant.
3.4.1 NGC 3310
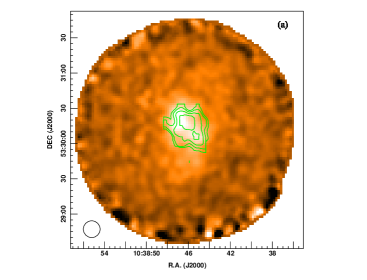
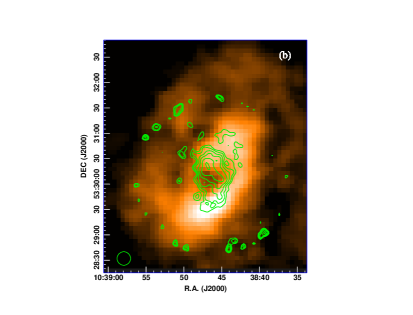
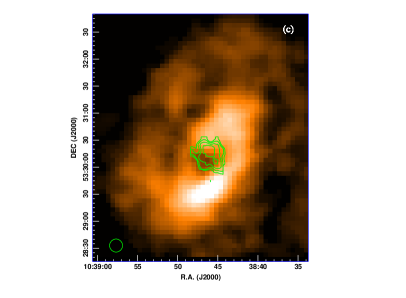
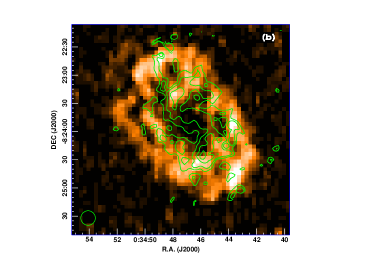
Figure 7a shows the 12CO(3–2) contours overlaid on the SCUBA 850 m image while Figures 7b and 7c show the SCUBA 850 m and 12CO(3–2) contours respectively overlaid on the H I map at 20′′resolution, taken with the WSRT interferometer (Kregel & Sancisi 2001). The 12CO(3–2) map covers the majority of the CO emission in the central region, while the dust emission can be detected out to a region, thanks to the high sensitivity of SCUBA. The IRAM 12CO(1–0) and 12CO(2–1) maps published by Mulder et al. (1995) indicated the existence of weak CO emission at off the center, slightly larger than the area we detected. The total 12CO(1–0) flux from the 45-m map is 101 Jy km s-1. Comparing to the total flux of 140 Jy km s-1 reported by Young et al. (1989), our map covers 72% of the CO, mostly in the central region.
The H I emission is much more extended than the CO and SCUBA 850 m emission and it dominates the gas content outside . Unlike NGC 157 (see §3.4.2), there are no regions that are dominated by CO. In the central , the / ratio is about 0.8 if cm-2 [K km s-1]-1is assumed. However, the H I map at 20′′ resolution is missing fluxes by about 30%, which was estimated by comparing to the 60′′map (also from Kregel & Sancisi 2001), after convolving to the same resolution. Thus we apply a factor of 1.3 to the high resolution H I map, and the resulting / is revised to 1.03, i.e. neither H I nor H2 dominates the gas content in the nuclear region. The 850 m flux is 67 mJy in the central , and we estimate the dust mass by scaling this flux with the total flux to obtain the fraction of , derived from the DBP90 model, in this region. The final derived GD mass ratio is 312 (Table 9). If a Galactic factor is used, the central region would have 54% more molecular gas. The / and GD mass ratio would become 0.67 and 395, respectively.
Similarly, in the central 60′′ region (), the GD mass ratio would be 461 (the detailed numbers are listed in Table 9). Our CO data does not cover the entire 60′′ region, but contributes only about 27% to the total gas mass, thus a 20-30% under-estimate in the CO fluxes would have a limited effect on the GD mass ratio.
In the outer region with where little CO emission is found, there is some weak 850m emission associated with the H I. To improve the S/N ratio, we averaged the fluxes azimuthally in the outer disk and used the azimuthally averaged ratio to estimate the GD mass ratio which is essentially the ratio as:
Using the value K from the DBP90 model, we estimate a GD mass ratio of 859. If the VSG component is not enhanced in the outer disk (possibly due to less star formation activities) and drops to 20 K, the GD mass ratio would be 456.
In all cases, the resulting GD mass ratio in NGC 3310 is much higher than the Galactic value. The high GD mass ratio could be related to the low metallicity in the galaxy. Pastoriza et al. (1993) found metal abundances 2.5 to 5 times lower than Solar in circumnuclear H II regions of NGC 3310. It is thus possible that this galaxy has less dust compared to a solar-metallicity galaxy. The lack of dust is consistent with the low global / ratio in NGC 3310 as molecules are formed on the surfaces of dust grains.
The GD mass ratio in NGC 3310 shows larger variations than in NGC 157 (see §3.4.2). Also, due to the uncertainties in estimating the fraction of the VSG component and hence the dust temperature, the derived local GD mass ratio has a large uncertainty, by a factor of at least 2. Combined with the fact that there are no H2 dominated regions in this galaxy, we conclude that it is not practical to use the GD mass ratio to derive the factor in NGC 3310.
3.4.2 NGC 157
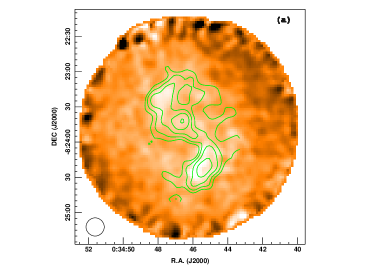
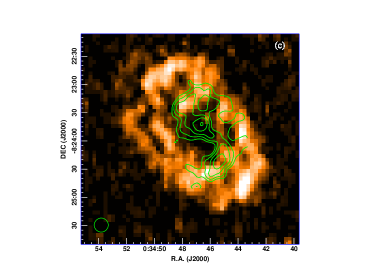
Figure 8a shows the 12CO(3–2) integrated intensity contours overlaid on a SCUBA 850 m image. The CO distribution is in general consistent with that of the dust emission. A major difference is visible in the nucleus of the galaxy, where 12CO(3–2) emission is strongest but the dust emission is relatively weak. In fact, the strongest 850 m emission is located in the southern spiral arm, close to the 12CO(1–0) peak (see Figure 2). This difference is probably due to an excitation effect. The 12CO(3–2) is tracing hot molecular gas and its distribution is more consistent with that of 450 m emission (both have a strong emission near the centre). This suggests that different dust temperatures and factors (for different excitations) should be used to derive the ratios in different regions.
Figures 8b and 8c show the SCUBA 850 m and 12CO(3–2) contours respectively overlaid on the H I map at a resolution of , obtained by Ryder et al. (1998) using the VLA. The H I map was constructed using the uniform weighting schemes (referred as UN image) which has a high resolution and shows the structure of the inner region, but it misses some extended structure hence is not good for deriving the H I column density. We use it to compare the H I morphology with other ISM components in the inner region. Ryder et al. (1998) also published a low resolution () VLA map processed with the nature weighting schemes (referred as NA image), which is expected to recover all the H I fluxes. We have converted the UN image to resolution to compare with the NA image and found that about 40-50% of fluxes could be missed in the UN image.
Based on these maps we divide the galaxy into 3 parts: (i) the H2 dominated region in the central , (ii) the H I dominated outer disk with (iii) The regions between (i) and (ii). In the following we discuss them separately.
(i) In the central region, the / ratio is only 0.2 based on the H I fluxes from the high resolution UN image, after applying a correction factor of 2 for missing fluxes. The central region is clearly dominated by molecular gas and thus the uncertainty in the H I mass estimate has a limited effect on the total GD mass ratio. Line 4 of Table 9 lists the mass ratios for the central 21′′. For dust mass estimates we used =23 K which is the temperature we derived for the central region of this galaxy (§3.3.3). The GD mass ratio turns out to be 54 if a low factor ( cm-2 [K km s-1]-1) is used.
(ii) In the outer disk with , most of the gas are in the atomic phase, and the GD ratio is effectively . Similar to the case of NGC 3310 outer disk, we used the azimuthally averaged ratio to derive the ratio as:
If = 15 K, as derived from equation (6) in §3.3.3, the GD mass ratio would be 46. This is consistent with the GD mass ratio in the central H2 dominated region.
(iii) For the region with , we used the NA image to derive the H I fluxes and convolved the CO and 850 m data to a resolution of . At such a low resolution, we select three regions to derive the GD mass ratios: the center, the NE and the SW disk that are 40′′ offset from the nucleus. Table 9 lists the CO, H I and dust mass in these three regions and the GD mass ratios. The factor was assumed to be cm-2 [K km s-1]-1in the center, but in the SW and NE spiral arms. The dust temperature is 23 K in the center but 15 K at away from the nucleus, according to the temperature distribution in Figure 6b.
Our result indicates that the variation of the GD mass ratio is less than 40%. Thus we can assume a constant GD mass ratio of to estimate the factor in the H2 dominated region, which yields cm-2 [K km s-1]-1for the central , in good agreement, and independently, with the results from our LVG analysis of the CO lines.
4 Discussion
4.1 NGC 3310 and NGC 157: two extremes in ISM excitation
Few molecular line ratio surveys of large samples of galaxies exist, and those available are of the CO line ratio (Braine & Combes 1992; Papadopoulos & Seaquist 1998), while smaller samples have been observed in the more excitation sensitive ratio (Yao et al. 2003; Narayanan et al. 2005). With the new array receiver HARP and the ongoing JCMT nearby galaxies legacy survey (e.g. Wilson et al. 2009), more studies of nearby galaxies are expected.
In the Braine & Combes (1992) survey the starburst NGC 3310 and the quiescent spiral galaxy NGC 157 have respectively the highest and lowest values ever observed in galaxies. Although our observations did not confirmed these extreme values, the ratio of 1.5 in NGC 3310 remains among the highest of such ratios measured in galaxies, while in NGC 157, an extremely low ratio of = 0.2–0.4 is found in the outer disk. These two galaxies indeed represent two extremes in ISM excitation in external galaxies, allowing us to study the range of the factor in extreme environments.
Our results showed an factor varying by a factor of between the two galaxies and within a galaxy where strong excitation gradients are present. In the disk region of NGC 157 the factor is close to the standard Galactic value found for Galactic GMCs at a galactocentric radius of kpc, while at its center it could be lower by a factor of , a trend also verified for the Milky Way (Sodroski et al. 1995). This good correspondence demonstrates the utility of excitation analysis of multi-transition CO data to yield good constraints on the factor in external galaxies, even when a significant degree of degeneracy in the deduced average physical conditions of the molecular gas remains. The same method has been used by Zhu et al. to study the factor in interacting galaxies, e.g. the Antennae (Zhu et al. 2003) and the Taffy galaxies UGC 12914/15 (Zhu et al. 2007). These galaxies represent other types of extreme environments for molecular clouds, with strong tidal interaction, direct cloud-cloud collision, and diffuse clouds outside a galactic disk environment (in the case of Taffy galaxies). The factor was found to be in the range of 0.1 – 0.2 in the these galaxies. Yao et al. (2003) also found on average based on their analysis of the ratios in the central regions of SLUGS galaxies.
In most cases studied so far, a lower than standard factor is associated with non-virialized clouds rather than non-standard molecular gas physical conditions. According to equations (3) and (4)
| (9) |
with for ensembles of virialized clouds (the ensemble itself in general does not need to be virialized, and its motions ordinarily are dictated by the general galactic potential). Most molecular clouds in a quiescent galaxy have and . Our LVG excitation analysis find a varying at most within factors of , while major variations come from . In the Milky Way, very large local velocity gradients (greater than 10 km s-1 pc-1) with are found near pre-star-forming clouds (Falgarone et al. 1998) as well as in diffuse clouds towards Orion (Knapp & Bowers 1988). Falgarone et al. (1998) found high velocity gradients associated with macroturbulent gas “cells” of size 200 AU and densities of , which is consistent with the parameters found in our LVG analysis.
In the nuclear regions of ULIRGs, can be significantly higher than unity, due to a large scale “mixing” of molecular gas with significant amounts of stellar mass, resulting in (Solomon et al. 1997; Downes & Solomon 1998). Actually our method of using the LVG radiative transfer models to obtain values can in such a case (with gas and star mixtures) yield the factor , independent of methods that model the detailed spatial and velocity distribution of molecular gas in such systems, which demand high resolution interferometric imaging (e.g. Downes & Solomon 1998).
Summarizing our findings for the variations of the factors in NGC 3310 and NGC 157, as well as in the aforementioned ULIRGs and interacting galaxies (Zhu et al. 2003, 2007), we find that the factor is generally in the range of 0.1–0.5 in extreme environments, which is mostly due to the variations of the parameter ranging from 1 to 15.
4.2 Molecular gas estimates in extreme environments: cautionary tales
The discovery of a significant population of dust-enshrouded and CO-bright starbursts at high redshifts (e.g. Smail, Ivison, & Blain 1997; Hughes et al. 1998; Greve et al. 2005), as well as the discovery of extended outer regions dominated by cold dust (and concomitant gas) in several spirals (Nelson, Zaritsky, & Cutri 1998; Xilouris et al. 1999; Papadopoulos & Seaquist 1999; Thomas et al. 2001, 2002) give to our study of extreme ISM extragalactic environments a wider importance.
For high-z galaxies for which multi-transition CO data are rarely available we can only make an educated guess of the factor based on our knowledge of local starbursts, frequently used as their low-z counterparts based on the high star formation rates per molecular gas mass found for them. A gas dynamics driven by fast-evolving galactic potentials associated with mergers and/or frequent SNR shocks could be the decisive similarity among them that makes claims about similarly low factors in both populations credible. Indeed if these low values are driven mostly by large velocity gradients rather than gas excitation differences, highly turbulent environments would be expected to be present in them. However, it has been shown that interstellar turbulence decays quite rapidly, on timescales of the order of the free-fall time of the system (e.g. Klessen et al. 2000; Mac Low et al. 1998). To maintain the observed long lifetimes, turbulence in molecular clouds must be constantly driven, either externally (e.g. via galaxy interactions) or internally via star formation. Therefore, generally a gas-rich galaxy with a high star formation efficiency, indicated by a high , may have systematically lower factors. Indeed, the ratio is much higher in NGC 3310 and ULIRGs than in quiescent spirals. Tacconi et al. (2008) shows an anti-correlation between the factor and the gas surface density (see their Figure 10), implying that galaxies with more dense gas and therefore higher star formation efficiencies would have lower factors. We will explore this effect more quantitatively in a future paper.
The other method of deriving H2 gas mass from the dust mass, a benchmarking of the GD mass ratio from the H I-rich part of the galaxy, while independent of the factor and thus valuable, cannot be currently applied to high redshifts galaxies. Its use is restricted in the local Universe of where H I can be imaged by current interferometers. Moreover, the presented evidence for different dust properties in the intense starburst galaxy NGC 3310, while extremely interesting by themselves (especially if found generally true for similar galaxies) complicates further the task of estimating the H2 gas mass following this method, even if H I, IR/submm dust continuum and CO images are available.
5 Summary and Conclusions
We present fully-sampled 12CO(3–2) and 12CO(1–0) observations and 850m and 450m dust continuum imaging, all at a matched beam resolution of , for the starburst NGC 3310 and the quiescent spiral NGC 157 that represent two extremes of molecular gas and dust excitation conditions in IR-luminous galaxies. Including available sensitive H I maps convolved to a similar resolution, we have obtained a detailed view of all phases of the neutral ISM in these galaxies, and an examination of the standard method of using 12CO(1–0) brightness in deducing H2 gas mass. Our conclusions are summarized as the following:
(1) The extremely high in NGC 3310 and low in NGC 157 reported by Braine et al. (1993) are not confirmed by our observations. The and ratios in NGC 3310 are still at the high end; while in NGC 157 the ratio is found to be low only in the outer disk.
(2) NGC 157 shows large variations in the ratio, which is interpreted as variations in excitation condition and hence the factor. The factor is close to the Galactic value in the quiescent regions of the outer disk where the temperature is cold (no heating) and the velocity gradient is low. In the nuclear region, on the other hand, the temperature and gas velocity gradient are high, resulting in an factor being times lower than , assuming is .
(3) The gas-to-dust mass ratio found for NGC 157 is consistent with that of the Galaxy, and using its benchmarked value in its H I-rich part (assuming it stays the same over its entire disk) independently yields an factor of times lower than its Galactic value in its H2-rich nuclear region.
(4) The factor in NGC 3310 can be times lower than its Galactic value for typical CO abundances . If one assumes that the lower metallicity values deduced for a few H II regions in this galaxy are representative of its bulk ISM (), then the factor is only times smaller than the Galactic values with the excitation effects mostly offset by the lower metallicities.
(5) We deduce an unexpected and substantial contribution from a potentially very different grain population in the starburst NGC 3310, manifesting itself as an observed submm “excess” which a classic 2T model fit to its dust emission SED would otherwise interpret as extremely cold dust with K which corresponds to gas-to-dust mass ratios of , very unlikely for a starbursting and most likely metal-poor system. We find that a low value for the frequency dependence of the extinction coefficient, , is required to explain the observations. We find that a small grain population, a possible result of the extreme radiative and SNR-dominated ISM environment of this extreme system, can account for this submm “excess” without postulating very cold dust temperatures in such an unlikely environment. We also discuss other possible explanations.
Appendix A The Interstellar Radiation Field of NGC 3310 and NGC 157
In order to calculate the dust emission, in the concept of the DBP90 model, we need to quantify the Interstellar Radiation Field (ISRF) in which the dust is immersed. We derive this radiation field from the integrated extinction corrected fluxes in the UV and optical wavelength (listed in Table 10), assuming a spherical symmetry of the emitting region with a radius of 3.2 kpc for NGC 3310 and 12.7 kpc for NGC 157. Both radii are estimated from the UV (GALEX archival data reduced by us), optical and SCUBA maps. The small size in NGC 3310 reflects the fact that both the UV and optical radiation and the dust emission are very concentrated to the center. Figure 9 shows the ISRF field for both galaxies (see the figure caption for explanation of the different symbols). We can see that the ISRF in NGC 3310 is even stronger than that of NGC 1569, which could enhance the population of very small grains.
References
- (1) Aalto S., Black J. M., & Johansson L. E. B., & Booth R. S. 1991, A&A, 249, 323
- (2) Aalto, S., Booth, R. S., Black, J. H., & Johansson, L. E. B. 1995, A&A, 300, 369
- (3) Agladze, N.I., Sievers, A.J., Jones, S.A., Burlitch, J.M., Beckwith, S.V.W., 1996, ApJ, 462 1026
- (4) Allen R. J., & Lequeux J., 1993, ApJ, 410, L15
- (5) Allen R. J., Le Bourlot J., Lequeux J., Pineau des Forêts G., & Roueff E. 1995, ApJ, 444, 157
- (6) Bernard, J.Ph., Reach, W. T., Paradis, D., Meixner, M., Paladin, R., Kawamura, A., Onishi, T., Vijh, U., et al., 2008, AJ, 136, 919
- (7) Blake, G. A., Sutton, E. C., Masson, C. R., & Phillips, T. G. 1987, ApJ, 315, 621
- (8) Bolatto A. D., Leroy A., Israel F. P., & Jackson J. M. 2003, ApJ, 595, 167
- (9) Bolatto A. D., Jackson J. M., & Ingalls J. G. 1999, ApJ, 513, 275
- (10) Braine J., & Combes F., 1992, A&A, 264, 433 (BC92)
- (11) Braine J., & Combes F., Casoli, F., Dupraz, C., Gerin, M., Klein, U., Wielebinski, R. & Brouillet, N. 1993, A&AS, 97, 887
- (12) Braine J., Duc, P.-A., Lisenfeld, U., Charmandaris, V., Vallejo, O., Leon, S. & Brinks, E. 2001, A&A, 378, 51
- (13) Bryant P. M., & Scoville N. Z. 1996, ApJ, 457, 678
- (14) Code, A., & Welch, G., 1982, ApJ, 256, 1
- (15) de Vaucouleur, G., de Vaucouleurs, A., Corwin, Jr., H.G., Buta, R. J., Paturel, G., Fouqué, P., 1991, Third Reference Catalogue of Bright Galaxies, Version 3.9 (RC3)
- (16) Desert, F.-X., Boulanger, F., & Puget, J.L., A&A, 237, 215 (DBP90)
- (17) Devereux, N., Taniguchi, Y., Sanders, D. B., Nakai, N., & Young, J. S. 1994, AJ, 107, 2006
- (18) Dickman R. L., Snell, R. L., & Schloerb, F. P. 1986, ApJ, 309, 326
- (19) Downes D., & Solomon, P. M. 1998, ApJ, 507, 615
- (20) Draine, B.T., 2003, ARA&A, 41, 241
- (21) Dumke, M., Nieten, Ch., Thuma, G., Wielebinski, R.,& Walsh, W. 2001, A&A, 373, 853
- (22) Dumke M., Krause M., & Wielebinski R. 2004, in The Neutral ISM in Starburst Galaxies ASP Conference Series, Vol. 320. pg. 134
- (23) Dunne, L., Eales, S., Edmunds, M., Ivison, R., Alexander, P., & Clements, D. L. 2000, MNRAS, 315, 115
- (24) Dunne, L., & Eales, S., 2001, MNRAS 327, 697
- (25) Galliano, F., Madden, S. C., Jones, A. P., Wilson, C. D., Bernard, J.-P., & LePeintre, F., 2003, A&A, 407, 159
- (26) Galliano, F., Madden, S. C., Jones, A. P., Wilson, C. D., & Bernard, J.-P. 2005, A&A, 434, 867
- (27) Goldreich, P., & Kwan, J. 1974, ApJ, 189, 441
- (28) Greve T. R., Bertoldi F., Smail I., et al. 2005, MNRAS, 359, 1165
- (29) Greve T. R., Papadopoulos P. P., Gao Y., & Radford S. J. E. 2009, ApJ, 692, 1432
- (30) Gregory, P.C., & Condon, J.J., 1991, ApJS 75, 1011
- (31) Falgarone, E., Panis, J.-F., Heithausen, A., Perault, M., Stutzki, J., Puget, J.-L., & Bensch, F. 1998, A&A, 331, 669
- (32) Fischera, J., & Dopita, M.A., 2008, ApJS, 176, 165
- (33) Haberl F., Filipovic M . D., Pietsch W., & Kahabka P. 2000, A&AS, 142, 41
- (34) Hartquist, T. W., Caselli, P., Rawlings, J. M. C., Ruffle, D. P., & Williams, D. A. 1998, in The Molecular Astrophysics of Stars and Galaxies, ed. T. W. Hartquist, & D. A. Williams (Oxford, Oxford University Press), 101
- (35) Helfer T., Thornley M. D., Regan M. W., Wong T., Sheth K., Vogel S. N., Blitz L., & Bock D. C.-J. 2003, ApJS, 145, 259
- (36) Holland, W.S., Robson, E.I., Gear, W.K., Cunningham, C., Lightfoot, J.F., Jenness, T., Ivison, R.J., Stevens, J.A., Ade, P.A.R., Griffin, M.J., Duncan, W.D., Murphy, A., & Naylor, D.A. 1999, MNRAS, 303, 659
- (37) Hughes D. et al. 1998, Nature, 394, 241
- (38) Israel F. P., 1988, in Millimetre and Submillimetre Astronomy, R. D. Wolstencroft and W. B. Burton eds. Kluwer Academic Publishers, p. 281
- (39) Israel F. P., 1997, A&A, 328, 471
- (40) Israel F. P., Tilanus R. P. J., & Baas F. 1998, A&A, 339, 398
- (41) Israel F. P., 1999, in H2 in Space, F. Combes, G. Pineau des Forêts eds. Cambridge University Press, Astrophysics Series
- (42) James, P.A., Shane, N.S., Beckman, J.E., et al., 2004 A&A 414, 23
- (43) Jenness T., & Lightfoot J. F., 1998, in Albrecht R., Hook R. N., Bushouse H. A., eds, ASP Conf. Ser. Vol. 145, Astronomical Data Analysis
- (44) Hildebrand, R.H., 1983, Quart.J.R.A.S., 24, 267
- (45) Kassin, S.A., de Jong, R. S., & Pogge ,R.W., 2006, ApJS, 162, 80
- (46) Kenney, J. D. P., & Young, J.S. 1989, ApJ, 344, 171
- (47) Klessen R. S., Heitsch, F., & Mac Low M.-M. 2000, ApJ, 535, 887
- (48) Knapp, G. R. & Bowers, P. F. 1988, ApJ, 331, 974
- (49) Koike,C., Hasegawa,H., & Manabe, A., 1980, Ap&SS, 67, 495
- (50) Kregel M., & Sancisi R. 2001, A&A, 376, 59
- (51) Leroy A., Bolatto A. D., Simon J. D., & Blitz L. 2005, ApJ, 625, 763
- (52) Lequeux J., Allen R. J., & Guilloteau S. 1993, A&A, 280, L23
- (53) Lisenfeld U., Israel, F.P., Stil, J.M., & Sievers, A., 2002, A&A, 382, 860
- (54) Loinard L., Allen R. J., & Lequeux J., 1995, A&A, 301, 68
- (55) Loiseau N., Nakai N., Sofue Y., Wielebinski R., Reuter H.-P., & Klein U. 1990 A&A, 228, L331
- (56) Mac Low, M.-M., Klessen, R. S., Burkert, A., & Smith, M. D. 1998, Phys. Rev. Lett., 80, 2754
- (57) Madden S. C., Poglitsch A., Geis N., Stacey G. J., & Townes C. H. 1997, ApJ, 483, 200
- (58) Maloney P. M., & Black J. H., 1988, ApJ, 325, 389
- (59) Mannings, V., & Emerson, J.P., J.P., 1994, MNRAS, 267, 361
- (60) Mao R. Q., Henkel C., Schulz A., Zielinksy M., Mauersberger R., Störzer H., Wilson T. L., & Gensheimer P. 2000, A&A, 358, 433
- (61) Mathis, J.S., & Whiffen, G., 1989, ApJ, 341, 808
- (62) Meijerink R., Tilanus R. P. J., Dullemond C. P., Israel F. P., & van der Werf P. P. 2005, A&A, 430, 427
- (63) Meny , C., Gromov, V., Boudet, N., Bernard, J.-Ph., Paradis, D., Nayral, C., 2007, A&A, 468, 171
- (64) Mulder P. S., van Driel W., & Braine J. 1995, A&A, 300, 687
- (65) Narayanan D., Groppi C. E., Kulesa C. A., & Walker C. K. 2005, ApJ, 630, 269
- (66) Nelson A. E., Zaritsky D., & Cutri R. M. 1998, AJ, 115, 2273
- (67) Papadopoulos P. P., & Seaquist E. R. 1998, ApJ, 492, 521
- (68) Papadopoulos P. P., & Seaquist E. R. 1999, ApJ, 516, 114
- (69) Papadopoulos P. P., & Allen M. L. 2000, ApJ, 537, 631
- (70) Pak S., Jaffe D. T., van Dishoeck E. F., Johansson L. E. B., & Booth R. S. 1998, ApJ, 498, 735
- (71) Pastoriza M.G., Dottori H.A., Terlevich E., Terlevich R., & Diaz, A.I. 1993, MNRAS, 260, 177
- (72) Plume R., et al. 2000, ApJ, 539, L133
- (73) Reach W. T., Wall W. F., & Odegard N. 1998, ApJ, 507, 507
- (74) Ryder S. D., Zasov A. V., McIntyre V. J., Walsh W., & Sil’chenko O. K. 1998, MNRAS, 293, 411
- (75) Seki, J., & Yamamoto, T., 1989, Ap&SS, 72, 79
- (76) Smail I., Ivison R. J., & Blain A. W. 1997, ApJ, 490, L5
- (77) Sodroski et al. 1994, ApJ, 428, 638
- (78) Sodroski et al. 1995, ApJ, 452, 262
- (79) Soifer, B.T., Boehmer, L., Neugebauer, G., & Sanders, D.B., 1989, AJ, 98, 766
- (80) Solomon P. M., Downes D., Radford S.J.E., & Barrett J. W. 1997, ApJ, 478, 144
- (81) Stevens, J.A., Amure, M., & Gear, W.K., 2005, MNRAS, 357, 361
- (82) Strong, A. W.,& Mattox, J. R. 1996, A&A, 308, L21
- (83) Tacconi, L. J., Genzel, R. et al. 2008, ApJ, 680, 246
- (84) Thomas H. C., Clemens M. S., Alexander P., Green D. A., Eales S., & Dunne L. 2001, in ASP Conf. Ser. 240, Gas and Galaxy Evolution, ed. J. E. Hibbard, M. Rupen, & J. H. van Gorkom (San Francisco: ASP), 224
- (85) Thomas H. C., Dunne L., Clemens M. S., Alexander P., Eales S., Green D. A., & James A. 2002, MNRAS, 331, 853
- (86) Tielens, A.G.G.M., & Allamandola L.J. 1987, in Interstellar Processes, D.J. Thronson Jr. ed. Reidel, Dordrecht, p. 397
- (87) Tinney, C. G., Scoville, N. Z., Sanders, D. B.& Soifer, B. T. 1990, ApJ, 362,473
- (88) Wilson R. W., Jefferts K. B., & Penzias A. A. 1970, ApJ, 161, L43
- (89) Wilson T. L., & Mauersberger R. 1994, A&A, 282, L41
- (90) Whiteoak, J.B., 1970, ApJ 5, L29
- (91) Wolfire M. G., Hollenbach D., & Tielens A. G. G. M. 1993, ApJ, 402, 195
- (92) Wong T., & Blitz L., 2002, ApJ, 569, 157
- (93) Xilouris E. M., Byun Y. I., Kylafis N. D., Paleologou E. V., & Papamastorakis J. 1999, A&A, 344, 868
- (94) Yao L., Seaquist E. R., Kuno N., & Dunne L. 2003, ApJ, 588, 771
- (95) Young J. S., & Scoville N. Z. S., 1991, ARAAS, Vol. 29, 581
- (96) Young, J.S., Xie, S., Kenney, J. D. P., Rice, W. L. et al. 1989 ApJS, 70, 699
- (97) Young, J. S., Xie, Sh., Tacconi, L., Knezek, P., Viscuso, P et al. 1995, ApJS, 98, 219
- (98) Zhu, M., Seaquist, E. R., & Kuno, N. 2003, ApJ, 588, 243
- (99) Zhu, M., Gao, Y., Seaquist, E. R., & Dunne, L. 2007, AJ, 134, 118
FIGURES: