Fluctuations, Jamming, and Yielding for a Driven Probe Particle in Disordered Disk Assemblies
Abstract
Using numerical simulations we examine the velocity fluctuations of a probe particle driven with constant force through a two-dimensional disordered assembly of disks which has a well defined jamming point J at a density of . As increases toward , the average velocity of the probe particle decreases and the velocity fluctuations show an increasingly intermittent or avalanchelike behavior. When the system is within a few percent of the jamming density, the velocity distributions are exponential, while when the system is less than a percent away from jamming, the velocity distributions have a non-exponential or power law character. The velocity power spectra exhibit a crossover from a Lorentzian form to a shape near jamming. We extract a correlation length exponent which is in good agreement with recent shear simulations. For , there is a critical threshold force that must be applied for the probe particle to move through the sample which increases with increasing . The onset of the probe motion above occurs via a local yielding of the particles around the probe particle which we term a local shear banding effect.
pacs:
45.70.-n,45.70.Ht,05.40.CaI Introduction
When a disordered assembly of particles with short-range steric interactions becomes dense enough that the particles begin to overlap, a transition occurs from an unjammed state where the system easily flows or acts like a liquid to a jammed state where the system resists shear and shows a solid-like response. Liu and Nagel proposed a general phase diagram for disordered particle assemblies where a transition into a jammed state occurs as a function of several different variables including increasing density, decreasing external forcing, or decreasing temperature Nagel . At ‘Point J’ on this phase diagram, jamming occurs for increasing density at zero stress and zero temperature Hern . There is growing evidence that point J has the properties of a critical point with diverging length scales on both sides of the jamming transition Hern ; Drocco ; Silbert ; Silke ; Wyart1 ; S ; El ; B ; Olsson ; Wyart ; Barrat ; Hatano ; Head ; Zhang . Point J has been well studied in the particular system of two-dimensional, finite range repulsive frictionless bidisperse disks with a radii ratio of Hern ; Drocco ; Olsson ; Barrat ; Head . The bidispersity is necessary to prevent the system from crystallizing. Simulations show that the jamming density , and experimental realizations of this system also give a similar jamming density Zhang ; CD .
One aspect of jamming that has been less well studied is the dynamical response as point J is approached. If point J is a critical point, it could have strong effects on the dynamical response of the system to global or local forcing and may give rise to intermittent or avalanche behavior. In the numerical work of Drocco et al. Drocco , the velocity fluctuations of a single probe particle driven with constant force showed signs of increasing intermittency and avalanche characteristics as approached . More recent experimental work in which a single probe particle was driven at constant force through a granular packing also indicates that the velocity fluctuations become increasingly intermittent as is approached CD . These results suggest that proximity to point J will strongly affect the dynamics and may result in the appearance of critical properties.
The velocity and force characteristics of a locally driven particle have already been used as a probe of the yielding and dynamical properties of a two-dimensional disordered colloid system, where a finite threshold force must be applied before the particle can be set in motion Hastings ; LM . Experiments and simulations of three-dimensional disordered colloidal systems have shown that a threshold force for motion appears when the density is high enough for a glass transition to occur Weeks ; Ga , while for jamming in two dimensions a finite threshold force is also expected to appear above the jamming transition. Drag effects in granular systems have been studied by moving a large obstacle through the granular media Albert ; Albert2 . Geng and Behringer analyzed the fluctuations of a probe particle held fixed in a two-dimensional system while the remaining grains were driven past Geng , and found that the force fluctuations have intermittent characteristics and are exponentially distributed.
In this work we examine the velocity fluctuations of a probe disk driven with constant force through a two-dimensional bidisperse system of disks as the density of the system passes through point J. As is approached from below, the velocity fluctuations show increasingly intermittent properties characterized by large bursts of motion. The average probe particle velocity initially decreases linearly with increasing ; however, within a few percent of the jamming density, the average velocity falls to zero in a nonlinear manner. The velocity fluctuations are exponentially distributed when is within several percent of the jamming density, while within one percent of the velocity fluctuations have a non-exponential distribution which can be fit with a power law. The power spectra shows a Lorentzian behavior with a behavior at high frequencies that is similar to the results found in the slow drag experiments of Ref. Geng ; however, very close to jamming the low frequency response exhibits a behavior. The local rearrangements of disks near the probe particle increase in spatial extent as the jamming transition is approached from below.
For , the probe particle is always able to move through the sample for arbitrarily small driving forces. In contrast, for , there is a finite threshold force required to move the probe particle. Above the threshold force, progress of the probe particle is made possible by yielding of the surrounding particles that occurs via local plastic rearrangements of the disks near the moving probe particle. The appearance of a finite driving threshold in the jammed phase is similar to recent numerical studies of dense colloidal systems where a threshold force appeared in sufficiently dense samples Ga . We find that the threshold force increases with increasing . The velocity fluctuations at drives just above the yielding transition have a nonexponential distribution, while at higher drives the velocity fluctuations become exponentially distributed. When the probe particle moves, it creates local rearrangements or a local shear banding.
II Simulation
We simulate a two-dimensional bidisperse system of disks of size with periodic boundary conditions in the and directions. The particles are modeled as repulsively harmonically interacting disks of radii or with a size ratio of . The ratio of A and B particles is . The initial disk packing is obtained by placing the disks in non-overlapping locations and then shrinking all disks, adding a few additional disks, and reexpanding all disks while thermally agitating the disks. This process is repeated until the desired density is obtained. After the disk configuration is generated, we select a single disk and drive it with a constant force . The motion of an individual disk at position is governed by the following overdamped equation:
Here is the Heaviside step function, , and , where and are either or depending on the type of each disk. We take the spring constant . The driving term is applied to only one disk and we can extract the instantaneous velocities of all disks. In this work, and the jamming density is , corresponding to approximately disks. The ability to experimentally realize a system where the probe particle velocity can be examined under a constant driving force has recently been demonstrated CD .
III Velocity Fluctuations Below Jamming
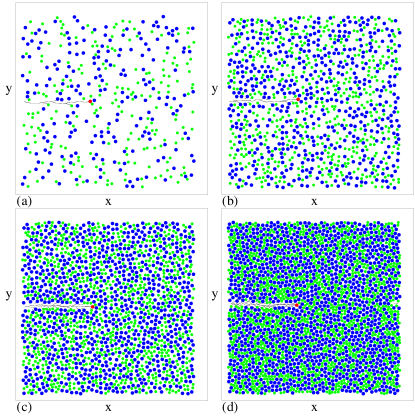
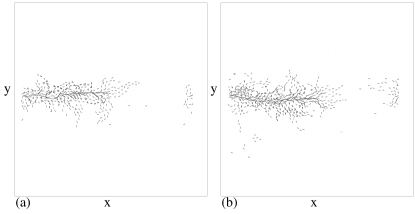
In Fig. 1 we show snapshots of the system at different densities of , 0.323, 0.55, and . The probe particle is highlighted and the trajectories of all grains are indicated as the probe moves of the way through the sample. The larger disks are dark colored, the smaller disks are light colored, and the overall disk arrangement is disordered. At each of the densities presented, the probe particle leaves an empty space behind it after pushing the other disks out of the way, as is most evident in Fig. 1(c). The appearance of an empty trail behind the probe particle generally occurs for any density below since there is no pressure in the system to force the surrounding particles back into the empty space.
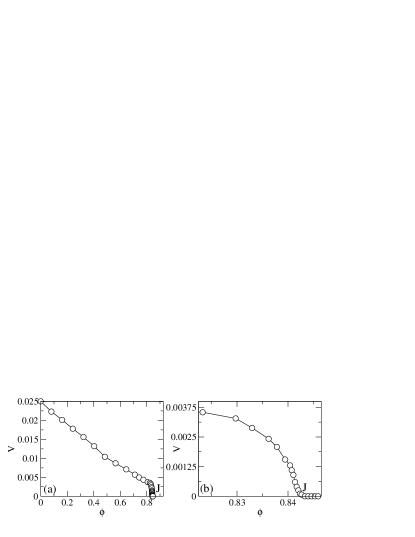
To construct velocity histograms for different densities at fixed driving force, we perform a series of simulations at increasing values of and measure the instantaneous time trace of the probe particle velocity in the direction of the drive, . We then average the velocities over the entire trace to obtain . In Fig. 2(a) we plot vs for a system with . Here monotonically decreases with and goes to zero at , a jamming density which is in agreement with other studies Barrat ; Head . Fig. 2(a) also shows that slope of the decrease in with increasing becomes shallower above , and that changes from a roughly linear decrease with increasing to a much more rapid nonlinear decrease for . When , the probe particle motion alternates between free motion unimpeded by any disks and occasional collisions during which the probe particle pushes one additional disk along with it. We show later that this appears as a clear feature in the velocity distributions. For , the probe particle spends most of its time pushing one or more particles but the number of dragged particles remains small. The distance over which the probe particle drags individual background disks varies widely due to interactions among the dragged disks which create random fluctuations for the dragged disk closest to the probe particle. For , the induced motions in the background packing become increasingly collective, and even disks which are far away from the probe particle can participate in the motion. In Fig. 2(b) we plot versus close to jamming. The velocity decreases in a nonlinear fashion within three percent of the jamming density. Within less than one percent of , the velocity curve is still nonlinear; however, the concavity of the slope of versus changes sign. In a later section we discuss how the velocity scales near jamming and how it can be related to a diverging correlation length.

We next examine in detail the velocity distributions obtained from time series taken at fixed values of . In Fig. 3(a) we plot for a sample with and , the same system shown in Fig. 1(b). This single time trace is taken during the period required for the particle to move slightly more than halfway through the sample. Figure 3(a) shows that the probe particle often moves at the maximum possible velocity . The plateaus at occur when the probe particle is not in contact with any other disks. Collisions with other disks reduce the velocity of the probe particle and in some cases the probe pushes one or more background particles for a period of time, creating characteristic drops in of or more as seen in Fig. 3(a). In Fig. 3(b) we plot the distribution of the velocities for the system in Fig. 3(a). The histogram is obtained from ten simulations in which the probe particle is selected at different locations in the sample and driven over equal distances. In this work all curves are normalized such that the sum of the probabilities equals . In Fig. 3(b) a large peak appears at , corresponding to time periods when the probe particle moves freely without colliding with any background particles, as indicated by the upper plateaus at in in Fig. 3(a). Figure 3(b) shows that there is a second peak in centered at , which is half of the value of the free particle velocity. This peak corresponds to the time the probe particle spends pushing one additional disk, which doubles the drag. The same double peak feature in appears for all . In this regime, we find that as increases, the relative weight of the peak decreases and is shifted to the peak. In Fig. 3(c,d) we plot and for a higher . Here the weight at is significantly reduced and the peak probability has shifted to . There is still a peak at which is now higher than than the peak.


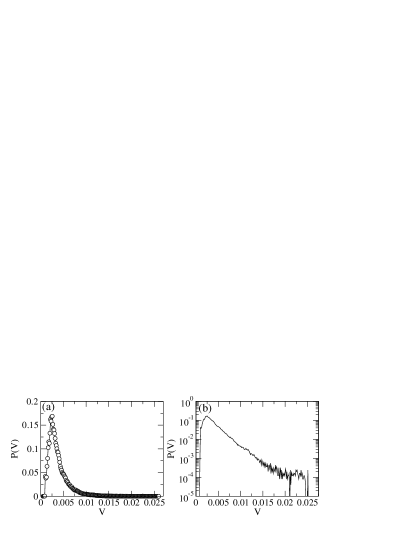
For , the system is dense enough that the probe particle spends very little time moving freely out of contact with other particles. In Fig. 4(a) we illustrate that for has an intermittent character with large velocity spikes. A blow up in Fig. 4(b) of one of the velocity spikes from Fig. 4(a) shows that there is some asymmetry in the pulses. A slow build up in the velocity is followed by a sharper velocity drop. In Fig. 5(a), for has a maximum near with a long tail ending at . There are only very small peaks near and which are remnants of the type of dynamics seen in Fig. 3(a,b). In Fig. 5(b) we plot on a log-linear scale to indicate that the tail has an exponential form. There are some deviations from a single exponential fit for due to the existence of an upper bound on the velocities which generates a peak at . The intermittency and asymmetry of the velocity jumps are very similar to the observations in two-dimensional drag experiments near the jamming transition Geng . In those experiments, the stress rather than velocity fluctuations were measured, so the asymmetry is reversed. The experiments of Ref. Geng also showed that the fluctuations had a maximum with an exponential tail feature similar to that seen in Fig. 5(b)

In Fig. 6(a) we show for , where the intermittency is more pronounced. The maximum value of the velocity spikes is always below , indicating that the probe particle is always in contact with the surrounding particles and never moves freely. The increasing intermittency is similar in appearance to the stress fluctuations seen in shear experiments Beh . Figure 6(b) shows a blowup of a velocity spike from Fig. 6(a) indicating that the same asymmetry observed for persists. In Fig. 7(a) we plot for , where the peak probability is shifted to a lower velocity and the velocity tail is more pronounced. Fig. 7(b) shows at on a log-linear plot illustrating that the tail has an exponential form. In the dragging experiments of Geng and Behringer in Ref. Geng , the maximum density that was studied was around , close to the density presented in Fig. 7. In the experimental work, the avalanche events were found to have an exponential distribution very similar to the fluctuations we observe in Fig. 7(a). The fact that the slow drag experimental system in Ref. Geng could not go to higher packing fractions is likely due to frictional forces, which are absent in our system. In general we observe the same type of exponential decay in the tail of the velocities for densities up to within two percent of .

In Fig. 8 we plot for , which is within a fraction of . Here the fluctuations show a pronounced intermittency where the velocity drops almost to zero between velocity bursts. In Fig. 9(a) we show for in log-log format and in Fig. 9(b) we show the same data on a log-normal scale. The light line is a a power law fit with an exponent of . The power law fit is valid for slightly more than a decade, so at this density we cannot rule out a stretched exponential form; however, a purely exponential fit of the type performed at the lower densities of and no longer fits the data.
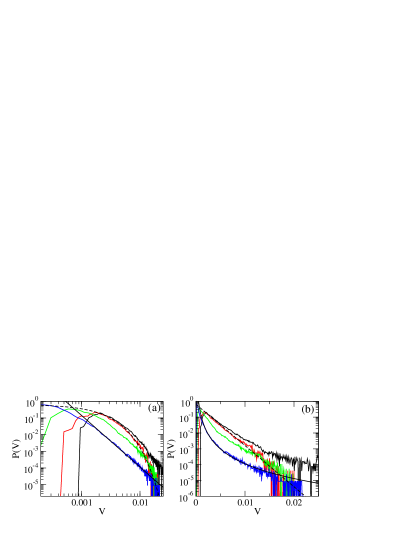
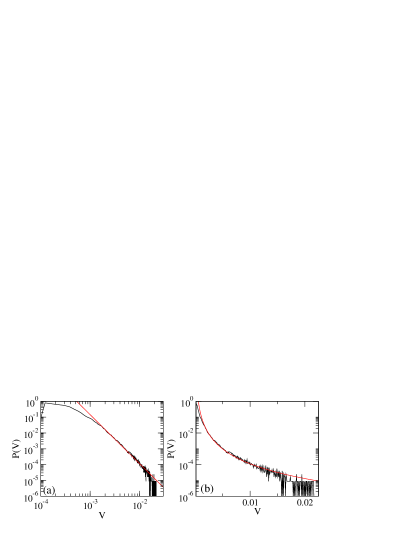
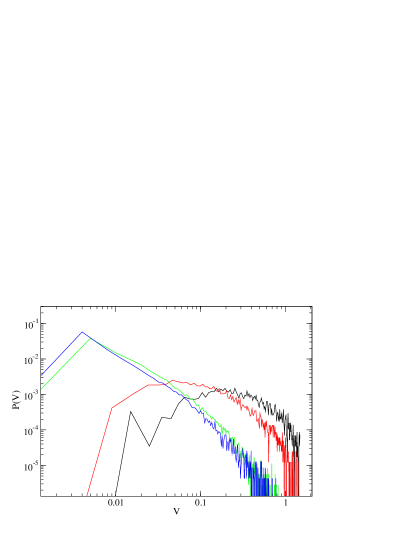
In Fig. 10(a) we plot for , 0.833, 0.8395, and on a log-log scale while in Fig. 10(b) we plot the same curves on a log-linear scale to show that the velocity distribution tails change from an exponential to a power law form. The densities and 0.833 are fitted well by an exponential, but this fit deviates for and , crossing over to a power law form. If point J is a critical point as suggested in recent studies, than the various quantities should diverge as a power law as is approached and the dynamical response should also reflect the critical properties. In general, critical phenomena or fluctuations should only be relevant within 1 percent of the critical point or closer, which is consistent with our observations. We note that the power law exponent of used to fit our data close to jamming is comparable to results obtained for recent experimental studies of granular slip systems where the energy is released in avalanche events distributed with power law exponents of Daniels .
Several factors limit how closely we can approach . One is the fact that we have a finite but small drive on the particle of . Ideally, a vanishingly small drive would be best, but with smaller drives prohibitively long simulation times are necessary to obtain adequate statistics. Another issue is that for densities close to , it possible that the probe particle can move for some distance and then jam. This effect was noted in the work of O’Hern et al. who found that the distribution of possible jammed configurations peaks around but that there was still some finite width to this peak as long as the system was finite Hern .
Velocity fluctuations with power law distributions have also been observed in chute flow systems, where three phases are identified as a function of density: a low density free-falling region, a small liquid-like region, and a high density solid or glassy region Co . In the liquid-like region, the velocities can be fit to a power law with exponents of to . Even though the chute flow system is three-dimensional, one possible interpretation of our two-dimensional results is that the low density regime is similar to the free-falling regime, while the glassy or solid and the liquidlike regimes could correspond to the region just before jamming where we find power law distributions.
It is interesting to ask why the non-exponential features such as those in Fig. 9 were not observed in the slow drag experiments of Ref. Geng . In the experiments the jamming density fell at a lower than our , which is likely due to frictional effects. Although the experimental system is jammed, it does not appear to have the same critical properties that are associated with the frictionless grains at . This implies that the concept of critical jamming may be limited to certain types of models of jamming and that criticality at point J may occur only in the frictionless limit.
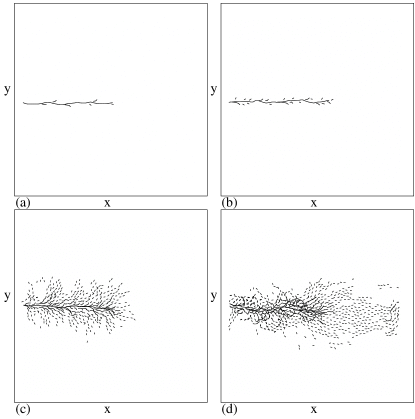
In Fig. 11 we plot the trajectories of the particles as the probe moves halfway through the sample. In Fig. 11(a,b) at and , the main trajectory of the probe particle appears as a continuous line. Only small perturbations of the surrounding particles appear near the probe particle, showing that the perturbations are all highly localized. For in Fig. 11(c), the perturbation extends much further from the probe particle in the transverse direction, with motion occurring for particles that are up to nine lattice constants away from the driven particle. Here the trajectories of the surrounding particles are very short and do not intertwine. For in Fig. 11(d), the extent of the maximum transverse perturbations is only slightly larger than at ; however, the perturbations ahead of the probe particle are much larger. In addition, the motion of the surrounding particles takes two different forms. The first type of motion consists of those particles which move in straight trajectories, as seen at lower . The second type of motion involves particles which move in larger circular trajectories that intertwine with the trajectories of other particles. These trajectories are associated with plastic deformations in which some of the surrounding particles move around one another. Similar plastic rearrangements of the surrounding particles caused by the motion of a probe particle were observed in a charged colloidal media Hastings . In Ref. Hastings there was a threshold for the motion of the driven particle, unlike the motion in Fig. 11(d) which occurs with no threshold. The plastic deformation trajectories that we observe are similar to topological changes or T1 events. We also note that Fig. 2(b) indicated that does not develop a nonlinear dependence on until . We only observe the intersecting plastic trajectories for . It is possible that the nonlinearity in may be associated with the onset of the plastic motions.
III.1 Power Spectra
Another quantity that was measured in the slow drag experiments of Ref. Geng is the power spectrum
In Ref. Geng , the force fluctuations showed an behavior at high frequencies with a knee or roll off to a flat spectrum at low frequencies. The roll off frequency shifted to lower frequencies with lower rotation rates. The same type of behavior was also observed for increasing densities and no clear signature appeared in the power spectrum of the fluctuations just before jamming. In our system, the frequency range is cut off by the inverse of the time required for the particle to transverse half of the system, so for higher densities where the probe particle moves more slowly, we can access lower frequencies.
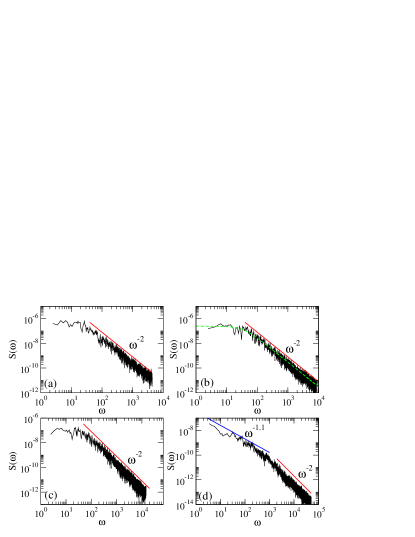
For , we find that the power spectra of the velocity fluctuations have the same features as the experiment in Ref. Geng . In Fig. 12(a,b,c) we plot the power spectra for , 0.71, and 0.823 showing an feature at high frequency and a knee feature at lower frequencies that is very similar to those seen in experiments. The power spectra can be fit to a Lorentzian form as indicated in Fig. 12(b),
Here is the crossover frequency at the knee and is the spectral power along the flat portion of the spectrum below the knee. The presence of a Lorentzian can be interpreted as the emergence of a characteristic time scale. At the lower the time scale could be the average time between collisions or an average time between the large velocity bursts. In general, for increasing we find that the knee feature shifts to lower frequencies.
In Fig. 12(d) we plot for within the regime where the velocity histograms showed a power law form. Here the spectrum no longer has a Lorentzian form but shows a signal at low frequencies followed by the persistent feature at higher frequencies. The appearance of noise is indicative of the presence of scale-free fluctuations, which are consistent with a critical phenomenon. We note that if we were able to perform very long time traces and access lower frequencies, the low frequency noise power would be higher than the noise power in the flat portion of the Lorentzian found at lower densities, implying that the low frequency noise power may diverge as the jamming transition is approached. A divergence in the noise power at generic second order phase transitions has recently been proposed Yu which is consistent with our results. We also note that a peak in the noise power and the onset of noise were observed two-dimensional systems at disordering transitions Olson .
The slow drag experiments of Ref. Geng may not have been able to access the true critical properties of point J since the fluctuations were examined at a lower than the expected . The drag experiments of Albert et al. Albert also produced Lorentzian type power spectra. We note that this was in a three-dimensional system where frictional effects may also have been relevant.
It would be interesting to see whether a crossover from Lorentzian to noise occurs experimentally as jamming is approached. In Ref. Fanklin , a probe particle was pushed from the bottom of a packing of rodlike particles and a transition from noise to noise was correlated with a transition from stick-slip type motion to the motion of a solid plug. Although this result is consistent with our results, the experimental system is somewhat different in that there are no particle rearrangements in the solid plug state and the noise is due to friction effects with the wall.
III.2 Driving Rate Dependence
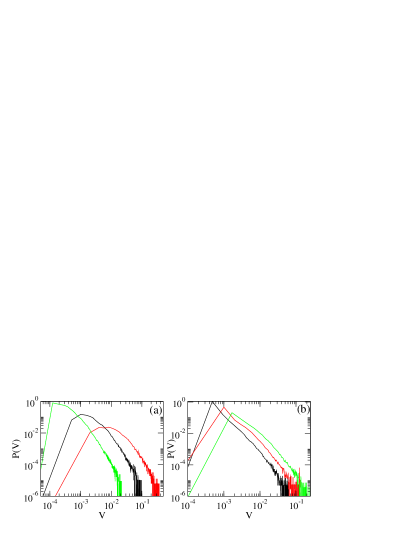
We next examine how the velocity fluctuations vary with the magnitude of the driving force on the probe particle. In Fig. 13 we plot at for , , and . For there is a peak in at and for the peak shifts to . In both cases the tail also shifts to higher . For the velocity tail can still be fit to a power law; however, the range of the fit is reduced from the case and for the range of the fit is even smaller. This suggests that the critical fluctuations are most prominent in the limit of small driving forces.
In Fig. 13(b) we plot on a log-log scale at , 0.125, and 0.25 for a system with which is within of the jamming density. At this density, for it is difficult to obtain enough statistics for a histogram due to the very long simulation times; also, when the system is this close to the jamming density, the probe particle can in some cases jam before it moves halfway through the system. At the jamming density the probe particle almost aways jams instantly. For the lowest drive of , Fig. 13(b) shows that has a power law form. The data can be fit with an exponent of over a range of two decades, while if we use only data with , a fit with is better. Although we cannot more firmly establish the exact exponent, Fig. 13(b) indicates that the distributions cannot be fit well to a purely exponential form.
III.3 Estimation of the Correlation Length Scale Exponent
In Ref. Drocco , a measurement of the number of disks that were pushed along with the probe particle was used to obtain the exponent of a diverging correlation length,
| (1) |
The resulting value of was between and . Other estimates of the exponent for the same two-dimensional disk system have given Hern , Olsson , and Head . More recent quasistatic shearing simulations TeitelNew have found higher estimates of and ; it is also argued that the exponent is sensitive to the exact value of , which may explain why the exponents in Refs. Drocco ; Olsson are somewhat smaller. References Drocco ; Olsson both used about 1200 particles, with Ref. Drocco reporting for a driven probe particle and Ref. Olsson giving for a shearing simulation. In Ref. Barrat , where a higher value of was obtained, about 2500 particles were used. In the present work we have a comparable number of particles and we find in agreement with Ref. Barrat . More recent shearing simulations with larger systems than in Olsson have found a higher value of and TeitelNew so we believe a value of is reasonably accurate.
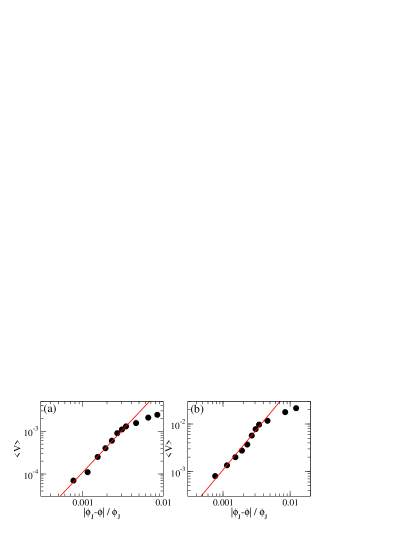
In Fig. 2(b), the velocity drops to zero in a nonlinear fashion as increases toward and the concavity in the velocity also changes very near jamming. We can estimate based on the scaling behavior of as the jamming transition is approached. At , the probe particle moves with a free velocity of . At nonzero , the velocity of the probe particle decreases according to , where is the number of other disks that are being pushed along by the probe particle. If the pushed particles are within a disklike jammed area of radius that surrounds the probe particle, then . If , then the velocity should scale as . From the velocity versus curves we can fit , giving . In Fig. 14(a) we plot vs for along with a fit of , which gives . Figure 14(b) shows the same plot for where we obtain and . These values are within the range of the estimates from the quasistatic shearing simulations of Ref. Barrat . We note that other theoretical studies have found Silke ; Wyart1 ; El . Although our scaling range is too small to give a definitive value for , our results along with the other simulations Drocco ; Olsson ; Barrat ; Head are consistent with . It is possible that there is more than one diverging length scale near jamming. From the images of the particle displacements near jamming in Fig. 11, there appear to be two different modes of displacements of the surrounding particles: the small displacements that extend in front of the driven particle and the plastic deformations that occur further from the probe particle. It may be that there is a different length scale associated with each of these two types of motion.
III.4 Velocity Force Curves
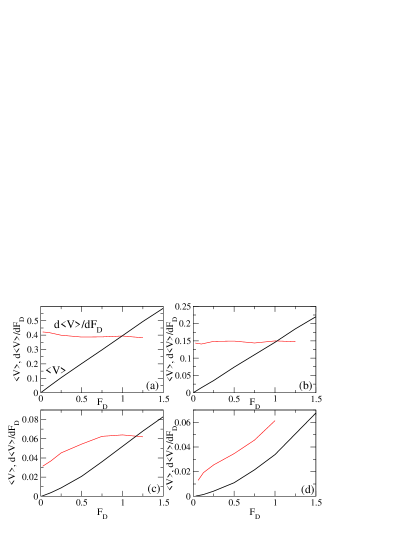
We next examine the average velocity versus for varied . At in the absence of other disks, the overdamped dynamics we employ cause the velocity of the probe particle to vary linearly with the applied force, . For well below , collisions with other particles reduce the probe particle velocity and increase the effective viscosity; however, the velocity-force curves remain linear as shown in Fig. 15(a,b) for and . The plots of in Fig. 15(a,b) have little curvature, which is consistent with a linear velocity-force relationship. Very close to jamming the velocity-force curves become nonlinear as seen in Fig. 15(c,d) for and , where the curves show growing deviation from linearity.
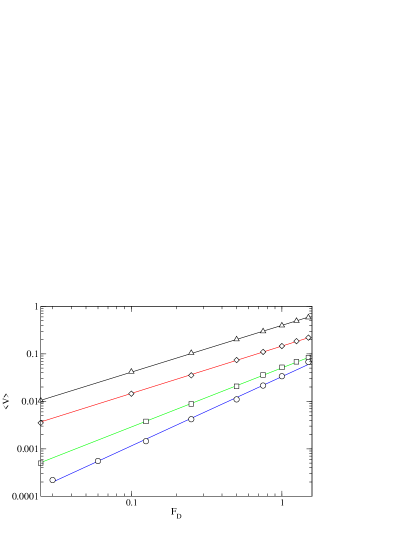
In Fig. 16 we plot vs on a log-log scale where the solid lines are power law fits with the form . For and the fits are linear with , while for and , the fits give and , respectively. In general, exponents are not expected to change continuously near a critical point so the exponent at probably originates from a smeared combination of linear and nonlinear regions. The exponent of at should be more accurate and is also in agreement with a number of previous studies of single driven probe particles. Simulations of a driven particle moving through a disordered assembly of charged colloids gave an exponent of Hastings ; LM . In both the colloidal system and the disk system, there are plastic rearrangements of the particles around the probe particle; however, there are several differences between the two systems, including the fact that the colloidal particle is effectively jammed at low drives and has a nonzero critical threshold force for motion. Additionally, in the charged colloid system there is no well defined jamming density due to the longer range soft Yukawa interaction potential. Experiments where a single probe particle is driven through a three-dimensional colloidal system as the density is increased towards the glass transition gave an exponent of at densities below the glass transition, which can be interpreted as below the jamming transition Weeks . The closest experimental realization of our system is the work in Ref. CD where a probe particle is driven through a two-dimensional assembly of grains. One difference between the experiments in Ref. CD and our simulations is that the experiment contains an additional vibration to induce a fluidized state. In the experiment, linear velocity-force curves appear at low densities, while closer to jamming there is a nonlinear region at low drives with a crossover to a linear region at high drives. This crossover shifts to higher values of as the jamming transition is approached. In the nonlinear regime, Ref. CD used a fit to rather than a power law; however, the range of the data is sufficiently small that it does not rule out a power law fit. Additionally, it is possible that the applied vibrations induce activation dynamics that are not present in our work. Despite these differences, the onset of nonlinear velocity-force curves and increased intermittency close to jamming found in Ref. CD are consistent with our results.
We note that a power law fit to the velocity force curves has been associated with criticality at the onset of motion in other two-dimensional systems. In particular, extensive studies have been performed on plastic depinning of particle assemblies driven over rough landscapes in systems ranging from colloidal particles moving over disordered substrates Reichhardt2 ; Ling , vortices in type-II superconductors Dominguez , and generalized models of particle motion over quenched disorder Fisher . In these systems, the velocity response can be fit to the form
| (2) |
Here is the threshold force that must be applied for motion to occur. For , we find ; however, velocity-force curves with nonlinear scaling can still occur even in the absence of a threshold. In the collective depinning systems, exponents of to are generally observed. Our results showing a crossover from linear to nonlinear velocity-force curves near jamming are a further indication that point J exhibits critical properties and that this critically also appears in transport.
IV Threshold and Yielding Above Jamming
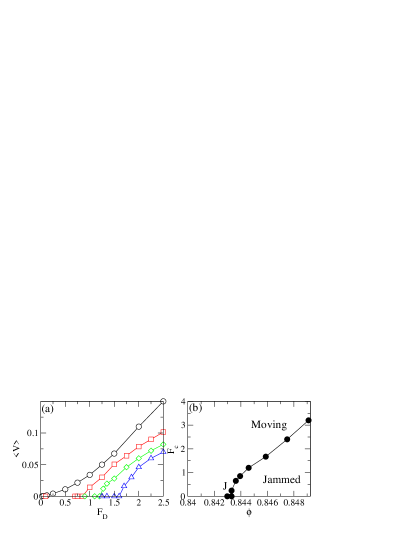
We next show that for , there is a finite threshold force required to move the probe particle through the background of disks. In the jammed phase, it is known that the onset of motion or yielding consists of a coexistence between an unjammed fluid phase and a jammed solid phase, and that in the presence of a shear, the motion may be confined within a certain region due to shear banding Dennin . In Fig. 17(a) we plot vs for , 0.8439, 0.8446, and . Here the probe is immobile or pinned at low drives for as indicated by the fact that until the external force reaches a critical force for motion. At densities just below jamming, Fig. 16(b) showed that the velocity-force curves have positive curvature with . Above jamming, the velocity-force curves have a different form and are more consistent with either a linear dependence or with . Although we do not have the accuracy in this regime to determine the exact form of the velocity-force curves above jamming, our results suggest that the onset of motion is different for than for .
The threshold force increases with increasing . In Fig. 17(b) we plot vs showing the onset of the threshold at point and the subsequent rapid increase of with increasing . Well above , increases roughly linearly with increasing . The appearance of a threshold and the general shape of the curve is in agreement with recent three-dimensional colloid simulations in which a threshold for motion appears above a certain packing density Ga . We note that in our system, the disks interact with a harmonic potential and are soft enough that the probe particle can squeeze between neighboring disks above jamming. A similar yielding appears in shearing simulations performed above jamming Olsson ; Barrat . For real granular systems with frictional effects and much stiffer interactions between particles, it would be difficult to move the probe particle through the system above jamming. For colloidal particles with much softer interactions, a threshold force can be extracted as has been demonstrated in experiment Weeks .
In Fig. 18(a,b) we plot the particle trajectories at a drive just above the depinning threshold for and , where plastic deformations occur within a localized region. The trajectories are qualitatively similar to the case shown in Fig. 11(d) where the motion consisted of a combination of particles close to the driven particle being pushed linearly over a small distance while particles further from the driven particle undergo intertwining plastic motion. One noticeable difference is that the spatial extent of the perturbations above jamming is less than that seen below jamming at . Additionally, the spatial extent of the perturbations above jamming does not appear to rapidly grow in size as increases above . The fact that the motion is more localized above jamming suggests that in this regime the system is only plastically distorted near the probe while the remaining portion of the system acts rigidly elastic. We call this a local shear banding effect, and it suggests that the onset of motion or yielding above jamming is consistent with the behavior of a disordered elastic solid. A similar conclusion that the state above jamming is a disordered elastic solid was drawn from two-dimensional shearing simulations Barrat .
In Fig. 19 we plot for at , 1.85, 4.0, and . At and , has a broad form with non-exponential features. Attempts to perform a single power law fit for the higher values of in this regime give only a limited range with an exponent of . For the higher drives and , there is still a tail at high drives; however, a power law fit cannot be performed.
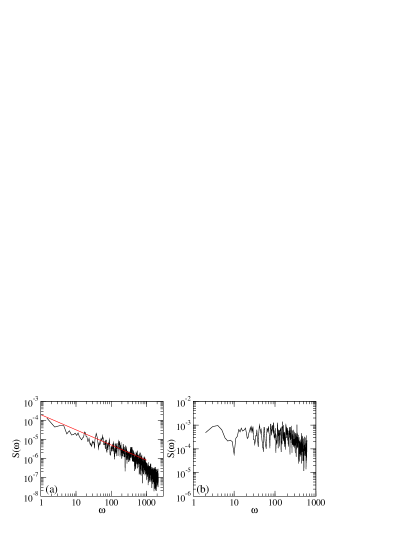
In Fig. 20(a) we show the power spectrum of at for , just above depinning. The solid line is a power law fit to . We obtain over a wide range of low frequencies, with a small region of dependence at high frequencies. The smallness of the regime is a reversal from what we observe below jamming, where the frequency dependence dominates over a large range until just below the jamming transition. In Fig. 20(b) we plot for the same density but at , well above the depinning threshold. In this case, at low frequencies a white spectrum with appears.
V Summary
In summary, we have numerically investigated the velocity fluctuations of a driven probe particle as it moves through a bidisperse assembly of disks in two dimensions. The particular model we study is composed of harmonically interacting disks with a radius ratio. We find a jamming density of , in agreement with recent numerical work on the same system CD ; Head ; Barrat . For a constant driving force on the probe particle, we find that the average probe velocity goes to zero continuously as approaches from below and that the velocity fluctuations develop increasingly intermittent features close to . The velocity distribution functions have long tails which fall off exponentially, similar to the force fluctuations observed in the slow drag experiments of Geng and Behringer Geng . When is within one percent of , the velocity distributions can no longer be fit to a purely exponential form and have a power law shape suggesting that the system is exhibiting fluctuations of a critical type. The extent of the perturbations caused by the driven grain in the surrounding packing also grows as jamming as approached and the perturbations take two forms. The first is small linear displacements of less than a lattice constant, while the second is large winding displacements which are associated with plastic rearrangements. The plastic rearrangements occur only very near point J where the power law velocity distributions are observed. The power spectrum of the fluctuations below jamming has a Lorentzian shape with a knee at a crossover frequency and behavior at higher frequencies, similar to the spectral signatures found in slow drag experiments Geng . Just below the jamming transition, the power spectrum changes shape and develops a low frequency behavior. The velocity-force curves are linear below jamming, but become nonlinear with a power law form just at the jamming transition. The appearance of nonexponential velocity distributions, the onset of noise and the development of power law velocity-force curves are all consistent with jamming having the signatures of a critical phenomenon. From the velocity versus curves, we obtain an estimate for the correlation length exponent , in agreement with recent studies Barrat ; TeitelNew . For we find that a critical threshold force is required to set the probe particle in motion, in agreement with recent numerical studies of driven probe particles in dense colloidal assemblies at densities above jamming LM . The threshold force increases with increasing and the motion consists of localized plastic distortions near the moving particle which we call a local shear banding effect. The velocity fluctuations at drives just above the threshold force have a nonexponential form and the power spectrum exhibits a shape. For higher drives, the velocities are exponentially distributed, suggesting that the onset of yielding by the probe particle for has similar properties to yielding at point .
We thank M. Hastings, L. Silbert, and S. Teitel for useful comments. This work was carried out under the auspices of the NNSA of the U.S. DoE at LANL under Contract No. DE-AC52-06NA25396.
References
- (1) A.J. Liu and S.R. Nagel, Nature (London) 396, 21 (1998).
- (2) C.S. O’Hern, L.E. Silbert, A.J. Liu, and S.R. Nagel, Phys. Rev. E 68, 011306 (2003).
- (3) J.A. Drocco, M.B. Hastings, C.J. Olson Reichhardt, and C. Reichhardt, Phys. Rev. Lett. 95, 088001 (2005).
- (4) L.E. Silbert, A.J. Liu, and S.R. Nagel, Phys. Rev. Lett. 95, 098301 (2005).
- (5) S. Henkes and B. Chakraborty, Phys. Rev. Lett. 95, 198002 (2005).
- (6) M. Wyart, L.E. Silbert, S.R. Nagel, and T.A. Witten, Phys. Rev. E 72, 051306 (2005).
- (7) J.M. Schwarz, A.J. Liu, and L.Q. Chayes, Europhys. Lett. 73, 560 (2006).
- (8) W.G. Ellenbroek, E. Somfai, M. van Hecke, and W. van Saarloos, Phys. Rev. Lett. 97, 258001 (2006).
- (9) T.S. Majmudar, M. Sperl, S. Luding, and R.P. Behringer, Phys. Rev. Lett. 98, 058001 (2007).
- (10) P. Olsson and S. Teitel, Phys. Rev. Lett. 99, 178001 (2007).
- (11) N. Xu, V. Vitelli, M. Wyart, A.J. Liu, and S.R. Nagel, Phys. Rev. Lett. 102, 038001 (2009).
- (12) C. Heussinger and J.-L. Barrat, Phys. Rev. Lett. 102, 218303 (2009).
- (13) T. Hatano, Phys. Rev. E 79, 050301(R) (2009).
- (14) D.A. Head, Phys. Rev. Lett. 102, 138001 (2009).
- (15) Z. Zhang, N. Xu, D.T.N. Chen, P. Yunker, A.M. Alsayed, K.B. Aptowicz, P. Habdas, A.J. Liu, S.R. Nagel, and A.G. Yodh, Nature (London) 459, 230 (2009).
- (16) R. Candelier and O. Dauchot, arXiv:0906.2679.
- (17) M.B. Hastings, C.J. Olson Reichhardt, and C. Reichhardt, Phys. Rev. Lett. 90, 098302 (2003).
- (18) C. Reichhardt and C.J. Olson Reichhardt, Phys. Rev. Lett. 96, 028301 (2006).
- (19) P. Habdas, D. Schaar, A.C. Levitt, and E.R. Weeks, Europhys. Lett. 67, 477 (2004).
- (20) I. Gazuz, A.M. Puertas, Th. Voigtmann, and M. Fuchs, Phys. Rev. Lett. 102, 248302 (2009).
- (21) R. Albert, M.A. Pfeifer, A.-L. Barabasi, and P. Schiffer, Phys. Rev. Lett. 82, 205 (1999); I. Albert, P. Tegzes, B. Kahng, R. Albert, J.G. Sample, M. Pfeifer, A.-L. Barabási, T. Vicsek, and P. Schiffer, ibid. 84, 5122 (2000); D.J. Costantino, T.J. Scheidemantel, M.B. Stone, C. Conger, K. Klein, M. Lohr, Z. Modig, and P. Schiffer, ibid. 101, 108001 (2008).
- (22) R. Soller and S.A. Koehler, Phys. Rev. E 74, 021305 (2006).
- (23) J. Geng and R.P. Behringer, Phys. Rev. E 71, 011302 (2005).
- (24) R.P. Behringer, D. Bi, B. Chakraborty, S. Henkes, and R.R. Hartley, Phys. Rev. Lett. 101, 268301 (2008).
- (25) K.E. Daniels and N.W. Hayman, J. Geophys. Res. 113, B11411 (2008).
- (26) J.J. Drozd and C. Denniston, Phys. Rev. E 78, 041304 (2008).
- (27) Z. Chen and C.C. Yu, Phys. Rev. Lett. 98, 057204 (2007).
- (28) C. Reichhardt and C.J. Olson Reichhardt, Phys. Rev. Lett. 90, 095504 (2003).
- (29) K. Desmond and S.V. Franklin, Phys. Rev. E 73, 031306 (2006).
- (30) S. Teitel (private communication).
- (31) C. Reichhardt and C.J. Olson, Phys. Rev. Lett. 89, 078301 (2002).
- (32) A. Pertsinidis and X.S. Ling, Phys. Rev. Lett. 100, 028303 (2008).
- (33) D. Domínguez, Phys. Rev. Lett. 72, 3096 (1994).
- (34) J. Watson and D.S. Fisher, Phys. Rev. B 55, 14909 (1997).
- (35) M. Dennin, J. Phys.: Condens. Matter 20, 283103 (2008).