Coherent scattering from silicon monocrystal surface
Abstract
Using coherent x-ray scattering, we evidenced atomic step roughness at the [111] vicinal surface of a silicon monocrystal of 0.05∘ miscut. Close to the () anti-Bragg position of the reciprocal space which is particularly sensitive to the [111] surface, the truncation rod exhibits a contrasted speckle pattern that merges into a single peak closer to the (111) Bragg peak of the bulk. The elongated shape of the speckles along the [111] direction confirms the monoatomic step sensibility of the technique. This experiment opens the way towards studies of step dynamics on crystalline surfaces.
The surface of crystals is extensively studied because it is the region of the sample where elements are aggregated from liquid, vapor or solid phases. Numerous methods have been developed for the observation of surface morphology. Optical or Scanning Electron Microscopy methods are the simplest [1]. Low energy electron reflection microscopy [2, 3] and near field methods (AFM, MFM, STM) [4, 5], are now classical methods for the study of the static surface configuration.
An important subject of the surface study is the direct observation of the dynamics of the surface fluctuations connected to surface step movement [6, 7, 8], to change in crystal shape by nucleation and/or annihilation of steps at face edges [9] or to the fluctuations of chemically inhomogeneous surfaces [10]. The main available experimental method for the observation of surface dynamics is time-resolved STM, where the movement of an individual step is observed by successive linear scans across a reduce segment. In these experiments, the evolution of the step position is recorded , and from a series of measurements, a statistical study provides information on the dynamics of surface evolution [8, 11]. This method provides measurements of the step dynamics for times ranging between 0.1 and a few tens of seconds and for distances between 0.1 and a few tens of nanometers. These very local measurements provide accurate knowledge of the atomic surface properties, and the various atomic models of the dynamics can be discussed (see Giesen [12]).
X-ray diffraction has also been proved a very useful method for surface observation [13]. The regions of the reciprocal space where valuable information about the surface structure can be obtained are the “truncation rods” (TR). TR are satellite streaks perpendicular to the surface originating from Bragg peaks, and by analogy, specular reflectivity can be considered as the satellite of the (000) reciprocal position. The longitudinal variations of TR intensity have been extensively used for the observation of the change in atomic position [14] and in atomic composition in the vicinity of the surface [15, 16] and of surface roughness [17].
Moreover, the transverse intensity of the TR corresponds to the Fourier transform of the surface bidimensional array. Qualitatively, the relative distance () of the reciprocal point of the TR from the nearest Bragg peak samples a thickness under the surface. The special position intermediate between two Bragg peaks essentially corresponds to surface defects of monoatomic thickness (steps, monoatomic layers..) and is called the “anti-Bragg” (AB) region. At this point, perfectly flat diffracting planes scatter with relative phase shifts of , cancelling each other and only the scattering of the cut-off introduced by the surface is observed.
In this region, the per sample atom cross section is very low, and the Bragg to AB cross section ratio roughly corresponds to the square of the ratio between the number of volume atoms and the number of surface atoms in the coherence volume [13]. The AB intensity is also proportional to the number of irradiated surface atoms, and measurements are often carried out in asymmetric geometry, with a low incident angle.
In this letter, we show that the TR tranverse intensity in the conditions of coherent diffraction can provide a new method for the observation of steps at the surface of crystals and that this method can be extended to dynamical surface studies.
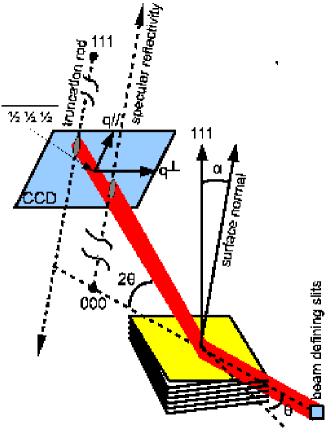
Figure 1 gives a rapid scheme of the setup used for this type of experiment. Coherent diffraction from a sample can be observed if the irradiated volume has the size of the coherence volume. A good transverse coherence length is obtained by using suitable slits, in order that the product of the beam size at sample by the beam divergence is of the order of the wavelength [18]. The longitudinal coherence length is fixed by the beam monochromaticity , and the path-length difference of the beam in the sample must not exceed this limit. This latter condition is contradictory with the asymmetric geometry. As scattering far enough from Bragg peaks is discussed here for the observation of surfaces, only interferences between surface atoms are relevant. For flat surfaces, with a miscut angle (see Fig. 1), the pathlength differences in asymmetric conditions can be written:
| (1) |
where is the asymmetry angle (assumed small) in the diffraction plane (see Fig. 1). This means that . For symmetric diffraction geometry, one has also to take account of the angle between and the surface normal:
| (2) |
and provides a limit for the directions of that can be explored.
For the observation of speckles in the truncation rod, we have chosen to test a silicon crystal with a very small misorientation of the [111] axis relative to the surface normal (a vicinal surface with an miscut). Silicon gives perfect single crystals, and the crystal studied here had been carefully polished by the ESRF staff for monochromator use. Laboratory x-ray reflectivity measurements showed a few Angstroms rugosity of the surface and a very thin (less than one nanometer on average) layer of silicon oxide. Coherent x-ray scattering experiments were performed at the CRISTAL beamline of the synchrotron SOLEIL. The 1.772 Å (7 keV) wavelength was selected with a Si111 double crystal monochromator and mirrors were used in order to suppress harmonics. One can estimate here m. Transverse coherence is achieved by combining two sets of square slits, one 13 m upward, with a 100 to 250 m aperture and one close (0.15 m) to the sample, with 10 to 20 m apertures. By this setup, we can adjust the balance between intensity and coherence. Speckles of reasonable contrast were observed with the maximum aperture, the beam intensity being in the ph/s range after the slits.
The sample was in air and positioned precisely at the center of the kappa goniometer of the beamline. The scattering plane was vertical. Scattering was measured with a back illuminated CCD from Andor Technologies (10241024 pixels of 13 m size) located at 2.2 m. A dedicated program was used for individual photon extraction from each frame [19, 20]. For low intensity measurements, this eliminates the CCD electronic noise. Static images were obtained from the accumulation of at least 100 frames. With the fast (2.5 Mhz) converter, good quality images could be obtained in one minute for large enough intensity.
Diffraction was studied in the vicinity of the () positions, varying from to 1. In Fig. 1 the reciprical lattice plane observed for (AB for the (000) and (111) reciprocal lattice points) is schematized. This plane intercepts the specular and the truncation rods. Fig. 2 shows the typical image of the diffracted intensity around the AB position.
Although the area of the reciprocal lattice covered by our detector is very small, we observe here two peaks, with pixels and pixels spacings in the and directions respectively. The higher intensity peak (about 2. ph/s total intensity) corresponds to the truncation rod and the lower intensity one (about 0.3 ph/s total intensity) to the surface reflectivity. Both peaks are roughly aligned in the vertical direction of the detector, essentially because the TR is intercepted with a small angle (8.∘). The distance between these two peaks provide a very precise estimate of the miscut . In the configuration of Fig. 2, we obtain: and which gives the miscut angle: .
The lower intensity peak, detailed in the insert of Fig. 2, is a large measurement of the specular reflectivity and its intensity is connected to surface rugosity. This involves the silicon crystal rugosity and the thin amorphous silicon oxide layer. In our laboratory experiment (incoherent scattering) we have observed that the contribution of this oxide layer lowers the pure silicon reflectivity by a factor ten at this Q-value.
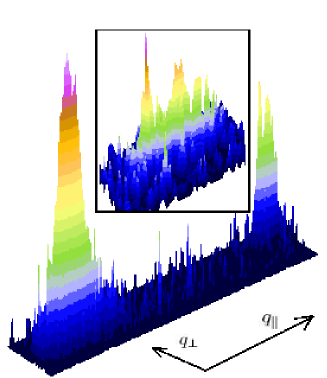
The synchrotron experiment described here differs from incoherent scattering experiments: in a laboratory experiment, the irradiated region of the sample ranges in millimeters with a few m coherence length, while here, all the illuminated 140 mm region scatters coherently 111in this case, the maximum opening of the slits was used, this gives a ph/s intensity, with a lower coherence contrast. This can be checked from the insert of Fig. 2 (linear plot), where we observe that this peak is elongated in the direction of q∥, and that its profile has a speckle structure corresponding to surface rougheness. This typical behavior was observed for much smaller angles by Robinson et al. [21], with a much larger elongation.
 |
 |
 |
 |
 |
 |
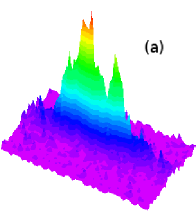
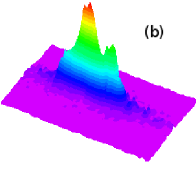
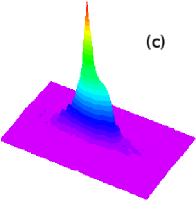
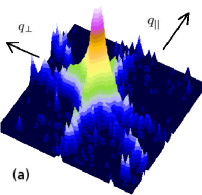
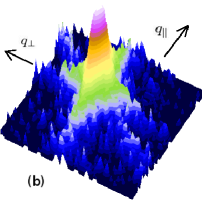
The TR peak has a well identified speckle pattern, as shown in Figure 3. This figure is the result of the scan along the TR, varying from 0.5 to 0.81. This speckle structure is connected to the morphology of the Si [111] crystalline surface. It is only sensitive to the crystalline character of the sample surface, and it is not damped by the amorphous surface oxide layer. Between =0.5 (fig. 3a) and =0.56 (fig. 3b), the coherently irradiated region is roughly the same, and we observe that the transverse shape of the truncation rod has only small changes. The angle only varies from 8∘ to 9∘, this is a irradiated area and the speckle structure has slow variations along the [111] direction. The 3D pattern observed in this coherent experiment is widely elongated in this direction. This indicates that the defects responsible for this pattern are surface defects, of atomic scale extension along the direction perpendicular to the surface 222Here, as we limit our sudy to , the (111) atomic layers of silicon can be assumed as flat layers with a distance of nm. This speckle structure is connected to the surface step configuration and it changes with the sample position. In our case, the regulary spaced steps corresponding to the miscut, a period of 0.32 m for steps of the height of a silicon tetrahedron (0.314 nm), has only few irregularities within the few hundreds of steps covered by the illumination. The 2-3 speckles in the observed area roughly indicate a 2 period error (phase shift fluctuations) along this distance.
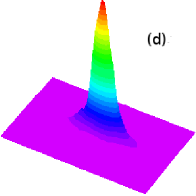
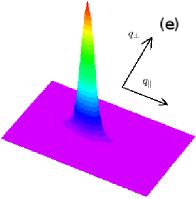
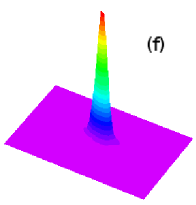
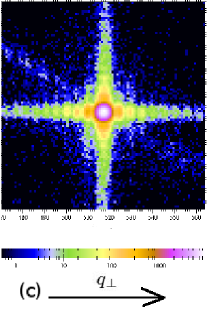
For values of () closer to (111) (fig. 3 d-f), the pattern is reduced essentially to a single peak. In this case, the small value of the difference between the Bragg peak and () makes the observation of the atomic scale surface defects difficult. The scattering corresponds to perfect atomic planes in the sample. In this case, diffraction does not significanly change the shape of the wave front of the incoming beam. This is shown in Fig 4, where the cross-shaped diffracted beam reflects the slits selecting the coherent beam. In fig. 4, a diffuse streak is also observed, with a nearly 30∘ angle with the horizontal axis q⟂, which we ascribe to residual stress of the crystal surface connected to polishing.
 |
 |
 |
These results were obtained from a silicon single crystal which is a model system to discuss the use of the coherent scattering technique for the study of crystal surfaces. Can this technique be used for surface studies in other crystalline systems? In the case of metals, like copper, lead or gold, crystals are highly distorted and any mechanical polishing creates a large number of dislocations in the vicinity of the surface. The observation of a coherently diffracting truncation rod needs a high crystalline quality in the irradiated region, otherwise the mosaic structure inhibits the observation of speckles connected to surface irregularities. For metals, “in situ” restoration at high enough temperature can provide subgrains of a few micron size. As it seems difficult to obtain dislocation-free regions larger than this, the size of the coherent beam should also be in the (sub)micrometer range. Beams of that size are now available with the modern X-ray focusing techniques (refracting lenses, Fresnel lenses or mirrors) and coherent beams can be selected by simply closing slits at the entrance of the focusing setup. From Eq. 1 and 2, small values of , comparable with , open the possibility of coherent measurements at large asymmetric angles.
One important problem here is the low intensity at the AB position. In this experiment, the measured intensity was of the order of 10 ph/pixel for 2,500 s. This intensity has a dependence and “heavy” metals can provide some improvements. Focusing also limits the number of steps and other defects in the irradiated area. This reduces the number of speckles that share the AB intensity, making easier their observation. In this case, the technique is limited to small values of and only large scale step movements can be observed (some tens of nanometers). Optics improvements and the use of x-ray sources with higher brilliance (NSLS II , Petra III or even free-electron lasers) will raise this intensity of some orders of magnitude, reducing the accessible time scale.
Acknowledgements.
The authors are grateful to Benoit Picut from the ESRF optics laboratory who has provided a high quality mechano-chemically polished silicon crystal.References
- Chatain and Métois [1993] D. Chatain and J. Métois, Surface Science 291, 1 (1993).
- Müller and Métois [2005] P. Müller and J. J. Métois, Surf. Sci. 599, 187 (2005).
- Bauer [1994] E. Bauer, Rep. Prog. Phys. 57, 895 (1994).
- Surnev et al. [1997] S. Surnev, P. Coenen, B. Voigtländer, H. P. Bonzel, and P. Wynblatt, Phys. Rev. 56, 12131 (1997).
- Barth and Henry [2007] C. Barth and C. R. Henry, Phys. Rev. Lett. 98, 136804 (2007).
- Kuipers et al. [1995] L. Kuipers, M. S. Hoogeman, J. W. M. Frenken, and H. van Beijeren, Phys. Rev. B 52, 11387 (1995).
- M. Giesen [1998] G. S. I.-K. M. Giesen, Surf. Sci 412/413, 645 (1998).
- Dougherty et al. [2003] D. Dougherty, O. Bondarchuk, M. Degawa, and E. Williams, Surf. Sci. Lett. 527, L213 (2003).
- Thiürmer et al. [2001] K. Thiürmer, J. E. Reutt-Robey, E. D. Williams, M. Uwaha, A. Emundts, and H. P. Bonzel, Phys. REV. Lett. 87, 186102 (2001).
- Lyubinetsky et al. [2002] I. Lyubinetsky, D. B. Dougherty, T. L. Einstein, and E. D. Williams, Phys. Rev. B 66, 085327 (2002).
- Goff et al. [2003] E. L. Goff, L. Barbier, and B. Salanon, Surf. Sci. 531, 337 (2003).
- Giesen [2001] M. Giesen, Prog. Surf. Sci. 68, 1 (2001).
- Robinson [1986] I. K. Robinson, Phys. Rev. B 33, 3830 (1986).
- Robinson and Tweet [1992] I. K. Robinson and D. J. Tweet, Rev. Prog. Phys. 55, 599 (1992).
- Robinson et al. [1988] I. K. Robinson, R. T. Tung, and R. Feidenhans’l, Phys. Rev. B 38, 3632 (1988).
- Robach et al. [2003] O. Robach, H. Isern, P. Steadman, K. F. Peters, C. Quiros, and S. Ferrer, Phys. Rev. B 68, 214416 (2003).
- Munkholm et al. [1997] A. Munkholm, S. Brennan, and E. C. Carr, J. Appl. Phys. 82, 2944 (1997).
- Livet [2007] F. Livet, Acta Cryst. A-63, 87 (2007).
- Livet et al. [2000] F. Livet, F. Bley, J. Mainville, M. Sutton, S. Mochrie, E. Geissler, G. Dolino, D. Abernathy, and G. Grübel, Nucl. Instr. Meth. A 451, 596 (2000).
- Beutier et al. [2008] G. Beutier, G. van der Laan, A. Marty, and F. Livet, Eur. Phys. J. Appl. Phys. 42, 161 (2008).
- Robinson et al. [1998] I. K. Robinson, J. A. Pitney, J. Libbert, and I. Vartanyants, Physica B 248, 385 (1998).