The Frequency of Tidal Features Associated with Nearby Luminous Elliptical Galaxies from a Statistically Complete Sample
Abstract
We present a deep broadband optical imaging study of a complete sample of luminous elliptical galaxies () at distances 15 Mpc - 50 Mpc, selected from the Tully catalog of nearby galaxies. The images are flat to 0.35% across the 20’ field and reach a V band depth of 27.7 mag arcsec-2. We derive an objective tidal interaction parameter for all galaxies and find that 73% of them show tidal disturbance signatures in their stellar bodies. This is the first time that such an analysis is done on a statistically complete sample and it confirms that tidal features in ellipticals are common even in the local Universe. From the dynamical time of the sample galaxies at the innermost radius where tidal features are detected we estimate the mass assembly rate of nearby ellipticals to be per Gyr with large uncertainty. We explore the relation between gravitational interaction signatures and the galaxy environment and find that galaxies in clusters are less disturbed than group and field galaxies. We also study how these interactions affect the broadband colors of ellipticals and find a moderate correlation, suggesting that the mergers are not accompanied by significant star-formation. Lastly, we find no correlation between AGN activity, as measured by 6cm radio emission, and large scale tidal distortions. This implies that gravitational interactions are not the only, and perhaps not the most important, trigger of nuclear activity. In summary, we find that elliptical galaxies in groups and low density environments continue to grow at the present day through mostly “dry” mergers involving little star formation.
Subject headings:
galaxies: interactions — galaxies: evolution — galaxies: elliptical — galaxies: structure1. Introduction
Giant elliptical galaxies dominate the high end of the mass spectrum in the nearby Universe and are mostly composed of old stellar populations, in contradiction to naïve predictions from hierarchical growth models. In a CDM Universe the most massive dark matter halos form later than less massive ones and the elliptical galaxies that reside in them are therefore expected to have formed recently (e.g., Kauffmann et al., 1993). This, however, does not agree with photometric studies of ellipticals that produce red colors in all of these galaxies, implying their stars are mostly old (e.g. Visvanathan & Sandage, 1977; Bower et al., 1992; Chang et al., 2006). The lack of recent star formation is further supported by results from HI surveys of early-type galaxies that find extremely low cold gas content in these systems when compared to spiral galaxies (e.g. Sanders, 1980; Knapp et al., 1985; Sadler, 2001).
A possible solution may be that galaxies grow through “dry” mergers which do not lead to star formation (Kormendy, 1984; White & Frenk, 1991; Kauffmann, 1996; van Dokkum, 2005; Naab et al., 2006; Boylan-Kolchin et al., 2006). The little gas that is accreted into the elliptical by the interaction may be heated and kept from cooling by nuclear feedback (Croton et al., 2006) or the gravitational interactions themselves (Dekel & Birnboim, 2008; Kenney et al., 2008).
One of the most direct ways to study the assembly rate of elliptical galaxies is to measure the incidence of tidal features. Schweizer & Seitzer (1992) studied a sample of 69 early-type galaxies with a recession velocity of less than 4000 kms-1. The galaxies were selected from a parent sample of 145 objects to exclude most cluster members and to include a few galaxies that had been previously known as interacting systems. Optical colors were measured from the sample and a “fine structure” parameter was assigned to each galaxy by visually characterizing the amount and type of their morphological disturbances. In their paper, Schweizer & Seitzer found that the broadband colors of early-type galaxies are correlated with their respective fine structure parameter and therefore also with gravitational interactions.
A different approach to quantifying the morphological disturbances of the stellar bodies of ellipticals was performed by van Dokkum (2005) [hereafter vD05], who studied a sample of 126 early-type galaxies at a median redshift of 0.11. vD05 divided deep broad-band optical images of the galaxies by their respective fitted smooth stellar models and measured the residuals of the quotients. This quantitative approach facilitates comparison to simulations (e.g. Feldmann et al., 2008) and other data (e.g. McIntosh et al., 2008).
Here we perform, for the first time, a quantitative analysis of morphological disturbances in a complete sample of elliptical galaxies at z0. The field of view of current generation imagers, along with excellent flat fielding, allow us to study the stellar bodies of nearby ellipticals and to constrain the rate of gravitational interaction in the nearby Universe. The results of this study can be used in numerical simulations and theoretical models of galactic evolution to constrain the formation and mass growth of these objects at recent cosmic times. Furthermore, most of our sample is composed of well-known bright galaxies that have been studied extensively in the past.
2. Data
Observations of a volume limited sample of luminous elliptical galaxies were obtained with the Y4KCam imager mounted on the SMARTS 1m telescope at CTIO in four epochs between 2006 and 2008. The instrument is a 4Kx4K CCD camera optimized for wide-field broad-band imaging, providing a nearly undistorted 20’x20’ field of view.
2.1. Sample Selection
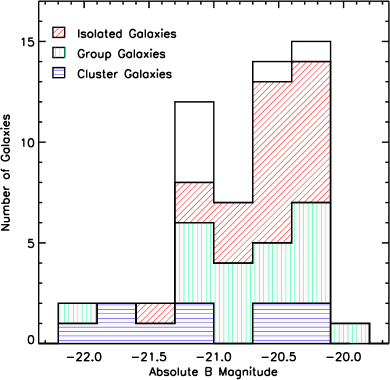
Candidates for inclusion in this study were initially selected from the Nearby Galaxies Catalog (Tully, 1988), consisting of all elliptical galaxies at a declination between -85 and +10. A distance cut was applied to the initial sample to exclude galaxies that are farther than 50 Mpc or closer than 15 Mpc. The distance threshold ensures that the outer parts of all galaxies fit in the instrument’s field-of-view and that a sufficient signal-to-noise ratio is achieved for all targets. A luminosity cut of -20.15 was used, with the magnitudes taken from Tully (1988) and converted to our cosmology. This limit corresponds to -20.0 in the Tully (1988) atlas, as he used km s-1 Mpc-1, and to LL∗ (Blanton et al., 2003). The last selection criterion that we used rejected galaxies with Galactic latitude of less than 17 due to difficulties of constraining a good model fit in a crowded stellar field.
One galaxy (NGC 5796) was excluded due to poor observing conditions that resulted in noise levels over 5 times worse than the sample mean. The final catalog therefore consists of 55 giant ellipticals (figure 1) and it includes members of four nearby clusters (Virgo, Fornax, Centaurus and Antlia). Galaxy environments were determined from the literature using NASA’s Astrophysics Data System Bibliographic Services to find references for previous studies of the objects. The methods used to derive these assumed environments are therefore inconsistent throughout the sample and they vary in accuracy.
| Object | R.AaaaJ2000.0 | Dec.aaaJ2000.0 | MB bbbTaken from Tully (1988) and corrected to H0=70 km s-1 Mpc-1 | cccColors within effective radius from Michard (2005) and de Vaucouleurs et al. (1991) | Env.dddEnvironment: C=cluster; G=group; F=field; U=unknown | Tc eeeCorrected tidal parameter as derived in subsection 3.2 | Tidal Feature Description |
|---|---|---|---|---|---|---|---|
| NGC 584 | 01:31:20.7 | -06:52:05 | -20.83 | 0.92 | F | 0.076 | Non-spherical isophotes; Spiral companion |
| NGC 596 | 01:32:52.1 | -07:01:55 | -20.37 | 0.90 | F | 0.110 | Pronounced outer shell |
| NGC 720 | 01:53:00.5 | -13:44:19 | -20.53 | 0.96 | F | 0.079 | Boxy outer isophotes |
| NGC 1199 | 03:03:38.4 | -15:36:49 | -20.24 | 0.97 | G | 0.067 | Intra-group diffuse emission |
| NGC 1209 | 03:06:03.0 | -15:36:41 | -20.51 | 0.95 | G | 0.116 | X-like isophotal structure; NW linear feature |
| NGC 1399 | 03:38:29.1 | -35:27:03 | -20.49 | 0.98 | C | 0.064 | |
| NGC 1395 | 03:38:29.8 | -23:01:40 | -20.44 | 0.94 | F | 0.094 | NW perpendicular feature |
| NGC 1407 | 03:40:11.9 | -18:34:49 | -21.17 | 0.93 | G | 0.083 | |
| NGC 2865 | 09:23:30.2 | -23:09:41 | -20.85 | 0.78 | F | 0.193 | Multiple shells and tail-like features |
| NGC 2974 | 09:42:33.3 | -03:41:57 | -20.78 | 0.95 | F | 0.110 | Multiple shells |
| NGC 2986 | 09:44:16.0 | -21:16:41 | -20.85 | 0.99 | F | 0.045 | Possibly paired with disturbed spiral |
| NGC 3078 | 09:58:24.6 | -26:55:37 | -20.78 | 0.97 | F | 0.103 | |
| NGC 3258 | 10:28:53.6 | -35:36:20 | -20.47 | 0.92 | G | 0.123 | Possibly paired with low mass elliptical |
| NGC 3268 | 10:30:00.6 | -35:19:32 | -20.43 | 0.96 | C | 0.087 | Possibly paired with disturbed spiral |
| NGC 3557B | 11:09:32.1 | -37:20:59 | -20.28 | 0.86 | N | 0.182 | Isophotal twisting; Asymmetric outer isophotes |
| NGC 3557 | 11:09:57.6 | -37:32:21 | -22.33 | 0.87 | G | 0.111 | SW fan; Asymmetric outer isophotes |
| NGC 3585 | 11:13:17.1 | -26:45:18 | -21.08 | 0.91 | F | 0.048 | Asymmetric outer isophotes |
| NGC 3640 | 11:21:06.8 | +03:14:05 | -20.93 | 0.92 | F | 0.142 | Highly disturbed stellar body |
| NGC 3706 | 11:29:44.4 | -36:23:29 | -21.29 | 0.93 | U | 0.120 | Inner shell |
| NGC 3904 | 11:49:13.2 | -29:16:36 | -20.26 | 0.94 | U | 0.108 | Outer shell |
| NGC 3923 | 11:51:01.8 | -28:48:22 | -21.38 | 0.95 | U | 0.100 | Multiple outer shells |
| NGC 3962 | 11:54:40.1 | -13:58:30 | -20.88 | 0.95 | F | 0.059 | |
| NGC 4105 | 12:06:40.8 | -29:45:37 | -20.51 | 0.87 | F | 0.109 | Interacting with a tidally disturbed spiral |
| NGC 4261 | 12:19:23.2 | +05:49:31 | -21.56 | 0.98 | C | 0.053 | NW tidal arm; Faint SE fan |
| NGC 4365 | 12:24:28.2 | +07:19:03 | -20.67 | 0.97 | C | 0.070 | Faint SW fan |
| IC 3370 | 12:27:37.3 | -39:20:16 | -21.38 | 0.89 | U | 0.192 | X-like isophotal structure; Broad N fan |
| NGC 4472 | 12:29:46.7 | +08:00:02 | -21.97 | 0.97 | C | 0.000 | |
| NGC 4636 | 12:42:49.9 | +02:41:16 | -20.83 | 0.93 | F | 0.066 | |
| NGC 4645 | 12:44:10.0 | -41:45:00 | -21.03 | 0.95 | C | 0.000 | |
| NGC 4697 | 12:48:35.9 | -05:48:03 | -21.82 | 0.92 | C | 0.091 | Non-spherical inner isophotes |
| NGC 4696 | 12:48:49.3 | -41:18:40 | -22.20 | 0.94 | C | 0.075 | Faint outer shell |
| NGC 4767 | 12:53:52.9 | -39:42:52 | -21.28 | 0.93 | C | 0.000 | Faint inner shell |
| NGC 5011 | 13:12:51.8 | -43:05:46 | -21.25 | 0.89 | U | 0.077 | |
| NGC 5018 | 13:13:01.0 | -19:31:05 | -21.61 | 0.85 | F | 0.184 | Highly disturbed; Multiple tidal tails and shells |
| NGC 5044 | 13:15:24.0 | -16:23:08 | -21.16 | 0.98 | G | 0.041 | |
| NGC 5061 | 13:18:05.1 | -26:50:14 | -21.34 | 0.85 | F | 0.104 | Pronounced tidal tail; Shell |
| NGC 5077 | 13:19:31.7 | -12:39:25 | -20.67 | 0.98 | G | 0.061 | |
| NGC 5576 | 14:21:03.7 | +03:16:16 | -20.55 | 0.88 | F | 0.122 | Interacting pair; tidal tail longer than 75 kpc |
| NGC 5638 | 14:29:40.4 | +03:14:00 | -21.27 | 0.94 | F | 0.036 | |
| NGC 5812 | 15:00:55.7 | -07:27:26 | -20.73 | 0.94 | F | 0.080 | Interacting with dwarf companion; Tidal tail |
| NGC 5813 | 15:01:11.2 | +01:42:07 | -20.92 | 0.95 | G | 0.054 | |
| NGC 5846 | 15:06:29.3 | +01:36:20 | -21.31 | 0.98 | G | 0.068 | Faint outer shells |
| NGC 5898 | 15:18:13.5 | -24:05:53 | -20.64 | 0.92 | G | 0.114 | Three spiral arm-like tidal tails |
| NGC 5903 | 15:18:36.5 | -24:04:07 | -21.03 | 0.89 | G | 0.075 | Possible dust extinction S of the center |
| IC 4797 | 18:56:29.7 | -54:18:21 | -20.90 | 0.92 | G | 0.226 | Tidal tails; SE diffuse emission |
| IC 4889 | 19:45:15.1 | -54:20:39 | -20.70 | 0.88 | U | 0.158 | Isophotal twisting; E fan |
| NGC 6861 | 20:07:19.5 | -48:22:13 | -20.95 | 0.95 | G | 0.123 | Non-spherical isophotes; Intra-group emission |
| NGC 6868 | 20:09:54.1 | -48:22:46 | -21.21 | 0.97 | G | 0.096 | |
| NGC 6958 | 20:48:42.6 | -37:59:51 | -20.68 | 0.86 | C | 0.122 | Multiple shells |
| NGC 7029 | 21:11:52.0 | -49:17:01 | -20.26 | 0.86 | G | 0.085 | Boxy inner isophotes |
| NGC 7144 | 21:52:42.4 | -48:15:14 | -20.51 | 0.91 | G | 0.100 | |
| NGC 7196 | 22:05:54.8 | -50:07:10 | -20.47 | 0.91 | G | 0.171 | Shell |
| NGC 7192 | 22:06:50.1 | -64:18:58 | -20.70 | 0.92 | F | 0.096 | Shell |
| IC 1459 | 22:57:10.6 | -36:27:44 | -20.73 | 0.96 | G | 0.137 | Multiple shells |
| NGC 7507 | 23:12:07.6 | -28:32:23 | -20.36 | 0.94 | F | 0.084 | Faint N shell |
2.2. Observations
Broadband optical observations of the sample galaxies had been acquired by multiple authors, showing some of the tidal features that we discuss in this work. However, the standard techniques used to obtain and reduce these previous data were not aimed at revealing the faint gravitational interaction signatures and they were washed out by residual background level variations across the field. In order to overcome this we supplemented each set of galaxy observations with a sequence of dark sky exposures of equivalent depth.
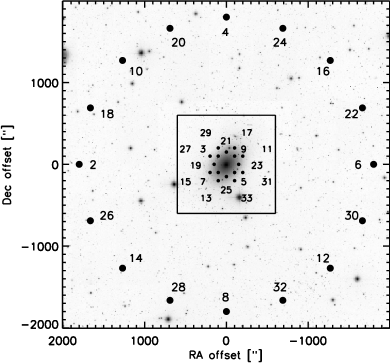
The galaxies were observed in a sequence of 33 pointings, including both object and dark sky frames. We used the V band as it provides the highest signal-to-noise ratio in a given exposure time. The observing pattern, shown in figure 2, included seventeen 300 sec exposures of the target galaxy and sixteen 300 sec exposures of background sky, acquired in alternating order. All object frames were shifted from each other by 1-3’ in order to correct for cosmetic defects in the CCD. Figure 2 also shows the order in which sky frames were observed, collecting data from different sides of the galaxy in a semi-random pattern. All galaxies were observed with total exposure times between 4200 and 7200 seconds.
In order to improve the signal-to-noise ratio the data were binned by a factor 22 at the telescope, producing a pixel size of 0.578”. To further increase the sensitivity to tidal features we also binned in software, resulting in a final pixel size of 1.156”. The typical stellar FWHM of the images used for analysis is 1.7”.
2.3. Reduction
Initial reduction of the data followed standard techniques and consisted of zero level subtraction and first order field variation corrections using dome flat frames.
In order to flatten the field to a higher degree dark-sky flat-field frames were prepared for each of the sample galaxies. All sources were masked in the individual dark-sky exposures which were then averaged and applied to the object frames. Lastly, the reduced object exposures were aligned and combined to create the final data products.
Apparent magnitudes were calibrated using aperture photometry of Prugniel & Heraudeau (1998) and were corrected for Galactic reddening using infrared dust maps from Schlegel et al. (1998). We assume distance measurements from the Tully catalog (corrected to our cosmology) to convert the luminosity profiles to physical units.
The data were reduced using the NOAO/IRAF software and are available for download at http://www.astro.yale.edu/obey
2.4. Depth and Flatness of the Field
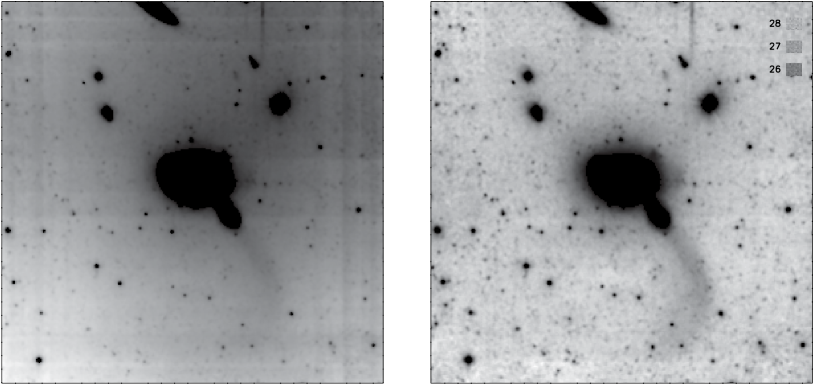
Our sky flat-fielding procedure (discussed in subsection 2.2) resulted in a dramatic improvement to the flatness of the field, as can be seen in figure 3. In this figure the 85 kpc long tidal tail that extends away from the companion of NGC 5576 is barely detectable in the image on the left which uses standard flat-fielding but is clearly visible in the dark-sky flat-fielded frame.
We used two methods to determine the depths of the sky flat field images. First, we reduced and stacked a dark sky image in the same way that was used to produce the target frames and smooth it to the scale of a typical tidal feature (20”). Although the resultant image was inherently flat, it preserves the photon noise level as limited by the telescope, instrument and the observing program. Second, we aggressively masked a target frame for bright objects and subsequently smooth it using a median kernel. This frame is insensitive to any pixel-to-pixel variation but it reflects the large-scale variation due to residual flattening issues or sky conditions at the time of observation. We then measured the standard deviation across both frames to obtain the detection threshold of faint tidal features. For a 20”20” box (corresponding to a typical tidal feature scale) we derived a 1 photon-noise detection threshold of 29 mag. From the flatness limited frame we measured a 1 detection threshold of 27.7 mag. This result implies that a similar program carried on a larger telescope will not necessarily yield a lower detection threshold as the data are dominated by residual flatness variations rather than photon noise.
3. Tidal Features
3.1. Morphological Disturbances
A visual inspection of the 55 sample galaxies reveals an extraordinary assortment of stellar morphology disturbances in a large number of galaxies. Similar disturbances have been reported by several authors and they can be divided into four main categories:
Shells - observed in the stellar component of many nearby ellipticals, shells are usually considered to result from an accretion of a small companion by a massive galaxy. Numerical simulations of such interactions have successfully reproduced the observed properties of shells even without the inclusion of gas dynamics and star formation (e.g. Dupraz & Combes, 1986). In our sample we identify at least 12 galaxies with shells, making them the most common interaction signature.
Tidal Tails - these linear streams of stellar matter are less commonly observed than shells in elliptical systems and are generally accepted as evidence for a dynamically cold component in the accreted companion. Tidal tails can also be reproduced in simulations of dry mergers when one of the progenitors is rotating (Combes et al., 1995). Tails that are produced in this manner appear wide and short-lived in comparison to the long and narrow tails produced by interacting spirals. An interaction between an elliptical galaxy and a gas-rich disk system can also produce such features (Feldmann et al., 2008). In this work we identify both kinds of tails in a range of widths and lengths, some extending as far as 11’ (85kpc) in projected length.
Broad Fans of Stellar Light - also well reproduced in simulations of dry mergers, extended stellar fans typically have a low surface brightness which makes them hard to detect in shallow surveys. Studies of interacting ellipticals (vD05, McIntosh et al., 2008) show multiple examples of this morphological signature and associate them with interactions of gas poor systems. This interaction signature is visible in a number of systems in our sample, most of which do not have an obvious companion and are therefore likely the result of a major merger in the past (see figure 1 of vD05).
Highly Disturbed Galaxies - at least three galaxies
(5%) in our sample of 55 exhibit signs of an ongoing merger
that is violently disturbing their stellar components (NGC 2865, NGC
3640 and NGC 5018).
These systems show signs of one or more of the above interaction
signatures, including well defined linear filaments that extend
radially from the galactic centers.
Two of the three galaxies are recent merger remnants and in
the third the interaction is still ongoing with a nearby companion.
These complex systems probably result from mergers with
multi-component objects such as S0 or spiral galaxies.
Morphological disturbances in the stellar bodies of the sample galaxies are common and are clearly apparent in at least two-thirds of the objects. The existence and frequency of these features imply that elliptical galaxies are still evolving in the nearby Universe through collisions and gravitational interactions that affect their stellar bodies.
A brief description of the visible distortions of the sample galaxies is given in the last column of table 1.
3.2. Tidal Parameter Derivations
Quantitative analysis of the tidal disturbance of the galaxies was carried out following the method described by Colbert et al. (2001) and vD05. Each galaxy was fitted with an elliptical galaxy model using the ellipse task in IRAF in three iterations, allowing the center position, position angle and ellipticity to vary with radius. Foreground stars and background galaxies were masked using SExtractor, a source detection software (Bertin & Arnouts, 1996). Masked object frames were then divided by the galaxy models and were further binned by a 33 factor in order to increase the signal-to-noise ratio. The resulting tidal parameter is given by:
| (1) |
where and are the pixel values at x,y of the object and model frames, respectively.
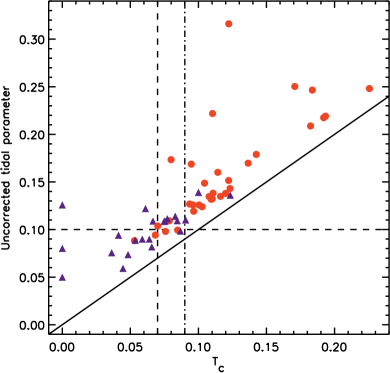
In addition to the steps described in detail by vD05 we applied a correction for residual noise to the derived tidal parameters. In order to do so we created a blank sky frame by aggressively masking a fully reduced object image and replacing the masked regions with sections from other object frames of the same pixel area. The resultant blank sky frame conserves the noise characteristics of the object images, consisting of both residual large-scale flattening variations and pixel scale photon noise. Each galaxy model was then added to the blank sky frame and a tidal parameter was re-derived for the model galaxy. The corrected value is then given by the square-root of the difference between the squared tidal-parameter values:
| (2) |
By using this correction method we allow the model to grow to arbitrarily large radii without erroneously increasing the tidal parameter value. This is especially useful when a tidal feature exists relatively far from the center of its host galaxy but is clearly related to it (e.g. NGC 596). Figure 5 demonstrates the effectiveness of this method which noticeably improves tidal feature parameterization in some galaxies.
The quantitative tidal parameter is a useful tool for studying the evolution of interacting galaxies. Not only does it correlate well with visually identified tidal disturbances, it also reveals morphological deviations from a smooth stellar body in visually less clear cases. Such an objective classification is important for comparison with similar surveys as well as for studying how stellar disturbances correlate with other galactic properties.
3.3. Frequency of Tidal Features
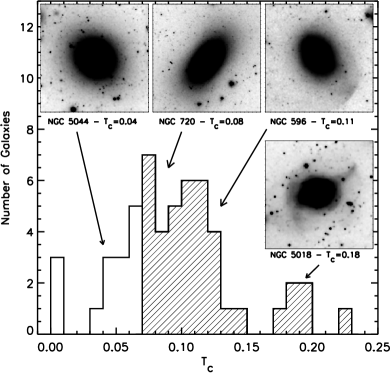
The sample of 55 galaxies can be divided into three categories based on their tidal parameter values. In the first group we include galaxies with a corrected tidal parameter larger than 0.09. These systems all show clear signs of morphological disturbances both in the total-counts image and in the model divided frame and they account for roughly 53% of the sample (29 galaxies). The second category consists of 11 galaxies (20%) with and it includes systems that have marginally detected disturbances in their stellar morphologies. Galaxies in this group typically show no obvious signs of past interactions in the total-counts image but exhibit some irregularities in the model divided frame. The last sub-group contains 15 galaxies (27%) that lack clear interaction signatures in either the total-counts image or the model divided frame. All galaxies in this group have a tidal parameter value of less than 0.07.
Taking as the threshold, 40 galaxies show morphological signs of past interactions in their stellar bodies, accounting for 73% of the sample (figure 6). This result confirms the findings by vD05 and further generalizes the phenomenon due to the statistical completeness of this study.
An additional sub-population of the sample consists of galaxies that have a projected close companion. We identify 7 such pairs, all showing morphological disturbances in both galaxies. A visual inspection of the companions finds that 5 of them have spiral features and are likely disk-systems while the other 3 are probably early-type or dwarf galaxies with no significant disk component. In addition to these interacting systems we identify one pair (NGC 5638) that shows no interaction signatures in either of the galaxies and is appropriately assigned a tidal parameter value of 0.04. The pair fraction is similar to that found by vD05 and although the fraction of early-type companions is lower (see Whitaker & van Dokkum, 2008), the difference is insignificant.
4. Properties of Tidally Disturbed Galaxies
The derived tidal parameter allows us to quantify the disturbance caused to the stellar body of galaxies due to gravitational interactions. One of the key advantages of such a numerical parameter is that it allows us to correlate gravitational disturbance signatures with other galactic properties. In this section we compare the derived of each galaxy with galactic environment, its broadband optical colors and its nuclear activity. These properties have all been hypothesized to be related to gravitational interactions and the subsequent evolution of these galaxies.
4.1. Galaxy Environment
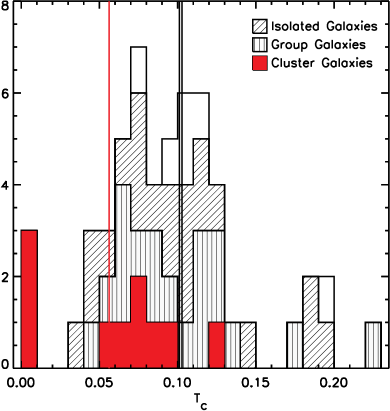
The fraction of galaxies with in our sample increases to 80% when cluster members are excluded. This is depicted in figure 7, which shows the relation between the environment in which the galaxies reside and their tidal parameter values. A one-sided Mann-Whitney test finds a 1.4% chance that cluster galaxies have a tidal parameter value larger than the sample median.
Interaction signatures seem therefore to be typical of group and field galaxies, and relatively rare in clusters. The absence of tidal features in clusters might have been expected given that mergers are rare in relaxed clusters (Makino & Hut, 1997; van Dokkum et al., 1999); on the other hand, ”galaxy harassment” due to frequent long-range interactions has been shown to create long, faint tidal tails associated with infalling galaxies (e.g. Moore et al., 1996, 1998).
4.2. Broadband Optical Colors
The relation between the optical colors of elliptical galaxies and their absolute magnitude has been known for more than three decades (e.g. Sandage & Visvanathan, 1978; Frogel et al., 1978). This relation states that giant ellipticals have systematically redder colors than their less massive counterparts. In recent years this observed phenomenon has been mostly attributed to the evolution of these galaxies through hierarchical growth and mass accretion, thus differentiating it from monolithic collapse models. This change of paradigm has been supported by both observations and numerical simulations of galactic evolution (e.g. Kauffmann & Charlot, 1998; van Dokkum et al., 1998; Shioya & Bekki, 1998).
In their paper, Schweizer & Seitzer (1992) show that the observed “fine structure” value of ellipticals is also correlated with the systemic colors of these galaxies. The correlation persists even after the observed values are normalized by the known color-magnitude relation. We perform a similar analysis of our data using normalized optical colors in conjunction with the objectively derived tidal parameter (see subsection 3.2 for details).
Figure 8 shows the color-magnitude relation of the 55 sample galaxies for the B-V color, plotted against absolute V magnitudes. Color measurements were taken from Michard (2005) where possible (41 galaxies) and from de Vaucouleurs et al. (1991). This relation has an inherit 1 scatter of 0.042 in color which cannot be all attributed to errors in measurement and it agrees with the slope found by Schweizer & Seitzer (1992). We subtract the color-magnitude relation from the measured colors and plot the residuals against the corrected tidal parameter values of the galaxies. Figure 9 shows that tidally disturbed galaxies are on average bluer than their non-interacting counterparts, in agreement with the findings of Schweizer & Seitzer (1992). This correlation is moderate, showing a difference of only 0.05-0.1 in color between galaxies with tidal parameter values of 0.0 and 0.2. A Spearman rank test finds that the probability that this correlation was drawn by chance is less than 0.01%.
The correlation between tidal disturbances and broadband colors suggests that these merger events probably trigger some star formation in the interacting galaxies. Alternatively, it is possible that galaxies accreted into ellipticals typically contain a significant fraction of young or metal-poor stars. Such a scenario is not uncommon in groups, where a single massive elliptical is surrounded by multiple low mass late-type galaxies. Nevertheless, it is important to note that all the galaxies in the sample are red and that any contribution to their broadband colors from star-formation or young stellar populations is small.

4.3. Tidal Features and the AGN Duty Cycle
It has been suggested by several authors that gravitational interactions play an important role in triggering galactic nuclear activity. Some of these studies show a correlation between the brightness of elliptical galaxies in radio continuum observations and morphological disturbances (e.g. Heckman et al., 1986; Smith & Heckman, 1989). In this scenario minor merger events induce dust and gas accretion onto the galactic center and then trigger nuclear activity. The same mergers should in principal leave their mark on the stellar body of the accreting elliptical in the form of morphological disturbances such as described in subsection 3.1.
In order to test this hypothesis we compiled a list of 6cm and 20cm flux measurements for 26 galaxies with publicly available data. The data were collected form a number of catalogs, including the NRAO VLA Sky Survey (Condon et al., 1998), the FIRST survey (White et al., 1997), the NORTH6CM and the NORTH20CM databases (Becker et al., 1991; White & Becker, 1992), the Green-Bank 6cm survey (Gregory et al., 1996) and the Dixon Master List of Radio Sources (Dixon, 1970). As not all galaxies have published measurements for both wavelengths we derive a correction factor from the 20cm to 6cm relation using 8 galaxies for which both data are available. This relation is expressed by the following equation:
| (3) |
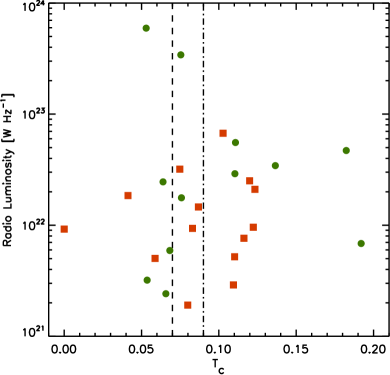
where and are the measured fluxes in the 6cm and 20cm bands, respectively. The 1 scatter in this relation is 0.29 dex. Figure 10 shows the correlation between radio continuum flux and tidal parameter for the sample galaxies. Plotted values are either 6cm observations or 20cm observations corrected to 6cm using the linear relation from equation 3.

We see no relation between the two parameters. This lack of a tight correlation is itself not surprising given the very different expected lifetimes of tidal features and the radio duty cycle. Tidal interactions, as portrayed by their assigned tidal parameter values, are expected to survive for a long time in the outskirts of elliptical galaxies. This means that a disturbed galaxy can retain its large value of tidal parameter even after the nuclear activity has quieted.
This can be a viable explanation for the scatter at high values of but not for that at the low end of the distribution. Since the lifetime of the radio mode is only roughly 108 years (e.g., Croton et al., 2006; Shabala et al., 2008), galaxies with a low TC value are all expected to be quiet at radio wavelength. The existence of radio-loud AGN in undisturbed ellipticals is very interesting and may imply that gravitational interactions are not the only and possibly not the most important AGN triggering mechanism.
5. Accretion Rate and Inferred Mass Growth
In the following section we will attempt to estimate the rate at which ellipticals grow through mergers using two techniques. First we estimate the survival time of the observed tidal features using the dynamical time of the system at the innermost radius of feature detection. This estimate relies on the assumption that tidal features dissipate due to dynamical mixing in their environment. As an alternative approach we analyze the interacting pairs in the sample using friction timescale approximations as suggested by, e.g., Patton et al. (2000).
5.1. Typical Tidal Feature Survival Time
Most of the merger rate estimates in the literature measure the frequency and properties of close interacting pairs. In this work, however, we are able to use an alternative approach. For each galaxy we measure the smallest radius where tidal features are seen and estimate the age of the merger event from the dynamical time at that radius.
The dynamical time at a distance from the center of a galaxy with circular velocity is defined as the time it would take a test particle to complete one-quarter of an orbit under the gravitational potential of a homogeneous sphere. We use this to assess the survival time of a tidal feature, assuming that after completing orbits the feature will dissolve into the smooth stellar distribution due to the inherent velocity dispersion and differential rotation of the galactic potential. The survival time is then given by:
| (4) |
where is the number of dynamical times it takes tidal features to dissolve into the stellar body of the galaxy and is the smallest radius at which we detect tidal features. In order to find this radius we derived fractional tidal parameter values as a function of radius for the sample galaxies, thus measuring tidal distortions within limiting radii. Figure 11 shows the average radius of each fractional bin of size . The majority of the significant tidal features lie at radii larger than 23 kpc which is also the average distance of features with . We estimate by measuring the circular velocity of a model galaxy with an NFW dark matter profile (Navarro et al., 1997) and a Hernquist stellar profile (Hernquist, 1990) at the same radius. The typical time since the last accretion event for these galaxies is then:
| (5) |
The actual survival time, however, can vary greatly based on the tidal feature morphology and kinematics that result from different interactions and collisions. Since typical stellar orbits in elliptical galaxies are highly eccentric and have significant precession, radial features will dissolve much quicker than tangential ones. For example, a radial linear feature is only expected to be detectable for about one dynamical time (), whereas shell-like features are expected to survive for many ().
This technique of estimating the interaction time-scale of nearby ellipticals is important as it does not rely on close pairs, which are much less common. Nevertheless, when deriving the survival time we did not treat any biases that might be caused by the projection of tidal features onto the plane of the sky. For example, a stellar ring around a galaxy at some distance may appear as a radial feature extending all the way through the center of the galaxy if aligned properly. Rather than individually simulating all sample galaxies we assume that feature orientations are random and that our sample is sufficiently large to minimize their effect on this result.
5.2. Implied Merger and Mass Growth Rate
Assuming that in a given merger event all the mass from both galaxies is retained in the system we can write the mass growth rate of an accreting elliptical:
| (6) |
where is the progenitor galaxy mass ratio, is the tidal feature survival time (see equation 5) and is the fraction of observed galaxies with tidal distortions. In this paper we confirm the value of and measure Gyrs.
Two significant uncertainties remain in equation 6. Both the progenitor mass ratio and the number of survival orbits cannot be observed directly from our data and require simulations of multiple systems in order to constrain their values. In addition, both parameters can likely have a wide range of values, varying between systems and tidal feature morphologies. We therefore adopt conservative values for these parameters to get an estimate for the mass growth rate due to gravitational interactions:
| (7) |
Assuming a constant rate since , this implies that an isolated galaxy can grow up to 3 times its initial collapsed mass by minor mergers only. This result is in good agreement with recent studies that show that galaxies can grow significantly in mass through minor mergers (Naab et al., 2007; Bournaud et al., 2007; Bezanson et al., 2009).

5.3. Pair Friction Time
For purposes of comparison with previous studies we perform a second analysis of the interaction timescale using a subsample of close pairs of interacting galaxies. In these systems the time it would take the two galaxies to merge can by approximated by the dynamical friction timescale (Patton et al., 2000):
| (8) |
where is the physical separation of the pairs, is the circular velocity, is the mass of the secondary galaxy and is the usual Coulomb logarithm (Binney & Tremaine, 1987). In our galaxy sample we identify 7 merging pairs with a mean projected distance of 21.46.7 kpc, resulting in a circular velocity of 400. Using typical values of MM⊙ and we get a second interaction time estimate of 0.53 Gyr. This result is in good agreement with vD05 and it is similar to for
6. Conclusions
The evolution and growth of elliptical galaxies in the nearby Universe is driven by gravitational interactions and merger events. The rate of these interactions, which are not accompanied by significant star formation, can be estimated from the morphological distortions that they cause to the stellar bodies of colliding galaxies. vD05 showed that at z0.1 signatures of past interactions are observed in most ellipticals and can be accounted for in more than 73% of the galaxies. In this work we confirmed this result upon analyzing 55 nearby ellipticals in a variety of galactic and environmental properties. This is the first time that such a study is performed on a statistically complete sample and it shows, above all, that elliptical galaxies are still assembling via mergers and accretion events in the nearby Universe. Although this high rate of gravitational interaction signatures is not a new finding, the completeness of our sample implies that this is an important phenomenon for all ellipticals and that it is not restricted to certain populations. Moreover, the high frequency of tidal features strongly suggests that these interactions play a critical role in the evolution and growth of elliptical galaxies.
In this paper we explored the link between tidal disturbances and other evolution driven properties of the sample galaxies. We found that interacting systems have slightly bluer broadband colors than non interacting ones, implying that these mergers are accompanied by little or no star formation. One explanation for this is that the progenitor galaxies are mainly composed of old stellar populations, thus producing a red galaxy. Alternatively, the total flux from young stars in the accreted galaxies is small compared to the accumulated light from old stars in the ellipticals, suggesting that these are mainly minor merger events.
We also examined the proposed link between gravitational interactions and nuclear activity in ellipticals (subsection 4.3). We accomplished this by relating the radio continuum flux of the sample galaxies to their respective tidal parameter values. Given the long dynamical time in the outskirts of ellipticals, tidal features, unlike radio activity, are expected to survive there for a long time. Using equation 5 it is easy to show that at a radius of 50kpc a tidal feature will remain for years. On the other hand, the standard assumptions predict a lifetime of only years for the AGN radio mode. This suggests that all radio loud galaxies are expected to have a high value of tidal parameter, in contradiction to our findings (figure 10). We conclude that gravitational interactions are therefore an unlikely candidate for provoking nuclear activity in elliptical galaxies.
Lastly, we estimated the lifetime of observed tidal features by measuring the dynamical time of the galaxies at the innermost radius of feature detection. We found that the sample galaxies are generally relaxed at radii smaller than 23 kpc, implying that nearby ellipticals typically experience gravitational interactions every 0.35 Gyrs. This value yields a mass accretion rate of dM/M0.2 with large uncertainty. The derived rate of mass growth therefore shows that elliptical galaxies can grow significantly through (presumably mostly minor) mergers and low-mass accretion events.
In this section we present the full data atlas. All the images were
smoothed using a box-car kernel of dimensions 8”8” and
were further bin by a factor 22 in order to bring out some
of the fainter tidal features. Similar to figure
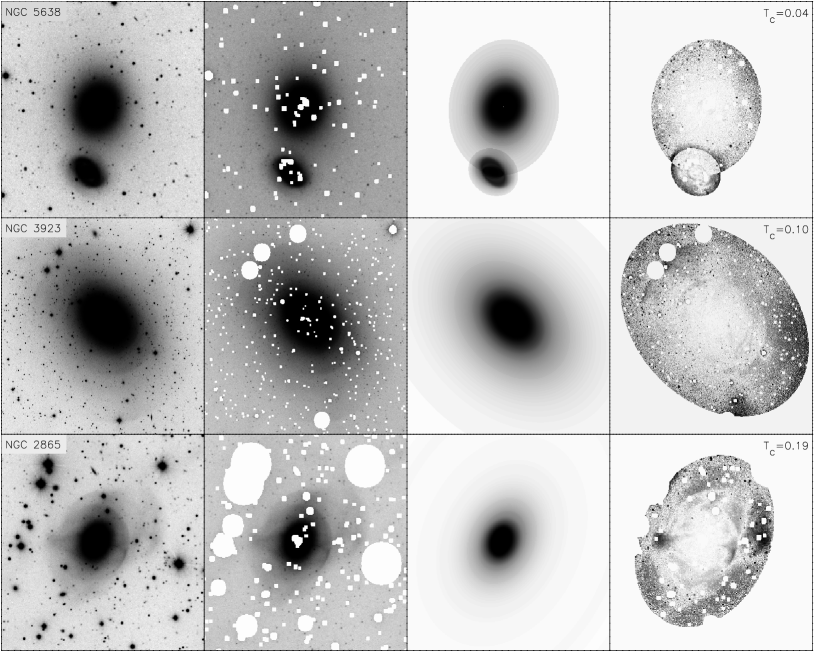
4, every line shows from left to right the full
data set, object masked frame, the fitted model and the
model-divided residual image.
The corrected tidal parameter and a scale bar are also shown.
The full paper and appendix are available online at:
http://www.astro.yale.edu/obey
References
- Becker et al. (1991) Becker, R. H., White, R. L., & Edwards, A. L. 1991, Astrophysical Journal Supplement Series, 75, 1
- Bertin & Arnouts (1996) Bertin, E., & Arnouts, S. 1996, Astronomy and Astrophysics Supplement Series, 117, 393
- Bezanson et al. (2009) Bezanson, R., van Dokkum, P. G., Tal, T., Marchesini, D., Kriek, M., Franx, M., & Coppi, P. 2009, Astrophysical Journal, 697, 1290
- Binney & Tremaine (1987) Binney, J., & Tremaine, S. 1987, Galactic dynamics (Princeton)
- Blanton et al. (2003) Blanton, M. R., Hogg, D. W., Bahcall, N. A., Brinkmann, J., Britton, M., Connolly, A. J., Csabai, I., Fukugita, M., Loveday, J., Meiksin, A., Munn, J. A., Nichol, R. C., Okamura, S., Quinn, T., Schneider, D. P., Shimasaku, K., Strauss, M. A., Tegmark, M., Vogeley, M. S., & Weinberg, D. H. 2003, Astrophysical Journal, 592, 819
- Bournaud et al. (2007) Bournaud, F., Jog, C. J., & Combes, F. 2007, Astronomy and Astrophysics, 476, 1179
- Bower et al. (1992) Bower, R. G., Lucey, J. R., & Ellis, R. S. 1992, Monthly Notices of the Royal Astronomical Society, 254, 589
- Boylan-Kolchin et al. (2006) Boylan-Kolchin, M., Ma, C., & Quataert, E. 2006, Monthly Notices of the Royal Astronomical Society, 369, 1081
- Chang et al. (2006) Chang, R., Gallazzi, A., Kauffmann, G., Charlot, S., Ivezic, Z., Brinchmann, J., & Heckman, T. M. 2006, Monthly Notices of the Royal Astronomical Society, 366, 717
- Colbert et al. (2001) Colbert, J. W., Mulchaey, J. S., & Zabludoff, A. I. 2001, Astronomical Journal, 121, 808
- Combes et al. (1995) Combes, F., Rampazzo, R., Bonfanti, P. P., Pringniel, P., & Sulentic, J. W. 1995, Astronomy and Astrophysics, 297, 37
- Condon et al. (1998) Condon, J. J., Cotton, W. D., Greisen, E. W., Yin, Q. F., Perley, R. A., Taylor, G. B., & Broderick, J. J. 1998, Astronomical Journal, 115, 1693
- Croton et al. (2006) Croton, D. J., Springel, V., White, S. D. M., Lucia, G. D., Frenk, C. S., Gao, L., Jenkins, A., Kauffmann, G., Navarro, J. F., & Yoshida, N. 2006, Monthly Notices of the Royal Astronomical Society, 365, 11
- de Vaucouleurs et al. (1991) de Vaucouleurs, G., de Vaucouleurs, A., Corwin, H. G., Buta, R. J., Paturel, G., & Fouque, P. 1991, Third Reference Catalogue of Bright Galaxies (Springer-Verlag Berlin Heidelberg New York)
- Dekel & Birnboim (2008) Dekel, A., & Birnboim, Y. 2008, Monthly Notices of the Royal Astronomical Society, 383, 119
- Dixon (1970) Dixon, R. S. 1970, Astrophysical Journal Supplement Series, 20, 1
- Dupraz & Combes (1986) Dupraz, C., & Combes, F. 1986, Astronomy and Astrophysics, 166, 53
- Feldmann et al. (2008) Feldmann, R., Mayer, L., & Carollo, C. M. 2008, Astrophysical Journal, 684, 1062
- Frogel et al. (1978) Frogel, J. A., Persson, S. E., Matthews, K., & Aaronson, M. 1978, Astrophysical Journal, 220, 75
- Gregory et al. (1996) Gregory, P. C., Scott, W. K., Douglas, K., & Condon, J. J. 1996, Astrophysical Journal Supplement Series, 103, 427
- Heckman et al. (1986) Heckman, T. M., Smith, E. P., Baum, S. A., van Breugel, W. J. M., Miley, G. K., Illingworth, G. D., Bothun, G. D., & Balick, B. 1986, Astrophysical Journal, 311, 526
- Hernquist (1990) Hernquist, L. 1990, Astrophysical Journal, 356, 359
- Kauffmann (1996) Kauffmann, G. 1996, Monthly Notices of the Royal Astronomical Society, 281, 487
- Kauffmann & Charlot (1998) Kauffmann, G., & Charlot, S. 1998, Monthly Notices of the Royal Astronomical Society, 297, L23
- Kauffmann et al. (1993) Kauffmann, G., White, S. D. M., & Guiderdoni, B. 1993, Monthly Notices of the Royal Astronomical Society, 264, 201
- Kenney et al. (2008) Kenney, J. D. P., Tal, T., Crowl, H. H., Feldmeier, J., & Jacoby, G. H. 2008, Astrophysical Journal, 687, L69
- Knapp et al. (1985) Knapp, G. R., Turner, E. L., & Cunniffe, P. E. 1985, Astronomical Journal, 90, 454
- Kormendy (1984) Kormendy, J. 1984, Astrophysical Journal, 287, 577
- Makino & Hut (1997) Makino, J., & Hut, P. 1997, Astrophysical Journal, 481, 83
- McIntosh et al. (2008) McIntosh, D. H., Guo, Y., Hertzberg, J., Katz, N., Mo, H. J., van den Bosch, F. C., & Yang, X. 2008, Monthly Notices of the Royal Astronomical Society, 388, 1537
- Michard (2005) Michard, R. 2005, Astronomy and Astrophysics, 441, 451
- Moore et al. (1996) Moore, B., Katz, N., Lake, G., Dressler, A., & Oemler, A. 1996, Nature, 379, 613
- Moore et al. (1998) Moore, B., Lake, G., & Katz, N. 1998, Astrophysical Journal, 495, 139
- Naab et al. (2007) Naab, T., Johansson, P. H., Ostriker, J. P., & Efstathiou, G. 2007, Astrophysical Journal, 658, 710
- Naab et al. (2006) Naab, T., Khochfar, S., & Burkert, A. 2006, Astrophysical Journal, 636, L81
- Navarro et al. (1997) Navarro, J. F., Frenk, C. S., & White, S. D. M. 1997, Astrophysical Journal, 490, 493
- Patton et al. (2000) Patton, D. R., Carlberg, R. G., Marzke, R. O., Pritchet, C. J., da Costa, L. N., & Pellegrini, P. S. 2000, Astrophysical Journal, 536, 153
- Prugniel & Heraudeau (1998) Prugniel, P., & Heraudeau, P. 1998, VizieR Online Data Catalog, 7206, 0
- Sadler (2001) Sadler, E. M. 2001, in Gas and Galaxy Evolution, Vol. 240, 445
- Sandage & Visvanathan (1978) Sandage, A., & Visvanathan, N. 1978, Astrophysical Journal, 223, 707
- Sanders (1980) Sanders, R. H. 1980, Astrophysical Journal, 242, 931
- Schlegel et al. (1998) Schlegel, D. J., Finkbeiner, D. P., & Davis, M. 1998, Astrophysical Journal, 500, 525
- Schweizer & Seitzer (1992) Schweizer, F., & Seitzer, P. 1992, Astronomical Journal, 104, 1039
- Shabala et al. (2008) Shabala, S. S., Ash, S., Alexander, P., & Riley, J. M. 2008, Monthly Notices of the Royal Astronomical Society, 388, 625
- Shioya & Bekki (1998) Shioya, Y., & Bekki, K. 1998, Astrophysical Journal, 504, 42
- Smith & Heckman (1989) Smith, E. P., & Heckman, T. M. 1989, Astrophysical Journal, 341, 658
- Tully (1988) Tully, R. B. 1988, Nearby galaxies catalog (Cambridge and New York, Cambridge University Press), 221
- van Dokkum (2005) van Dokkum, P. G. 2005, Astronomical Journal, 130, 2647
- van Dokkum et al. (1999) van Dokkum, P. G., Franx, M., Fabricant, D., Kelson, D. D., & Illingworth, G. D. 1999, Astrophysical Journal, 520, L95
- van Dokkum et al. (1998) van Dokkum, P. G., Franx, M., Kelson, D. D., Illingworth, G. D., Fisher, D., & Fabricant, D. 1998, Astrophysical Journal, 500, 714
- Visvanathan & Sandage (1977) Visvanathan, N., & Sandage, A. 1977, Astrophysical Journal, 216, 214
- Whitaker & van Dokkum (2008) Whitaker, K. E., & van Dokkum, P. G. 2008, Astrophysical Journal, 676, L105
- White & Becker (1992) White, R. L., & Becker, R. H. 1992, Astrophysical Journal Supplement Series, 79, 331
- White et al. (1997) White, R. L., Becker, R. H., Helfand, D. J., & Gregg, M. D. 1997, Astrophysical Journal, 475, 479
- White & Frenk (1991) White, S. D. M., & Frenk, C. S. 1991, Astrophysical Journal, 379, 52